structural analysis along a highway rock exposure: the ... · structural analysis along a highway...
TRANSCRIPT
STRUCTURAL ANALYSIS ALONG A HIGHWAY ROCK EXPOSURE: THE FLEURIMONT ROAD CUT M. Grenon Université Laval, Québec, QC, Canada, [email protected] G. Mellies and J. Hadjigeorgiou Université Laval, Québec, QC, Canada RÉSUMÉ Cet article présente les résultats de l’analyse de la stabilité de dièdres rocheux dans une paroi rocheuse excavée le long d’une route au Québec. Lors de la réalisation des travaux d’excavation, des instabilités en dièdre ont été observées. Récemment, suite à la collecte de données structurales sur le terrain, des analyses par la méthode des équilibres limites ont été réalisées. Le travail a été poussé plus loin pour explorer le potentiel de la modélisation des systèmes de fractures, et conséquemment d’une représentation plus réaliste des conditions structurales, sur l’analyse de la stabilité. Les variations dans les résultats ont été interprétées en fonction des observations de terrain. ABSTRACT This paper presents the results of a rock wedge stability investigation along a highway cut in Québec. Following reported instabilities, a rock engineering investigation was launched, which involved the collection of structural data and subsequent limit equilibrium analysis. The investigation was extended to explore the potential of fracture system modelling thus leading to a more realistic analysis. The results of the stability analysis were interpreted with reference to site observations. 1. INTRODUCTION When the construction of highways requires cutting through rock it is necessary to ensure the stability of road cuts both during construction and long term. After all, these road cuts will be exposed to seasonal weather changes that will invariably result in weathering and degradation of rock mass quality. The analysis of the stability of rock slopes makes uses of an array of tools. Although limit equilibrium analyses have been used on a routine basis since a long time, recent years have seen the introduction of computer tools that employ more complex techniques to represent and analyse slopes. The present paper reports on a road cut in Québec where wedge instability was an issue during construction. This necessitated the removal of potentially unstable wedges. The stability of the road cut was re-analysed recently by using different data representation techniques and using tools of varying complexity. 2. FLEURIMONT ROAD CUT
2.1 Location In 1986, during the construction of Highway 610 in southern Québec, it was necessary to drill and blast in order to ensure the desired highway alignment. Of interest to this investigation is a road cut located in the Eastern Township region near Fleurimont, Québec. This rock slope is situated along the northern side of Highway 610 between km 1 and 2. Specifically the site is at N 45° 26.412′ and W 71° 56.107′ with an error of ± 12m and at an elevation of 143m above sea level. The rock exposure faces south. The area in front
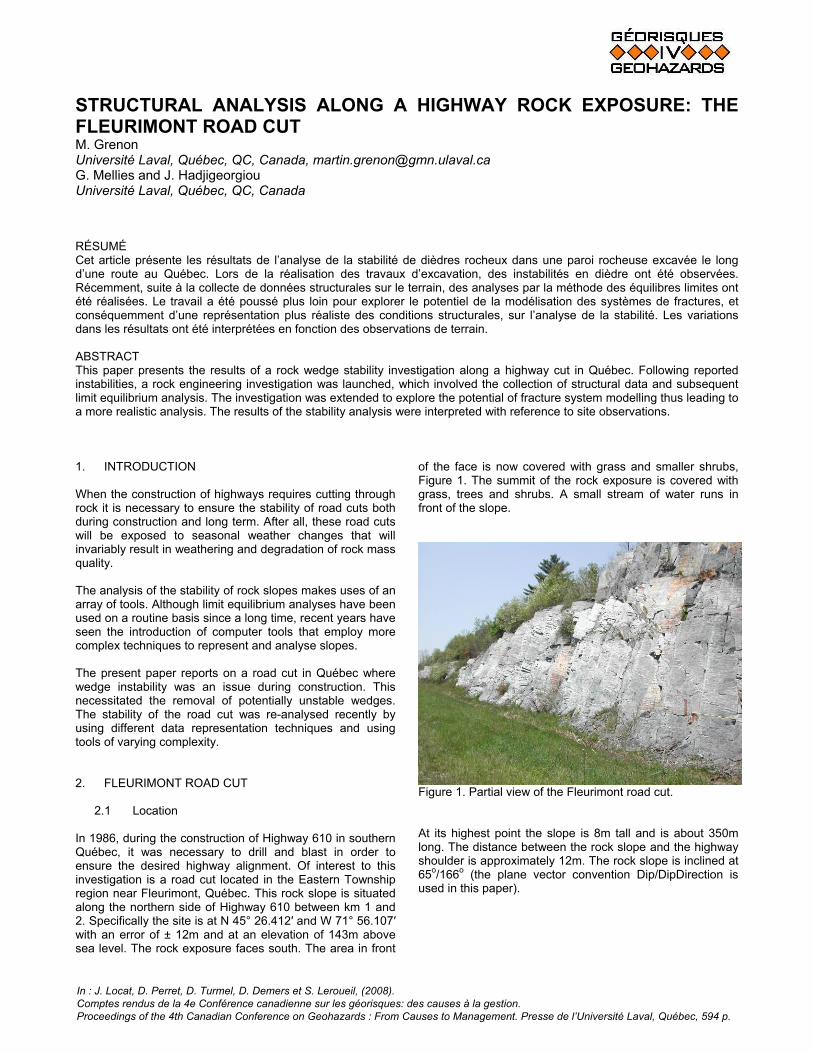
of the face is now covered with grass and smaller shrubs, Figure 1. The summit of the rock exposure is covered with grass, trees and shrubs. A small stream of water runs in front of the slope.
Figure 1. Partial view of the Fleurimont road cut. At its highest point the slope is 8m tall and is about 350m long. The distance between the rock slope and the highway shoulder is approximately 12m. The rock slope is inclined at 65o/166o (the plane vector convention Dip/DipDirection is used in this paper).
In : J. Locat, D. Perret, D. Turmel, D. Demers et S. Leroueil, (2008). Comptes rendus de la 4e Conférence canadienne sur les géorisques: des causes à la gestion. Proceedings of the 4th Canadian Conference on Geohazards : From Causes to Management. Presse de l’Université Laval, Québec, 594 p.
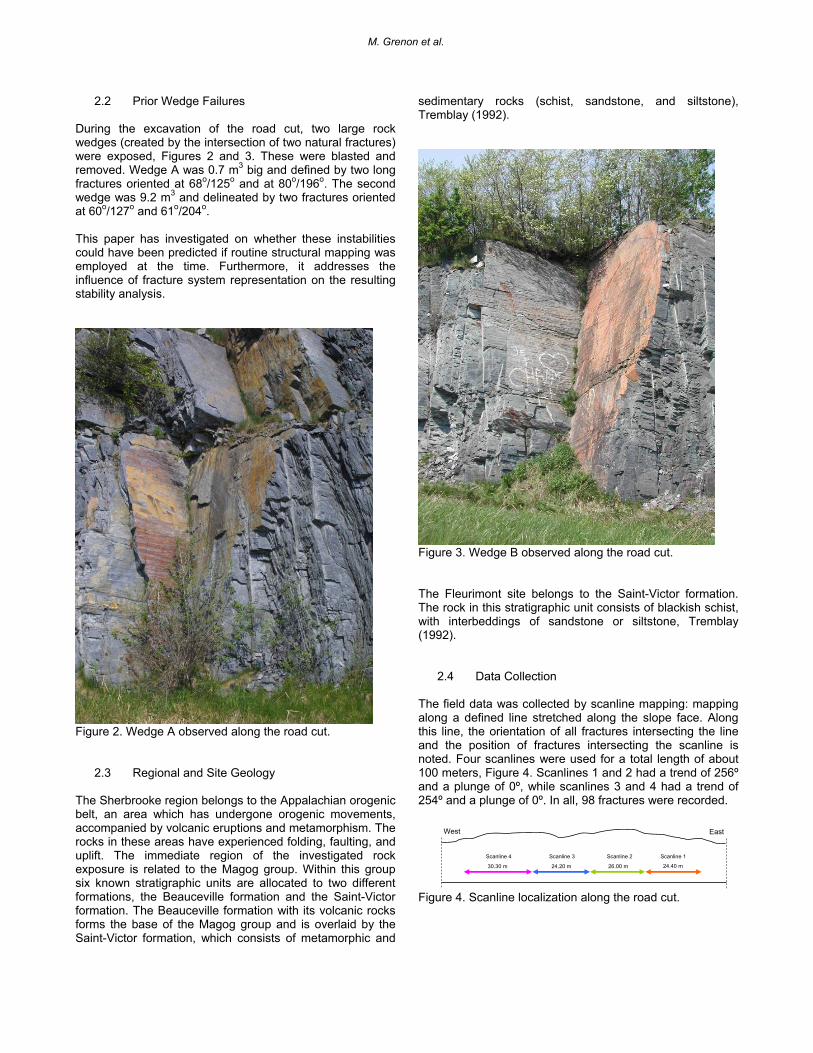
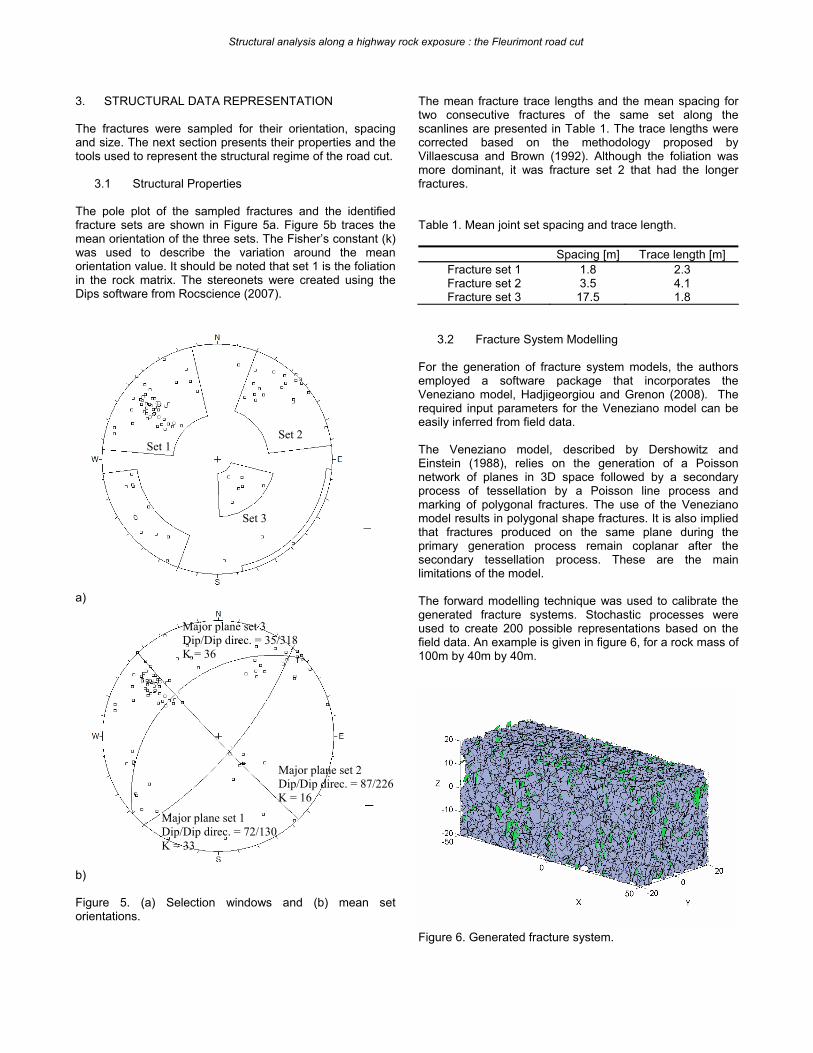
2.2 Prior Wedge Failures During the excavation of the road cut, two large rock wedges (created by the intersection of two natural fractures) were exposed, Figures 2 and 3. These were blasted and removed. Wedge A was 0.7 m3 big and defined by two long fractures oriented at 68o/125o and at 80o/196o. The second wedge was 9.2 m3 and delineated by two fractures oriented at 60o/127o and 61o/204o. This paper has investigated on whether these instabilities could have been predicted if routine structural mapping was employed at the time. Furthermore, it addresses the influence of fracture system representation on the resulting stability analysis.
Figure 2. Wedge A observed along the road cut.
2.3 Regional and Site Geology The Sherbrooke region belongs to the Appalachian orogenic belt, an area which has undergone orogenic movements, accompanied by volcanic eruptions and metamorphism. The rocks in these areas have experienced folding, faulting, and uplift. The immediate region of the investigated rock exposure is related to the Magog group. Within this group six known stratigraphic units are allocated to two different formations, the Beauceville formation and the Saint-Victor formation. The Beauceville formation with its volcanic rocks forms the base of the Magog group and is overlaid by the Saint-Victor formation, which consists of metamorphic and
sedimentary rocks (schist, sandstone, and siltstone), Tremblay (1992).
Figure 3. Wedge B observed along the road cut. The Fleurimont site belongs to the Saint-Victor formation. The rock in this stratigraphic unit consists of blackish schist, with interbeddings of sandstone or siltstone, Tremblay (1992).
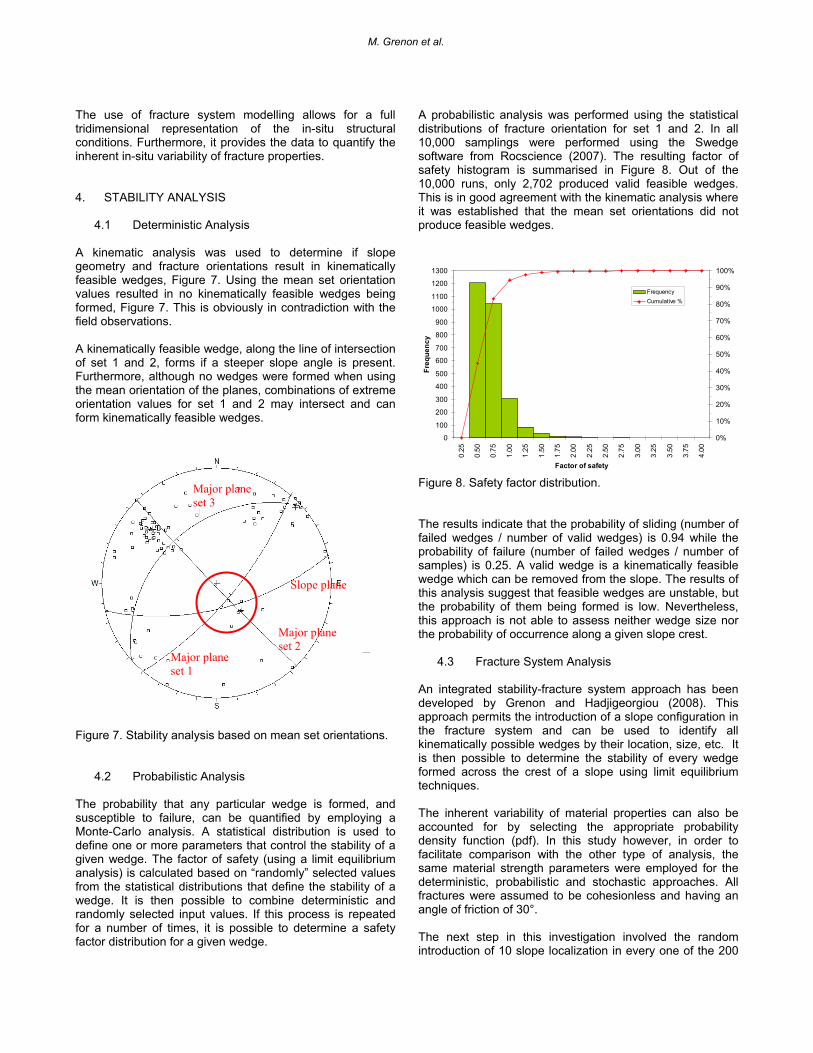
2.4 Data Collection The field data was collected by scanline mapping: mapping along a defined line stretched along the slope face. Along this line, the orientation of all fractures intersecting the line and the position of fractures intersecting the scanline is noted. Four scanlines were used for a total length of about 100 meters, Figure 4. Scanlines 1 and 2 had a trend of 256º and a plunge of 0º, while scanlines 3 and 4 had a trend of 254º and a plunge of 0º. In all, 98 fractures were recorded.
Scanline 1Scanline 2Scanline 3Scanline 4
30.30 m 24.20 m 26.00 m 24.40 m
EastWest
Figure 4. Scanline localization along the road cut.
M. Grenon et al.
3. STRUCTURAL DATA REPRESENTATION The fractures were sampled for their orientation, spacing and size. The next section presents their properties and the tools used to represent the structural regime of the road cut.
3.1 Structural Properties
The pole plot of the sampled fractures and the identified fracture sets are shown in Figure 5a. Figure 5b traces the mean orientation of the three sets. The Fisher’s constant (k) was used to describe the variation around the mean orientation value. It should be noted that set 1 is the foliation in the rock matrix. The stereonets were created using the Dips software from Rocscience (2007).
a)
b) Figure 5. (a) Selection windows and (b) mean set orientations.
The mean fracture trace lengths and the mean spacing for two consecutive fractures of the same set along the scanlines are presented in Table 1. The trace lengths were corrected based on the methodology proposed by Villaescusa and Brown (1992). Although the foliation was more dominant, it was fracture set 2 that had the longer fractures. Table 1. Mean joint set spacing and trace length.
Spacing [m] Trace length [m] Fracture set 1 1.8 2.3 Fracture set 2 3.5 4.1 Fracture set 3 17.5 1.8
3.2 Fracture System Modelling For the generation of fracture system models, the authors employed a software package that incorporates the Veneziano model, Hadjigeorgiou and Grenon (2008). The required input parameters for the Veneziano model can be easily inferred from field data.
Set 2 Set 1 The Veneziano model, described by Dershowitz and
Einstein (1988), relies on the generation of a Poisson network of planes in 3D space followed by a secondary process of tessellation by a Poisson line process and marking of polygonal fractures. The use of the Veneziano model results in polygonal shape fractures. It is also implied that fractures produced on the same plane during the primary generation process remain coplanar after the secondary tessellation process. These are the main limitations of the model.
Set 3
The forward modelling technique was used to calibrate the generated fracture systems. Stochastic processes were used to create 200 possible representations based on the field data. An example is given in figure 6, for a rock mass of 100m by 40m by 40m.
Major plane set 3 Dip/Dip direc. = 35/318 K = 36
Major plane set 2 Dip/Dip direc. = 87/226 K = 16
Major plane set 1 Dip/Dip direc. = 72/130 K = 33
Figure 6. Generated fracture system.
Structural analysis along a highway rock exposure : the Fleurimont road cut
The use of fracture system modelling allows for a full tridimensional representation of the in-situ structural conditions. Furthermore, it provides the data to quantify the inherent in-situ variability of fracture properties. 4. STABILITY ANALYSIS
4.1 Deterministic Analysis A kinematic analysis was used to determine if slope geometry and fracture orientations result in kinematically feasible wedges, Figure 7. Using the mean set orientation values resulted in no kinematically feasible wedges being formed, Figure 7. This is obviously in contradiction with the field observations. A kinematically feasible wedge, along the line of intersection of set 1 and 2, forms if a steeper slope angle is present. Furthermore, although no wedges were formed when using the mean orientation of the planes, combinations of extreme orientation values for set 1 and 2 may intersect and can form kinematically feasible wedges.
Figure 7. Stability analysis based on mean set orientations.
4.2 Probabilistic Analysis The probability that any particular wedge is formed, and susceptible to failure, can be quantified by employing a Monte-Carlo analysis. A statistical distribution is used to define one or more parameters that control the stability of a given wedge. The factor of safety (using a limit equilibrium analysis) is calculated based on “randomly” selected values from the statistical distributions that define the stability of a wedge. It is then possible to combine deterministic and randomly selected input values. If this process is repeated for a number of times, it is possible to determine a safety factor distribution for a given wedge.
A probabilistic analysis was performed using the statistical distributions of fracture orientation for set 1 and 2. In all 10,000 samplings were performed using the Swedge software from Rocscience (2007). The resulting factor of safety histogram is summarised in Figure 8. Out of the 10,000 runs, only 2,702 produced valid feasible wedges. This is in good agreement with the kinematic analysis where it was established that the mean set orientations did not produce feasible wedges.
0
100
200
300
400
500
600
700
800
900
1000
1100
1200
1300
0.25
0.50
0.75
1.00
1.25
1.50
1.75
2.00
2.25
2.50
2.75
3.00
3.25
3.50
3.75
4.00
Factor of safety
Freq
uenc
y0%
10%
20%
30%
40%
50%
60%
70%
80%
90%
100%
FrequencyCumulative %
Figure 8. Safety factor distribution. Major plane
set 3 The results indicate that the probability of sliding (number of failed wedges / number of valid wedges) is 0.94 while the probability of failure (number of failed wedges / number of samples) is 0.25. A valid wedge is a kinematically feasible wedge which can be removed from the slope. The results of this analysis suggest that feasible wedges are unstable, but the probability of them being formed is low. Nevertheless, this approach is not able to assess neither wedge size nor the probability of occurrence along a given slope crest.
Slope plane
Major plane set 2
Major plane set 1
4.3 Fracture System Analysis An integrated stability-fracture system approach has been developed by Grenon and Hadjigeorgiou (2008). This approach permits the introduction of a slope configuration in the fracture system and can be used to identify all kinematically possible wedges by their location, size, etc. It is then possible to determine the stability of every wedge formed across the crest of a slope using limit equilibrium techniques. The inherent variability of material properties can also be accounted for by selecting the appropriate probability density function (pdf). In this study however, in order to facilitate comparison with the other type of analysis, the same material strength parameters were employed for the deterministic, probabilistic and stochastic approaches. All fractures were assumed to be cohesionless and having an angle of friction of 30°. The next step in this investigation involved the random introduction of 10 slope localization in every one of the 200
M. Grenon et al.
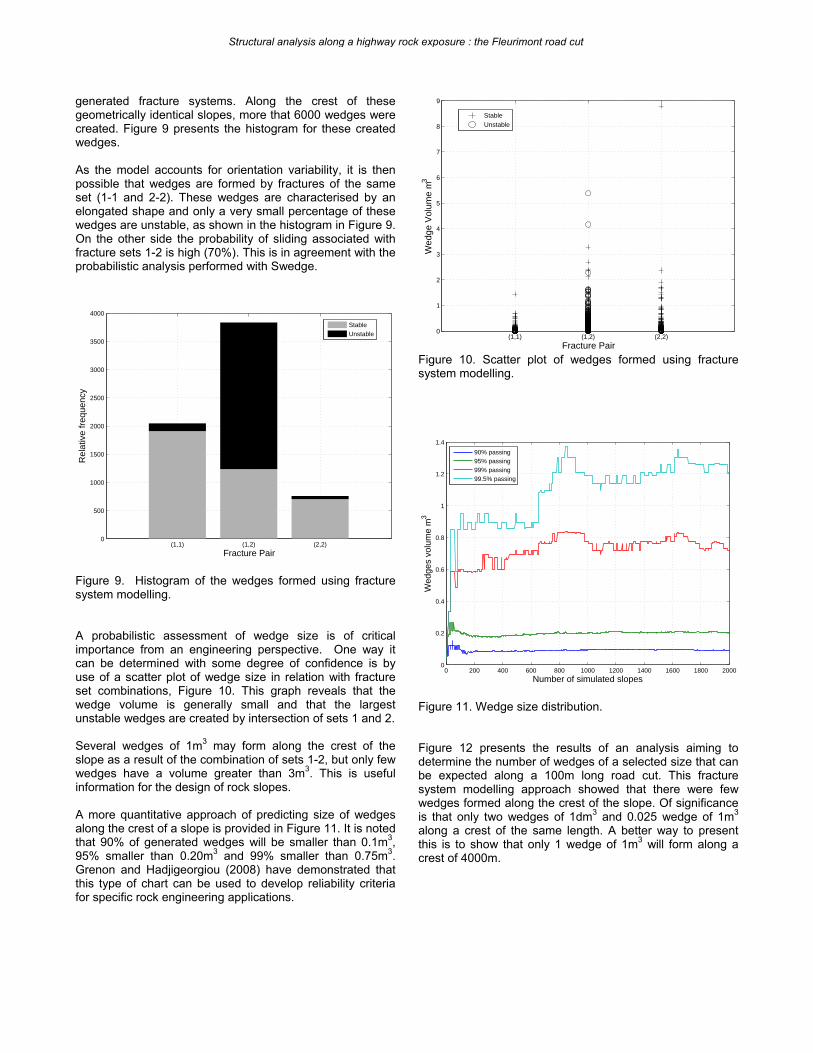
generated fracture systems. Along the crest of these geometrically identical slopes, more that 6000 wedges were created. Figure 9 presents the histogram for these created wedges. As the model accounts for orientation variability, it is then possible that wedges are formed by fractures of the same set (1-1 and 2-2). These wedges are characterised by an elongated shape and only a very small percentage of these wedges are unstable, as shown in the histogram in Figure 9. On the other side the probability of sliding associated with fracture sets 1-2 is high (70%). This is in agreement with the probabilistic analysis performed with Swedge.
(1,1) (1,2) (2,2)0
500
1000
1500
2000
2500
3000
3500
4000
Fracture Pair
Rel
ativ
e fr
eque
ncy
StableUnstable
Figure 9. Histogram of the wedges formed using fracture system modelling. A probabilistic assessment of wedge size is of critical importance from an engineering perspective. One way it can be determined with some degree of confidence is by use of a scatter plot of wedge size in relation with fracture set combinations, Figure 10. This graph reveals that the wedge volume is generally small and that the largest unstable wedges are created by intersection of sets 1 and 2. Several wedges of 1m3 may form along the crest of the slope as a result of the combination of sets 1-2, but only few wedges have a volume greater than 3m3. This is useful information for the design of rock slopes. A more quantitative approach of predicting size of wedges along the crest of a slope is provided in Figure 11. It is noted that 90% of generated wedges will be smaller than 0.1m3, 95% smaller than 0.20m3 and 99% smaller than 0.75m3. Grenon and Hadjigeorgiou (2008) have demonstrated that this type of chart can be used to develop reliability criteria for specific rock engineering applications.
(1,1) (1,2) (2,2)0
1
2
3
4
5
6
7
8
9
Fracture Pair
Wed
ge V
olum
e m
3
StableUnstable
Figure 10. Scatter plot of wedges formed using fracture system modelling.
0 200 400 600 800 1000 1200 1400 1600 1800 20000
0.2
0.4
0.6
0.8
1
1.2
1.4
Number of simulated slopes
Wed
ges
volu
me
m3
90% passing95% passing99% passing99.5% passing
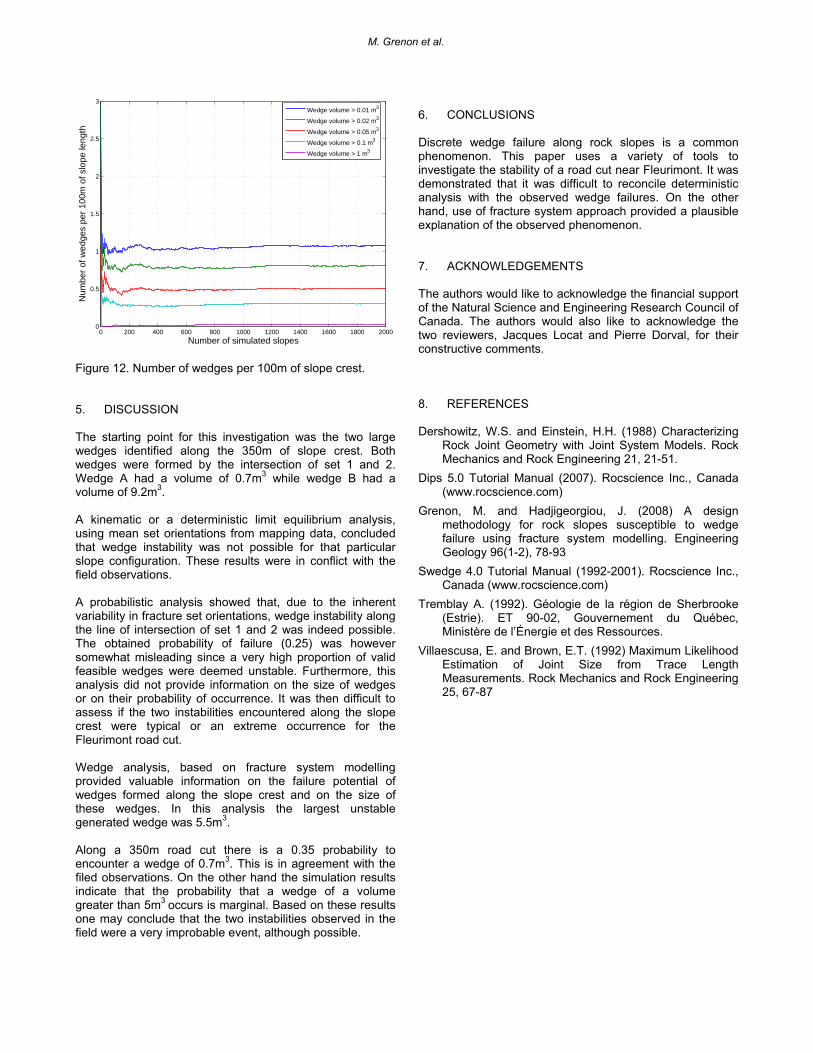
Figure 11. Wedge size distribution. Figure 12 presents the results of an analysis aiming to determine the number of wedges of a selected size that can be expected along a 100m long road cut. This fracture system modelling approach showed that there were few wedges formed along the crest of the slope. Of significance is that only two wedges of 1dm3 and 0.025 wedge of 1m3 along a crest of the same length. A better way to present this is to show that only 1 wedge of 1m3 will form along a crest of 4000m.
Structural analysis along a highway rock exposure : the Fleurimont road cut
0 200 400 600 800 1000 1200 1400 1600 1800 20000
0.5
1
1.5
2
2.5
3
Number of simulated slopes
Num
ber
of w
edge
s pe
r 10
0m o
f slo
pe le
ngth
Wedge volume > 0.01 m3
Wedge volume > 0.02 m3
Wedge volume > 0.05 m3
Wedge volume > 0.1 m3
Wedge volume > 1 m3
Figure 12. Number of wedges per 100m of slope crest. 5. DISCUSSION The starting point for this investigation was the two large wedges identified along the 350m of slope crest. Both wedges were formed by the intersection of set 1 and 2. Wedge A had a volume of 0.7m3 while wedge B had a volume of 9.2m3. A kinematic or a deterministic limit equilibrium analysis, using mean set orientations from mapping data, concluded that wedge instability was not possible for that particular slope configuration. These results were in conflict with the field observations. A probabilistic analysis showed that, due to the inherent variability in fracture set orientations, wedge instability along the line of intersection of set 1 and 2 was indeed possible. The obtained probability of failure (0.25) was however somewhat misleading since a very high proportion of valid feasible wedges were deemed unstable. Furthermore, this analysis did not provide information on the size of wedges or on their probability of occurrence. It was then difficult to assess if the two instabilities encountered along the slope crest were typical or an extreme occurrence for the Fleurimont road cut. Wedge analysis, based on fracture system modelling provided valuable information on the failure potential of wedges formed along the slope crest and on the size of these wedges. In this analysis the largest unstable generated wedge was 5.5m3. Along a 350m road cut there is a 0.35 probability to encounter a wedge of 0.7m3. This is in agreement with the filed observations. On the other hand the simulation results indicate that the probability that a wedge of a volume greater than 5m3 occurs is marginal. Based on these results one may conclude that the two instabilities observed in the field were a very improbable event, although possible.
6. CONCLUSIONS Discrete wedge failure along rock slopes is a common phenomenon. This paper uses a variety of tools to investigate the stability of a road cut near Fleurimont. It was demonstrated that it was difficult to reconcile deterministic analysis with the observed wedge failures. On the other hand, use of fracture system approach provided a plausible explanation of the observed phenomenon. 7. ACKNOWLEDGEMENTS The authors would like to acknowledge the financial support of the Natural Science and Engineering Research Council of Canada. The authors would also like to acknowledge the two reviewers, Jacques Locat and Pierre Dorval, for their constructive comments. 8. REFERENCES Dershowitz, W.S. and Einstein, H.H. (1988) Characterizing
Rock Joint Geometry with Joint System Models. Rock Mechanics and Rock Engineering 21, 21-51.
Dips 5.0 Tutorial Manual (2007). Rocscience Inc., Canada (www.rocscience.com)
Grenon, M. and Hadjigeorgiou, J. (2008) A design methodology for rock slopes susceptible to wedge failure using fracture system modelling. Engineering Geology 96(1-2), 78-93
Swedge 4.0 Tutorial Manual (1992-2001). Rocscience Inc., Canada (www.rocscience.com)
Tremblay A. (1992). Géologie de la région de Sherbrooke (Estrie). ET 90-02, Gouvernement du Québec, Ministère de l’Énergie et des Ressources.
Villaescusa, E. and Brown, E.T. (1992) Maximum Likelihood Estimation of Joint Size from Trace Length Measurements. Rock Mechanics and Rock Engineering 25, 67-87
M. Grenon et al.