streaming business analytics move to real time...
TRANSCRIPT
Streaming Business Analytics
Move To Real Time Enterprise: The Power of Data
박장섭 부장 제조/하이테크 솔루션 담당 Microsoft Korea

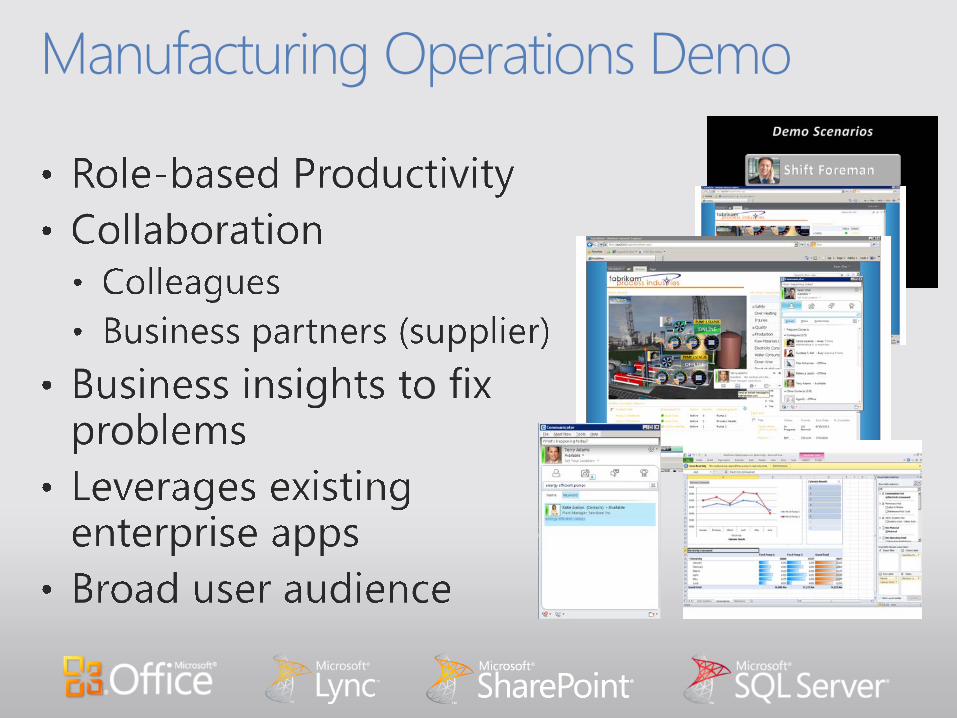
Manufacturing Operations Demo
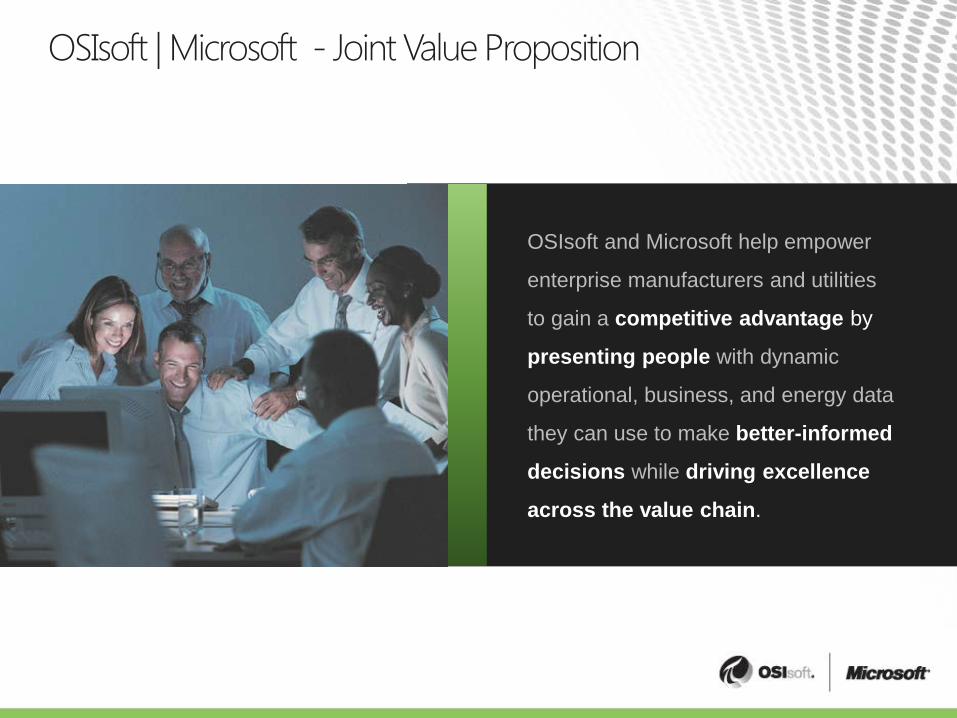
OSIsoft | Microsoft - Joint Value Proposition
OSIsoft and Microsoft help empower
enterprise manufacturers and utilities
to gain a competitive advantage by
presenting people with dynamic
operational, business, and energy data
they can use to make better-informed
decisions while driving excellence
across the value chain.
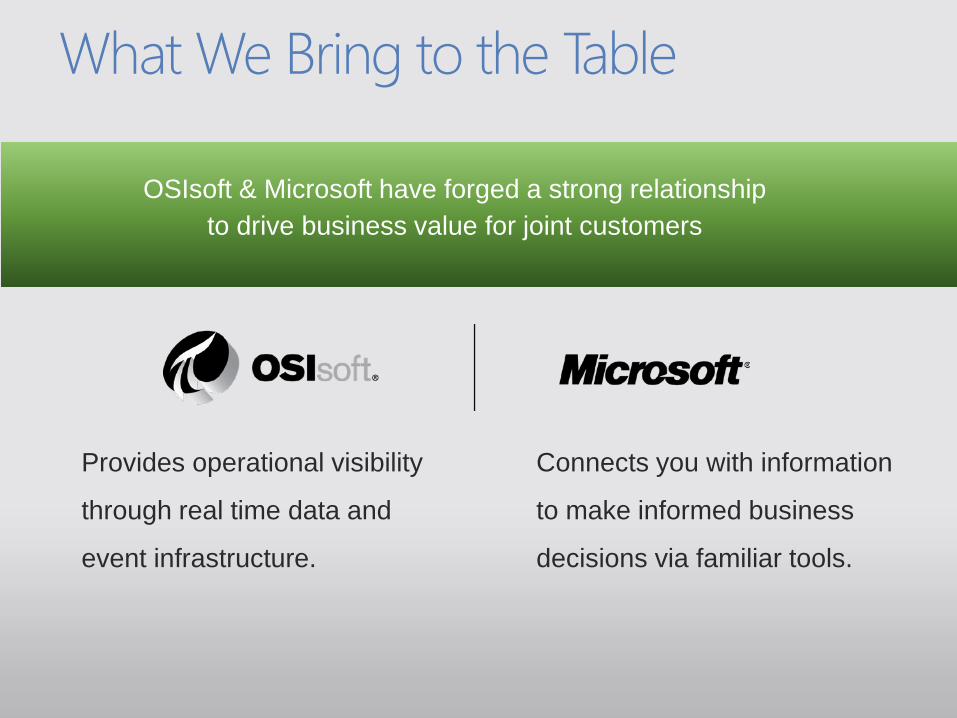
What We Bring to the Table
OSIsoft & Microsoft have forged a strong relationship to drive business value for joint customers
Provides operational visibility
through real time data and
event infrastructure.
Connects you with information
to make informed business
decisions via familiar tools.
5
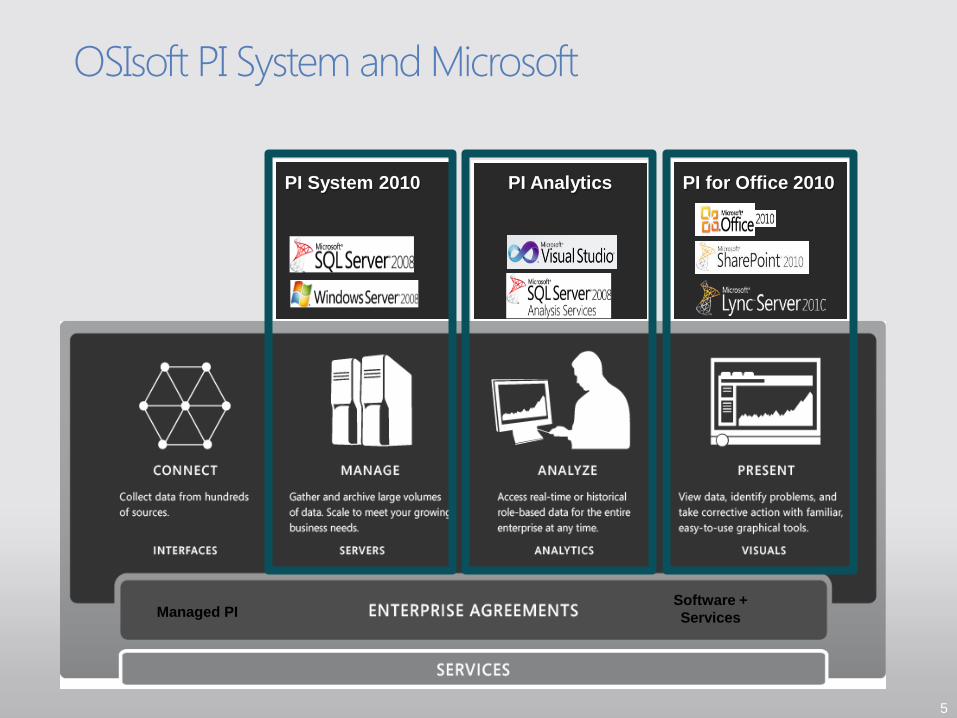
OSIsoft PI System and Microsoft
PI System 2010 PI Analytics PI for Office 2010
Managed PI Software + Services
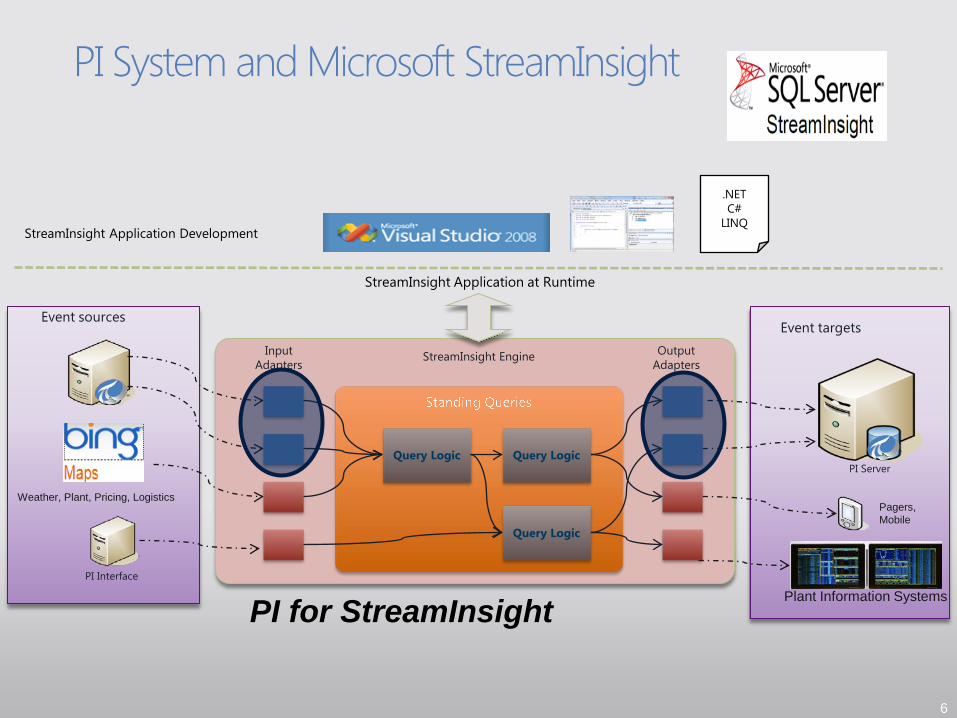
PI System and Microsoft StreamInsight
6
Query Logic
Event sources Event targets
PI Server
StreamInsight Application at Runtime
.NET C#
LINQ StreamInsight Application Development
Input Adapters
Output Adapters
StreamInsight Engine
Query Logic
Query Logic
PI Interface
PI for StreamInsight
Weather, Plant, Pricing, Logistics
Plant Information Systems
Pagers, Mobile
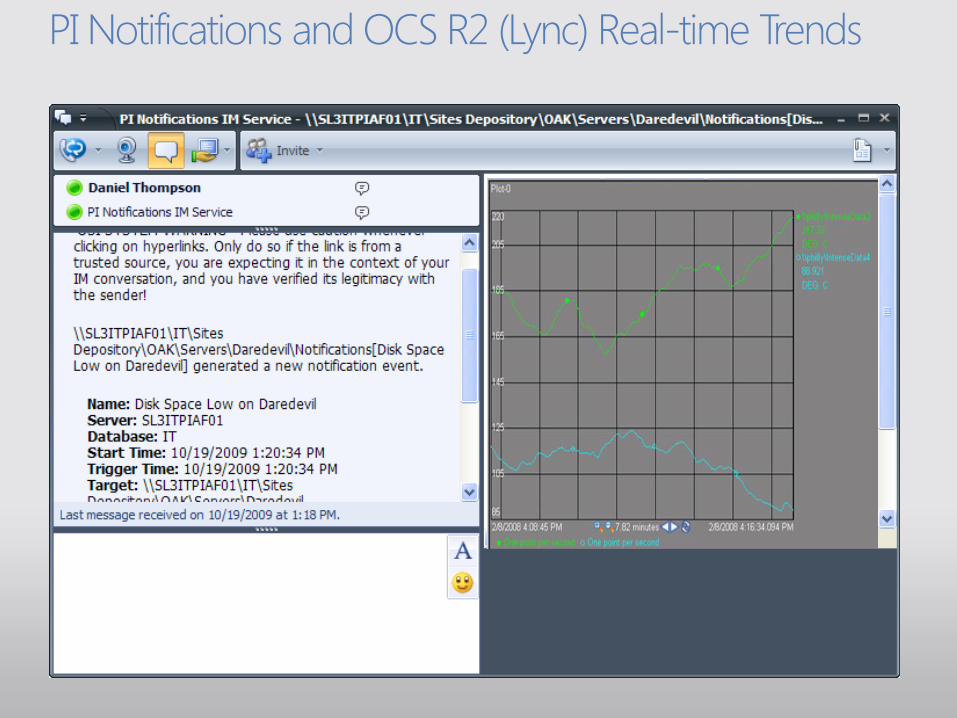
PI Notifications and OCS R2 (Lync) Real-time Trends
8
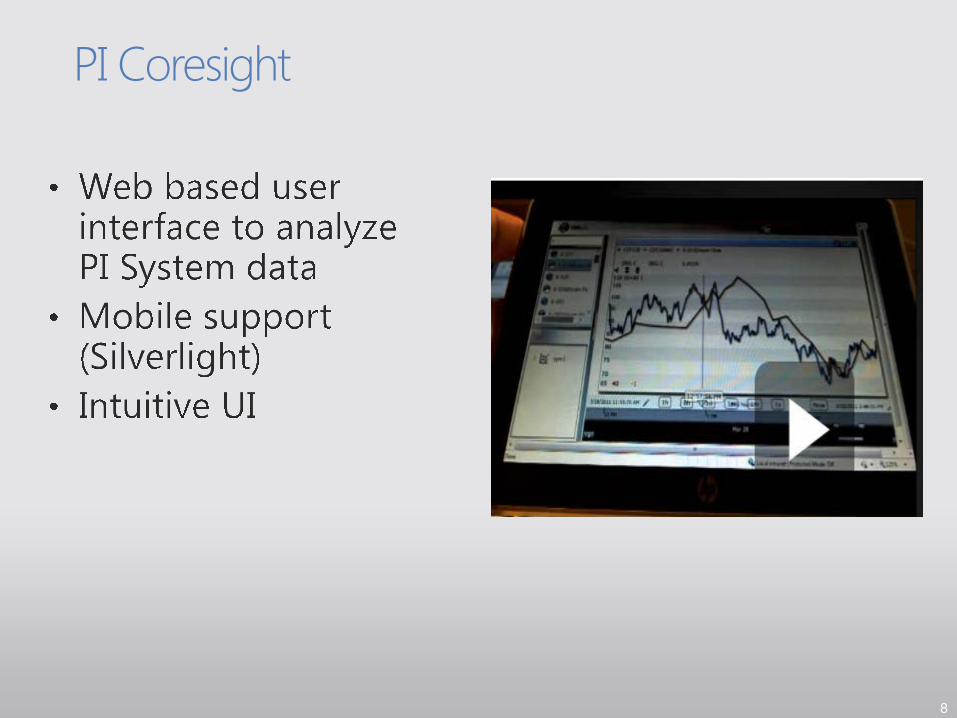
PI Coresight
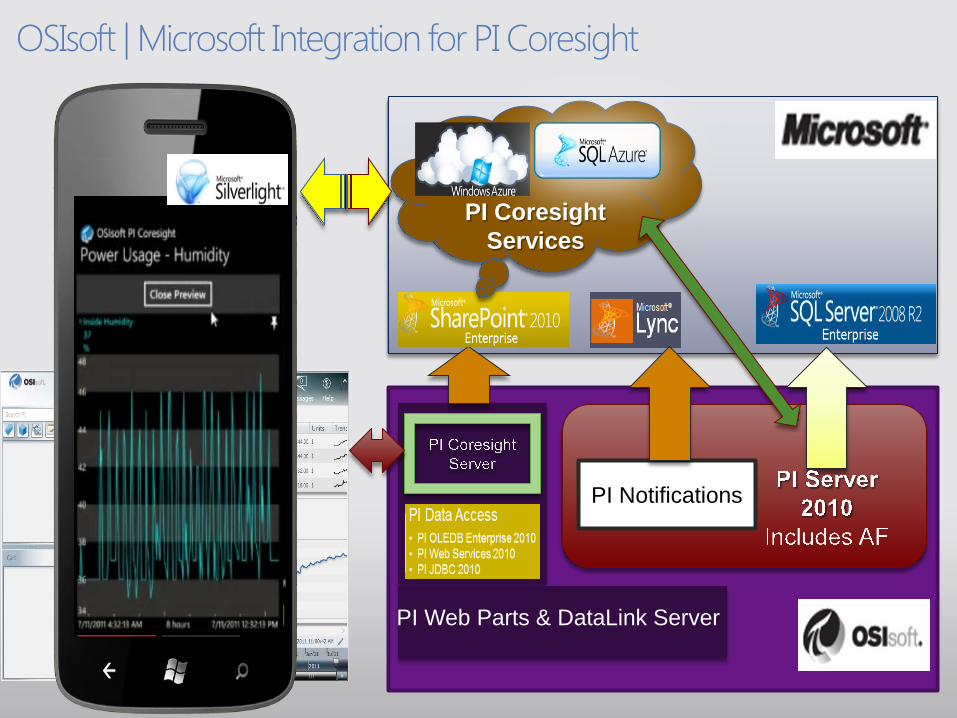
OSIsoft | Microsoft Integration for PI Coresight
PI Notifications
PI Web Parts & DataLink Server
PI Coresight Services
10
Microsoft Confidential
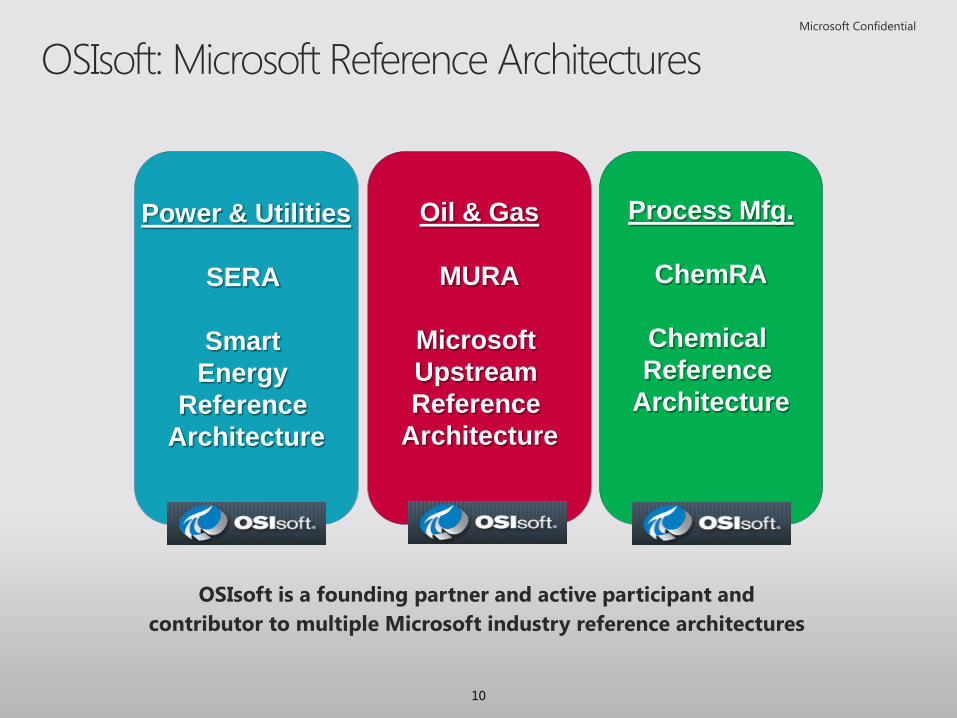
OSIsoft: Microsoft Reference Architectures
Power & Utilities
SERA
Smart Energy
Reference Architecture
Oil & Gas
MURA
Microsoft Upstream Reference
Architecture
Process Mfg.
ChemRA
Chemical Reference
Architecture
OSIsoft is a founding partner and active participant and contributor to multiple Microsoft industry reference architectures
11
Microsoft Confidential
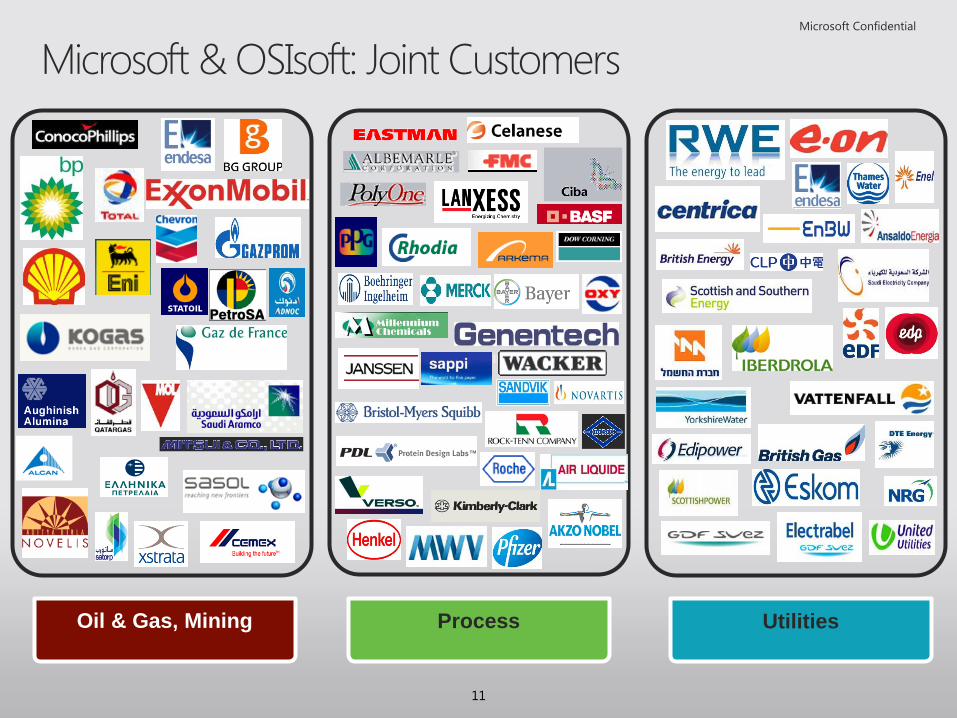
Microsoft & OSIsoft: Joint Customers
Oil & Gas, Mining Process Utilities
Presented by
Business Analytics with Microsoft SQL Server 2012 and PI System data Using Microsoft PowerPivot and Power View
JangSeop Park
13
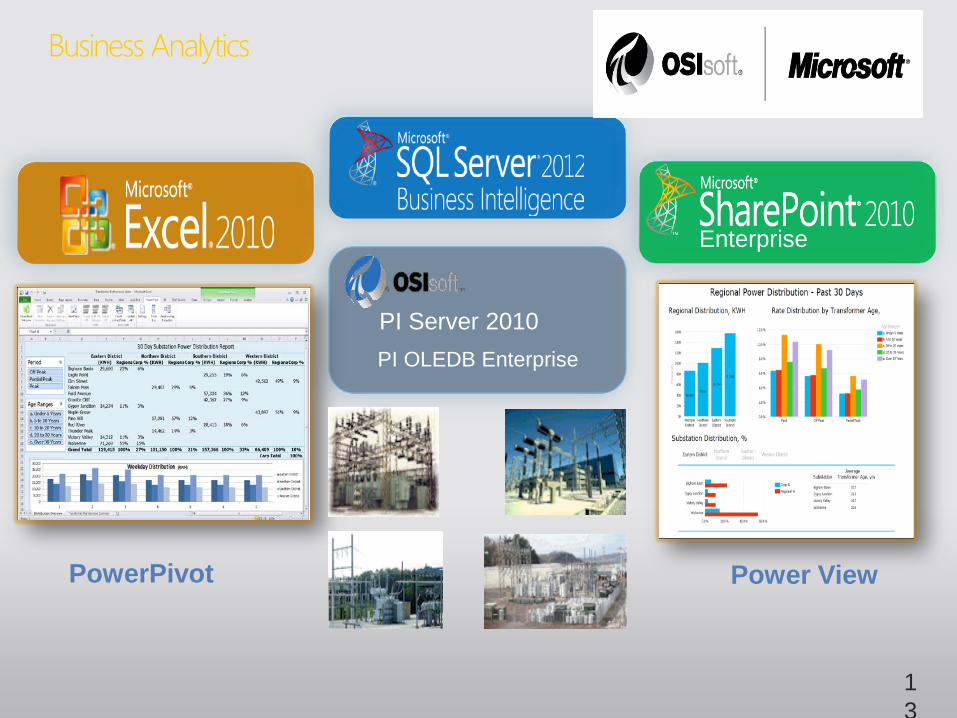
Business Analytics
PI OLEDB Enterprise
PI Server 2010
Enterprise
PowerPivot Power View
14
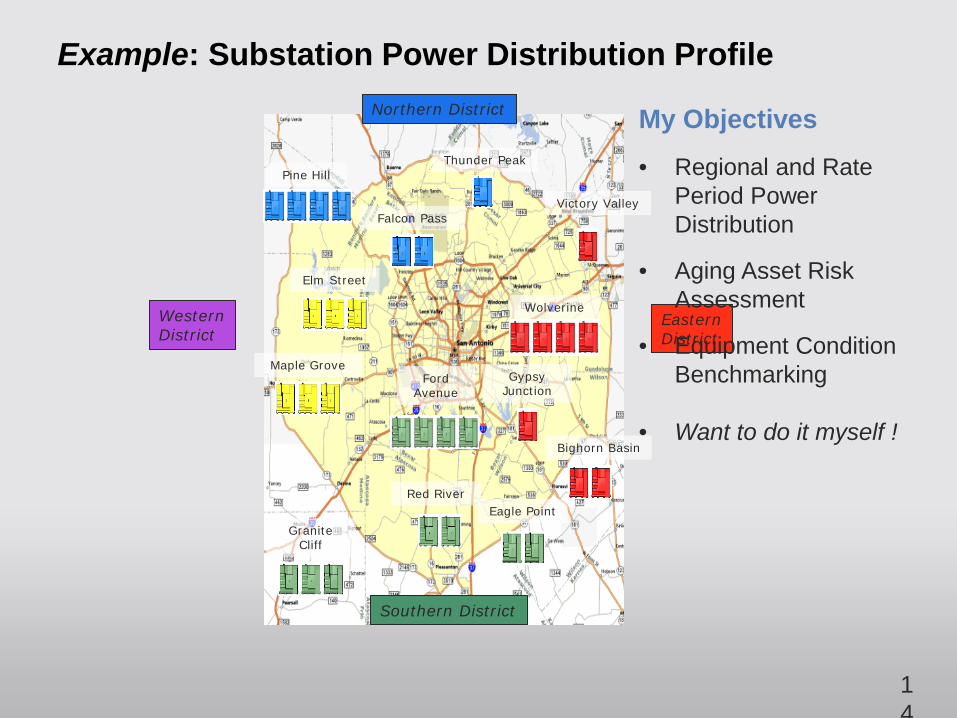
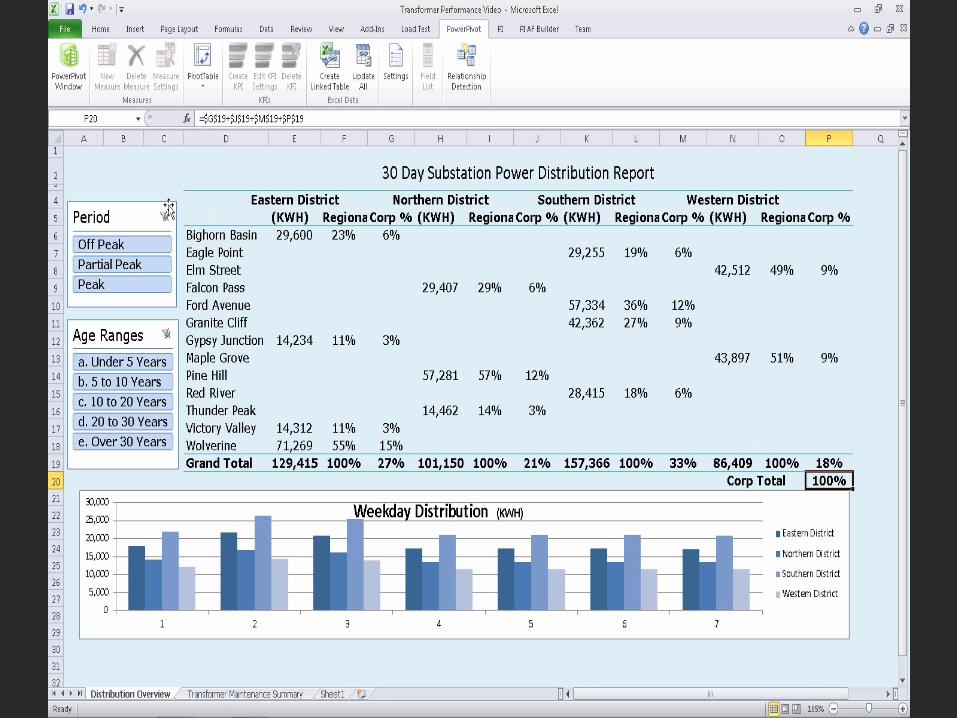
Example: Substation Power Distribution Profile
Wolverine
Bighorn Basin
Gypsy Junction
Victory Valley
Eastern District
Northern District
Falcon Pass
Pine Hill Thunder Peak
Southern District
Western District
Eagle Point
Ford Avenue
Granite Cliff
Red River
Elm Street
Maple Grove
My Objectives
• Regional and Rate Period Power Distribution
• Aging Asset Risk Assessment
• Equipment Condition Benchmarking
• Want to do it myself !
15
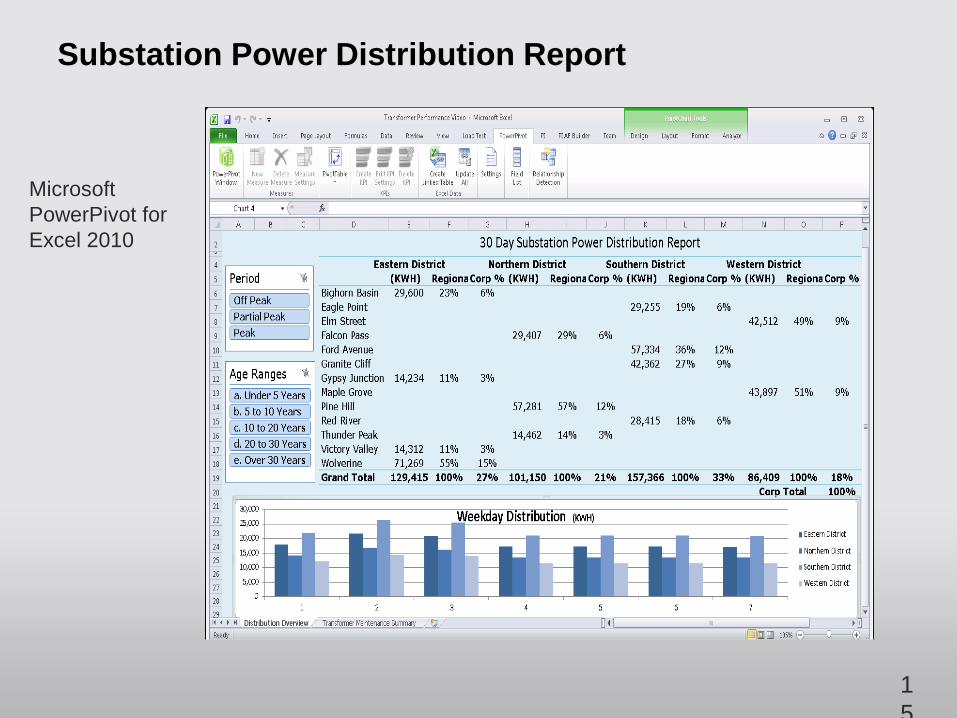
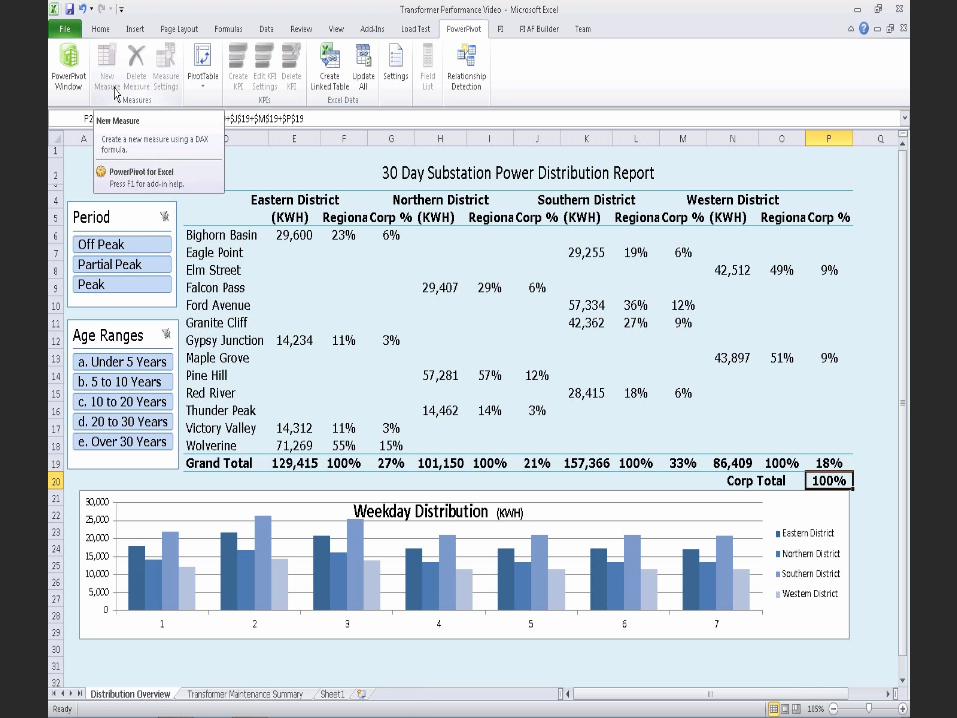
Substation Power Distribution Report
Microsoft PowerPivot for Excel 2010
16
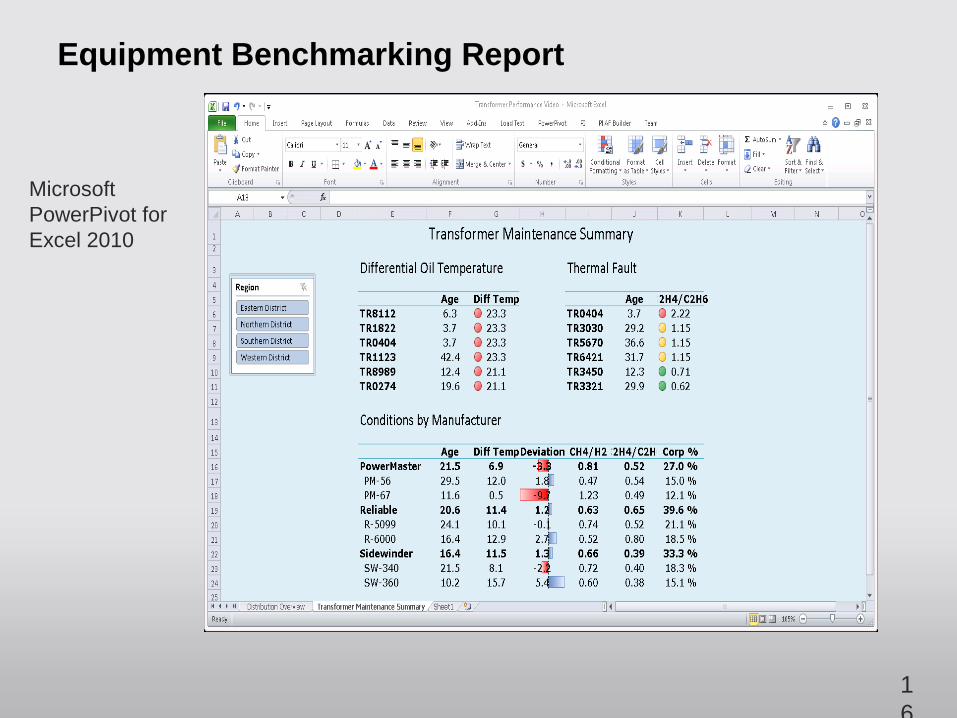
Equipment Benchmarking Report
Microsoft PowerPivot for Excel 2010
© C opyr i g h t 2012 OS Iso f t , LLC . 17
PowerPivot Report
18
19
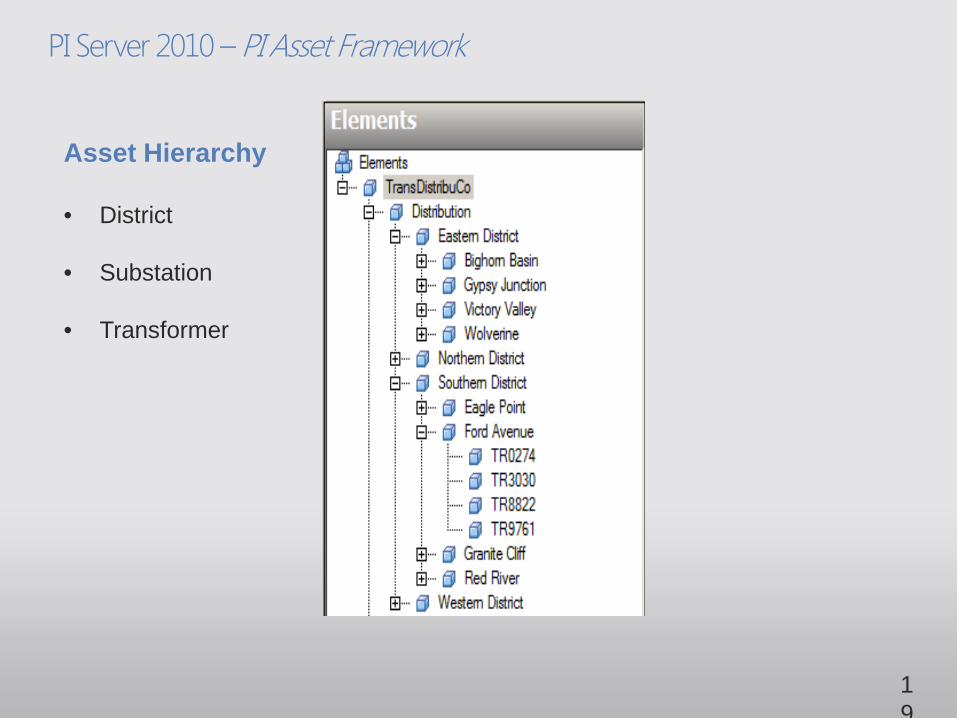
PI Server 2010 – PI Asset Framework
Asset Hierarchy • District
• Substation
• Transformer
20
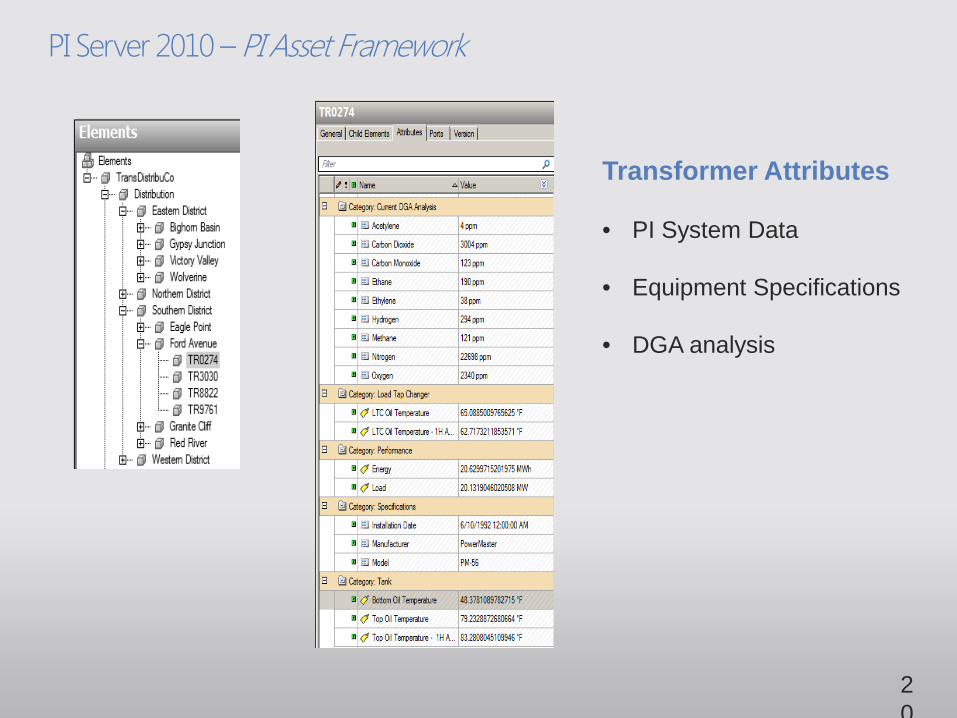
PI Server 2010 – PI Asset Framework
Transformer Attributes • PI System Data
• Equipment Specifications
• DGA analysis
21
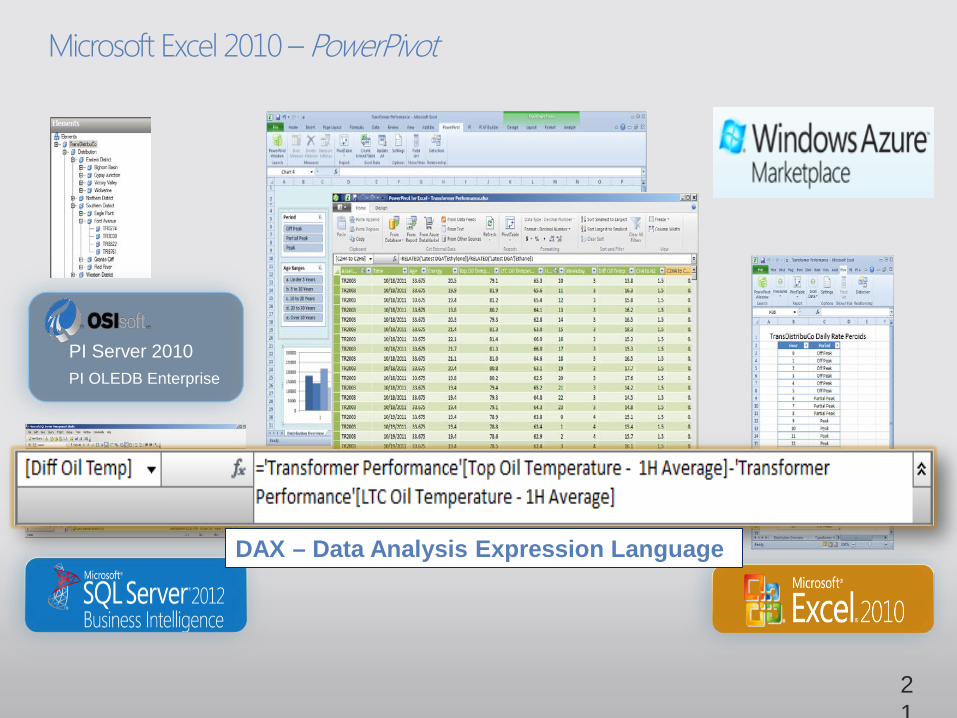
Microsoft Excel 2010 – PowerPivot
PI OLEDB Enterprise PI Server 2010
DAX – Data Analysis Expression Language
© C opyr i g h t 2012 OS Iso f t , LLC . 22
PowerPivot Window
23
© C opyr i g h t 2012 OS Iso f t , LLC . 24
Building the PowerPivot Report

25
26
PI OLEDB Enterprise
PI Server 2010
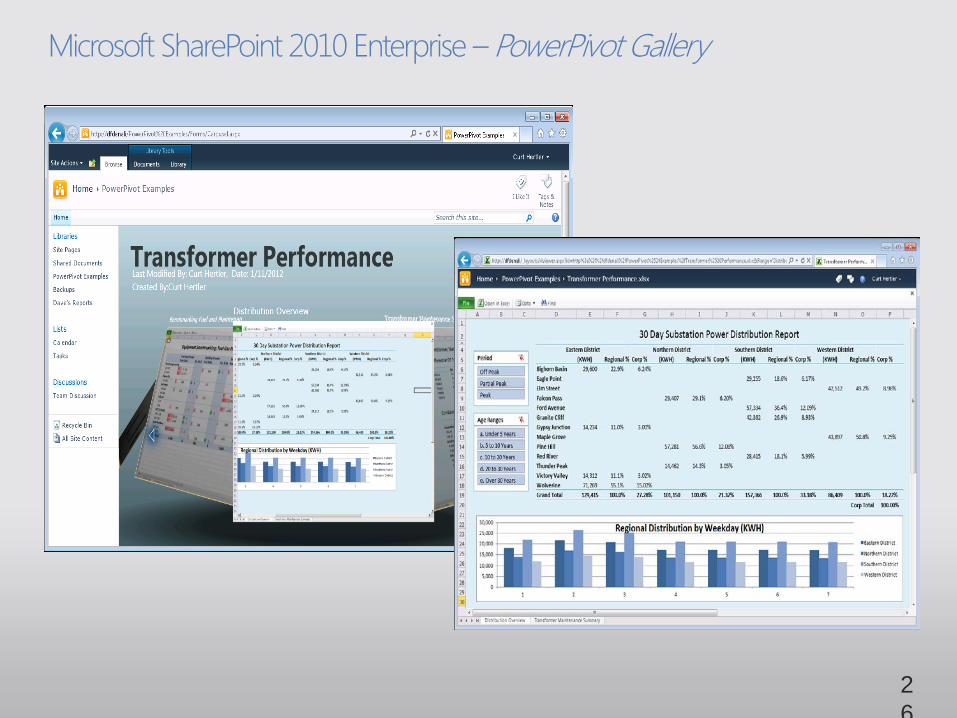
Microsoft SharePoint 2010 Enterprise – PowerPivot Gallery
27
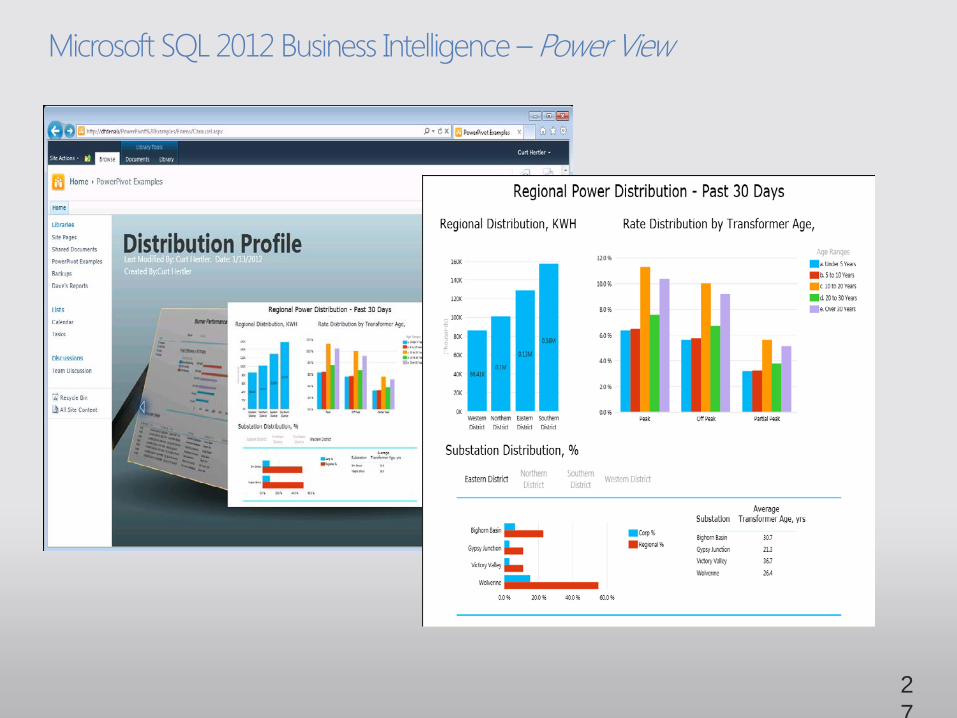
Microsoft SQL 2012 Business Intelligence – Power View

© C opyr i g h t 2012 OS Iso f t , LLC . 28
Power View Report View\Page 1
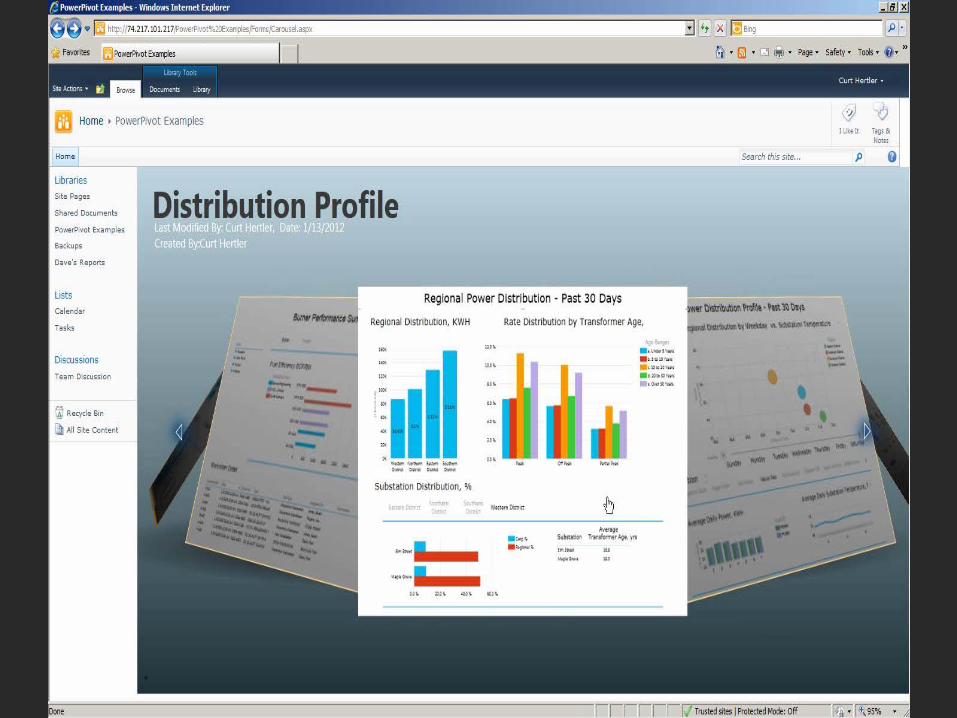
29

© C opyr i g h t 2012 OS Iso f t , LLC . 30
Power View Report View\Page 2
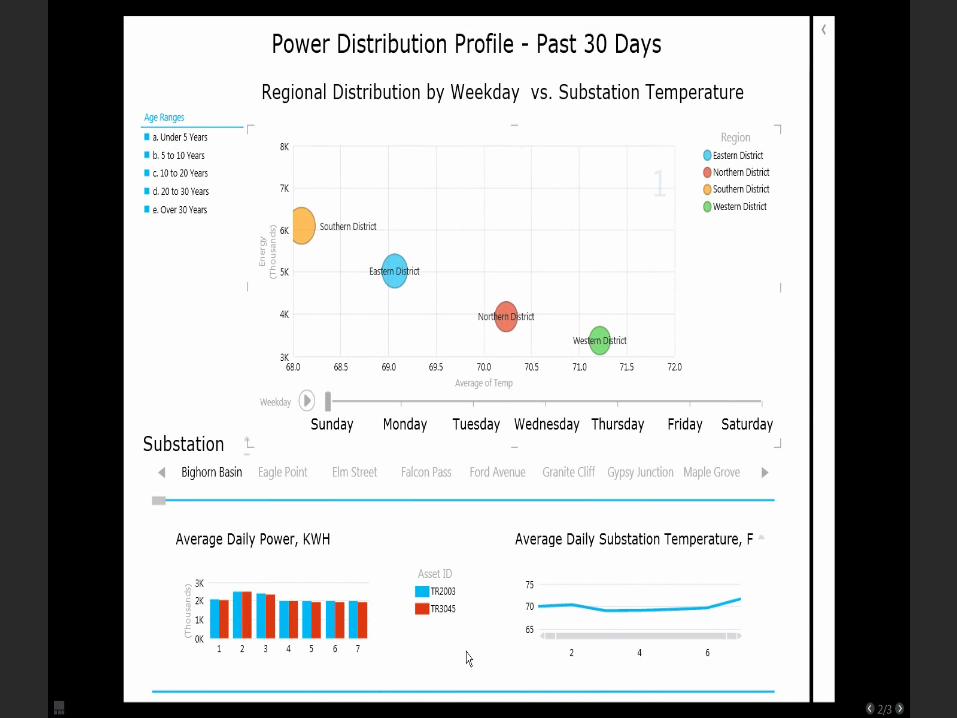
31
© C opyr i g h t 2012 OS Iso f t , LLC . 32
Power View Report View\Page 3
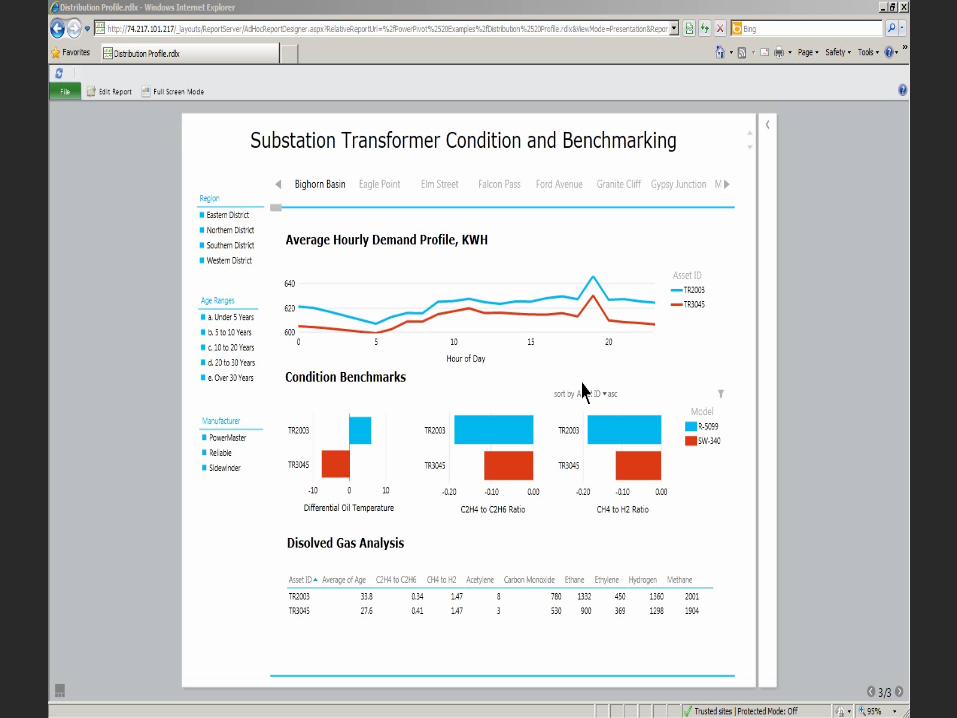
33

© C opyr i g h t 2012 OS Iso f t , LLC . 34
Building a Power View Report
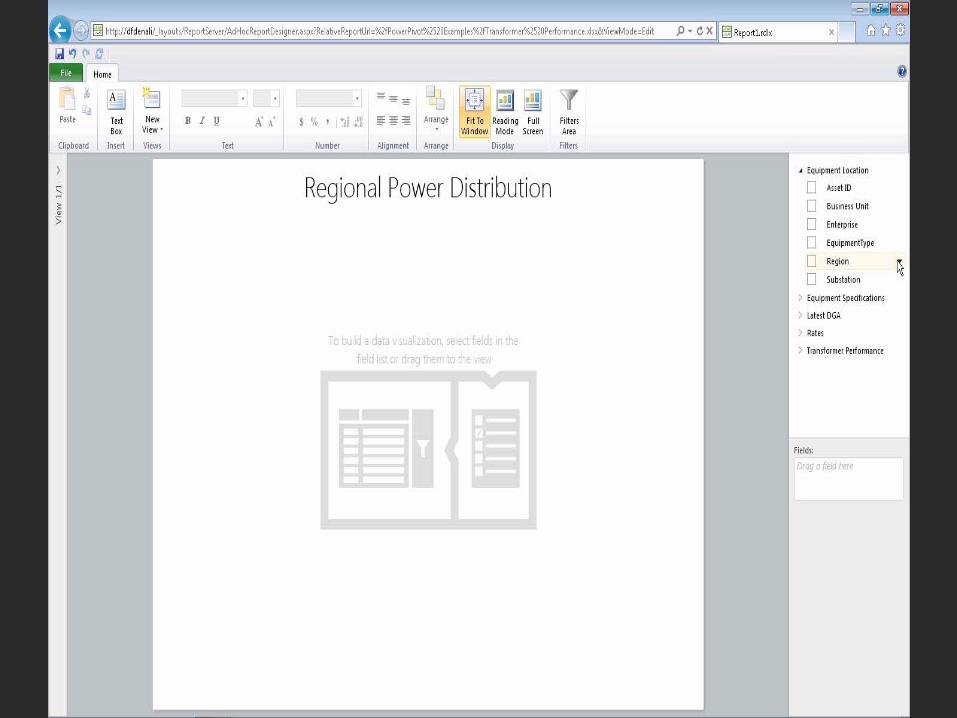
36
PI OLEDB Enterprise
PI Server 2010
Microsoft SQL 2012 Business Intelligence – Power View
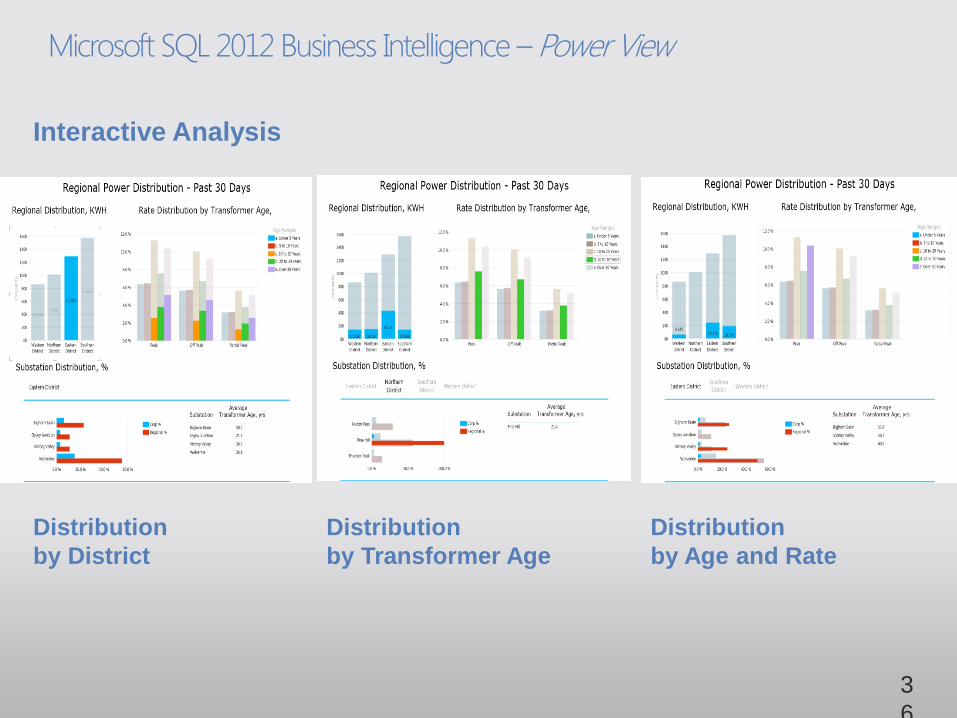
Distribution by District
Distribution by Transformer Age
Distribution by Age and Rate
Interactive Analysis
37
PI OLEDB Enterprise
PI Server 2010
Microsoft SQL 2012 Business Intelligence – Power View
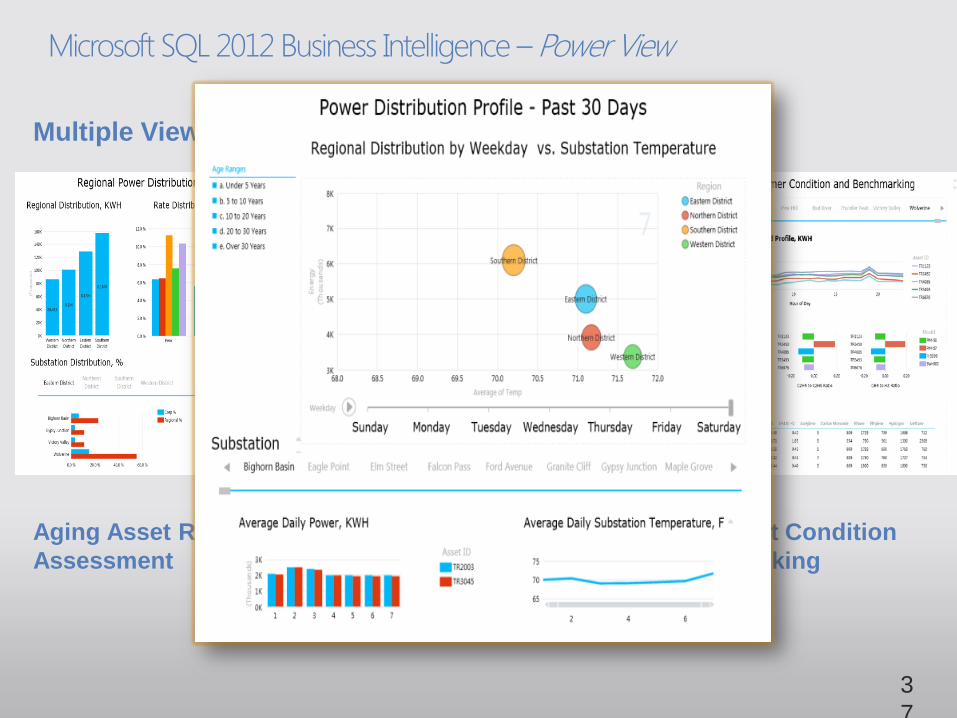
Aging Asset Risk Assessment
Weekday Distribution Profile
Equipment Condition Benchmarking
Multiple Views \ Pages
38
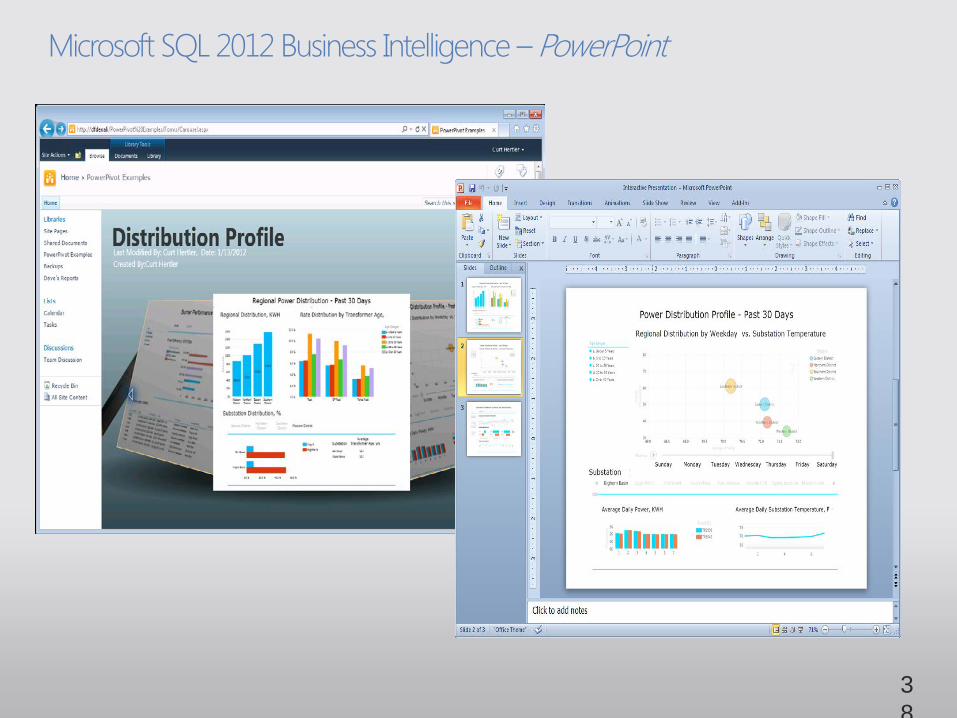
Microsoft SQL 2012 Business Intelligence – PowerPoint
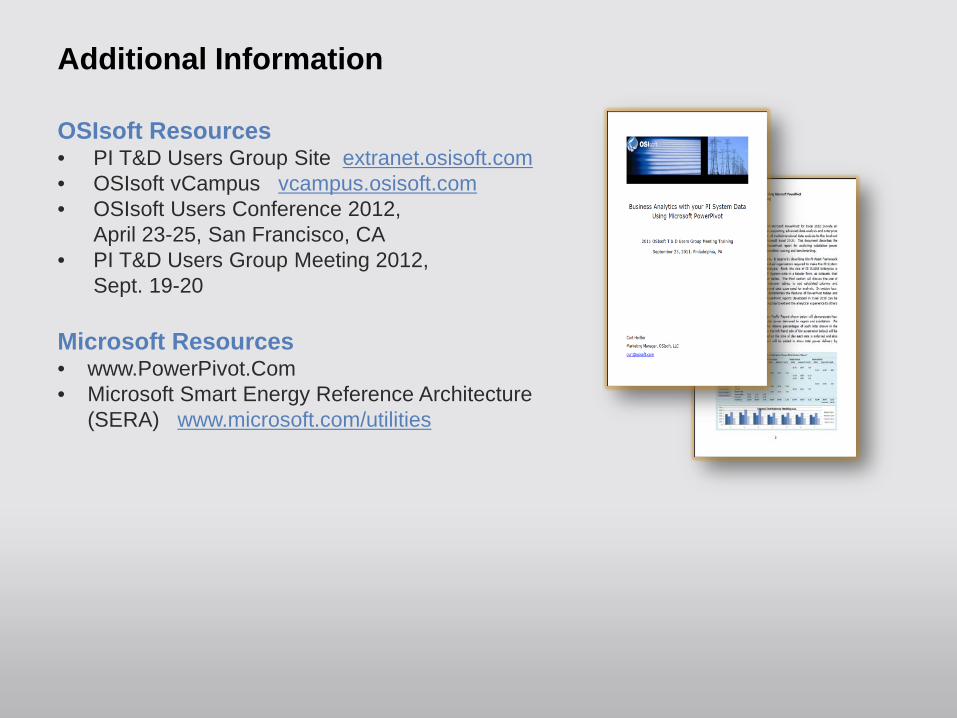
Additional Information
OSIsoft Resources • PI T&D Users Group Site extranet.osisoft.com • OSIsoft vCampus vcampus.osisoft.com • OSIsoft Users Conference 2012,
April 23-25, San Francisco, CA • PI T&D Users Group Meeting 2012,
Sept. 19-20
Microsoft Resources • www.PowerPivot.Com • Microsoft Smart Energy Reference Architecture
(SERA) www.microsoft.com/utilities
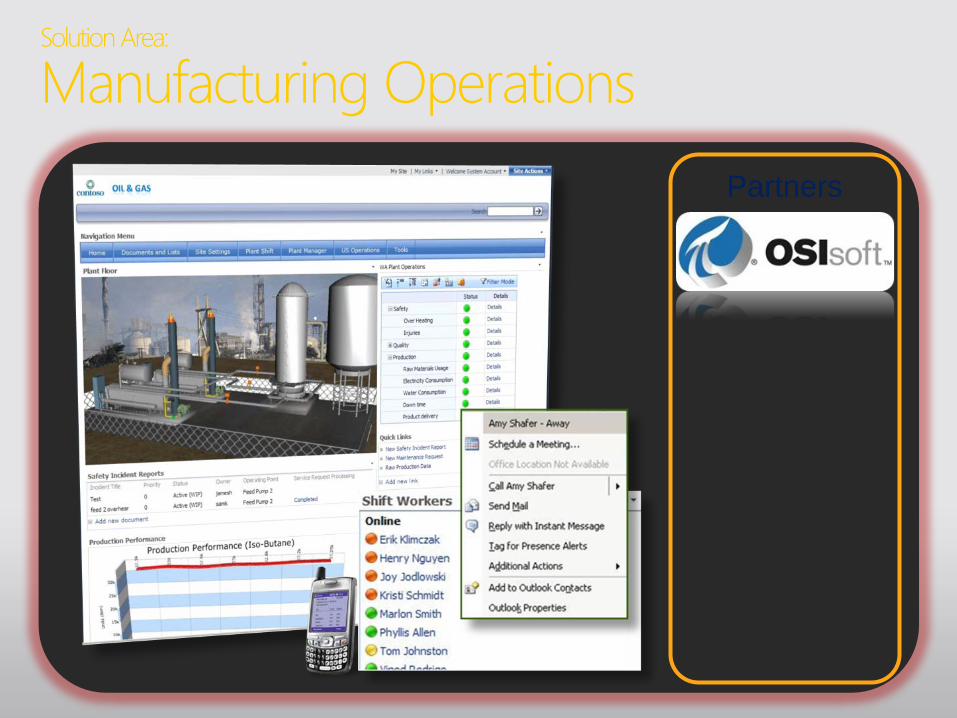
Solution Area:
Manufacturing Operations Partners
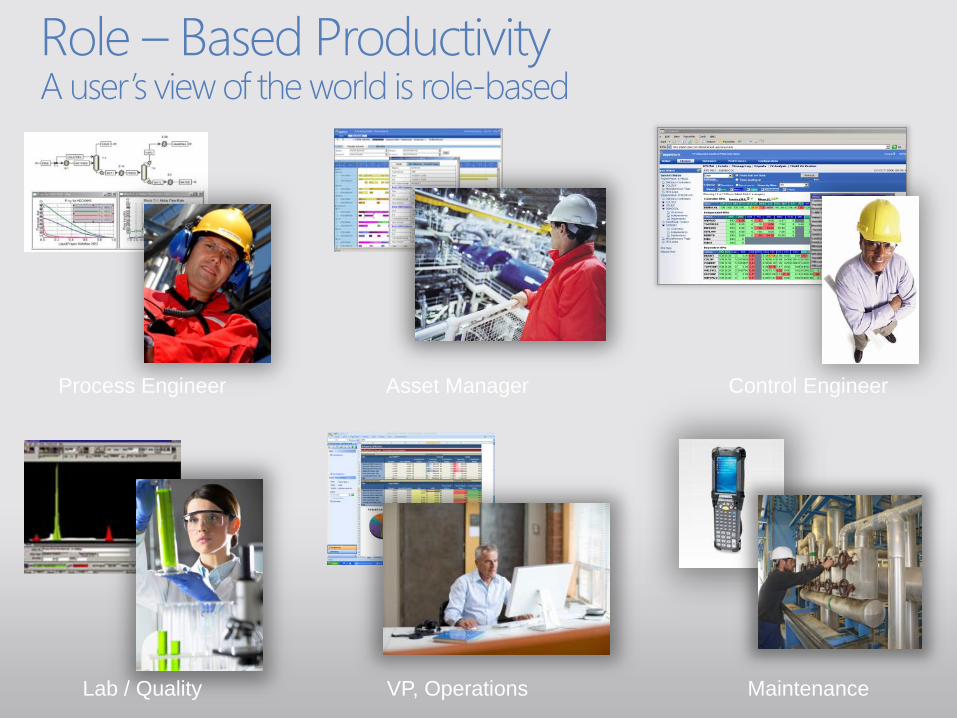
Role – Based Productivity A user’s view of the world is role-based
Process Engineer Asset Manager Control Engineer
Lab / Quality VP, Operations Maintenance
Manufacturing Operations Demo
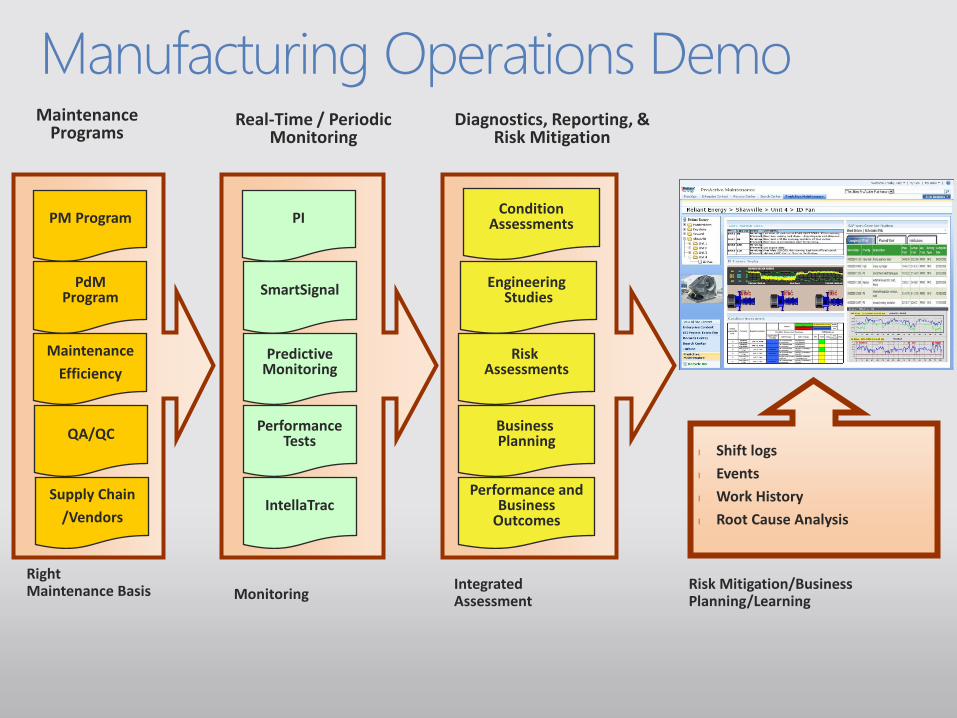
Manufacturing Operations Demo
PI
SmartSignal
Predictive Monitoring
Performance Tests
IntellaTrac
l Shift logs l Events l Work History l Root Cause Analysis
Engineering Studies
Risk Assessments
Business Planning
PM Program
PdM Program
Maintenance Efficiency
Real-Time / Periodic Monitoring
Diagnostics, Reporting, & Risk Mitigation
Right Maintenance Basis
Maintenance Programs
QA/QC
Supply Chain /Vendors
Performance and Business
Outcomes
Monitoring Integrated Assessment
Risk Mitigation/Business Planning/Learning
Condition Assessments