storm water division, transportation and storm water ...watershed asset management plan storm water...
TRANSCRIPT
Watershed Asset Management Plan Storm Water Division, Transportation and Storm Water Department
Final Report
i
Table of Contents List of Acronyms and Abbreviations ...........................................................................................1 Glossary of Terms ..........................................................................................................................1 Watershed Management Plan .......................................................................................................1 Acknowledgements ........................................................................................................................1 Executive Summary ................................................................................................................ ES-1
Section 1 Introduction ........................................................................................................ 1-1
1.1 City of San Diego Storm Water Division Responsibilities .................................... 1-3 1.2 City of San Diego Storm Water Division Organizational Capabilities ................. 1-4 1.3 History ................................................................................................................... 1-7 1.4 Storm Drain System ............................................................................................. 1-12 1.5 Asset Management Planning ............................................................................... 1-12 1.6 Components of the Watershed Asset Management Plan ..................................... 1-14
1.6.1 What Is An Asset Management Plan? ..................................................... 1-14 1.6.2 Why Is An Asset Management Plan Needed? ........................................ 1-15 1.6.3 How Can An Asset Management Plan Be Applied? ............................... 1-15 1.6.4 Storm Water Division Assets .................................................................. 1-16 1.6.5 Watershed Asset Management Plan Development Process .................... 1-17 1.6.6 Watershed Asset Management Plan Outline ........................................... 1-18
1.7 Document Updates ............................................................................................... 1-20
Section 2 Asset Inventory – “What Do We Own / Manage?” ........................................ 2-1
2.1 Asset Hierarchy ..................................................................................................... 2-4 2.2 Data Sources and Asset Inventory Method ............................................................ 2-6 2.3 Asset Summary ...................................................................................................... 2-6
2.3.1 Hard Assets ............................................................................................... 2-6 2.3.2 Soft Assets .............................................................................................. 2-10 2.3.3 Natural Assets ......................................................................................... 2-20
Section 3 Asset Management Costs / Program Funding Requirements: “What Is It Worth?” .............................................................................................................. 3-1
Section 4 What Is Its Condition? ...................................................................................... 4-1
Section 5 What Needs To Be Done? .................................................................................. 5-1
Section 6 When Do We Need to Do It? ............................................................................. 6-1
6.1 Risk ........................................................................................................................ 6-1 6.2 Expected Useful Life for Different Asset Types ................................................... 6-8
Section 7 How Much Will It Cost?.................................................................................... 7-1
Watershed Asset Management Plan Storm Water Division, Transportation and Storm Water Department
Final Report
ii
7.1 Probable Cost Estimation Methodology ................................................................ 7-1 7.2 Natural Asset BMPs for TMDL Compliance Cost Model ................................... 7-13 7.3 Long-range Forecast ............................................................................................ 7-19
7.3.1 Soft Assets .............................................................................................. 7-19 7.3.2 Natural Assets ......................................................................................... 7-19 7.3.3 Soft Assets .............................................................................................. 7-20 7.3.4 Long-range Forecast ............................................................................... 7-23
7.4 FY14 Total Budget estimate ................................................................................ 7-33 7.4.1 FY14 5 Year CIP and General Fund Budgetary Estimate ...................... 7-35
Section 8 Funding Strategies: “How Will We Pay for It?” ............................................ 8-1
8.1 Current Funding Levels ......................................................................................... 8-1 8.2 Budgetary scenarios ............................................................................................... 8-1
8.2.1 Full Service Level Attainment Scenario ................................................... 8-3 8.2.2 Current Budget .......................................................................................... 8-4 8.2.3 Current Budget Plus $2M/YR for the Next 5 Years ................................. 8-5 8.2.4 Current Budget Plus $6M/YR for the Next 5 Years ................................. 8-5 8.2.5 Current Budget Plus $8M/YR for the Next 5 Years ................................. 8-6 8.2.6 Current Budget Plus $10M/YR for the Next 5 Years ............................... 8-7
8.3 Future Strategies .................................................................................................... 8-7
Section 9 Asset Management Improvement Plan ............................................................ 9-1
9.1 Confidence Level Rating ....................................................................................... 9-1
Section 10 Recommendations ............................................................................................ 10-1
Watershed Asset Management Plan Storm Water Division, Transportation and Storm Water Department
Final Report
iii
List of Tables, Figures, and Appendices Tables
Table 1-1. Functional Capability Definitions .................................................................................... 1-5 Table 1-2. Core Elements and Goals of Asset Management ........................................................... 1-14 Table 2-1. Summary of Hard Assets ................................................................................................. 2-7 Table 2-2. Summary of Soft Assets ................................................................................................ 2-10 Table 2-3. Summary of Natural Assets ........................................................................................... 2-20 Table 5-1. Levels of Service ............................................................................................................. 5-5 Table 6-1. Modes of Failure .............................................................................................................. 6-1 Table 6-2. PoF Logic ......................................................................................................................... 6-2 Table 6-3. Definitions of Consequence of Failure Categories .......................................................... 6-4 Table 6-4. CoF Category Weights ..................................................................................................... 6-4 Table 6-5. Hard Asset CoF Components........................................................................................... 6-6 Table 6-6. Repair Cost Factor ........................................................................................................... 6-7 Table 6-7. Asset Useful Lives ........................................................................................................... 6-9 Table 7-1. Opinion of Probable Cost Projection Methods Employed ............................................... 7-3 Table 7-2. CLRP Cost Categories and WAMP Cost Categories Cross Reference
for CLRP Activities ....................................................................................................... 7-14 Table 7-3. Phase I and Phase II City of San Diego CLRP Opinions of Probable Costs ................. 7-17 Table 7-4. Long-term Cost Opinion Projection Method ................................................................. 7-20 Table 7-5. Long-range Forecast by Asset Type .............................................................................. 7-23 Table 7-6. LOS 13a and 13b Funding Source Assumptions ........................................................... 7-33 Table 7-7. FY 14 5 Year Budget Projection .................................................................................... 7-37 Table 9-1. Primary, Secondary, and Tertiary Weighting .................................................................. 9-3 Table 9-2. CLR Secondary and Tertiary Weighting ......................................................................... 9-4 Table 9-3. Confidence Level Rating Assessment for Hard Assets ................................................... 9-5 Table 9-4. Confidence Level Rating Assessment for Soft Assets ..................................................... 9-7 Table 9-5. Confidence Level Rating Assessment for Natural Assets ............................................... 9-9 Table 9-6. 2013 Confidence Level Rating ...................................................................................... 9-11
Figures
Figure 1-1. San Diego Storm Water Division Mission and Goals ............................................................. 1-2 Figure 1-2. City of San Diego Watershed Management Areas .................................................................. 1-4 Figure 1-3. WQIP and Jurisdictional Runoff Management Program ...................................................... 1-10 Figure 1-4. Seven Core Elements of Asset Management ........................................................................ 1-13 Figure 1-5. Core Processes for Asset Management Plan Development ................................................... 1-18 Figure 2-1. Asset Classifications ............................................................................................................... 2-3 Figure 2-2. Asset Hierarchy ....................................................................................................................... 2-5 Figure 3-1. Total Hard Asset Replacement Costs by Watershed ............................................................... 3-2 Figure 4-1. Risk-Based Condition Assessment Methodology ................................................................... 4-1
Watershed Asset Management Plan Storm Water Division, Transportation and Storm Water Department
Final Report
iv
Figure 4-2. Condition versus Age Relationship ......................................................................................... 4-3 Figure 4-3. Condition of Reinforced Concrete Pipes (All Watersheds) .................................................... 4-4 Figure 4-4. Condition Assessment Results for Pump Station Components ............................................... 4-5 Figure 4-5. Condition Assessment Results for Soft Assets........................................................................ 4-6 Figure 4-6. Condition Assessment Results for Natural Assets .................................................................. 4-6 Figure 5-1. Levels of Service ..................................................................................................................... 5-1 Figure 5-2. Alignment of Goals with NPDES Compliance and Flood Risk Management ........................ 5-2 Figure 6-1. Triple Bottom Line .................................................................................................................. 6-3 Figure 6-2. BRE Plot .................................................................................................................................. 6-8 Figure 7-1. CLRP Watersheds ................................................................................................................. 7-15 Figure 7-2. Long-range Forecast Methodology ....................................................................................... 7-21 Figure 7-3. TEAMPlan Screen Shot ........................................................................................................ 7-22 Figure 7-4. Watershed Long-range Forecast by Asset Type .................................................................... 7-24 Figure 7-5. Watershed 5 Year Outlook by Asset Type ............................................................................ 7-25 Figure 7-6. Watershed 10 Year Outlook by Asset Type .......................................................................... 7-25 Figure 7-7. Watershed 30 Year Outlook by Asset Type .......................................................................... 7-26 Figure 7-8. Watershed 100 Year Forecast by Asset Type ....................................................................... 7-27 Figure 7-9. Watershed 100 Year Forecast by Activity Type - Normalized ............................................. 7-31 Figure 8-1. Comparison of Funding Scenarios .......................................................................................... 8-2 Figure 8-2. Full Service Level Budget Projections .................................................................................... 8-3 Figure 8-3. Full Service Level General Fund Budget Requirements ......................................................... 8-4 Figure 8-4. Current Budget Backlog Projections ....................................................................................... 8-4 Figure 8-5. Backlog Projections at Current Budget Plus $10 M ................................................................ 8-5 Figure 8-6. Backlog Projections at Current Budget Plus $30 M ................................................................ 8-6 Figure 8-7. Backlog Projections at Current Budget Plus $40 M ................................................................ 8-7 Figure 8-8. Backlog Projections at Current Budget Plus $50 M ................................................................ 8-7 Figure 9-1. Continuous Improvement Process ........................................................................................... 9-2 Figure 9-2. 2013 Confidence Level Rating .............................................................................................. 9-12
Appendices
Appendix A San Diego Bay Watershed Appendix B San Diego River Watershed Appendix C Mission Bay Watershed Appendix D Los Peñasquitos Watershed Appendix E San Dieguito Watershed Appendix F Tijuana River Watershed

Watershed Asset Management Plan Storm Water Division, Transportation and Storm Water Department
Final Report
1
List of Acronyms and Abbreviations Basin Plan Water Quality Control Plan for the San Diego Basin BMP best management practice BRE business risk exposure CAO cleanup and abatement order CCTV close-caption television CEQA California Environmental Quality Act City City of San Diego CLR comprehensive load reduction CLRP Comprehensive Load Reduction Plan CoF consequence of failure County County of San Diego CWA Clean Water Act Division City of San Diego Storm Water Division FTE full-time equivalent HA hydrologic area HSA hydrologic subarea HU hydrologic unit LOS level of service MS4 municipal separate storm sewer system MHPA multiple-habitat planning area NPDES National Pollutant Discharge Elimination System O&M operations and maintenance PoF probability of failure RCF repair cost factor RWQCB (San Diego) Regional Water Quality Control Board SANDAG San Diego County Association of Governments SRM (Water Research Centre) Sewer Rehabilitation Manual SWRCB (California) State Water Resources Control Board TMDL total maximum daily load USEPA United States Environmental Protection Agency WAMP Watershed Asset Management Plan WLA waste load allocation WMA Watershed Management Area WQIP Water Quality Improvement Plan
Watershed Asset Management Plan Storm Water Division, Transportation and Storm Water Department
Final Report
2
This page intentionally left blank

Watershed Asset Management Plan Storm Water Division, Transportation and Storm Water Department
Final Report
1
Glossary of Terms Asset. Something one owns or manages that provides a level of service to rate payers, citizens, and/or regulators.
Asset Management. The practice of planning for the replacement, refurbishment, improvement, and operations and maintenance of utility assets to continue to meet current and future anticipated levels of service.
Best Management Practice (BMP). An activity or a device that reduces the amount of pollution that enters the storm drain system. BMPs can be non-structural (activities) or structural (devices). BMPs can reduce the sources of pollution or remove pollution from runoff before it reaches the storm drain system or the receiving water.
Bonds. Debt instruments sold to investors to secure funds. Repayment terms include the payment of interest and principle over a period of time.
Business Risk Exposure. The risk associated with the current performance of an asset, generally measured as to how likely it is to fail and what would happen should it fail.
Capacity. The ability of an asset to carry a needed volume. This can be the ability of a road to carry a number of vehicles per hour, the ability of a pipe or channel to carry a quantity of gallons of water per minute, etc.
Capital Improvement Program (CIP). A planning and funding program to replace constructed infrastructure or to build new constructed infrastructure.
Consequence of Failure. What would happen should an asset fail? This is generally evaluated as to the repercussions of the asset’s failure. It is generally measured along three lines of evaluation – economic, social, and environmental.
Enterprise Fund. The account that fees for specific city services, generally paid for per use, flow into that is used to pay for the management of the assets that deliver those specific services.
Financial Efficiency. The degree to which the asset is costing the lowest amount possible to achieve a defined level of service on a life cycle basis. When considering the replacement costs, the improvement costs, and the operations and maintenance costs over the life cycle of the asset (length of its useful life), the total life cycle cost under the asset replacement schedule, asset improvement schedule, and operations and maintenance schedule are the lowest they can be to meet the level of service over that life cycle.
Flood Risk Management. The activities undertaken to protect life and property from water that flows outside of a naturally formed receiving water channel.
Watershed Asset Management Plan Storm Water Division, Transportation and Storm Water Department
Final Report
2
General Fund. The account that tax revenues flow into that is used to pay for most city services that are not funded by fees paid for those services.
Ground Water. Water that exists beneath the ground surface.
Hard Asset. A human made item that one can touch and see that provides a level of service.
Level of Service. The performance of the asset that the regulator’s require and the citizens’ desire. What the asset is supposed to achieve.
Mortality. Collapse of the asset. The asset fails in a manner in which it cannot function at all. This is generally viewed from a structural context – a bridge collapse, a pipe collapse, a road becomes impassable, etc.
Natural Asset. A naturally occurring item that one can touch or see that cannot be owned and that provides a level of service.
Operations and Maintenance (O&M). A program to fund and manage the activities that must occur each year in order to achieve levels of service with assets.
Permit. An allowance from a regulatory agency to engage in some activity that would otherwise be restricted or prohibited.
Probability of Failure. How likely it is that an asset will fail in the near term – generally within the current year. Failure can occur along one of 4 modes – mortality, capacity, level of service, and financial efficiency.
Receiving water. The water resource defined by the State of California as a public good that is protected by the state under the Porter-Cologne Act and possibly protected by the Federal Government under the Clean Water Act. Receiving waters are generally defined in the Water Quality Control Plans (Basin Plans).
Renewal. Extending the remaining useful life of an asset through some form of an investment in that asset. The investment may be replacing some or the entire asset, modifying the asset with some physical modification, or increasing the amount of operations and maintenance investment in the asset.
Soft Asset. A human-created intangible experiential element that cannot be touched or seen, but which provides a level of service.
Storm Water. Water that is generated by rainfall and runs off the land into a storm drain or receiving water.
Urban Runoff. Water that is discharged due to human activities and runs off into the storm drain or receiving water.

Watershed Asset Management Plan Storm Water Division, Transportation and Storm Water Department
Final Report
3
Useful Life. The period of time that an asset can continue to meet a specified level of service when all else remains equal.
Valuation. The amount an asset is worth. Valuation methods include 1) valuing the asset based on the lifecycle cost of managing the asset to achieve a given level of service – the asset’s periodic replacement cost plus annual operations and maintenance costs; or 2) determine what the users will pay for the levels of service the asset provides.
Waters of the U.S. The water resource defined by the Federal Government as within the jurisdiction of and protected by the Clean Water Act. All Waters of the U.S. are Receiving Waters. Not all Receiving Waters are Waters of the U.S.

Watershed Asset Management Plan Storm Water Division, Transportation and Storm Water Department
Final Report
4
This page intentionally left blank

Watershed Asset Management Plan Storm Water Division, Transportation and Storm Water Department
Final Report
1
WATERSHED ASSET MANAGEMENT PLAN This main body of the report presents the general approach taken to develop the Asset Management Plan. The appendices, each of which contains a watershed asset management plan (WAMP) for a specific watershed identified in the Water Quality Control Plan for the San Diego Basin (Basin Plan), follow the main text. Each section of the main report summarizes the more detailed information contained in the associated appendix, how the information was captured, and what analyses were completed to assess the information and draw conclusions. The actual data and conclusions drawn are presented in the appendices, each of which represents a fairly complete WAMP for one watershed.
This report is intended for the sole use of the City of San Diego. The scope of services performed during this project may not be appropriate to satisfy the needs of other users, and any use or re-use of this document or of the findings, conclusions, or recommendations presented herein is at the sole risk of said user. Background information and other data have been furnished to URS by the City of San Diego and/or third parties, and have been used by URS in preparing this report. URS has relied on this information as furnished, and is neither responsible for nor has confirmed the accuracy of this information.
Watershed Asset Management Plan Storm Water Division, Transportation and Storm Water Department
Final Report
2
This page intentionally left blank
Watershed Asset Management Plan Storm Water Division, Transportation and Storm Water Department
Final Report
1
ACKNOWLEDGEMENTS The City of San Diego Storm Water Division (Division) Watershed Asset Management Plan was completed with the combined efforts of many members of the Management, Pollution Prevention, and Operations and Maintenance staff. Contributions were made through workshops, interviews, and assistance in development and review of the Watershed Asset Management Plan. The efforts of this team should be acknowledged.
City of San Diego Storm Water Division Deputy Director Kris McFadden
City of San Diego Task Order Manager Drew Kleis
City of San Diego, San Diego Bay Watershed Coordinators Ruth Kolb Daniel Lottermoser
City of San Diego, San Diego River Coordinators Bill Harris Bill Tamargo (OCA: Sam Ferschweler/Aaron Snelling)
City of San Diego, Mission Bay and Scripps Watershed Coordinators Andre Sonksen Stephanie Bracci
City of San Diego, Los Peñasquitos Watershed Coordinators Drew Kleis Roger Wammack
City of San Diego, San Dieguito Watershed Coordinators Gus Brown Gene Matter Sumer Hasenin
City of San Diego, Tijuana River Watershed Coordinators David Wells Anne Jarque
Watershed Asset Management Plan Storm Water Division, Transportation and Storm Water Department
Final Report
2
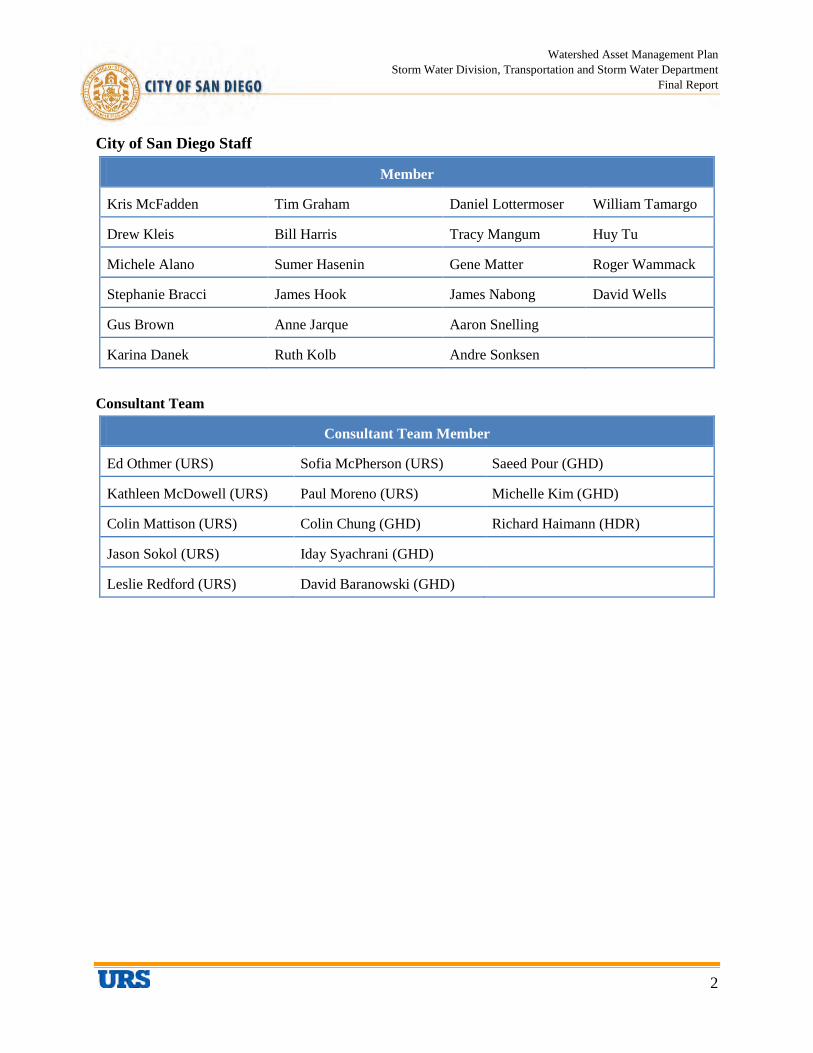
City of San Diego Staff
Member
Kris McFadden Tim Graham Daniel Lottermoser William Tamargo
Drew Kleis Bill Harris Tracy Mangum Huy Tu
Michele Alano Sumer Hasenin Gene Matter Roger Wammack
Stephanie Bracci James Hook James Nabong David Wells
Gus Brown Anne Jarque Aaron Snelling
Karina Danek Ruth Kolb Andre Sonksen
Consultant Team
Consultant Team Member
Ed Othmer (URS) Sofia McPherson (URS) Saeed Pour (GHD)
Kathleen McDowell (URS) Paul Moreno (URS) Michelle Kim (GHD)
Colin Mattison (URS) Colin Chung (GHD) Richard Haimann (HDR)
Jason Sokol (URS) Iday Syachrani (GHD)
Leslie Redford (URS) David Baranowski (GHD)

Watershed Asset Management Plan Storm Water Division, Transportation and Storm Water Department
Final Report
ES-1
EXECUTIVE SUMMARY
ES.1 PURPOSE
The purpose of this Watershed Asset Management Plan (WAMP) is to document the current state of assets (e.g., asset inventory, valuation, condition, risk) and to project the long-range asset renewal (rehabilitation and replacement) requirements for the City of San Diego (City) Storm Water Division (Division). An asset management plan is a long-range planning document used to provide a rational framework for understanding and planning the asset portfolio. This 2013 WAMP consolidates the Division’s asset information into a structured framework and uses it to provide a justifiable basis to support long-term organization, operations, and asset management decisions.
The City elected to align asset management plans with watershed management plans, which include total maximum daily load implementation plans, where necessary. Each watershed management plan is referred to as a WAMP. Each WAMP identifies the assets owned and managed by the Division, provides an understanding of critical assets required to deliver the services, records the strategies that will be used to manage the assets, and documents the future investments required to deliver the committed services.
This document includes a WAMP for each of the six watersheds (San Dieguito, Los Peñasquitos, Mission Bay and La Jolla, San Diego River, San Diego Bay, and Tijuana River) located within the City. Each WAMP will serve as a road map to ensure that actions and activities that address flood risk management and water quality. These plans will provide a vehicle to identify and prioritize potential water quality and flood risk management challenges, evaluate opportunities for integrating water quality and flood risk management into City projects and operations and maintenance (O&M) activities within the watershed. The WAMPs will provide information that will be used to develop the Water Quality Improvement Plans (WQIPs), which are now required under Order No. R9-2013-0001 (Regional MS4 Permit). The development of the WQIPs provides a vehicle for public participation.
ES.2 KEY COMPONENTS OF THE WAMP
The key components of the 2013 WAMP are summarized below.
• Asset Inventory – “What Do We Own?” (Section 2) describes the asset hierarchy, presents the methods employed to obtain asset information, and the general assumptions used where information was not available. An inventory summary of the assets in each watershed is presented in the respective watershed-specific appendix.
• Asset Management Costs / Program Funding Requirements - “What is it Worth?” (Section 3) presents the total costs for managing assets and the methods used to estimate the costs. The estimated costs for the assets of each watershed are presented in the respective watershed-specific appendix.
• What is its Condition? (Section 4) Describes the methods used to determine the assets’ condition. For an asset to fail, it must either reach the end of its useful life (mortality failure mode), not meet the necessary ability to convey adequate flows (capacity failure mode), not meet other requirements (LOS failure mode), or be less expensive on a life cycle cost basis to manage
Watershed Asset Management Plan Storm Water Division, Transportation and Storm Water Department
Final Report
ES-2
using a different management strategy (financial failure mode). The mortality and capacity failure modes generally apply only to hard assets because soft and natural assets generally do not have a defined useful life or required capacity to convey flows. Hard assets can also fail under the LOS and financial failure modes. The failure mode that results in the highest risk as estimated by multiplying the consequence of failure times the probability of failure is the failure mode that drives asset management decisions and expenditures. The LOS and financial failure modes are the only failure modes that would apply to natural and soft assets. The actual conditions of assets in each watershed are presented in the respective watershed-specific appendix.
• What Needs to be Done? (Section 5) Documents the current LOS that, to the best knowledge of the Division, the regulators require and citizens’ desire from the assets.
• When Do We Need to Do It? (Section 6) details the business risk exposure the assets present to the Division and provides the results of the risk mapping conducted for this WAMP.
• How Much Will it Cost? (Section 7) presents long-term costs, the cost assumptions made, and the cost models that were used. The actual costs estimated for each watershed are presented in the respective watershed-specific appendix.
• Funding Strategies – “How Will We Pay for It? (Section 8) discusses various budgetary scenarios and general funding strategies.
• Improvement Plan (Section 9) presents the confidence-level rating, which measures the current asset management practice, and identifies and prioritizes future improvements.
• Recommendations (Section 10) provides recommendations for the assets within each watershed regarding the actions to be taken and projects to be completed to manage the assets to achieve the desired LOS.
Detailed information can be found by referencing the appropriate sections of each respective watershed-specific appendix. Key findings of the 2013 WAMP are summarized below.
ES.3 ASSET VALUATION
To capture the assets that the Division must manage in order to fulfill its responsibilities, the assets have been categorized into three groups (asset types):
• human-made hard assets
• natural assets
• human-made soft assets
Hard Assets are the storm drain system and equipment greater than $5,000 in replacement costs. These assets are generally purchased or constructed, have defined lives, and can be replaced. The $5,000 or greater replacement cost requirement for equipment is a simplification step for tracking and managing hard assets that can have a significant budgetary impact. Smaller items are generally not managed as individual assets.

Watershed Asset Management Plan Storm Water Division, Transportation and Storm Water Department
Final Report
ES-3
Natural assets are those things the Division must manage, but are not human made. They include receiving waters, runoff and discharges, City parcels, and multi-habitat planning areas (MHPAs). These are naturally occurring things that the City must manage to comply with its NPDES permit, other requirements or, in some cases, provide opportunity for additional flood risk or water quality mitigation. In the case of City parcels and MHPAs, these are City-owned lands or lands the City may make use of that provide opportunity for water capture and water quality improvement, and that can be used as assets in the City’s toolbox for achieving TMDL and NPDES compliance.
Soft assets are those things that the Division must manage, are human made, but are not constructed or purchased outright. They do not have defined lives, although they can deteriorate to states that do not provide needed LOS. They do not have a defined replacement cost, but they do have defined costs to build them up and to continue to operate and maintain them. Soft assets include such items as City department behavior, public behavior, policies, ordinances, requirements, and regulatory relationships.
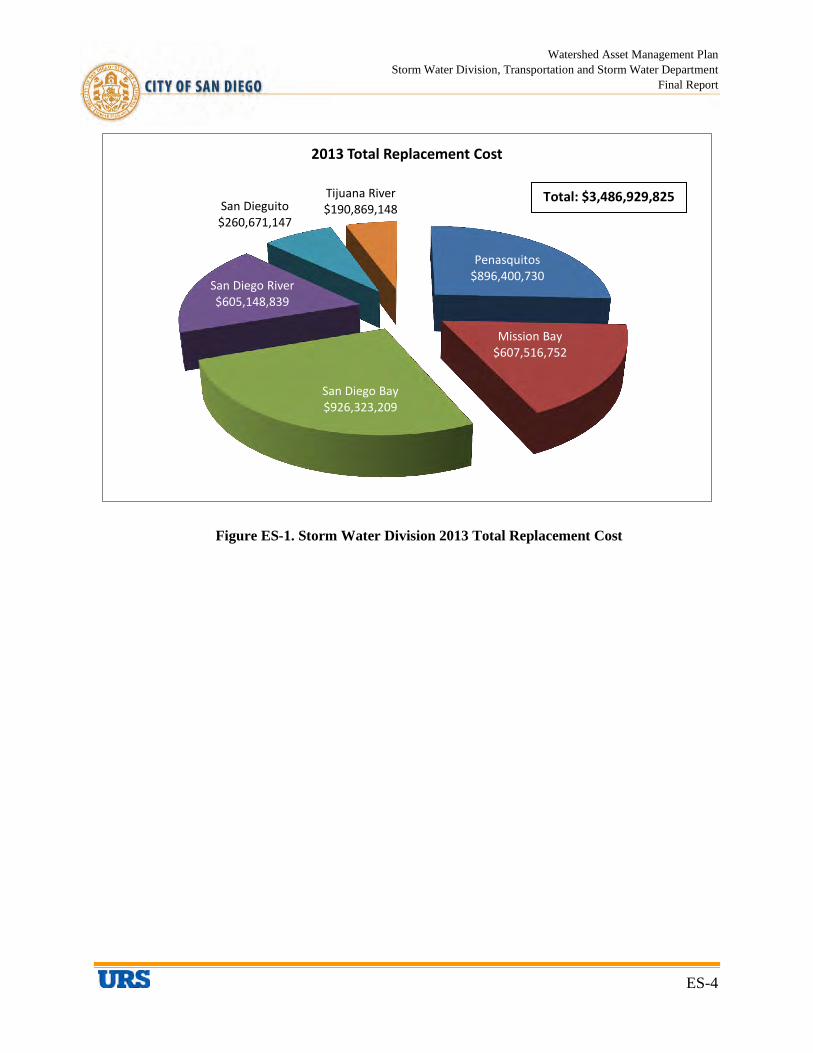
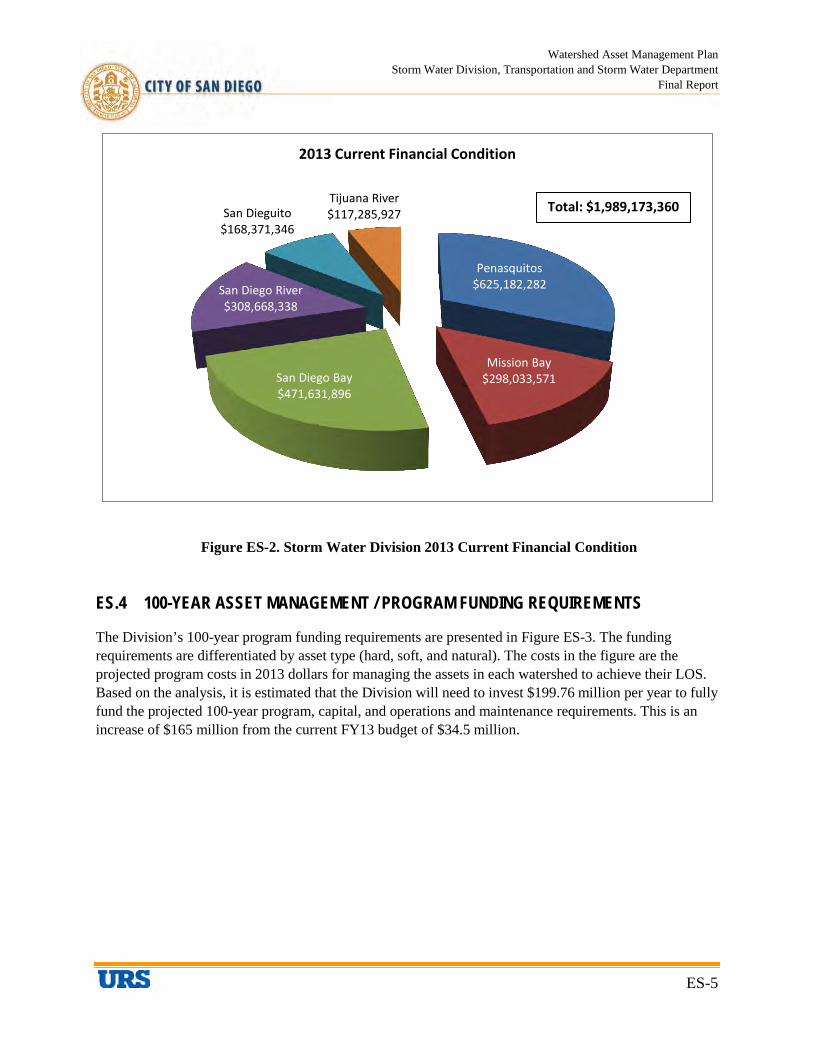
Asset valuations are an integral part of asset management. Based on the currently available asset data, the estimated replacement cost of the Division’s hard assets is approximately $3.5 billion. It is not necessary to replace all of the City’s hard assets immediately. Each hard asset has a remaining useful life. One may estimate the current condition of the hard assets based on its remaining useful life. It is sometimes useful to present the hard asset’s financial condition based on the remaining useful life. For example, if a hard asset has a useful life of 100 years when new, costs $1M to replace, and is 50 years old, then one may say that 50% of the hard asset has been consumed. Therefore, the current financial condition of the hard asset is $500K or 50% of its replacement cost. Considering the age of the City’s hard assets, when they were installed, and what their remaining useful lives are, in aggregate, the current financial condition of the Division’s hard assets is approximately $ 1.99 billion. A breakdown of the total hard asset replacement costs and the current financial condition, based on each watershed, are provided in Figures ES-1 and ES-2. Soft and natural assets do not have replacement costs. Their valuation within this WAMP is generally based on the cost to manage the assets to achieve their LOS.
Watershed Asset Management Plan Storm Water Division, Transportation and Storm Water Department
Final Report
ES-4
Figure ES-1. Storm Water Division 2013 Total Replacement Cost
Penasquitos $896,400,730
Mission Bay $607,516,752
San Diego Bay $926,323,209
San Diego River $605,148,839
San Dieguito $260,671,147
Tijuana River $190,869,148
2013 Total Replacement Cost
Total: $3,486,929,825
Watershed Asset Management Plan Storm Water Division, Transportation and Storm Water Department
Final Report
ES-5
Figure ES-2. Storm Water Division 2013 Current Financial Condition
ES.4 100-YEAR ASSET MANAGEMENT / PROGRAM FUNDING REQUIREMENTS
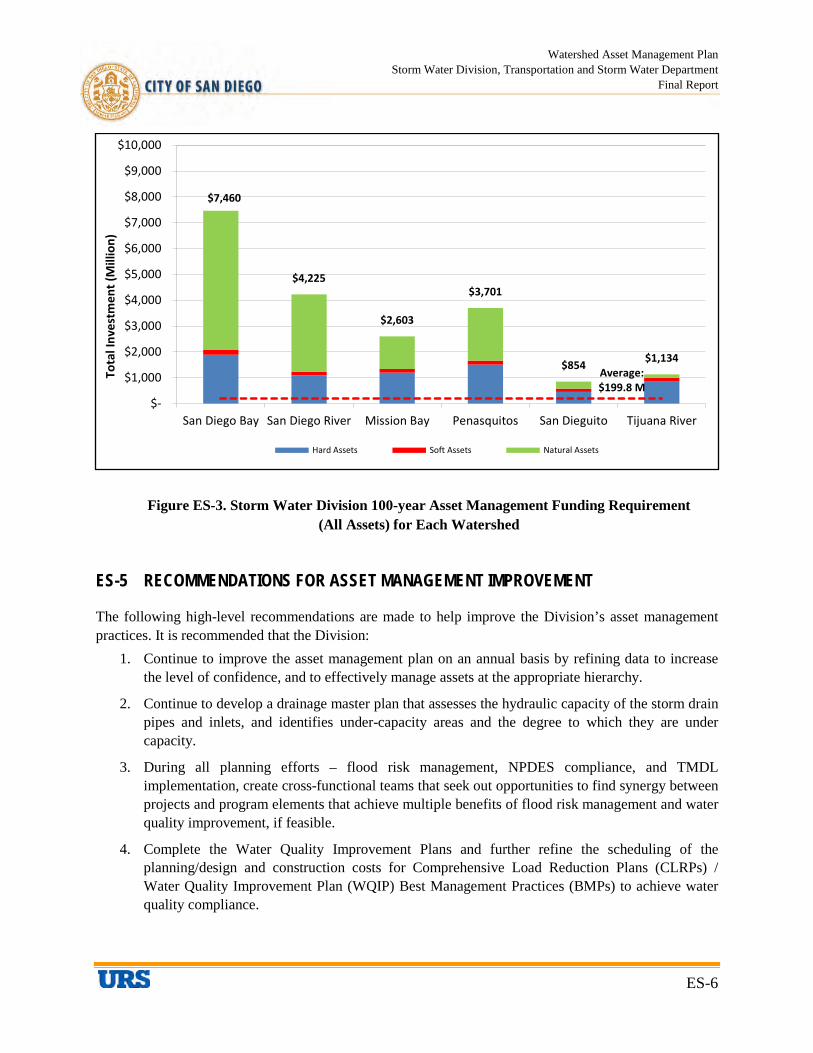
The Division’s 100-year program funding requirements are presented in Figure ES-3. The funding requirements are differentiated by asset type (hard, soft, and natural). The costs in the figure are the projected program costs in 2013 dollars for managing the assets in each watershed to achieve their LOS. Based on the analysis, it is estimated that the Division will need to invest $199.76 million per year to fully fund the projected 100-year program, capital, and operations and maintenance requirements. This is an increase of $165 million from the current FY13 budget of $34.5 million.
Penasquitos $625,182,282
Mission Bay $298,033,571 San Diego Bay
$471,631,896
San Diego River $308,668,338
San Dieguito $168,371,346
Tijuana River $117,285,927
2013 Current Financial Condition
Total: $1,989,173,360
Watershed Asset Management Plan Storm Water Division, Transportation and Storm Water Department
Final Report
ES-6
Figure ES-3. Storm Water Division 100-year Asset Management Funding Requirement (All Assets) for Each Watershed
ES-5 RECOMMENDATIONS FOR ASSET MANAGEMENT IMPROVEMENT
The following high-level recommendations are made to help improve the Division’s asset management practices. It is recommended that the Division:
1. Continue to improve the asset management plan on an annual basis by refining data to increase the level of confidence, and to effectively manage assets at the appropriate hierarchy.
2. Continue to develop a drainage master plan that assesses the hydraulic capacity of the storm drain pipes and inlets, and identifies under-capacity areas and the degree to which they are under capacity.
3. During all planning efforts – flood risk management, NPDES compliance, and TMDL implementation, create cross-functional teams that seek out opportunities to find synergy between projects and program elements that achieve multiple benefits of flood risk management and water quality improvement, if feasible.
4. Complete the Water Quality Improvement Plans and further refine the scheduling of the planning/design and construction costs for Comprehensive Load Reduction Plans (CLRPs) / Water Quality Improvement Plan (WQIP) Best Management Practices (BMPs) to achieve water quality compliance.
Average: $199.8 M
$7,460
$4,225
$2,603
$3,701
$854 $1,134
$-
$1,000
$2,000
$3,000
$4,000
$5,000
$6,000
$7,000
$8,000
$9,000
$10,000
San Diego Bay San Diego River Mission Bay Penasquitos San Dieguito Tijuana River
Tota
l Inv
estm
ent (
Mill
ion)
Hard Assets Soft Assets Natural Assets
Watershed Asset Management Plan Storm Water Division, Transportation and Storm Water Department
Final Report
ES-7
5. While doing routine field inspections, measure the following and collect the information for input into the GEO-SAP system:
• inlet size and type,
• pipe size, invert depths, and material,
• channel size, geometry, material, and depths.
6. Continue to conduct condition assessments of assets (e.g., outfalls) and incorporate the results into future WAMP updates.
7. Include right-of-way as assets in WAMP updates for use as potential future BMPs (e.g. green streets).
8. For mitigation sites developed in response to permitting or other environmental requirements, capture the mitigation sites as assets with specific levels of service tied to the mitigation requirements and project life cycle costs for such assets in the updated WAMPs.
9. Allocate O&M budgets by asset categories and watershed to the extent practicable. Set up a staff charging system that aligns staff time and expenses to specific assets. This will allow for better tracking of costs to perform O&M activities needed to maintain asset LOS.
10. Refine cost categories during future WAMP updates to allocate planning costs, which includes environmental document development and reviews, for capital and maintenance projects into operations and maintenance and program budgets rather than capital budgets, as appropriate.
11. Apply the WAMP to proactively drive future decisions and actions.
12. Document business process flows (e.g., Division budget planning process, etc.) and capture critical asset data and processes. By doing so, the Division will be able to identify areas of potential efficiency gains and specific resources needed to perform the activities.
13. Continue refining the asset inventory (i.e., specific assets) and apply the process down to the appropriate level of the asset hierarchy.
14. Develop and incorporate a process or structure to stratify CLRP activities that are associated with LOS 13a and 13b. Each CLRP activity should be established as a tertiary LOS.
15. Review high risk (based on BRE score) assets shown in each appendix and develop management strategies to promote efficiency to lower risk.
16. Identify assets where additional maintenance or rehabilitation would cost effectively extend that asset’s useful life. Adequate and timely maintenance will result in maintaining the asset’s level of service.
17. Educate and train staff on the implementation of the WAMP.
18. Perform a cost of service study and identify a dedicated funding source.
Watershed Asset Management Plan Storm Water Division, Transportation and Storm Water Department
Final Report
ES-8
This page intentionally left blank

Watershed Asset Management Plan Storm Water Division, Transportation and Storm Water Department
Final Report
1-1
SECTION 1 INTRODUCTION
With the business drivers of aging infrastructure, and limited budget and resources, the City of San Diego (City) Storm Water Division (Division) is making efforts to optimize its business processes and practices. A key approach that the Division has employed to optimize its business processes and practices was the integration of its planning, implementation and assessment of flood risk management and water quality protection programs.
In 2008, the City reorganized its Division to respond to a new National Pollutant Discharge Elimination System (NPDES) permit regulating discharges into and from its Municipal Separate Storm Sewer System (MS4). This reorganization increased the size of the Division more than four-fold and brought numerous operations previously under management by other City divisions into the Division, such as storm drain operations, and maintenance and street sweeping. The Division grew from being an organization primarily responsible for NPDES compliance program management and reporting to a Division responsible for managing City drainage and flood risk management systems.
Concurrently, the City began to transition to a zero-based budgeting approach. In this new framework, there were no historical budgets upon which future Division budgets could be based. Instead, Division staff is required to show justifications for each budget dollar requested each year.
In response to these fundamental changes, the Division developed an asset management program for managing its activities. This asset management program defined each activity the Division needed to conduct as a level of service (LOS) it was required to meet either under its NPDES permit, or through the expectations of citizens regarding functions of the storm drain system and the quality of water and related services to be maintained in streams, estuaries, and at beaches. This program provided a clear relationship between services enjoyed by the citizens of San Diego that were provided by the receiving waters and drainage system and the funding needs of the Division. This relationship allows the City to make rational budgeting decisions for this program and provides transparency for elected officials and citizens.
The application of asset management to storm water and watershed management is a way to successfully optimize use of resources, integrate municipal flood risk management and storm water quality management. This approach transparently justifies funding requirements and management decisions, and builds and transforms an organization into one that can sustainably manage storm water quality and drainage. This is being done on behalf of the municipality’s residents, businesses and other customers. The United States Environmental Protection Agency’s Office of Wastewater Management Asset Management Program was consulted during the process and endorsed the City’s process in applying asset management to storm water management.
The Division has worked through program evaluation processes to develop its core mission, goals, objectives, and LOS. The Division defined and categorized the assets it is required to manage such as streams and beaches. From these LOS, the Division evaluated the business processes and organizational capabilities needed to fulfill those LOS and identified the specific capabilities and projects that are required to fulfill the LOS required by regulators and desired by citizens. Division staff reached out to other City departments to establish the LOS and business processes where those divisions had roles. The
Watershed Asset Management Plan Storm Water Division, Transportation and Storm Water Department
Final Report
1-2
Division also reached out to key influential members of the public, and business, regulatory and environmental communities to vet the LOS, receive their feedback, and incorporate the feedback into the LOS so that the LOS would represent what citizen’s desire.
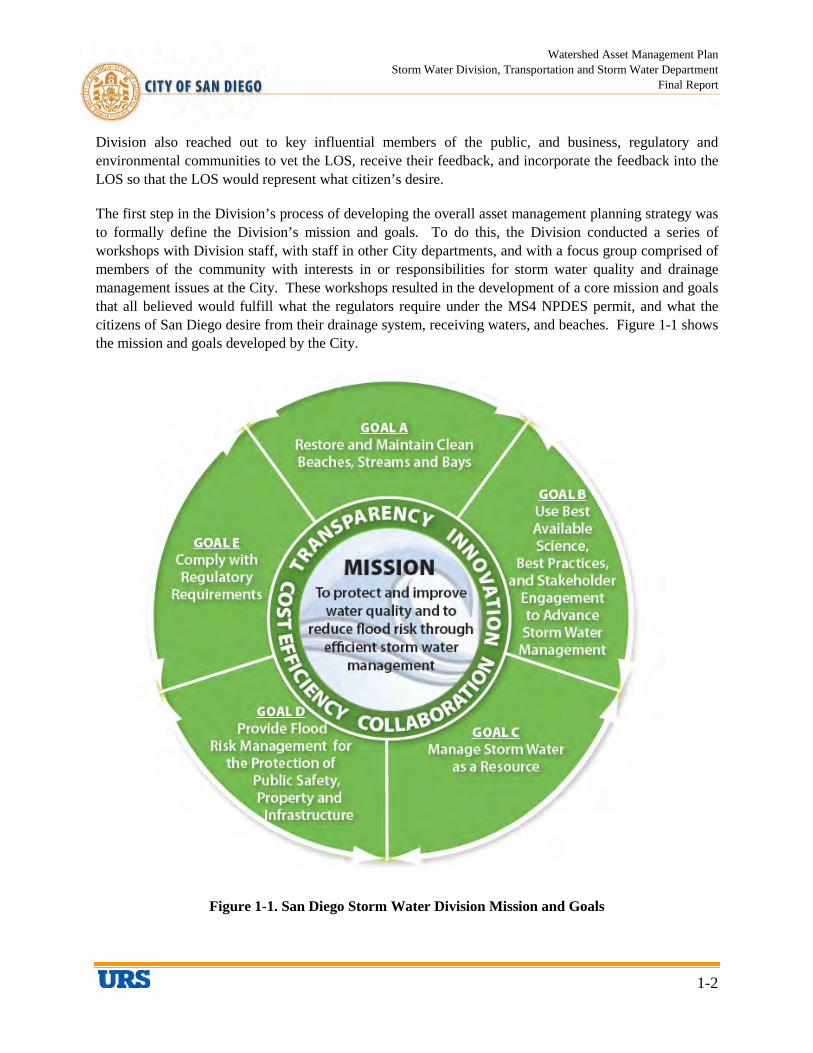
The first step in the Division’s process of developing the overall asset management planning strategy was to formally define the Division’s mission and goals. To do this, the Division conducted a series of workshops with Division staff, with staff in other City departments, and with a focus group comprised of members of the community with interests in or responsibilities for storm water quality and drainage management issues at the City. These workshops resulted in the development of a core mission and goals that all believed would fulfill what the regulators require under the MS4 NPDES permit, and what the citizens of San Diego desire from their drainage system, receiving waters, and beaches. Figure 1-1 shows the mission and goals developed by the City.
Figure 1-1. San Diego Storm Water Division Mission and Goals
Watershed Asset Management Plan Storm Water Division, Transportation and Storm Water Department
Final Report
1-3
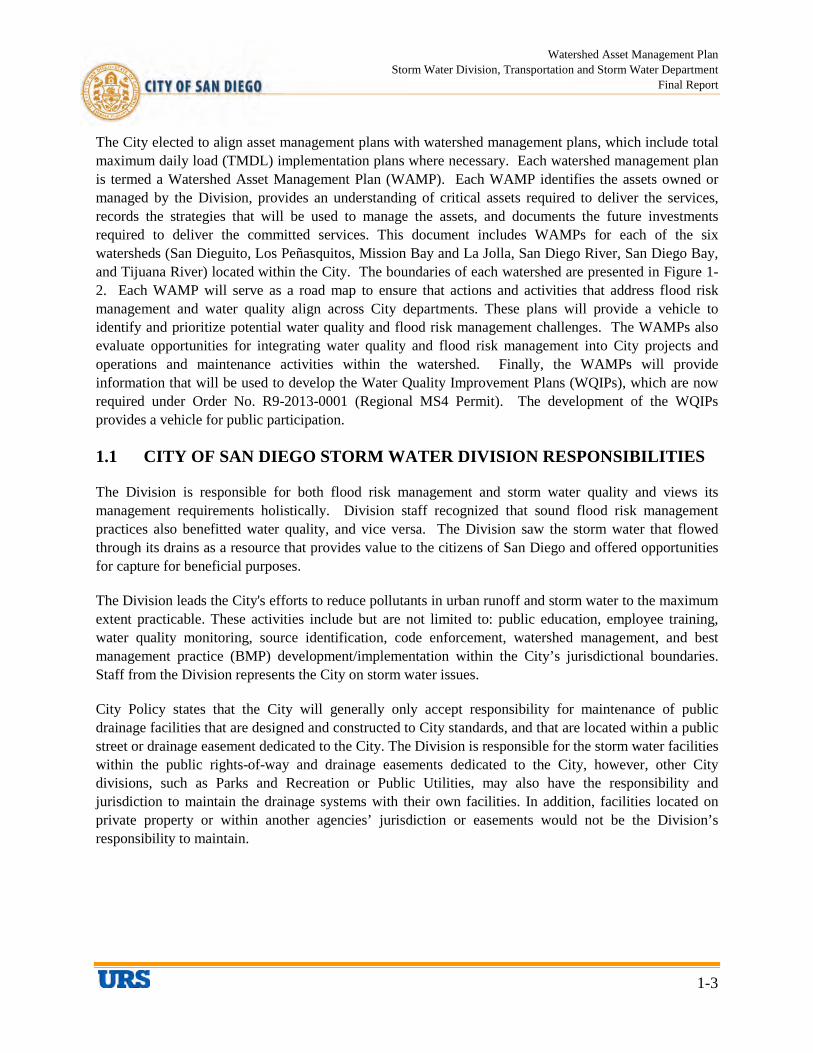
The City elected to align asset management plans with watershed management plans, which include total maximum daily load (TMDL) implementation plans where necessary. Each watershed management plan is termed a Watershed Asset Management Plan (WAMP). Each WAMP identifies the assets owned or managed by the Division, provides an understanding of critical assets required to deliver the services, records the strategies that will be used to manage the assets, and documents the future investments required to deliver the committed services. This document includes WAMPs for each of the six watersheds (San Dieguito, Los Peñasquitos, Mission Bay and La Jolla, San Diego River, San Diego Bay, and Tijuana River) located within the City. The boundaries of each watershed are presented in Figure 1-2. Each WAMP will serve as a road map to ensure that actions and activities that address flood risk management and water quality align across City departments. These plans will provide a vehicle to identify and prioritize potential water quality and flood risk management challenges. The WAMPs also evaluate opportunities for integrating water quality and flood risk management into City projects and operations and maintenance activities within the watershed. Finally, the WAMPs will provide information that will be used to develop the Water Quality Improvement Plans (WQIPs), which are now required under Order No. R9-2013-0001 (Regional MS4 Permit). The development of the WQIPs provides a vehicle for public participation.
1.1 CITY OF SAN DIEGO STORM WATER DIVISION RESPONSIBILITIES
The Division is responsible for both flood risk management and storm water quality and views its management requirements holistically. Division staff recognized that sound flood risk management practices also benefitted water quality, and vice versa. The Division saw the storm water that flowed through its drains as a resource that provides value to the citizens of San Diego and offered opportunities for capture for beneficial purposes.
The Division leads the City's efforts to reduce pollutants in urban runoff and storm water to the maximum extent practicable. These activities include but are not limited to: public education, employee training, water quality monitoring, source identification, code enforcement, watershed management, and best management practice (BMP) development/implementation within the City’s jurisdictional boundaries. Staff from the Division represents the City on storm water issues.
City Policy states that the City will generally only accept responsibility for maintenance of public drainage facilities that are designed and constructed to City standards, and that are located within a public street or drainage easement dedicated to the City. The Division is responsible for the storm water facilities within the public rights-of-way and drainage easements dedicated to the City, however, other City divisions, such as Parks and Recreation or Public Utilities, may also have the responsibility and jurisdiction to maintain the drainage systems with their own facilities. In addition, facilities located on private property or within another agencies’ jurisdiction or easements would not be the Division’s responsibility to maintain.
Watershed Asset Management Plan Storm Water Division, Transportation and Storm Water Department
Final Report
1-4
1.2 CITY OF SAN DIEGO STORM WATER DIVISION ORGANIZATIONAL CAPABILITIES
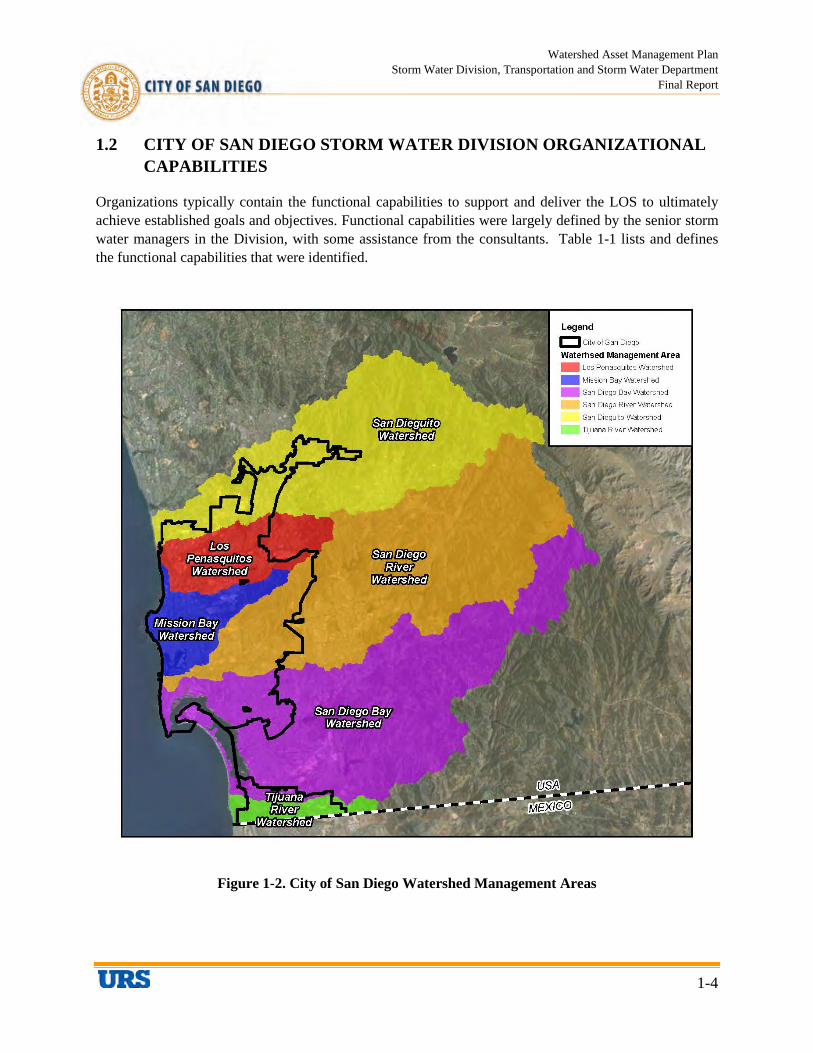
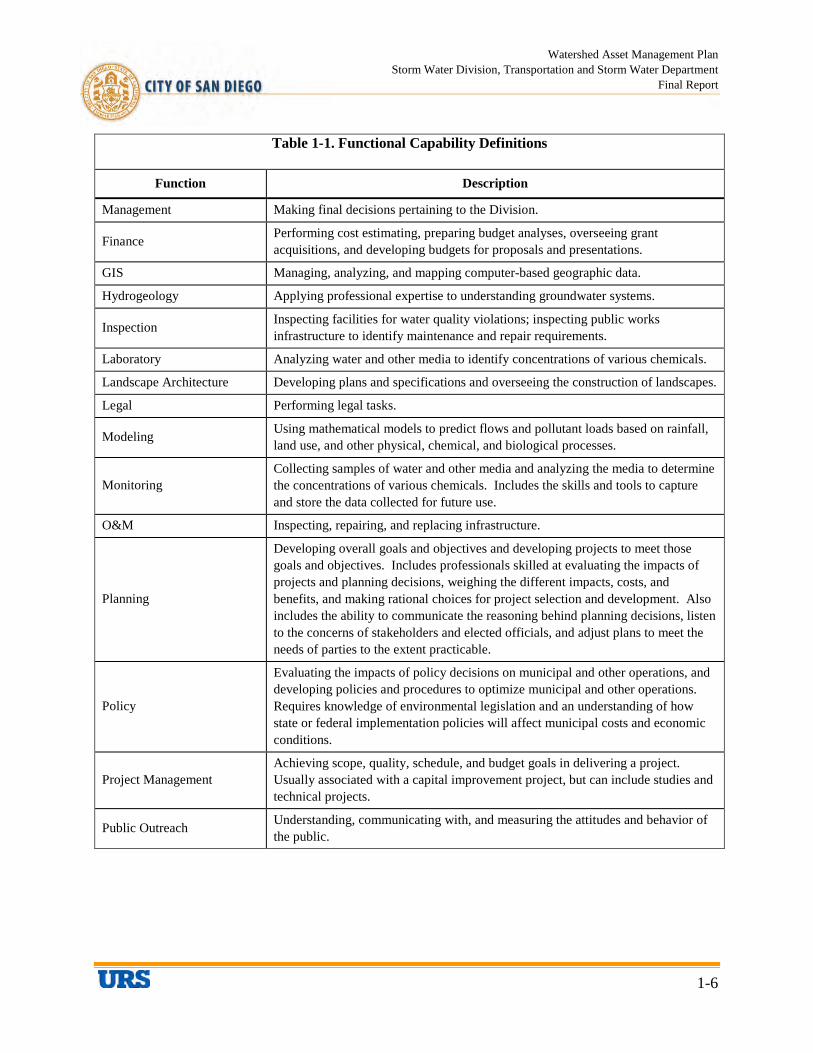
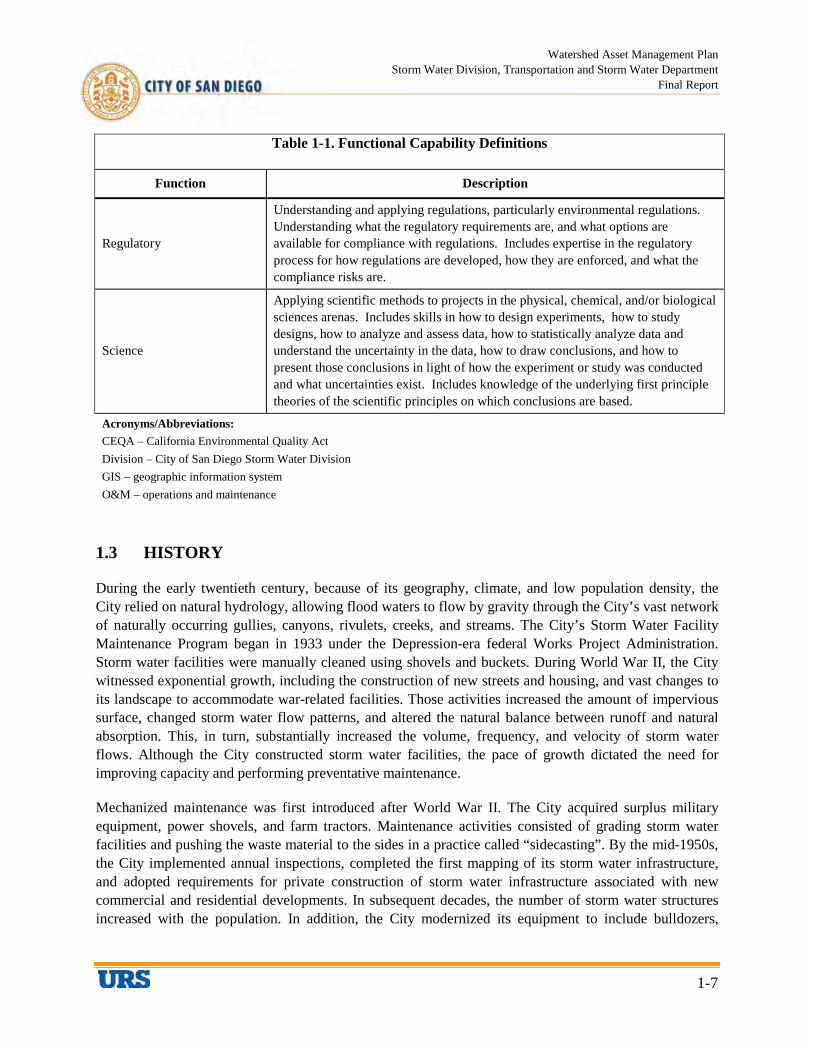
Organizations typically contain the functional capabilities to support and deliver the LOS to ultimately achieve established goals and objectives. Functional capabilities were largely defined by the senior storm water managers in the Division, with some assistance from the consultants. Table 1-1 lists and defines the functional capabilities that were identified.
Figure 1-2. City of San Diego Watershed Management Areas
Watershed Asset Management Plan Storm Water Division, Transportation and Storm Water Department
Final Report
1-5
The Division has already begun to assess and structure its functional capabilities to successfully implement the strategic intent. One key task was establishing a watershed coordinator for each watershed. The role of the watershed coordinator is to develop watershed management plans, establish watershed-specific budgets, and coordinate activities within the watershed (i.e., NPDES compliance, flood system maintenance, capital improvement planning, special studies and regulatory negotiations [e.g., TMDLs]). The watershed coordinator directs specific activities, develops the budgets needed for those activities within the watershed, and provides that budget to the program element managers to identify those program elements that are within the watershed. Based on the specific needs of the watershed, the watershed coordinator also is responsible for managing activities, such as recommending budgets for public outreach, performing inspections and enforcement activities, conducting monitoring, planning capital improvements, completing capital improvements, conducting street sweeping, and performing flood system maintenance. In addition to these responsibilities, the watershed coordinator is responsible for understanding how the elements fit together, interact with each other, and meet the LOS within the watershed. The coordinator is responsible for collecting the information to assess performance of the assets within the watershed against the LOS within the watershed and develop the budgets for the different program elements necessary to meet the LOS. The coordinator understands the risks within the watershed and is able to make cases for budgetary needs and make choices regarding where to spend the budget available within the watershed to minimize the watershed-specific risks.
Table 1-1. Functional Capability Definitions
Function Description
Administration Preparing reports, handling telephone calls, preparing correspondence, performing filing, routing, and office organization activities.
Asset Management Planning capital improvement programs.
Information Technology Servicing computers, laptops, computer servers, software licenses, specialized software, and specialized computer hardware.
Construction Management Providing engineering oversight and performing inspections of construction activities. Managing construction activities. Performing scheduling and implementing project controls.
Contract Management Developing, enforcing, and managing compliance with contracts.
Database Administration Performing data entry, database management, database programming, and data manipulation.
Dispatch Directing field crews regarding inspections, repairs, and emergencies.
Enforcement Issuing citations, processing citations and appeals, communicating with violators, and providing educational materials to violators.
Engineering
Completing designs, developing projects and standards for development and redevelopment, completing reviews of plans and water quality management plans, developing standards for construction controls, completing reviews and inspections of construction projects, and negotiating permit requirements associated with water quality controls.
Watershed Asset Management Plan Storm Water Division, Transportation and Storm Water Department
Final Report
1-6
Table 1-1. Functional Capability Definitions
Function Description
Management Making final decisions pertaining to the Division.
Finance Performing cost estimating, preparing budget analyses, overseeing grant acquisitions, and developing budgets for proposals and presentations.
GIS Managing, analyzing, and mapping computer-based geographic data.
Hydrogeology Applying professional expertise to understanding groundwater systems.
Inspection Inspecting facilities for water quality violations; inspecting public works infrastructure to identify maintenance and repair requirements.
Laboratory Analyzing water and other media to identify concentrations of various chemicals.
Landscape Architecture Developing plans and specifications and overseeing the construction of landscapes.
Legal Performing legal tasks.
Modeling Using mathematical models to predict flows and pollutant loads based on rainfall, land use, and other physical, chemical, and biological processes.
Monitoring Collecting samples of water and other media and analyzing the media to determine the concentrations of various chemicals. Includes the skills and tools to capture and store the data collected for future use.
O&M Inspecting, repairing, and replacing infrastructure.
Planning
Developing overall goals and objectives and developing projects to meet those goals and objectives. Includes professionals skilled at evaluating the impacts of projects and planning decisions, weighing the different impacts, costs, and benefits, and making rational choices for project selection and development. Also includes the ability to communicate the reasoning behind planning decisions, listen to the concerns of stakeholders and elected officials, and adjust plans to meet the needs of parties to the extent practicable.
Policy
Evaluating the impacts of policy decisions on municipal and other operations, and developing policies and procedures to optimize municipal and other operations. Requires knowledge of environmental legislation and an understanding of how state or federal implementation policies will affect municipal costs and economic conditions.
Project Management Achieving scope, quality, schedule, and budget goals in delivering a project. Usually associated with a capital improvement project, but can include studies and technical projects.
Public Outreach Understanding, communicating with, and measuring the attitudes and behavior of the public.
Watershed Asset Management Plan Storm Water Division, Transportation and Storm Water Department
Final Report
1-7
Table 1-1. Functional Capability Definitions
Function Description
Regulatory
Understanding and applying regulations, particularly environmental regulations. Understanding what the regulatory requirements are, and what options are available for compliance with regulations. Includes expertise in the regulatory process for how regulations are developed, how they are enforced, and what the compliance risks are.
Science
Applying scientific methods to projects in the physical, chemical, and/or biological sciences arenas. Includes skills in how to design experiments, how to study designs, how to analyze and assess data, how to statistically analyze data and understand the uncertainty in the data, how to draw conclusions, and how to present those conclusions in light of how the experiment or study was conducted and what uncertainties exist. Includes knowledge of the underlying first principle theories of the scientific principles on which conclusions are based.
Acronyms/Abbreviations: CEQA – California Environmental Quality Act Division – City of San Diego Storm Water Division GIS – geographic information system O&M – operations and maintenance
1.3 HISTORY
During the early twentieth century, because of its geography, climate, and low population density, the City relied on natural hydrology, allowing flood waters to flow by gravity through the City’s vast network of naturally occurring gullies, canyons, rivulets, creeks, and streams. The City’s Storm Water Facility Maintenance Program began in 1933 under the Depression-era federal Works Project Administration. Storm water facilities were manually cleaned using shovels and buckets. During World War II, the City witnessed exponential growth, including the construction of new streets and housing, and vast changes to its landscape to accommodate war-related facilities. Those activities increased the amount of impervious surface, changed storm water flow patterns, and altered the natural balance between runoff and natural absorption. This, in turn, substantially increased the volume, frequency, and velocity of storm water flows. Although the City constructed storm water facilities, the pace of growth dictated the need for improving capacity and performing preventative maintenance.
Mechanized maintenance was first introduced after World War II. The City acquired surplus military equipment, power shovels, and farm tractors. Maintenance activities consisted of grading storm water facilities and pushing the waste material to the sides in a practice called “sidecasting”. By the mid-1950s, the City implemented annual inspections, completed the first mapping of its storm water infrastructure, and adopted requirements for private construction of storm water infrastructure associated with new commercial and residential developments. In subsequent decades, the number of storm water structures increased with the population. In addition, the City modernized its equipment to include bulldozers,
Watershed Asset Management Plan Storm Water Division, Transportation and Storm Water Department
Final Report
1-8
excavators, backhoes, and skid-steers to provide more efficient and flexible maintenance methods. The practice of side-casting was also replaced with disposal of waste to landfills.
In the mid-1990s, after a state-wide initiative to educate local governments regarding the environmental regulations associated with maintaining urban storm water infrastructure, the City embarked on its first application for a master storm water facility maintenance permit. In 2002, this effort was postponed after the City and regulatory agencies recognized that a programmatic approach to storm water maintenance would provide a more thorough and comprehensive analysis of the environmental impacts of the proposed program.
The federal Clean Water Act (CWA), originally enacted in 1972, was amended in 1987 to address urban runoff. One requirement of the amendment was that many municipalities throughout the United States were obligated for the first time to obtain NPDES permits for discharges of urban runoff from their MS4s. In response to the CWA amendment (and the pending federal NPDES regulations that would implement the amendment), in July 1990, the San Diego Regional Water Quality Control Board (RWQCB) issued a municipal storm water permit (Order No. 90-42) to the San Diego Region including the City of San Diego for its urban runoff discharges.
Order No. 90-42 was due for renewal in July 1995, but was administratively extended pursuant to federal law because of limited RWQCB resources. Order No. 90-42 was not reissued by the RWQCB until February 21, 2001. At that time, it was reissued as Order No. 2001-01. The regulatory approach incorporated into Order No. 2001-01 was a significant departure from the regulatory approach incorporated into Order No. 90-42. Whereas Order No. 90-42 included broad nonspecific requirements in order to provide the Copermitees1 with the maximum amount of flexibility in implementing its programs, Order No. 2001-01 identified detailed specific requirements that outlined the minimum level of implementation required for the Copermittees’ (including the City’s) programs.
Since the adoption of Order No. 2001-01, and despite the subsequent legal actions, the City’s storm water program has expanded dramatically. Audits of the City’s programs by the RWQCB revealed that the City’s jurisdictional program was compliant, with few exceptions with the Order. Efforts currently being conducted on a regular basis by the City, which were not conducted on a widespread basis prior to adoption of Order No. 2001-01, include:
• conducting construction site storm water inspections,
1 City of Carlsbad City of Escondido City of Poway County of San Diego City of Chula Vista City of Imperial Beach City of San Diego San Diego Unified Port District
City of Coronado City of La Mesa City of San Marcos San Diego County Regional Airport Authority
City of Del Mar City of Lemon Grove City of Santee City of El Cajon City of National City City of Solana Beach City of Encinitas City of Oceanside City of Vista

Watershed Asset Management Plan Storm Water Division, Transportation and Storm Water Department
Final Report
1-9
• conducting industrial and commercial facility storm water inspections,
• conducting municipal facility storm water inspections,
• managing storm water quality from new development,
• developing BMP requirements for existing development,
• assessing storm water program effectiveness, and
• implementing post-construction BMPs for new development and redevelopment projects meeting priority development criteria.
In January 2007, Order No. R9-2007-0001 (Regional MS4 Permit) was adopted and continued to include more detailed requirements to be implemented by each Copermittee’s jurisdictional runoff management program. This permit also include requirements to further emphasize a watershed management approach and for more coordination among jurisdictional runoff management programs. In addition, the permit included more requirements for assessing the effectiveness of the runoff management programs being implemented by the Copermittees. The intent of the inclusion of additional requirements was to enhance and better define elements of the permit that were expected to be incorporated into the iterative process for managing runoff from each Copermittee’s jurisdiction and within the watersheds of the San Diego Region.
Order No. R9-2007-0001 included several new and emerging approaches for managing storm water runoff and discharges. Low impact development (LID) requirements were included for development and significant redevelopment to reduce pollutants in storm water runoff from sites through more natural processes such as infiltration and biofiltration closer to the source, rather than utilizing conventional mechanical end-of-pipe treatment systems. Hydrograph modification (hydromodification) management requirements were also included to mitigate the potential for increased erosion in receiving waters due to increased runoff rates and durations often caused by development and increased impervious surfaces.
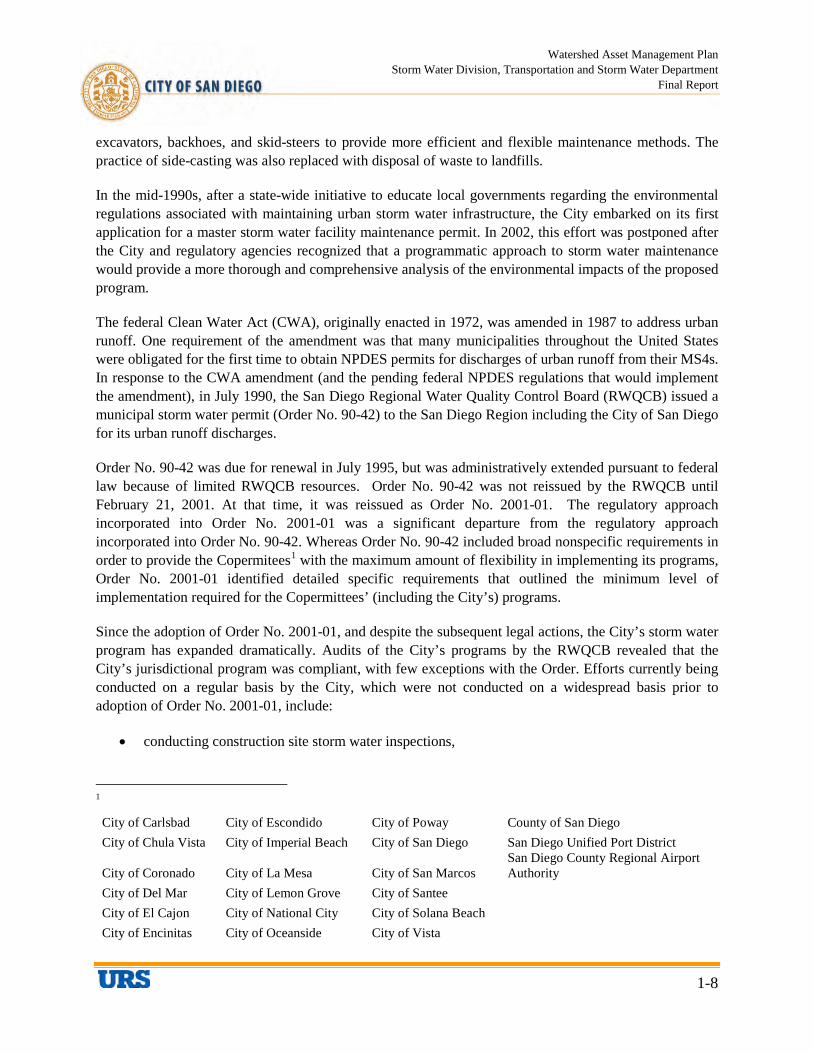
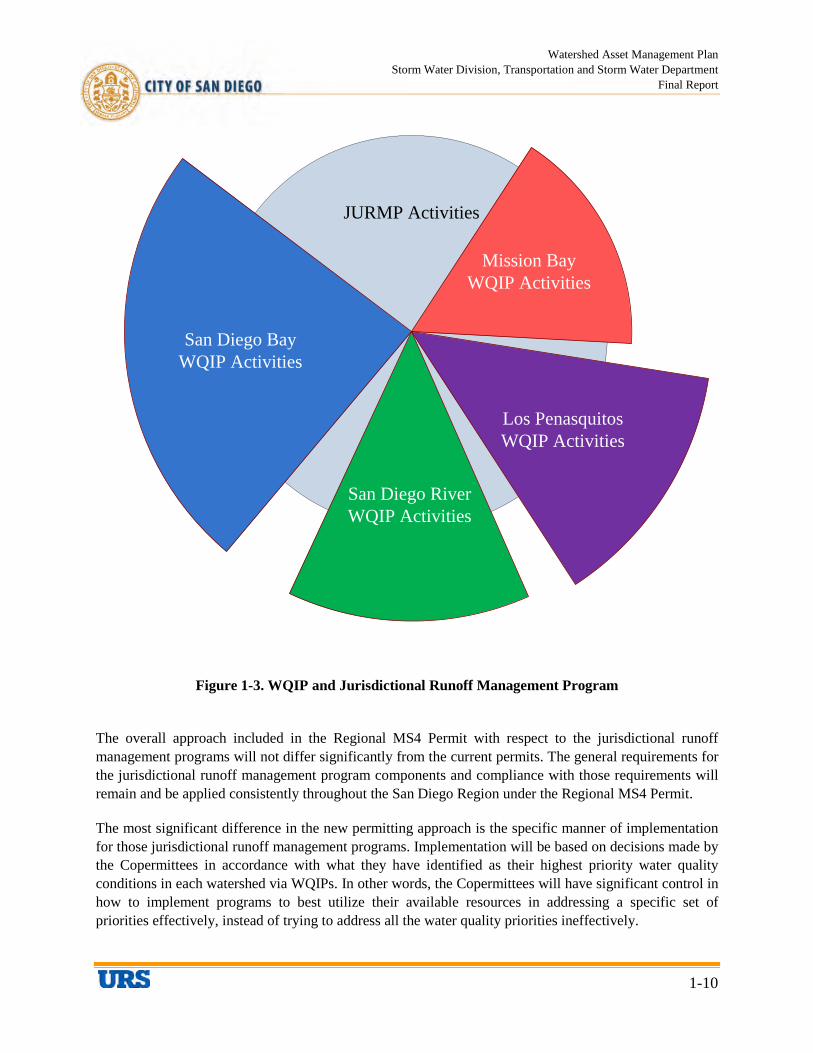
On May 8, 2013, Order No. R9-2013-0001 (Regional MS4 Permit) was adopted and shifts the focus of the permit requirements from a minimum level of actions to be implemented by the Copermittees (including San Diego, Orange, and Riverside County Copermittees) to identifying outcomes to be achieved by those actions. The Regional MS4 Permit represents an important paradigm shift in the approach for MS4 permits within the San Diego Region. The focus has shifted through the jurisdictional runoff management programs to the development and implementation of Water Quality Improvement Plans (WQIPs). A WQIP will be developed and implemented for each Watershed Management Area. The Copermittees whose jurisdiction resides within the Watershed Management Area will implement the WQIP through their jurisdictional runoff management programs. Figure 1-3 depicts the relationship of the WQIPs and the jurisdictional runoff management program.
Watershed Asset Management Plan Storm Water Division, Transportation and Storm Water Department
Final Report
1-10
JURMP Activities
Mission Bay WQIP Activities
Los PenasquitosWQIP Activities
San Diego BayWQIP Activities
San Diego River WQIP Activities
Figure 1-3. WQIP and Jurisdictional Runoff Management Program
The overall approach included in the Regional MS4 Permit with respect to the jurisdictional runoff management programs will not differ significantly from the current permits. The general requirements for the jurisdictional runoff management program components and compliance with those requirements will remain and be applied consistently throughout the San Diego Region under the Regional MS4 Permit.
The most significant difference in the new permitting approach is the specific manner of implementation for those jurisdictional runoff management programs. Implementation will be based on decisions made by the Copermittees in accordance with what they have identified as their highest priority water quality conditions in each watershed via WQIPs. In other words, the Copermittees will have significant control in how to implement programs to best utilize their available resources in addressing a specific set of priorities effectively, instead of trying to address all the water quality priorities ineffectively.
Watershed Asset Management Plan Storm Water Division, Transportation and Storm Water Department
Final Report
1-11
The Copermittees are given the responsibility of identifying their highest priority water quality conditions that they intend to address in each watershed’s WQIP. The Copermittees will develop goals that can be used to measure and demonstrate progress or improvements toward addressing those priorities. In addition to the goals, the Copermittees will provide a schedule for achieving the goals for those highest priorities. The measurement of progress toward achieving the goals for those highest priorities requires a better defined and more focused program of monitoring and assessment than under prior permits.
The monitoring and assessment program must be designed to inform the Copermittees of their progress, and the need for modifications in their WQIPs and schedules to achieve their goals to improve water quality. The monitoring and assessment program requirements will have a more central role in the Regional MS4 Permit than in earlier permits. The monitoring and assessment requirements must also be designed to enable the Copermittees to focus and direct their efforts in implementing their WQIPs toward their stated desired outcomes to improve the quality of receiving waters and/or discharges from the MS4s.
By providing an MS4 permit that allows the Copermittees to make more decisions about how to utilize and focus their resources, along with a better defined monitoring and assessment program to inform their water quality management decisions, the Copermittees will have the opportunity to:
1) Plan strategically. The Copermittees have the ability to identify their available resources and develop and implement long term plans that can organize, collect, and use those resources in the most strategically advantageous and efficient manner possible. This ability to develop long term plans will allow the Copermittees to focus and utilize their resources in a more concerted way over the short term and long term to address specific water quality priorities through stated desired outcomes.
2) Manage adaptively. The Copermittees have the ability to modify their plans as additional information and data are collected from the monitoring and assessment programs. The Copermittees’ plans may require modifications to the programs, priorities, goals, strategies, and/or schedules in order for the Copermittees to achieve a stated desired outcome.
3) Identify synergies. The Copermittees have more flexibility to identify efficiencies within and among their jurisdictional runoff management programs as the strategies are developed and implemented to increase the Copermittees’ collective effectiveness. The Copermittees must also be able to identify and utilize resources available from other agencies and entities to further augment and enhance their jurisdictional runoff management programs and/or to collectively work with those other agencies and entities toward achieving a stated desired outcome.
The Regional MS4 Permit requirements will provide the Copermittees the flexibility and responsibility to decide what actions will be necessary to achieve an outcome that is tailored and designed by the Copermittees to improve specific prioritized water quality conditions. The San Diego Water Board expects the approach of the Regional MS4 Permit to give the Copermittees a greater sense of ownership for restoring the quality of receiving waters in the San Diego Region by becoming an integral part of the decision making process in identifying water quality conditions to be addressed, as well as determining the best use of their resources.
Watershed Asset Management Plan Storm Water Division, Transportation and Storm Water Department
Final Report
1-12
1.4 STORM DRAIN SYSTEM
The City’s storm water system conveys drainage flows from impervious surfaces to provide flood risk management for the protection of life and property of its citizens. The storm water system also conveys urban runoff associated with development, such as irrigated landscaped areas, driveways, and streets. This runoff can flow into the drainage system and ultimately to the ocean. Storm water facilities include, but are not limited to, a network of underground storm drain pipes, culverts, outfalls/inlets, detention basins, pump stations, and open flood risk management channels.
During rain events or wet conditions, storm water and urban runoff is typically collected via drains from impervious surfaces, such as buildings, rooftops, paved driveways, and improved streets, and is conveyed downstream via the City’s storm water system. When runoff cannot infiltrate into the ground, precipitation will follow drainage patterns, typically to the lowest point, collecting contaminants, sediment or debris along the way. Storm water and urban runoff can also erode unstable soil, carrying sediment downstream. Typically, urban runoff from development sources, such as irrigated landscaped areas, is the surface water collected during dry weather that also flows through the storm water system. Urban runoff results from human activities rather than the natural hydrological cycle. Common urban runoff contaminants include: oil and grease from parking lots; pesticides, herbicides, and fertilizers from lawns and landscaped areas; soapy water from carpet cleaning and restaurant washdown; and vehicle washing; sediment from construction projects; trash such as cigarette butts and bottles; and many other sources associated with everyday activities.
1.5 ASSET MANAGEMENT PLANNING
The Water Environment Research Foundation2 has identified seven core elements that comprise an asset management plan. The seven elements, shown in Figure 1-4, include: 1) lifecycle processes and practices, 2) information systems, 3) data and knowledge, 4) people issues, 5) commercial tactics, 6) organizational issues, and 7) the total asset management plan. Balance of these core elements is required to develop a successful and sustainable asset management program.
2 The Water Environment Research Foundation (WERF) is a non-profit organization, founded in 1989, that operates with funding from subscribers and the federal government. WERF is the leading independent research organization in the United States dedicated to finding solutions to wastewater and storm water issues.

Watershed Asset Management Plan Storm Water Division, Transportation and Storm Water Department
Final Report
1-13
Figure 1-4. Seven Core Elements of Asset Management
Watershed Asset Management Plan Storm Water Division, Transportation and Storm Water Department
Final Report
1-14
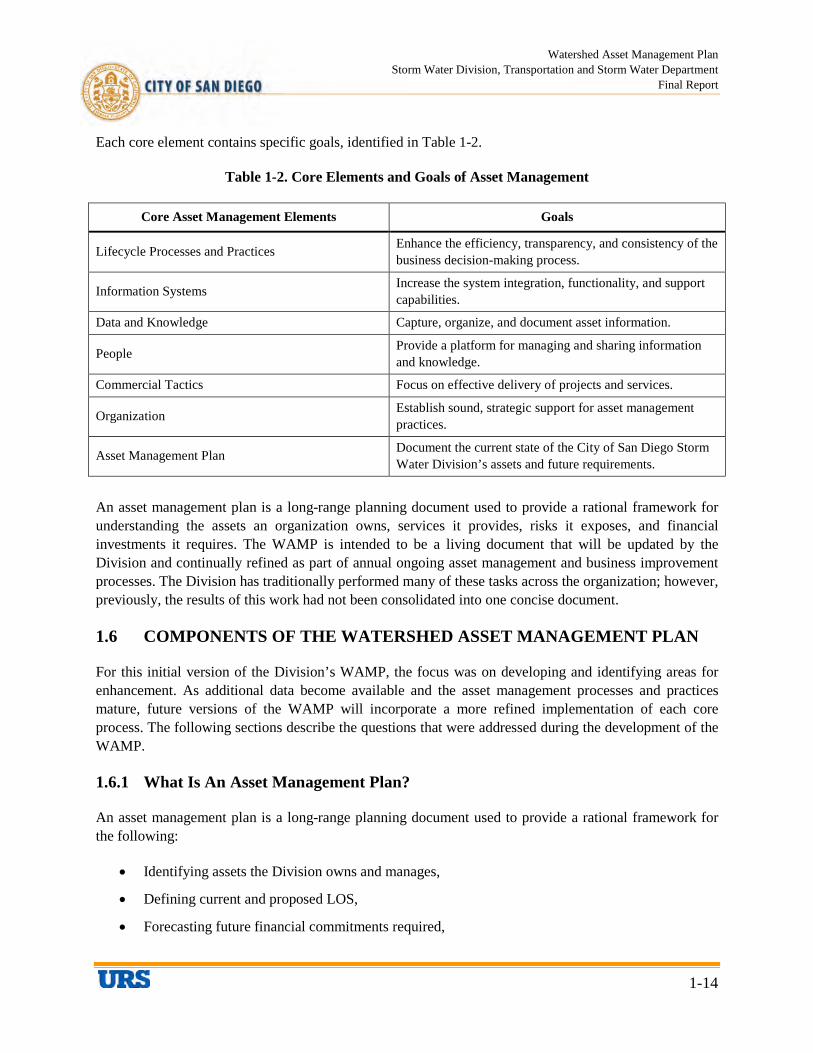
Each core element contains specific goals, identified in Table 1-2.
Table 1-2. Core Elements and Goals of Asset Management
Core Asset Management Elements Goals
Lifecycle Processes and Practices Enhance the efficiency, transparency, and consistency of the business decision-making process.
Information Systems Increase the system integration, functionality, and support capabilities.
Data and Knowledge Capture, organize, and document asset information.
People Provide a platform for managing and sharing information and knowledge.
Commercial Tactics Focus on effective delivery of projects and services.
Organization Establish sound, strategic support for asset management practices.
Asset Management Plan Document the current state of the City of San Diego Storm Water Division’s assets and future requirements.
An asset management plan is a long-range planning document used to provide a rational framework for understanding the assets an organization owns, services it provides, risks it exposes, and financial investments it requires. The WAMP is intended to be a living document that will be updated by the Division and continually refined as part of annual ongoing asset management and business improvement processes. The Division has traditionally performed many of these tasks across the organization; however, previously, the results of this work had not been consolidated into one concise document.
1.6 COMPONENTS OF THE WATERSHED ASSET MANAGEMENT PLAN
For this initial version of the Division’s WAMP, the focus was on developing and identifying areas for enhancement. As additional data become available and the asset management processes and practices mature, future versions of the WAMP will incorporate a more refined implementation of each core process. The following sections describe the questions that were addressed during the development of the WAMP.
1.6.1 What Is An Asset Management Plan?
An asset management plan is a long-range planning document used to provide a rational framework for the following:
• Identifying assets the Division owns and manages,
• Defining current and proposed LOS,
• Forecasting future financial commitments required,
Watershed Asset Management Plan Storm Water Division, Transportation and Storm Water Department
Final Report
1-15
• Analyzing the business risk exposure, and
• Linking business objectives and service levels.
An asset management plan consolidates and documents information currently available for infrastructure assets and service delivery programs. An asset management plan is a written representation of the intended asset management programs for the infrastructure assets.
1.6.2 Why Is An Asset Management Plan Needed?
Some of the Division’s infrastructure assets are beginning to reach maturity. Aging assets are reaching a time in which they are beginning to fail, and, in some cases, are failing with significant consequences. In years past, there were far fewer assets to manage. Assets were often visible and younger. However, with the rapid development that has occurred in the City, the number of assets required to meet the growing demand has increased exponentially. As a result, assets can no longer be managed effectively by relying on the historical management practices. Operation and maintenance (O&M) staff are often faced with having to manage in a reactive mode.
In order to improve management practices, asset management helps to answer the following five core questions:
1. What do we own / manage?
2. What is its required level of service?
3. Which assets are critical?
4. What are my optimized management strategies?
5. What do I need to do to fund it?
An asset management plan is intended to answer the preceding questions. An asset management plan enables an organization to have the information required to make the right decision, at the right time, at the right cost, for the right reason.
By implementing core asset management processes, the Division will gain knowledge of the assets owned, the remaining useful life to manage, the amount of investment required, and the business risk it faces. The WAMP will provide the Division with a foundation to promote sustainable management practices.
1.6.3 How Can An Asset Management Plan Be Applied?
The key benefits of an asset management plan are listed below.
Road map for future asset commitments. Develop a funding model to estimate the revenues required to manage infrastructure at the established LOS.

Watershed Asset Management Plan Storm Water Division, Transportation and Storm Water Department
Final Report
1-16
Effective use of existing funds. Optimize the use of current funds to achieve the best value from both capital and O&M budgets.
Future asset requirements. Identify future long-term projects and strategies to deliver the most cost-effective service option from a lifecycle asset management perspective.
Risk identification. Identify future business risks impacting Division from both LOS and cost-of-service perspectives.
Developing an asset management requires that the following activities be completed and mastered:
1. Identify assets where rehabilitation or replacement will be cost effective,
2. Understand and manage critical assets,
3. Focus maintenance efforts using risk,
4. Optimize maintenance and capital needs to reduce the life-cycle cost of ownership, and
5. Understand the long-term future renewal, rehabilitation and replacement expenditure requirements of the Division and assist in the development of plans to mitigate the various peak expenditures identified.
1.6.4 Storm Water Division Assets
Under the principles of asset management, a utility or municipality is viewed as a collection of assets that are managed to meet goals, objectives, and LOS at the lowest possible lifecycle costs. This management approach leads to predictability, transparency, and a clear relationship between funding needs, generally in the form of rates, fees, or taxes, and services provided by the utility. Division assets range from natural to manmade and from hard structural assets to non-structural assets, which are important for providing the desired LOS, but are not viewed as a constructed or capital item.
The basic definition of an asset is that it must be something that the Division has to manage to meet goals, objectives, and LOS, and that it:
• Does not have to be owned by the Division,
• Does not to have to be physical or touchable, but
• Does have to be overseen in some part by the Division, in terms of its condition.
After brainstorming, it was determined that the Division is tasked with managing more than the storm drain system, primarily due to the goals of restoring and maintaining cleaner beaches, streams and bays. Also, the Division must comply with water quality regulatory requirements, which requires the coordination of numerous items, such as relationships, regulatory policy, and behaviors.
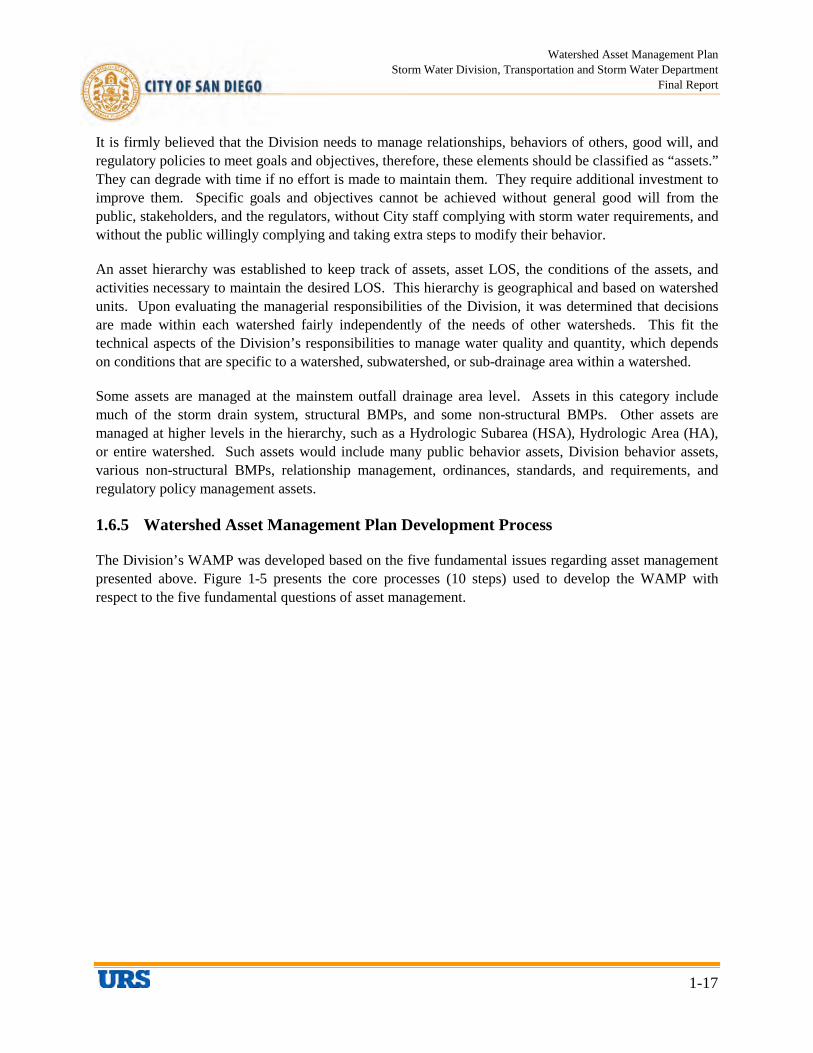
Watershed Asset Management Plan Storm Water Division, Transportation and Storm Water Department
Final Report
1-17
It is firmly believed that the Division needs to manage relationships, behaviors of others, good will, and regulatory policies to meet goals and objectives, therefore, these elements should be classified as “assets.” They can degrade with time if no effort is made to maintain them. They require additional investment to improve them. Specific goals and objectives cannot be achieved without general good will from the public, stakeholders, and the regulators, without City staff complying with storm water requirements, and without the public willingly complying and taking extra steps to modify their behavior.
An asset hierarchy was established to keep track of assets, asset LOS, the conditions of the assets, and activities necessary to maintain the desired LOS. This hierarchy is geographical and based on watershed units. Upon evaluating the managerial responsibilities of the Division, it was determined that decisions are made within each watershed fairly independently of the needs of other watersheds. This fit the technical aspects of the Division’s responsibilities to manage water quality and quantity, which depends on conditions that are specific to a watershed, subwatershed, or sub-drainage area within a watershed.
Some assets are managed at the mainstem outfall drainage area level. Assets in this category include much of the storm drain system, structural BMPs, and some non-structural BMPs. Other assets are managed at higher levels in the hierarchy, such as a Hydrologic Subarea (HSA), Hydrologic Area (HA), or entire watershed. Such assets would include many public behavior assets, Division behavior assets, various non-structural BMPs, relationship management, ordinances, standards, and requirements, and regulatory policy management assets.
1.6.5 Watershed Asset Management Plan Development Process
The Division’s WAMP was developed based on the five fundamental issues regarding asset management presented above. Figure 1-5 presents the core processes (10 steps) used to develop the WAMP with respect to the five fundamental questions of asset management.
Watershed Asset Management Plan Storm Water Division, Transportation and Storm Water Department
Final Report
1-18
Figure 1-5. Core Processes for Asset Management Plan Development
1.6.6 Watershed Asset Management Plan Outline
An outline and a brief description of each section of the Division’s WAMP are presented below. The main body of this document describes the methodology and approach that was used. Watershed-specific asset management plans are provided in Appendices A through F.
Acknowledgement. Recognizes the individuals involved in creating this WAMP.
Glossary of Terms. Lists terminology used in this WAMP and provides definitions.
Executive Summary. Emphasizes the key issues contained in the body of the Asset Management Plan.
Section 1: Introduction. Explains the Storm Water Division’s overall mission and goals, and for what the WAMP is to be used. It describes the Division’s organizational structure and some of the roles and responsibilities of different positions with respect to using the WAMP, updating the WAMP, and managing the assets.
Develop Asset
Register
Failure Modes: • Capacity • Level of Service • Physical Mortality • Financial Efficiency
Future Funding Strategy
Determine Physical & Economic
Residual Lives
Collect Historic Costs &
Determine Current Replacement Cost
Set Current & Future Levels
of Service
Develop Appropriate
Maintenance & Operations Plans
Develop Appropriate
Capital Program
Establish Risk Ratings
(Relative Criticality)
Build the AMP
What is current state of our assets? What is my required level of service? Which assets are critical to sustained performance?
What are my best operations and maintenance and Capital Improvement Program investment strategies? What is my best long- term funding strategy?
Expected Life Tables;
Decay Curves Valuation;
Life-Cycle Costing
System Layout; Data Hierarchy; Data Standards; Data Inventory
Demand Analysis; Balanced Scorecard; Performance Metrics
Condition Assess Protocol,
Rating Methodologies
Confidence Level Rating; Capital Improvement Program Validation; Strategic Validation
Failure Mode Effects and Criticality Analysis;
Business Risk Exposure; Delphi Technique
Root Cause; Reliability Centered Maintenance;
Optimal Renewal Decision Making,
Predictive Maintenance
Renewal Annuity Asset Mgt Plan,
Polices & Strategy, Annual Budget

Watershed Asset Management Plan Storm Water Division, Transportation and Storm Water Department
Final Report
1-19
Section 2: Asset Inventory – “What Do We Own?” Describes the asset hierarchy, presents the methods employed to obtain asset information, and the general assumptions used where information was not available. An inventory summary of the assets in each watershed is presented in the respective watershed-specific appendix.
Section 3: Asset Management Costs / Program Funding Requirements - “What Is It Worth?” presents the total costs for managing assets and the methods used to estimate the costs. The estimated costs for the assets of each watershed are presented in the respective watershed-specific appendix.
Section 4: What Is Its Condition? Describes the methods used to determine the assets’ condition. For an asset to fail, it must either reach the end of its useful life (mortality failure mode), not meet the necessary ability to convey adequate flows (capacity failure mode), not meet other requirements (LOS failure mode), or be less expensive on a life cycle cost basis to manage using a different management strategy (financial failure mode) The mortality and capacity failure modes generally apply only to hard assets because soft and natural assets generally do not have a defined useful life or required capacity to convey flows. Hard assets can also fail under the LOS and financial failure modes. The failure mode that results in the highest risk as estimated by multiplying the consequence of failure times the probability of failure is the failure mode that drives asset management decisions and expenditures. The LOS and financial failure modes are the only failure modes that would apply to natural and soft assets. The actual conditions of assets in each watershed are presented in the respective watershed-specific appendix.
Section 5: What Needs To Be Done? Documents the current LOS that, to the best knowledge of the Division, the regulators require and citizens desire from the assets.
Section 6: When Do We Need to Do It? Details the business risk exposure the assets present to the Division and provides the results of risk mapping.
Section 7: How Much Will It Cost? Presents long-term costs, the cost assumptions made, and the cost models that were used. The actual costs estimated for each watershed are presented in the respective watershed-specific appendix.
Section 8: Funding Strategies – “How Will We Pay for It? Discusses various budgetary scenarios and general funding strategies.
Section 9: Improvement Plan - presents the confidence level rating, which measures the current asset management practice, and identifies and prioritizes future improvements.
Section 10: Recommendations - provides recommendations for the assets within each watershed regarding the actions to be taken and projects to be completed to manage the assets to achieve the required LOS.
References: Includes any reference documents necessary to support the WAMP.
Appendices: Documents the watershed-specific asset management plans.
Watershed Asset Management Plan Storm Water Division, Transportation and Storm Water Department
Final Report
1-20
1.7 DOCUMENT UPDATES
It is anticipated that this document will be a living document. Feedback from customers, other City departments, regulators, and/or elected officials over time may result in an adjustment to the Division’s mission, goals, objectives, and LOS. The intent of the WAMP development and implementation process is for routine reviews to occur, involving feedback from the Division, in order to allow identification of and adjustment to business practices and policies to be performed as needed. These adjustments will then cascade into other planning efforts. Typically, an annual review of this document will take place just prior to or in conjunction with issuance of the Division’s annual budget updates.
Watershed Asset Management Plan Storm Water Division, Transportation and Storm Water Department
Final Report
2-1
SECTION 2 ASSET INVENTORY – “WHAT DO WE OWN / MANAGE?”
In order to determine the current state of assets, the Division needs to ask and find answers to the following questions:
1. What do I own and manage?
2. Where is it?
3. What condition is it in?
4. What is its remaining useful life?
5. What is its replacement cost?
This section focuses on the first two questions. Later sections will present the methodology used and finding to help identify the current state of the Division’s assets.
Determination of the current state requires knowledge of the assets owned and managed. This step starts with defining an asset and consolidating them in a central location (asset register). With the assets in an asset register, the assets are grouped based on asset types and organized using a standard framework (asset hierarchy). The Division is responsible for the activities identified below.
• Perform O&M activities, and construct improvements to the City’s storm drainage system. This includes permitting and mitigation for maintenance and capital improvements to the system. The storm drain system includes inlets, storm drain pipes, culverts, swales, brow ditches, outlets, pump stations, channels, treatment control BMPs, and other structures that convey storm flows and dry weather urban runoff from City-incorporated public rights-of-way. It does not include street curb and gutter features that convey storm flows, roof gutters and downspouts from City-owned buildings and structures, or storm water conveyance structures on City parcels upstream of the City street rights-of-way.
• Ensure compliance with the NPDES permit for the MS4, issued to the City by the RWQCB. Compliance requires that the City:
– provide public education and outreach to change public behavior and reduce overall pollutant discharge,
– establish and enforce requirements for new and re-development projects to implement best management practices (BMPs) that reduce pollutant generation and discharges to the maximum extent practicable,
– inspect and enforce industrial and commercial operations to ensure that they are implementing required BMPs, including maintenance of structural BMPs,
– inspect and enforce the maintenance of structural treatment control BMPs on properties (residential, commercial, industrial, public) where such BMPs were required under the new and/or redevelopment program,
– inspect and enforce the implementation of BMPs on construction projects,
Watershed Asset Management Plan Storm Water Division, Transportation and Storm Water Department
Final Report
2-2
– inspect and enforce public violations of municipal codes and ordinances,
– monitor discharges and receiving waters at select locations,
– coordinate the implementation of municipal BMPs by other City divisions and departments, and
– develop and implement plans (e.g., treatment control BMPs) for complying with TMDL regulations within City-incorporated areas as they are adopted by the RWQCB.
• Conduct the following additional activities from time to time, as needed:
– review the water quality sections of California Environmental Quality Act documents,
– provide support for special cleanup and abatement orders issued by the RWQCB for discharges of pollutants through the City’s assets, and
– participate in the development of public policy at the state or local level regarding water quality regulations.
The Division owns and/or manages a number of different types of “assets.” The storm drain system is one of the largest assets. The City’s storm drain system is composed of built structures, including inlets, pipes, culverts, brow ditches, swales, pump stations, low flow diversions, and outfalls. These built structures have defined lives and replacement costs, and are required to achieve specified service levels to adequately convey storm flows and manage flood risk within the City.
However, the NPDES compliance responsibilities suggest that the Division manages more than the storm drain system. In order to achieve NPDES compliance, the Division must manage public behavior and relationships, regulatory relationships, monitoring equipment, ordinances and land development standards, the quality of water running into and out of the City’s storm drain system, and the quality of water in the receiving water bodies. The Division must also manage the storm drain system so that it does not contribute to water pollution.
To capture the assets that the Division must manage in order to fulfill its responsibilities, the assets have been categorized into three groups (asset types):
• human-made hard assets
• natural assets
• human-made soft assets
Hard Assets are the storm drain system and equipment greater than $5,000 in replacement cost. These assets are generally purchased or constructed, have defined lives, and can be replaced. The $5,000 or greater replacement cost requirement for equipment is a simplification step for tracking and managing hard assets that can have a significant budgetary impact. Smaller items are generally not managed as individual assets.
Natural assets are those things the Division must manage, but are not human made. They include receiving waters, runoff and discharges, City parcels, and multi-habitat planning areas (MHPAs). These
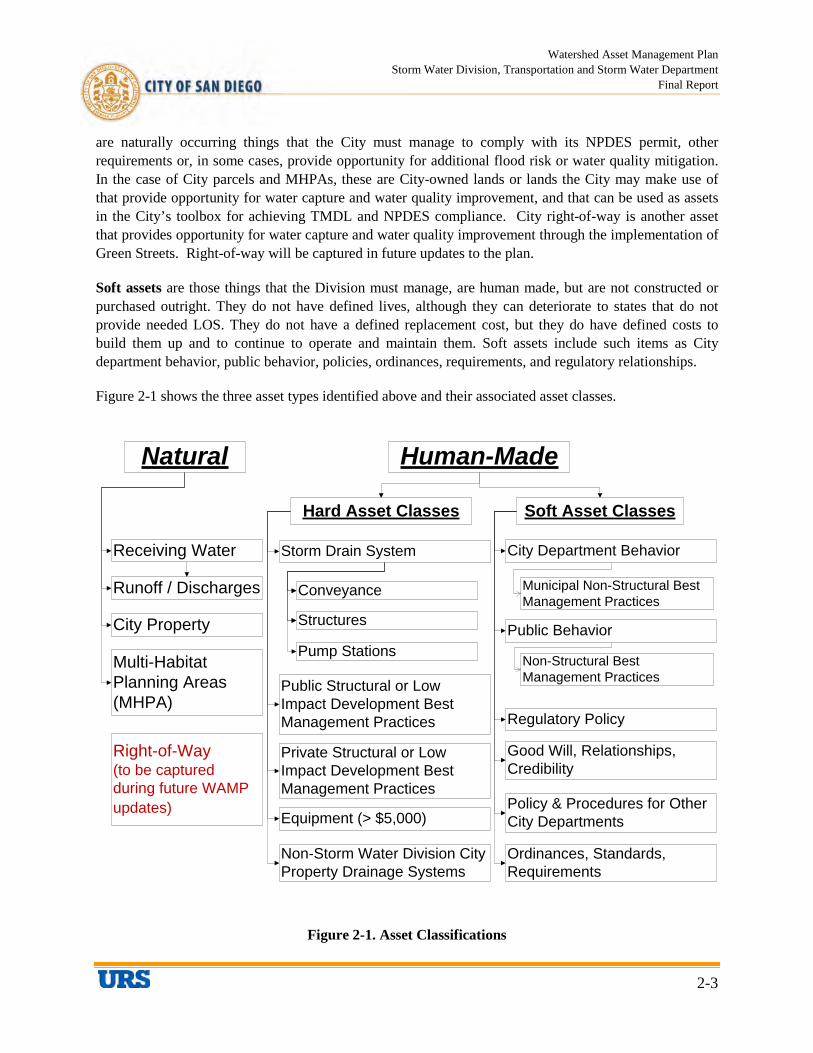
Watershed Asset Management Plan Storm Water Division, Transportation and Storm Water Department
Final Report
2-3
are naturally occurring things that the City must manage to comply with its NPDES permit, other requirements or, in some cases, provide opportunity for additional flood risk or water quality mitigation. In the case of City parcels and MHPAs, these are City-owned lands or lands the City may make use of that provide opportunity for water capture and water quality improvement, and that can be used as assets in the City’s toolbox for achieving TMDL and NPDES compliance. City right-of-way is another asset that provides opportunity for water capture and water quality improvement through the implementation of Green Streets. Right-of-way will be captured in future updates to the plan.
Soft assets are those things that the Division must manage, are human made, but are not constructed or purchased outright. They do not have defined lives, although they can deteriorate to states that do not provide needed LOS. They do not have a defined replacement cost, but they do have defined costs to build them up and to continue to operate and maintain them. Soft assets include such items as City department behavior, public behavior, policies, ordinances, requirements, and regulatory relationships.
Figure 2-1 shows the three asset types identified above and their associated asset classes.
Hard Asset Classes Soft Asset Classes
Conveyance
Structures
Pump StationsPublic Behavior
City Department Behavior
Good Will, Relationships, Credibility
Policy & Procedures for Other City Departments
Ordinances, Standards, Requirements
Private Structural or Low Impact Development Best Management Practices
Public Structural or Low Impact Development Best Management Practices
Municipal Non-Structural Best Management Practices
Non-Structural Best Management Practices
Multi-Habitat Planning Areas (MHPA)
Runoff / Discharges
Receiving Water
City Property
Natural
Equipment (> $5,000)
Human-Made
Regulatory Policy
Non-Storm Water Division City Property Drainage Systems
Storm Drain System
Right-of-Way (to be captured during future WAMP updates)
Figure 2-1. Asset Classifications
Watershed Asset Management Plan Storm Water Division, Transportation and Storm Water Department
Final Report
2-4
2.1 ASSET HIERARCHY
Some asset classes contain large numbers of assets while other classes may only have few assets. To effectively organize these assets into manageable units, they were put into a functional- and location-based asset hierarchy. An asset hierarchy provides a structured framework for organizing assets in an asset register. It has a structured relationship to allow consistent roll up / roll down of data. With an asset hierarchy, the Division will be able to easily identify, locate, and organize assets. The asset hierarchy also allows the Division to present asset and financial information at any level of the hierarchy. It provides a powerful structure for making management decisions (e.g., cost, condition, risk, capital needs) within the watershed, Hydrologic Unit (HU), Hydrologic Area (HA), and Hydrologic Subarea (HSA), and mainstem outfall drainage area. The mainstem outfall drainage area is where a network of storm drain pipes discharges into receiving water through one mainstem storm drain outfall. These areas vary in size, but consist of the smallest reasonable management unit for a set of assets that can be evaluated for its ability to meet flood risk reduction requirements within that catchment area, and NPDES compliance requirements within that reach of receiving water.
Figure 2-2 shows the Division asset hierarchy. As represented by the hierarchy, some assets are tracked at the Division level (e.g., regulatory policy, monitoring equipment), while others are tied to a specific watershed, HU, HA, HSA, or mainstem outfall drainage area.

Watershed Asset Management Plan Storm Water Division, Transportation and Storm Water Department
Final Report
2-5
Stormwater Division
Tijuana Hydrologic Unit911
Tijuana Valley Hydrologic Area911.1
Hydrologic Subarea911.1X
Mainstem Outfall Drainage Area
Asset Type (Natural, Hard, Soft)
Asset Class
Assets
All Asset Management Decisions Made at Most Appropriate Level
This is the lowest level at which asset data is to be collected and organized.
City Department Behavior
Municipal Non-Structural Best Management Practices
Public Behavior
Non-Structural Best Management PracticesGood Will, Relationships,
Credibility
Policy & Procedures for Other City Departments
Ordinances, Standards, Requirements
Regulatory Policy
Equipment – Monitoring, Maintenance >= $5K
Private Structural or Low Impact Development Best Management Practices
Public Structural or Low Impact Development Best Management Practices
Non-Storm Water Division City Property Drainage Systems
Storm Drain System
Multi-Habitat Planning Areas (MHPA)
Runoff / Discharges
Receiving Water
City Property & Land
Managed at this Level
Managed at this Level Managed
at this Level
Figure 2-2. Asset Hierarchy
As represented by the asset hierarchy, assets can be managed efficiently at any level. This enables the Division to assess conditions, performance, and valuation at any level of the hierarchy. More importantly, the hierarchy establishes an organized structure to track costs (e.g., O&M, capital, monitoring). These costs will allow the Division to understand the true cost of providing the LOS. Some watersheds may not require the same level of effort to achieve a given LOS. Therefore, the resources devoted to an activity that manages a particular asset within one watershed may differ from other watersheds. In the appendices, the specific assets for each watershed are identified.
Watershed Asset Management Plan Storm Water Division, Transportation and Storm Water Department
Final Report
2-6
2.2 DATA SOURCES AND ASSET INVENTORY METHOD
The following data sources were used to develop the asset register.
• Applications that manage hard asset data such as storm drains, channels, inlets (i.e., City Geo-SAP system).
• California State Water Resources Control Board (SWRCB) receiving-water GIS data for HUs, HAs, and HSAs.
• RWQCB GIS data for watershed management areas (WMAs) as defined in the NPDES permit.
• San Diego county-wide GIS data for general mapping information, such as City boundary data, streets, and land uses.
• San Diego County parcel data for MHPAs, City parcels, and non-City parcels.
• Division BMP inspection database for City-owned structural treatment control BMPs.
• Tacit knowledge of Division staff regarding the condition of assets, areas where flooding occurs, achievement of levels of service, cost projections for additional actions to achieve levels of service, consequence of failure, probability of failure, and other needed asset condition information.
• Phase I and Phase II Comprehensive Load Reduction Plans (CLRPs) produced by City and County of San Diego (County) consultants that presented BMP opportunities for TMDL compliance.
The methods used to inventory assets largely involved collecting raw data from the City or other databases, followed by conducting interviews with Division staff. Where available, condition assessment data was also used. Ultimately, additional condition assessment data will be used to refine the WAMPs.
2.3 ASSET SUMMARY
The Division owns and/or manages a number of different types of assets. To capture the assets that the Division must manage in order to fulfill its responsibilities, the assets have been categorized into three groups (asset types):
• human-made hard assets
• natural assets
• human-made soft assets
Presented in the next subsections is a summary of the assets managed across the City by the Division.
2.3.1 Hard Assets
Table 2-1 summarizes the hard assets in each watershed owned or managed by the Division.
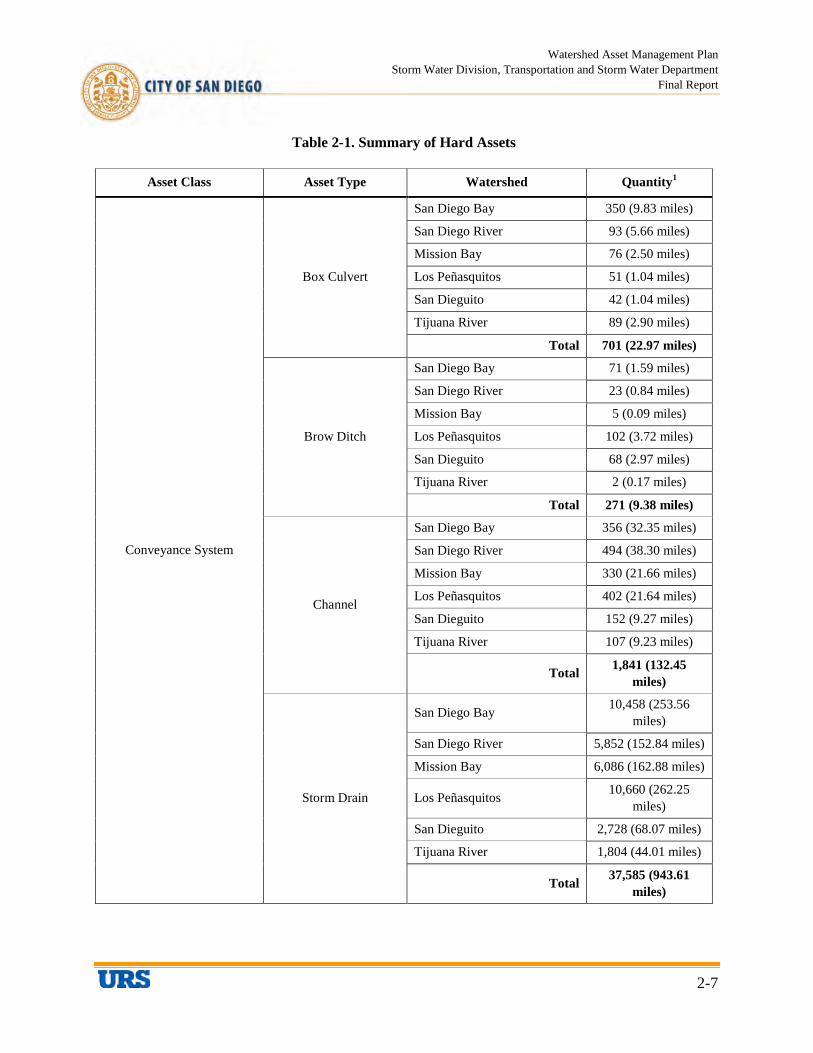
Watershed Asset Management Plan Storm Water Division, Transportation and Storm Water Department
Final Report
2-7
Table 2-1. Summary of Hard Assets
Asset Class Asset Type Watershed Quantity1
Conveyance System
Box Culvert
San Diego Bay 350 (9.83 miles)
San Diego River 93 (5.66 miles)
Mission Bay 76 (2.50 miles)
Los Peñasquitos 51 (1.04 miles)
San Dieguito 42 (1.04 miles)
Tijuana River 89 (2.90 miles)
Total 701 (22.97 miles)
Brow Ditch
San Diego Bay 71 (1.59 miles)
San Diego River 23 (0.84 miles)
Mission Bay 5 (0.09 miles)
Los Peñasquitos 102 (3.72 miles)
San Dieguito 68 (2.97 miles)
Tijuana River 2 (0.17 miles)
Total 271 (9.38 miles)
Channel
San Diego Bay 356 (32.35 miles)
San Diego River 494 (38.30 miles)
Mission Bay 330 (21.66 miles)
Los Peñasquitos 402 (21.64 miles)
San Dieguito 152 (9.27 miles)
Tijuana River 107 (9.23 miles)
Total 1,841 (132.45 miles)
Storm Drain
San Diego Bay 10,458 (253.56 miles)
San Diego River 5,852 (152.84 miles)
Mission Bay 6,086 (162.88 miles)
Los Peñasquitos 10,660 (262.25 miles)
San Dieguito 2,728 (68.07 miles)
Tijuana River 1,804 (44.01 miles)
Total 37,585 (943.61 miles)
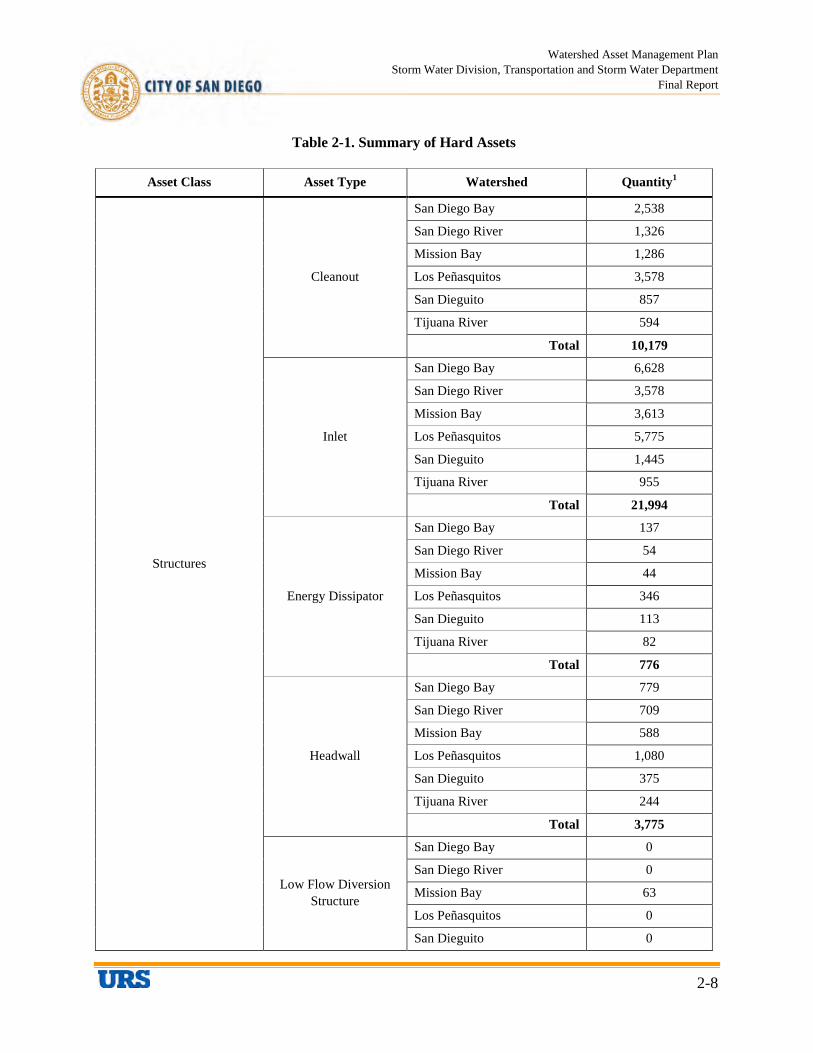
Watershed Asset Management Plan Storm Water Division, Transportation and Storm Water Department
Final Report
2-8
Table 2-1. Summary of Hard Assets
Asset Class Asset Type Watershed Quantity1
Structures
Cleanout
San Diego Bay 2,538
San Diego River 1,326
Mission Bay 1,286
Los Peñasquitos 3,578
San Dieguito 857
Tijuana River 594
Total 10,179
Inlet
San Diego Bay 6,628
San Diego River 3,578
Mission Bay 3,613
Los Peñasquitos 5,775
San Dieguito 1,445
Tijuana River 955
Total 21,994
Energy Dissipator
San Diego Bay 137
San Diego River 54
Mission Bay 44
Los Peñasquitos 346
San Dieguito 113
Tijuana River 82
Total 776
Headwall
San Diego Bay 779
San Diego River 709
Mission Bay 588
Los Peñasquitos 1,080
San Dieguito 375
Tijuana River 244
Total 3,775
Low Flow Diversion Structure
San Diego Bay 0
San Diego River 0
Mission Bay 63
Los Peñasquitos 0
San Dieguito 0
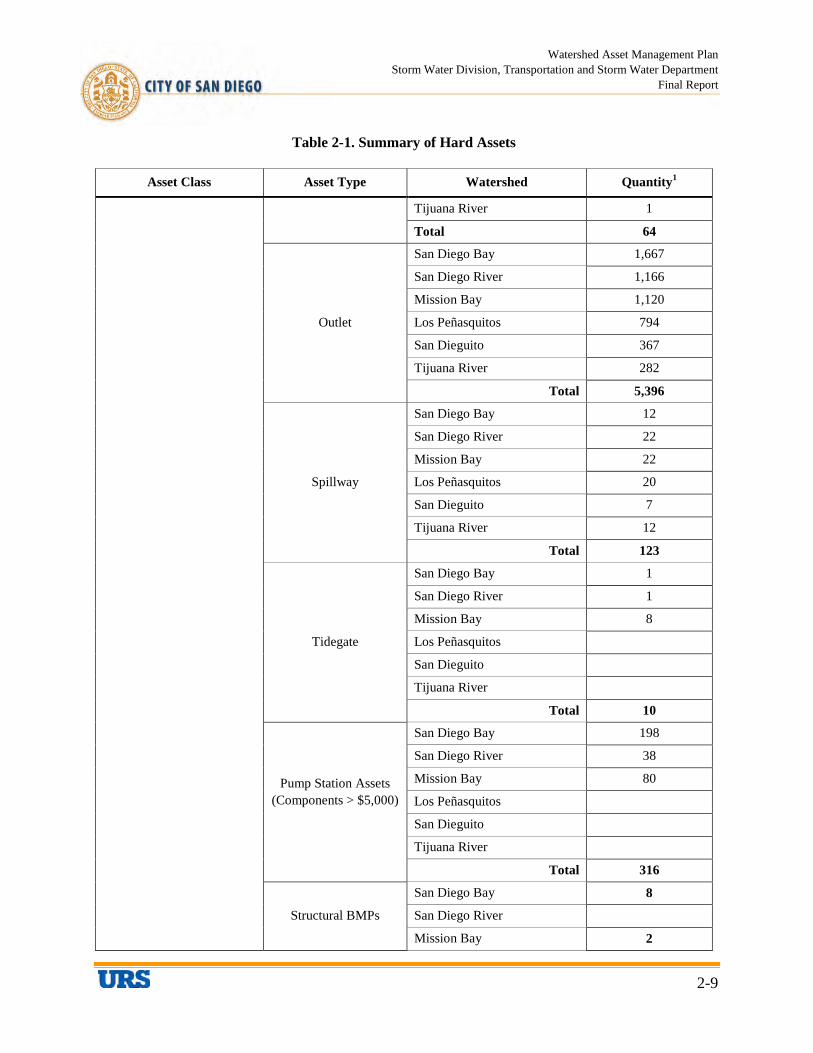
Watershed Asset Management Plan Storm Water Division, Transportation and Storm Water Department
Final Report
2-9
Table 2-1. Summary of Hard Assets
Asset Class Asset Type Watershed Quantity1
Tijuana River 1
Total 64
Outlet
San Diego Bay 1,667
San Diego River 1,166
Mission Bay 1,120
Los Peñasquitos 794
San Dieguito 367
Tijuana River 282
Total 5,396
Spillway
San Diego Bay 12
San Diego River 22
Mission Bay 22
Los Peñasquitos 20
San Dieguito 7
Tijuana River 12
Total 123
Tidegate
San Diego Bay 1
San Diego River 1
Mission Bay 8
Los Peñasquitos
San Dieguito
Tijuana River
Total 10
Pump Station Assets (Components > $5,000)
San Diego Bay 198
San Diego River 38
Mission Bay 80
Los Peñasquitos
San Dieguito
Tijuana River
Total 316
Structural BMPs
San Diego Bay 8
San Diego River
Mission Bay 2

Watershed Asset Management Plan Storm Water Division, Transportation and Storm Water Department
Final Report
2-10
Table 2-1. Summary of Hard Assets
Asset Class Asset Type Watershed Quantity1
Los Peñasquitos 5
San Dieguito
Tijuana River
Total 15 1 The number of asset types is dependent on the hierarchy in which the asset is being managed. Assets managed at the mainstem outfall drainage area level will likely have large numbers of assets, whereas, assets managed at the watershed level will have a single asset.
In future revisions to this WAMP, the Structural BMPs listed below should be added to the hard asset inventory; these BMPs are in process of being designed and constructed.
• One Vegetated Swale, George L Stevens Senior Center, Project ID 982, APN 5494201700 • Four Vegetated Swales, Breen Park, Project ID 857, APN 3183122700 • One Vegetated Swale, Camino Ruiz Neighborhood Park, Project ID 140, APN 3090409100 • BMP TBD, Hilltop Community Park Expansion, Project ID 1001, APN 3120303000 • BMP TBD, Memorial Skateboard Park, Project ID 984, APN 5455920100 • Two Vegetated Swales, Otay Mesa/Nestor Library Expansion, Project ID 859, APN 6304314800 • BMP TBD, Cesar Chavez Community Park, Project ID TBD, APNs 6650640100, 6662100300,
6662100400, 6662101300. 2.3.2 Soft Assets
Table 2-2 summarizes the soft assets in each watershed owned or managed by the Division. These represent non-constructed elements that the Stormwater Division staff must manage in order to achieve levels of service.
Table 2-2. Summary of Soft Assets
Asset Class Asset Description Watershed Quantity1
City owned non structural BMPs
Non Structural BMPs implemented by the City that improve water quality for TMDL and NPDES compliance.
San Diego Bay Watershed 1
San Diego River Watershed 1
Mission Bay Watershed 1
Los Peñasquitos Watershed 1
San Dieguito Watershed 1
Tijuana River Watershed 1
Total 6
Non City owned non Non Structural BMPs implemented by the San Diego Bay Watershed 1
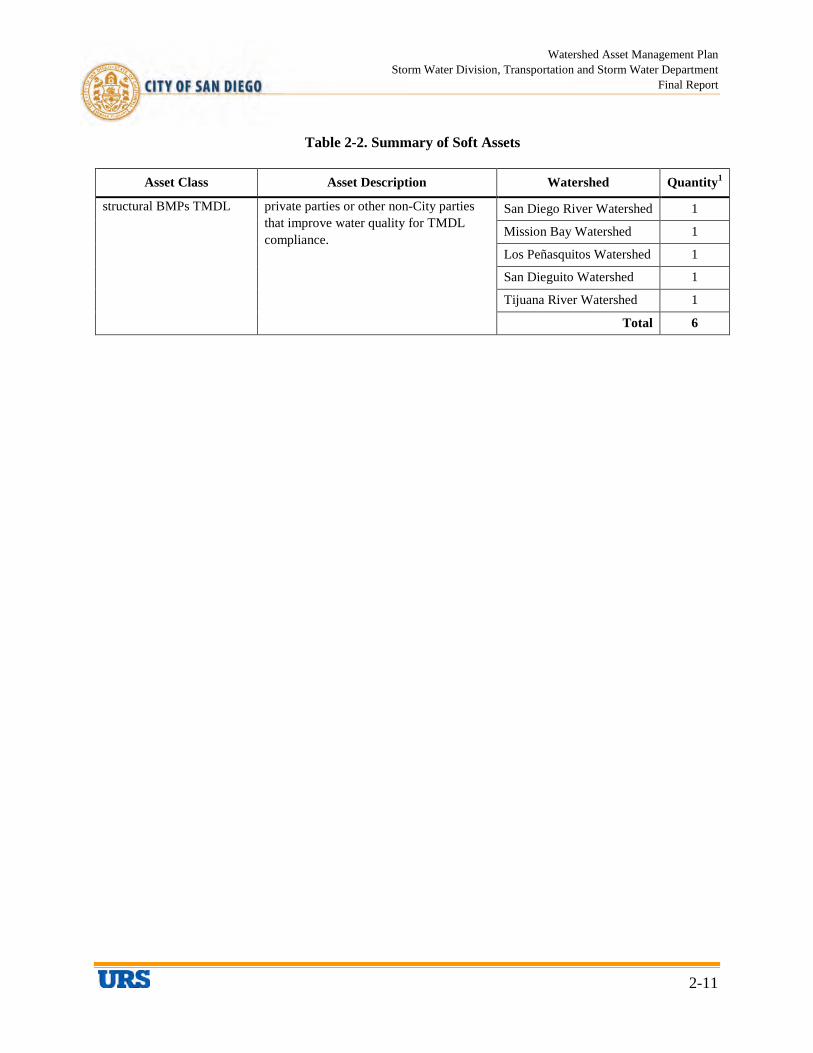
Watershed Asset Management Plan Storm Water Division, Transportation and Storm Water Department
Final Report
2-11
Table 2-2. Summary of Soft Assets
Asset Class Asset Description Watershed Quantity1
structural BMPs TMDL private parties or other non-City parties that improve water quality for TMDL compliance.
San Diego River Watershed 1
Mission Bay Watershed 1
Los Peñasquitos Watershed 1
San Dieguito Watershed 1
Tijuana River Watershed 1
Total 6
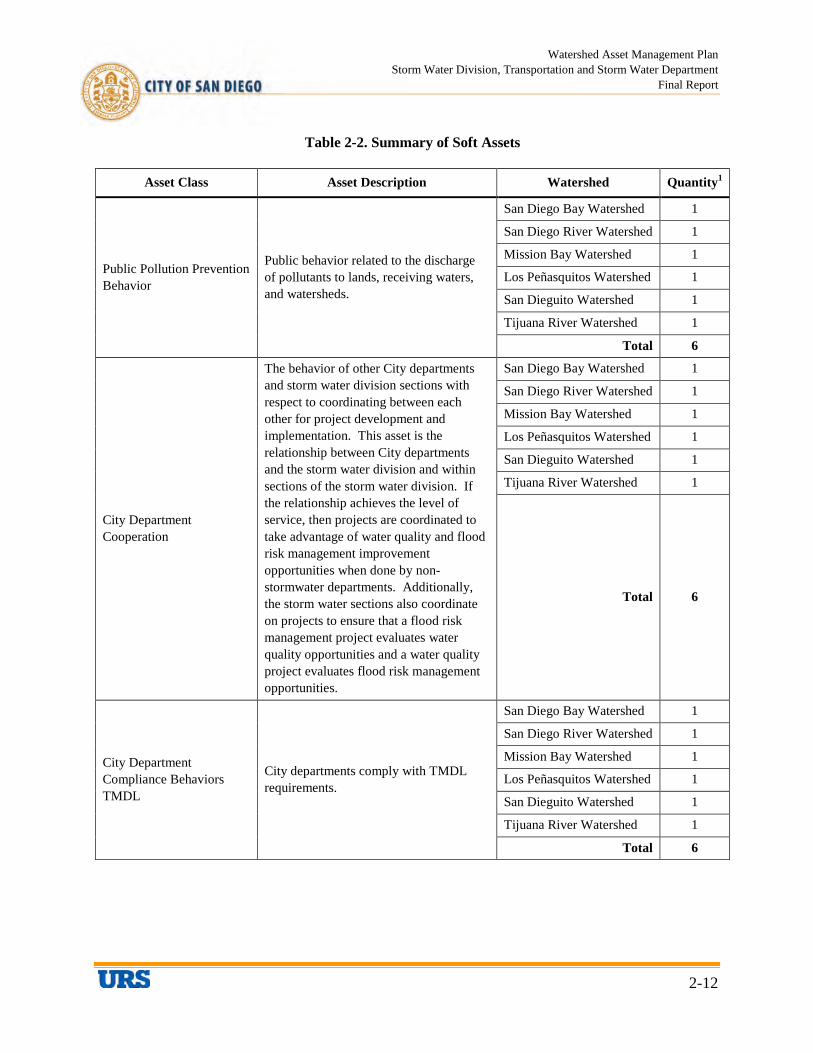
Watershed Asset Management Plan Storm Water Division, Transportation and Storm Water Department
Final Report
2-12
Table 2-2. Summary of Soft Assets
Asset Class Asset Description Watershed Quantity1
Public Pollution Prevention Behavior
Public behavior related to the discharge of pollutants to lands, receiving waters, and watersheds.
San Diego Bay Watershed 1
San Diego River Watershed 1
Mission Bay Watershed 1
Los Peñasquitos Watershed 1
San Dieguito Watershed 1
Tijuana River Watershed 1
Total 6
City Department Cooperation
The behavior of other City departments and storm water division sections with respect to coordinating between each other for project development and implementation. This asset is the relationship between City departments and the storm water division and within sections of the storm water division. If the relationship achieves the level of service, then projects are coordinated to take advantage of water quality and flood risk management improvement opportunities when done by non-stormwater departments. Additionally, the storm water sections also coordinate on projects to ensure that a flood risk management project evaluates water quality opportunities and a water quality project evaluates flood risk management opportunities.
San Diego Bay Watershed 1
San Diego River Watershed 1
Mission Bay Watershed 1
Los Peñasquitos Watershed 1
San Dieguito Watershed 1
Tijuana River Watershed 1
Total 6
City Department Compliance Behaviors TMDL
City departments comply with TMDL requirements.
San Diego Bay Watershed 1
San Diego River Watershed 1
Mission Bay Watershed 1
Los Peñasquitos Watershed 1
San Dieguito Watershed 1
Tijuana River Watershed 1
Total 6

Watershed Asset Management Plan Storm Water Division, Transportation and Storm Water Department
Final Report
2-13
Table 2-2. Summary of Soft Assets
Asset Class Asset Description Watershed Quantity1
Ordinances standards and requirements TMDL
Ordinances, standards and requirements that relate to TMDL compliance requirements.
San Diego Bay Watershed 1
San Diego River Watershed 1
Mission Bay Watershed 1
Los Peñasquitos Watershed 1
San Dieguito Watershed 1
Tijuana River Watershed 1
Total 6
Land Development Regulations TMDL
Land Development Regulations that related to TMDL compliance requirements.
San Diego Bay Watershed 1
San Diego River Watershed 1
Mission Bay Watershed 1
Los Peñasquitos Watershed 1
San Dieguito Watershed 1
Tijuana River Watershed 1
Total 6
Regulatory Policy Basin Plan
Regulatory Policy associated with establishing beneficial uses and water quality objectives in the water quality control plan (basin plan) that are reflective of local uses.
San Diego Bay Watershed 1
San Diego River Watershed 1
Mission Bay Watershed 1
Los Peñasquitos Watershed 1
San Dieguito Watershed 1
Tijuana River Watershed 1
Total 6
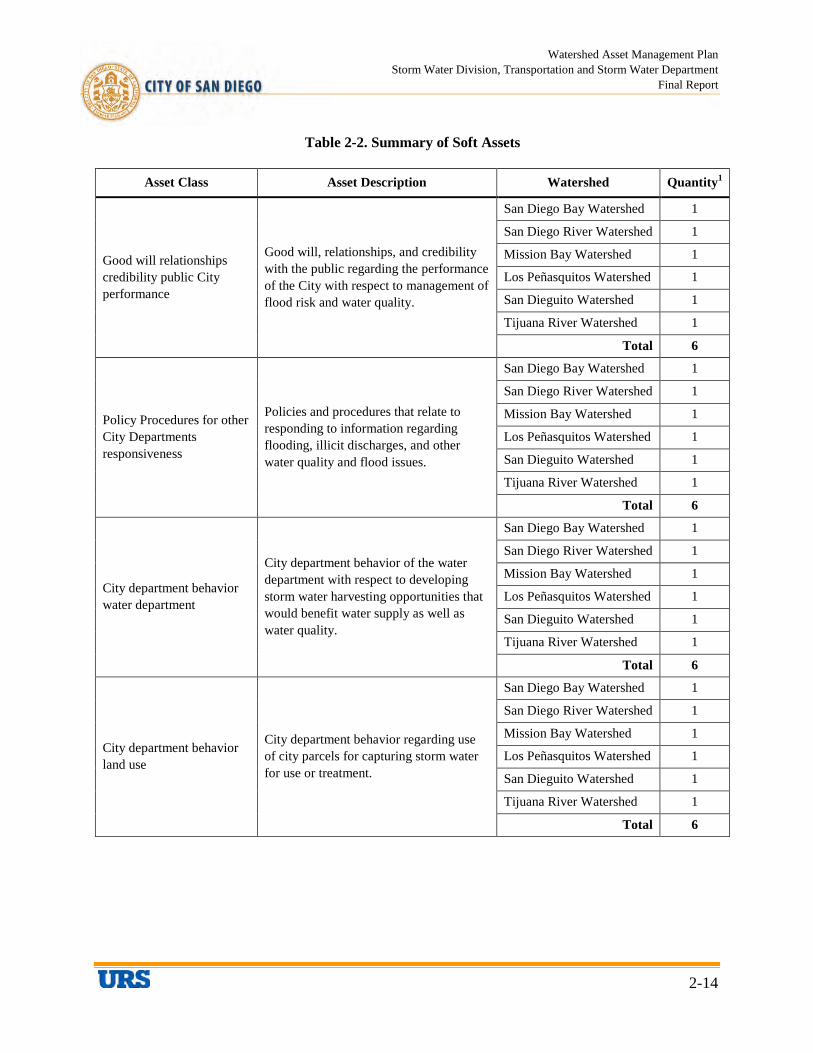
Watershed Asset Management Plan Storm Water Division, Transportation and Storm Water Department
Final Report
2-14
Table 2-2. Summary of Soft Assets
Asset Class Asset Description Watershed Quantity1
Good will relationships credibility public City performance
Good will, relationships, and credibility with the public regarding the performance of the City with respect to management of flood risk and water quality.
San Diego Bay Watershed 1
San Diego River Watershed 1
Mission Bay Watershed 1
Los Peñasquitos Watershed 1
San Dieguito Watershed 1
Tijuana River Watershed 1
Total 6
Policy Procedures for other City Departments responsiveness
Policies and procedures that relate to responding to information regarding flooding, illicit discharges, and other water quality and flood issues.
San Diego Bay Watershed 1
San Diego River Watershed 1
Mission Bay Watershed 1
Los Peñasquitos Watershed 1
San Dieguito Watershed 1
Tijuana River Watershed 1
Total 6
City department behavior water department
City department behavior of the water department with respect to developing storm water harvesting opportunities that would benefit water supply as well as water quality.
San Diego Bay Watershed 1
San Diego River Watershed 1
Mission Bay Watershed 1
Los Peñasquitos Watershed 1
San Dieguito Watershed 1
Tijuana River Watershed 1
Total 6
City department behavior land use
City department behavior regarding use of city parcels for capturing storm water for use or treatment.
San Diego Bay Watershed 1
San Diego River Watershed 1
Mission Bay Watershed 1
Los Peñasquitos Watershed 1
San Dieguito Watershed 1
Tijuana River Watershed 1
Total 6
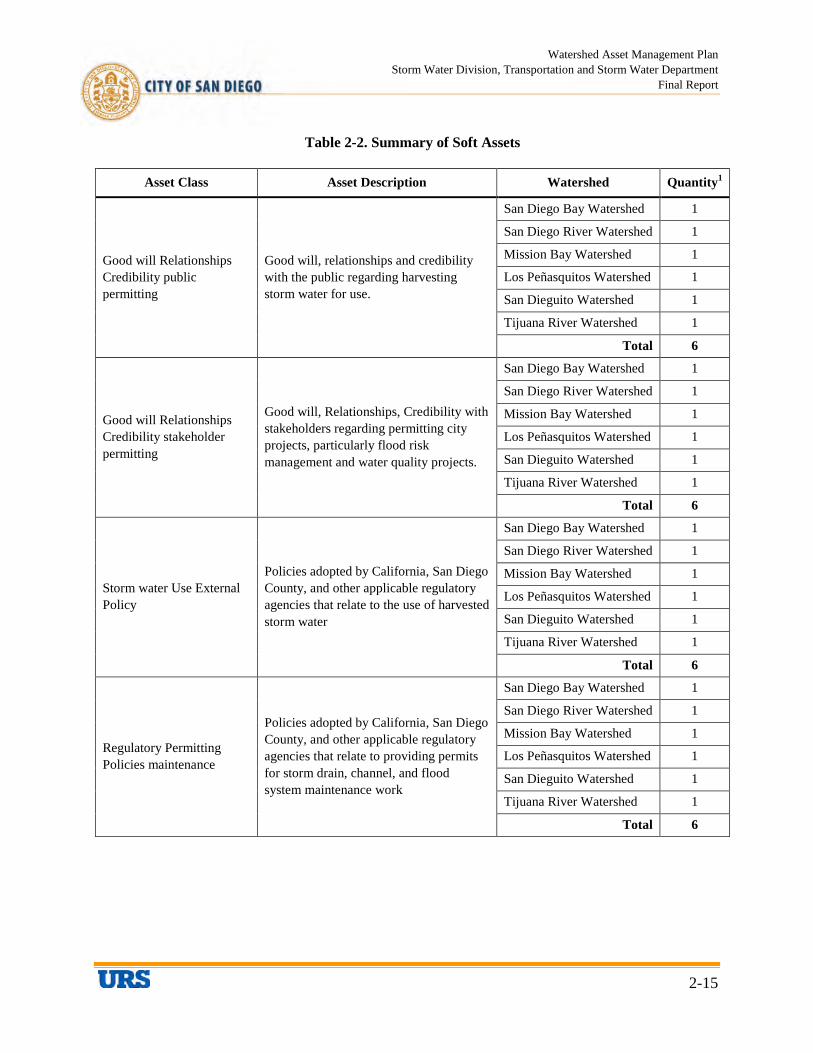
Watershed Asset Management Plan Storm Water Division, Transportation and Storm Water Department
Final Report
2-15
Table 2-2. Summary of Soft Assets
Asset Class Asset Description Watershed Quantity1
Good will Relationships Credibility public permitting
Good will, relationships and credibility with the public regarding harvesting storm water for use.
San Diego Bay Watershed 1
San Diego River Watershed 1
Mission Bay Watershed 1
Los Peñasquitos Watershed 1
San Dieguito Watershed 1
Tijuana River Watershed 1
Total 6
Good will Relationships Credibility stakeholder permitting
Good will, Relationships, Credibility with stakeholders regarding permitting city projects, particularly flood risk management and water quality projects.
San Diego Bay Watershed 1
San Diego River Watershed 1
Mission Bay Watershed 1
Los Peñasquitos Watershed 1
San Dieguito Watershed 1
Tijuana River Watershed 1
Total 6
Storm water Use External Policy
Policies adopted by California, San Diego County, and other applicable regulatory agencies that relate to the use of harvested storm water
San Diego Bay Watershed 1
San Diego River Watershed 1
Mission Bay Watershed 1
Los Peñasquitos Watershed 1
San Dieguito Watershed 1
Tijuana River Watershed 1
Total 6
Regulatory Permitting Policies maintenance
Policies adopted by California, San Diego County, and other applicable regulatory agencies that relate to providing permits for storm drain, channel, and flood system maintenance work
San Diego Bay Watershed 1
San Diego River Watershed 1
Mission Bay Watershed 1
Los Peñasquitos Watershed 1
San Dieguito Watershed 1
Tijuana River Watershed 1
Total 6

Watershed Asset Management Plan Storm Water Division, Transportation and Storm Water Department
Final Report
2-16
Table 2-2. Summary of Soft Assets
Asset Class Asset Description Watershed Quantity1
Regulatory Permitting Policies capital improvements
Policies adopted by California, San Diego County, and other applicable regulatory agencies that relate to providing permits for storm drain, channel, and flood system capital improvement work
San Diego Bay Watershed 1
San Diego River Watershed 1
Mission Bay Watershed 1
Los Peñasquitos Watershed 1
San Dieguito Watershed 1
Tijuana River Watershed 1
Total 6
Good will Relationships Credibility stakeholders permitting maintenance
Good will Relationships Credibility with stakeholders with respect to permitting maintenance
San Diego Bay Watershed 1
San Diego River Watershed 1
Mission Bay Watershed 1
Los Peñasquitos Watershed 1
San Dieguito Watershed 1
Tijuana River Watershed 1
Total 6
Good will Relationships Credibility stakeholders permitting capital improvement
Good will Relationships Credibility with stakeholders with respect to permitting capital improvements
San Diego Bay Watershed 1
San Diego River Watershed 1
Mission Bay Watershed 1
Los Peñasquitos Watershed 1
San Dieguito Watershed 1
Tijuana River Watershed 1
Total 6
City department behavior storm drain maintenance
City department behavior with respect storm drain maintenance on those city parcels
San Diego Bay Watershed 1
San Diego River Watershed 1
Mission Bay Watershed 1
Los Peñasquitos Watershed 1
San Dieguito Watershed 1
Tijuana River Watershed 1
Total 6
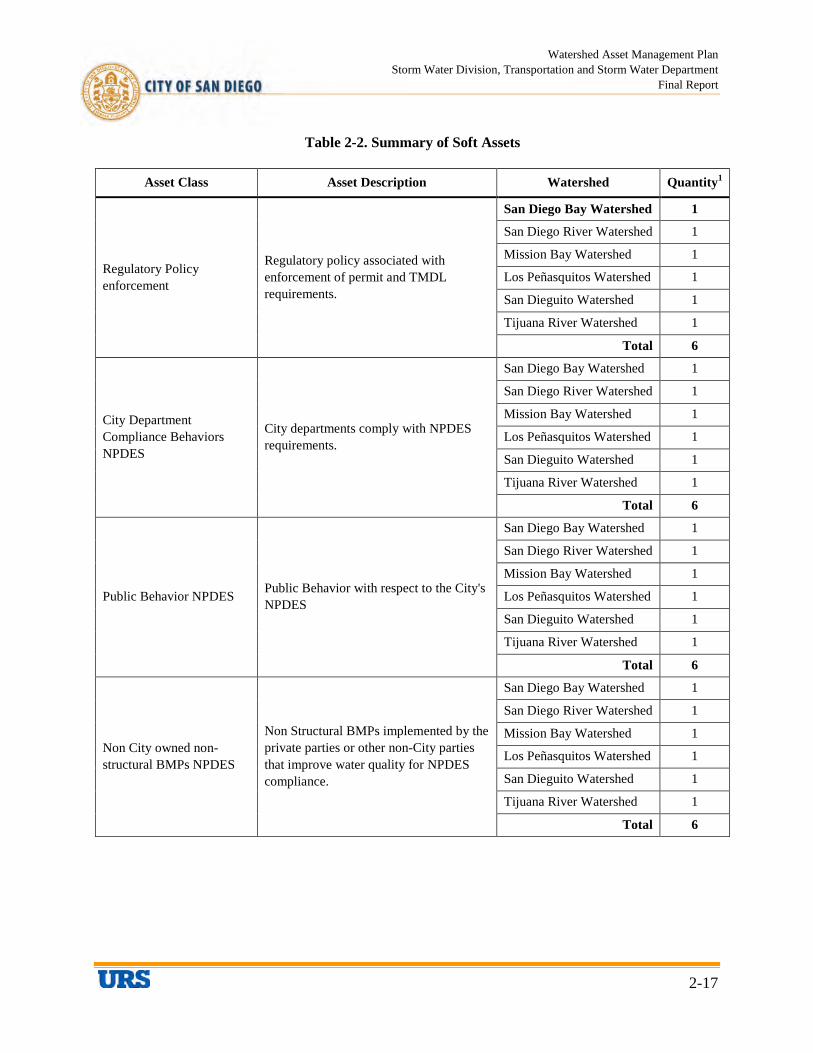
Watershed Asset Management Plan Storm Water Division, Transportation and Storm Water Department
Final Report
2-17
Table 2-2. Summary of Soft Assets
Asset Class Asset Description Watershed Quantity1
Regulatory Policy enforcement
Regulatory policy associated with enforcement of permit and TMDL requirements.
San Diego Bay Watershed 1
San Diego River Watershed 1
Mission Bay Watershed 1
Los Peñasquitos Watershed 1
San Dieguito Watershed 1
Tijuana River Watershed 1
Total 6
City Department Compliance Behaviors NPDES
City departments comply with NPDES requirements.
San Diego Bay Watershed 1
San Diego River Watershed 1
Mission Bay Watershed 1
Los Peñasquitos Watershed 1
San Dieguito Watershed 1
Tijuana River Watershed 1
Total 6
Public Behavior NPDES Public Behavior with respect to the City's NPDES
San Diego Bay Watershed 1
San Diego River Watershed 1
Mission Bay Watershed 1
Los Peñasquitos Watershed 1
San Dieguito Watershed 1
Tijuana River Watershed 1
Total 6
Non City owned non-structural BMPs NPDES
Non Structural BMPs implemented by the private parties or other non-City parties that improve water quality for NPDES compliance.
San Diego Bay Watershed 1
San Diego River Watershed 1
Mission Bay Watershed 1
Los Peñasquitos Watershed 1
San Dieguito Watershed 1
Tijuana River Watershed 1
Total 6
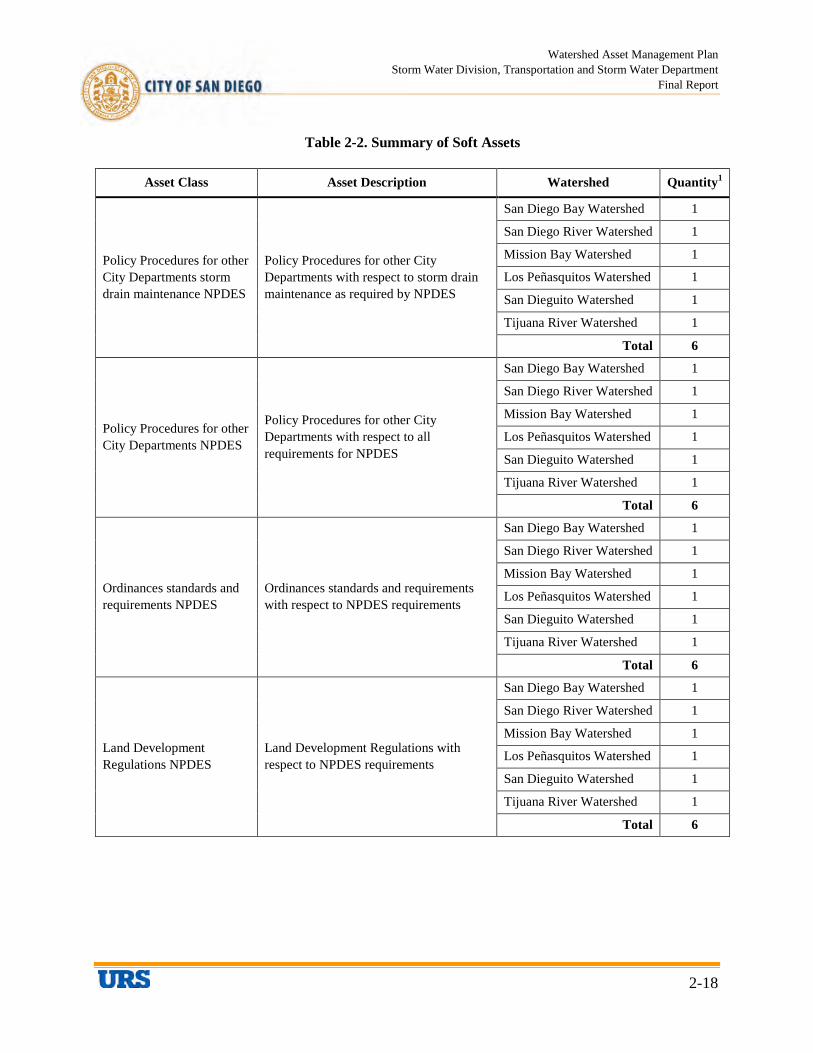
Watershed Asset Management Plan Storm Water Division, Transportation and Storm Water Department
Final Report
2-18
Table 2-2. Summary of Soft Assets
Asset Class Asset Description Watershed Quantity1
Policy Procedures for other City Departments storm drain maintenance NPDES
Policy Procedures for other City Departments with respect to storm drain maintenance as required by NPDES
San Diego Bay Watershed 1
San Diego River Watershed 1
Mission Bay Watershed 1
Los Peñasquitos Watershed 1
San Dieguito Watershed 1
Tijuana River Watershed 1
Total 6
Policy Procedures for other City Departments NPDES
Policy Procedures for other City Departments with respect to all requirements for NPDES
San Diego Bay Watershed 1
San Diego River Watershed 1
Mission Bay Watershed 1
Los Peñasquitos Watershed 1
San Dieguito Watershed 1
Tijuana River Watershed 1
Total 6
Ordinances standards and requirements NPDES
Ordinances standards and requirements with respect to NPDES requirements
San Diego Bay Watershed 1
San Diego River Watershed 1
Mission Bay Watershed 1
Los Peñasquitos Watershed 1
San Dieguito Watershed 1
Tijuana River Watershed 1
Total 6
Land Development Regulations NPDES
Land Development Regulations with respect to NPDES requirements
San Diego Bay Watershed 1
San Diego River Watershed 1
Mission Bay Watershed 1
Los Peñasquitos Watershed 1
San Dieguito Watershed 1
Tijuana River Watershed 1
Total 6
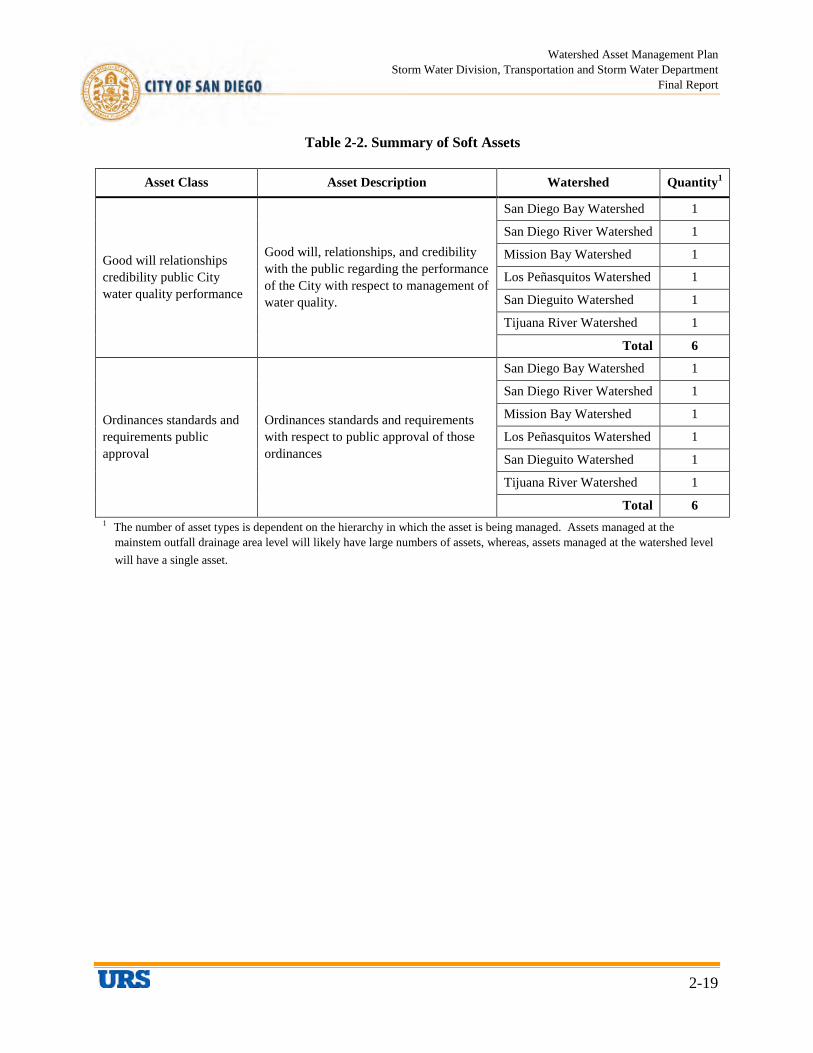
Watershed Asset Management Plan Storm Water Division, Transportation and Storm Water Department
Final Report
2-19
Table 2-2. Summary of Soft Assets
Asset Class Asset Description Watershed Quantity1
Good will relationships credibility public City water quality performance
Good will, relationships, and credibility with the public regarding the performance of the City with respect to management of water quality.
San Diego Bay Watershed 1
San Diego River Watershed 1
Mission Bay Watershed 1
Los Peñasquitos Watershed 1
San Dieguito Watershed 1
Tijuana River Watershed 1
Total 6
Ordinances standards and requirements public approval
Ordinances standards and requirements with respect to public approval of those ordinances
San Diego Bay Watershed 1
San Diego River Watershed 1
Mission Bay Watershed 1
Los Peñasquitos Watershed 1
San Dieguito Watershed 1
Tijuana River Watershed 1
Total 6 1 The number of asset types is dependent on the hierarchy in which the asset is being managed. Assets managed at the mainstem outfall drainage area level will likely have large numbers of assets, whereas, assets managed at the watershed level will have a single asset.
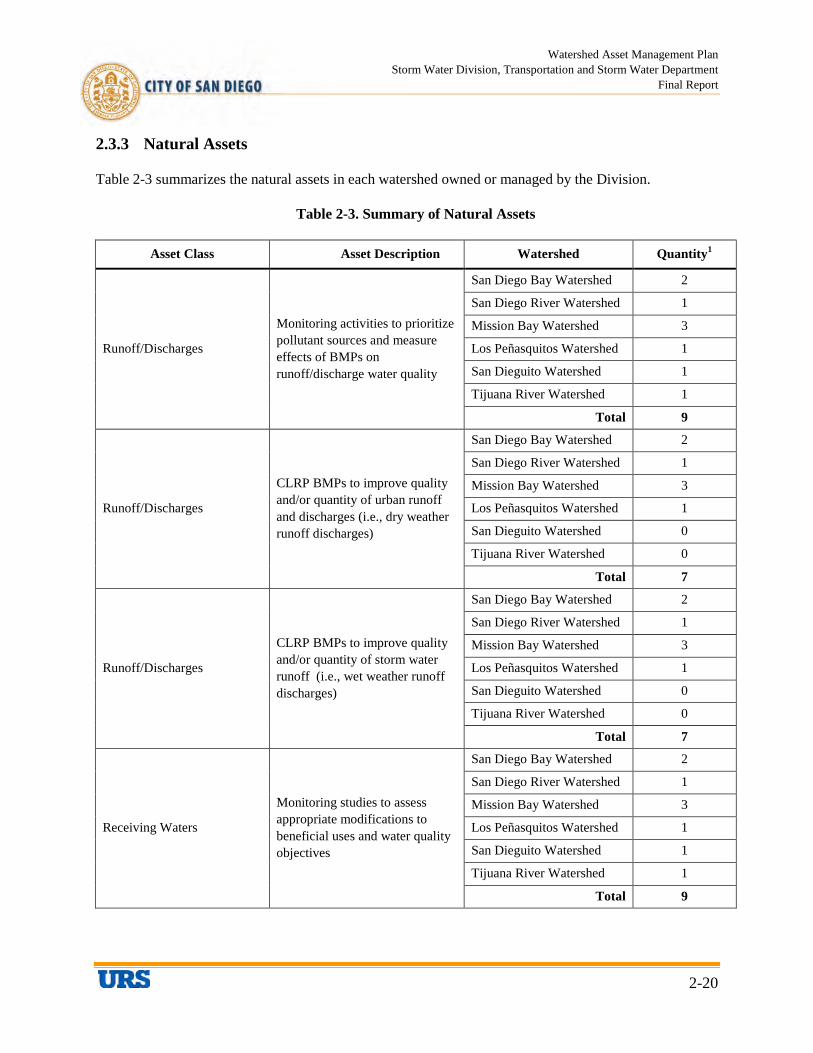
Watershed Asset Management Plan Storm Water Division, Transportation and Storm Water Department
Final Report
2-20
2.3.3 Natural Assets
Table 2-3 summarizes the natural assets in each watershed owned or managed by the Division.
Table 2-3. Summary of Natural Assets
Asset Class Asset Description Watershed Quantity1
Runoff/Discharges
Monitoring activities to prioritize pollutant sources and measure effects of BMPs on runoff/discharge water quality
San Diego Bay Watershed 2
San Diego River Watershed 1
Mission Bay Watershed 3
Los Peñasquitos Watershed 1
San Dieguito Watershed 1
Tijuana River Watershed 1
Total 9
Runoff/Discharges
CLRP BMPs to improve quality and/or quantity of urban runoff and discharges (i.e., dry weather runoff discharges)
San Diego Bay Watershed 2
San Diego River Watershed 1
Mission Bay Watershed 3
Los Peñasquitos Watershed 1
San Dieguito Watershed 0
Tijuana River Watershed 0
Total 7
Runoff/Discharges
CLRP BMPs to improve quality and/or quantity of storm water runoff (i.e., wet weather runoff discharges)
San Diego Bay Watershed 2
San Diego River Watershed 1
Mission Bay Watershed 3
Los Peñasquitos Watershed 1
San Dieguito Watershed 0
Tijuana River Watershed 0
Total 7
Receiving Waters
Monitoring studies to assess appropriate modifications to beneficial uses and water quality objectives
San Diego Bay Watershed 2
San Diego River Watershed 1
Mission Bay Watershed 3
Los Peñasquitos Watershed 1
San Dieguito Watershed 1
Tijuana River Watershed 1
Total 9

Watershed Asset Management Plan Storm Water Division, Transportation and Storm Water Department
Final Report
2-21
Table 2-3. Summary of Natural Assets
Asset Class Asset Description Watershed Quantity1
MHPAs MHPAs
San Diego Bay Watershed 2
San Diego River Watershed 1
Mission Bay Watershed 3
Los Peñasquitos Watershed 1
San Dieguito Watershed 1
Tijuana River Watershed 1
Total 9
City Property City parcels
San Diego Bay Watershed 2
San Diego River Watershed 1
Mission Bay Watershed 3
Los Peñasquitos Watershed 1
San Dieguito Watershed 1
Tijuana River Watershed 1
Total 9
Runoff/Discharges Monitoring per Permit requirements
San Diego Bay Watershed 2
San Diego River Watershed 1
Mission Bay Watershed 3
Los Peñasquitos Watershed 1
San Dieguito Watershed 1
Tijuana River Watershed 1
Total 9 1 The number of asset types is dependent on the hierarchy in which the asset is being managed. Assets managed at the mainstem outfall drainage area level will likely have large numbers of assets, whereas, assets managed at the watershed level will have a single asset.

Watershed Asset Management Plan Storm Water Division, Transportation and Storm Water Department
Final Report
3-1
SECTION 3 ASSET MANAGEMENT COSTS / PROGRAM FUNDING REQUIREMENTS: “WHAT IS IT WORTH?”
Asset valuations are an integral part of asset management. The valuation process provides the City with the knowledge of estimated costs to support its budgetary planning, identify high value assets, and gain understanding into the total value of the assets at all levels of the hierarchy. Using the estimated costs, future funding requirements can be created and the lowest lifecycle cost can be tracked against the assets. Asset management costs include replacement costs for hard assets and operations and maintenance costs for all assets. It is important to note that natural and soft assets cannot be “replaced” per se, however, their “value” is estimated to be the funding needed to manage the assets to meet the LOS required by the regulators and desired by the citizens. The same can essentially be said for hard assets. However, because hard assets require replacement when they reach the end of their useful lives, the funding needed includes the cost of replacing the asset. Thus, their “value” can be estimated as the sum of their replacement and operations and maintenance costs.
Hard assets in the asset register were assigned an estimated replacement cost. The replacement cost was estimated based on what it might cost to replace the asset in today’s (2013) dollars. Pipe replacement costs were calculated using pricing attributes of material, diameter, and length. The complete data availability for drainage systems supports the attribute-driven valuation methodology. However, a similar valuation methodology could not be implemented for structures and channels. The limited availability of supporting data attributes led to developing a more simplistic “unit price” approach. For example, regardless of an inlet’s size, location and type, inlets were assigned a unit replacement cost (i.e., $20,000). Moving forward, this valuation process will be improved as better data becomes available.
The replacement cost of channels was determined based on recent channel replacement work. The total cost of the project was represented as the cost per linear foot. This replacement cost then was applied to the total length of the channel. The limited supporting data attribute availability, along with other potential environmental (e.g., concrete channel to natural) and social (e.g., acquisition of private land for right-of-way and capacity increase) considerations, led to the development of a simpler replacement cost determination approach. Moving forward, as the supporting data attributes become available, the channel replacement cost methodology can be improved.
For current O&M costs for hard assets, the Division’s budgets were used to estimate the O&M costs for each asset type. For soft and natural assets the ongoing and projected O&M lifecycle costs were estimated. These costs may fluctuate based on the asset criticality and type. For capital and additional O&M costs for soft assets (e.g., building up program elements to respond to future flood risk management and compliance needs), staff input was used regarding the number of full-time equivalents (FTEs), professional services, or other costs that would be required. For estimating TMDL compliance costs, a cost model was developed using the Phase I and Phase II CLRPs as the basis for the costs. Section 7 describes the detailed cost assumptions, models developed, and methods used.
A summary of the Division’s estimated hard asset replacement costs are provided in Figure 3-1. Based on the hard asset inventory summarized and the estimated replacement cost of each asset, the replacement cost in 2013 dollars of the Division’s hard assets is approximately $3,487M. Figure 2-3 also presents the
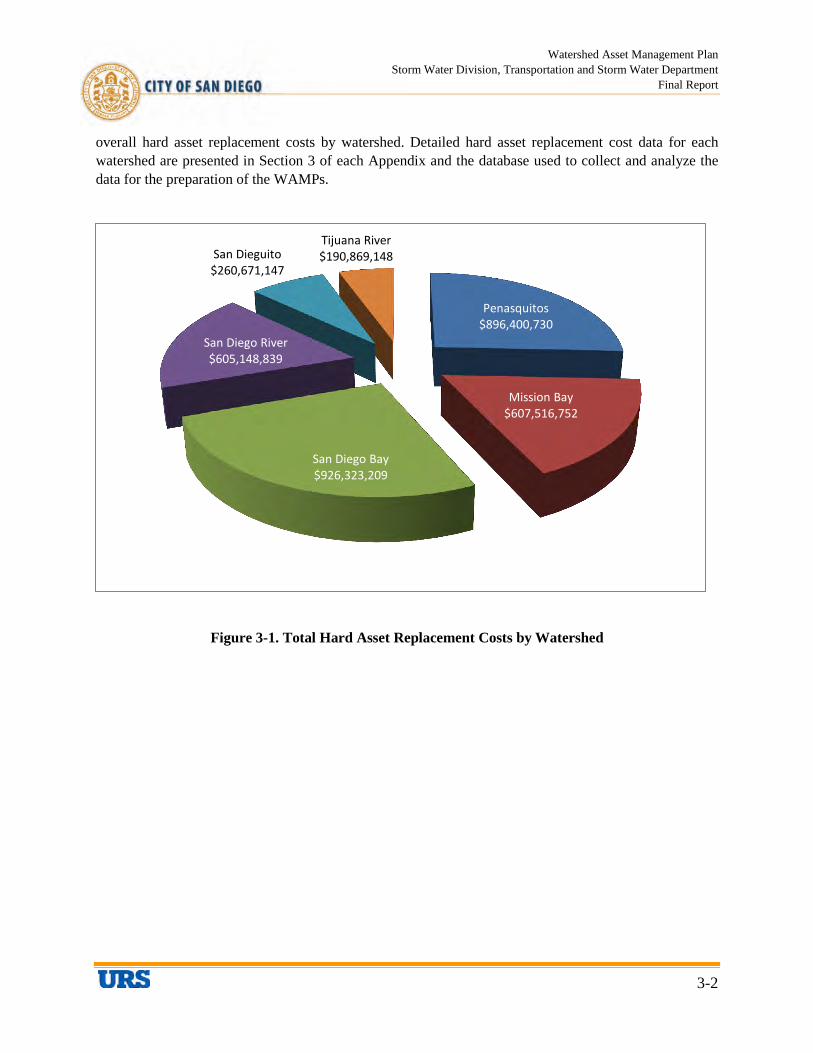
Watershed Asset Management Plan Storm Water Division, Transportation and Storm Water Department
Final Report
3-2
overall hard asset replacement costs by watershed. Detailed hard asset replacement cost data for each watershed are presented in Section 3 of each Appendix and the database used to collect and analyze the data for the preparation of the WAMPs.
Figure 3-1. Total Hard Asset Replacement Costs by Watershed
Penasquitos $896,400,730
Mission Bay $607,516,752
San Diego Bay $926,323,209
San Diego River $605,148,839
San Dieguito $260,671,147
Tijuana River $190,869,148
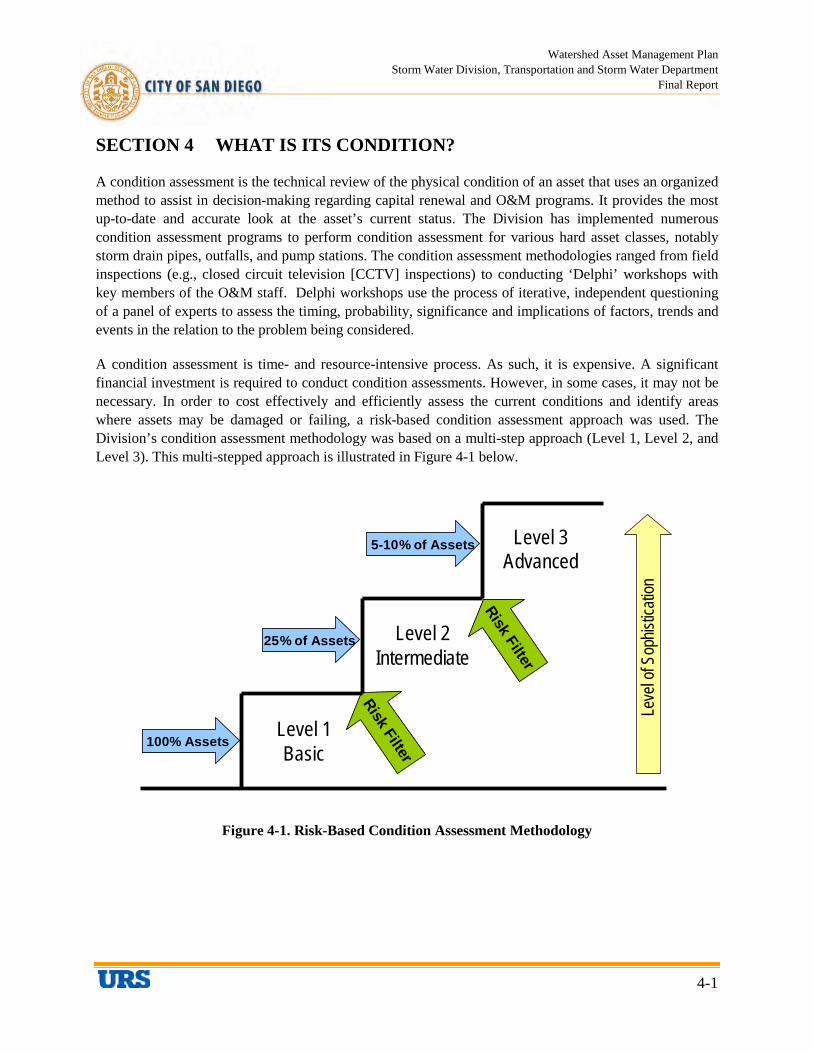
Watershed Asset Management Plan Storm Water Division, Transportation and Storm Water Department
Final Report
4-1
SECTION 4 WHAT IS ITS CONDITION?
A condition assessment is the technical review of the physical condition of an asset that uses an organized method to assist in decision-making regarding capital renewal and O&M programs. It provides the most up-to-date and accurate look at the asset’s current status. The Division has implemented numerous condition assessment programs to perform condition assessment for various hard asset classes, notably storm drain pipes, outfalls, and pump stations. The condition assessment methodologies ranged from field inspections (e.g., closed circuit television [CCTV] inspections) to conducting ‘Delphi’ workshops with key members of the O&M staff. Delphi workshops use the process of iterative, independent questioning of a panel of experts to assess the timing, probability, significance and implications of factors, trends and events in the relation to the problem being considered.
A condition assessment is time- and resource-intensive process. As such, it is expensive. A significant financial investment is required to conduct condition assessments. However, in some cases, it may not be necessary. In order to cost effectively and efficiently assess the current conditions and identify areas where assets may be damaged or failing, a risk-based condition assessment approach was used. The Division’s condition assessment methodology was based on a multi-step approach (Level 1, Level 2, and Level 3). This multi-stepped approach is illustrated in Figure 4-1 below.
Figure 4-1. Risk-Based Condition Assessment Methodology
Level 3
Advanced
Level 2Intermediate
Level 1Basic
25% of Assets25% of Assets
Risk Filter
Risk Filter
5-10% of Assets5-10% of Assets
100% Assets100% Assets
Risk Filter
Risk Filter
Leve
l of S
ophis
ticati
on

Watershed Asset Management Plan Storm Water Division, Transportation and Storm Water Department
Final Report
4-2
At the basic level (Level 1), the idea is to identify assets that are in poor condition and pose the greatest risk to the Division without undertaking field evaluations. Capitalizing on the engineering and field staff’s historical and current knowledge of the storm drainage system, a high-level assessment is conducted to capture known conditions (e.g., assets already failing, known problematic areas, and historical condition data). Where condition data are not available, a statistical deterioration modeling process is used to estimate the condition. The deterioration modeling processes use asset attributes (e.g., year installed, type, useful life), decay curves, and staff knowledge to estimate a condition for the asset.
After the Level 1 condition assessment is completed, a risk assessment is performed. Section 6 introduces the risk methodology used to prioritize the Division’s assets and projects.
At Level 2, assets are subjected to more detailed investigation (e.g., CCTV inspection). The assets that might require further analysis are recommended for an advanced level (Level 3) assessment. The risk-based condition assessment methodology will allow the Division to efficiently and effectively develop a justifiable and prioritized condition assessment schedule. Not all assets need to be inspected (e.g., low risk assets). The justification being, even with a failure, those assets pose very low risk to the City. The Division’s limited resources and budget are better spent focusing on assets presenting the greater risk. The condition assessment methodology builds on the Division staff’s knowledge to optimize the condition assessment process and minimize the overall cost and risk to the Division.
In most cases, the field inspection strategy incorporated a sampling approach (e.g., not all drainage pipes were inspected). A sample area, identified as the most problematic, was inspected and the condition information learned was applied to other similar assets. Problematic areas were chosen because they require the most immediate attention. Where no condition information was available, an age-based estimation was performed. The age-based approach uses the asset’s useful life and establishes a condition score based on the remaining useful life. Figure 4-2 shows the relationship between condition and remaining useful life. The relationship between condition and age is based on the decay pattern of the asset. For example, Linear (0.74) was used to represent the decay pattern for structure assets.
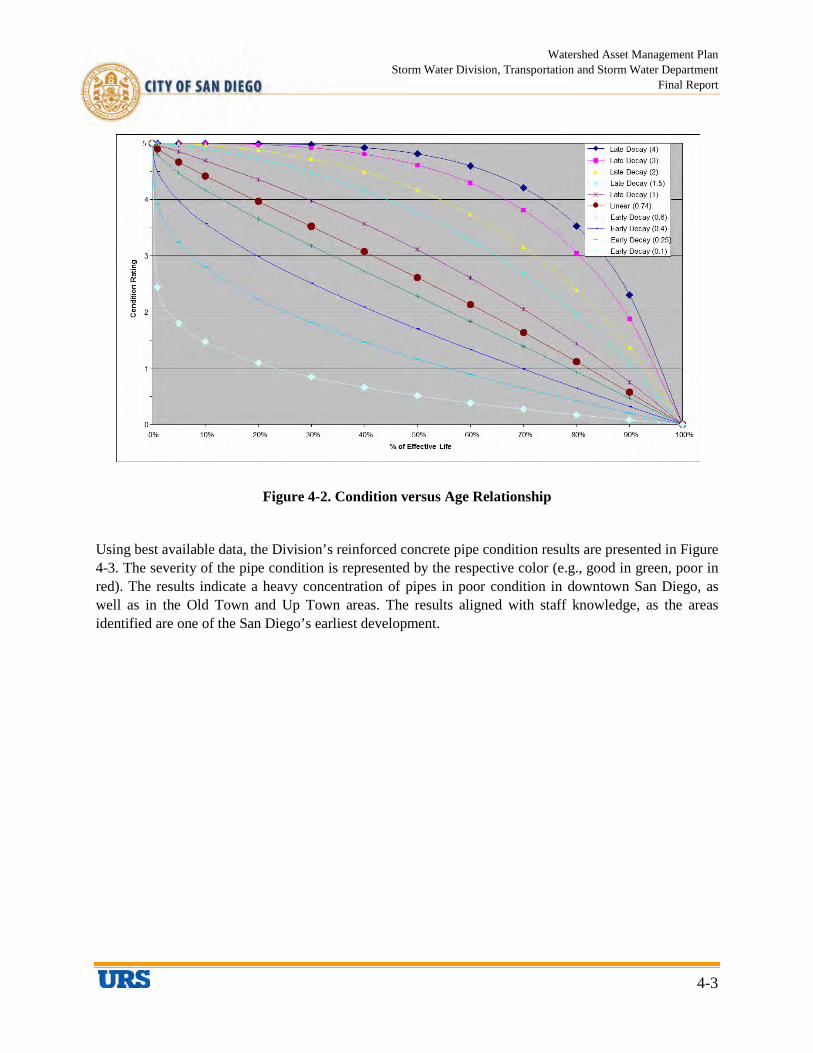
Watershed Asset Management Plan Storm Water Division, Transportation and Storm Water Department
Final Report
4-3
Figure 4-2. Condition versus Age Relationship
Using best available data, the Division’s reinforced concrete pipe condition results are presented in Figure 4-3. The severity of the pipe condition is represented by the respective color (e.g., good in green, poor in red). The results indicate a heavy concentration of pipes in poor condition in downtown San Diego, as well as in the Old Town and Up Town areas. The results aligned with staff knowledge, as the areas identified are one of the San Diego’s earliest development.
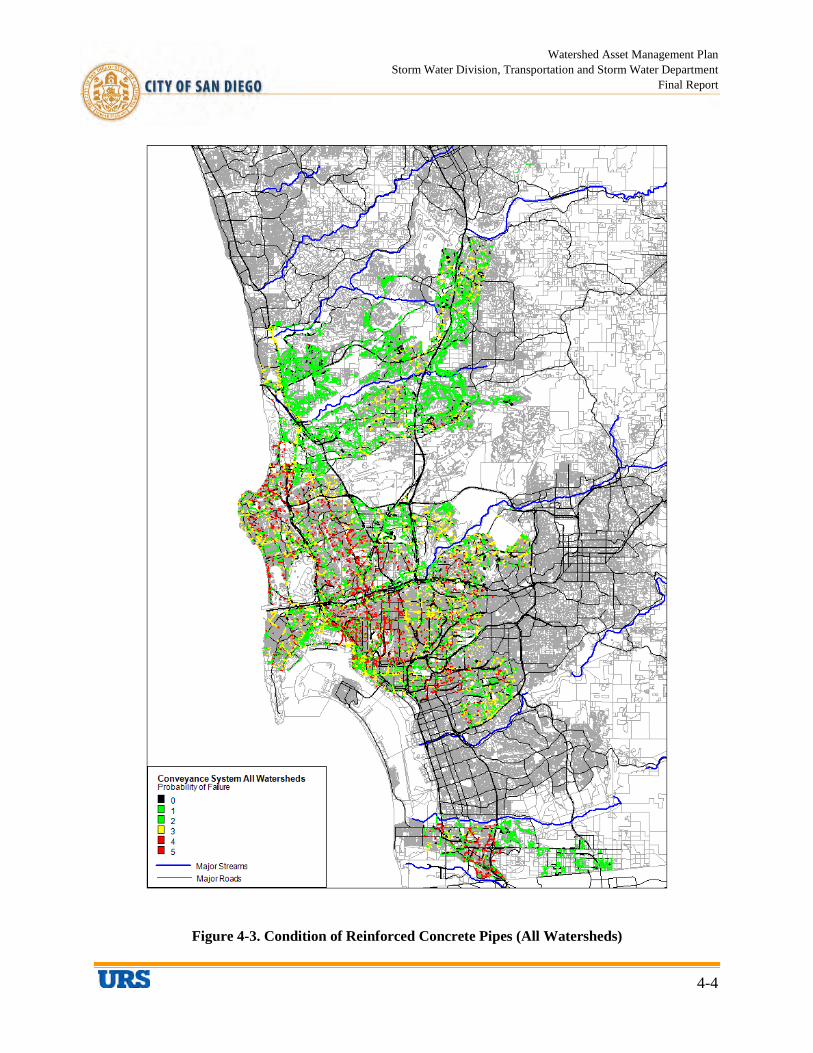
Watershed Asset Management Plan Storm Water Division, Transportation and Storm Water Department
Final Report
4-4
Figure 4-3. Condition of Reinforced Concrete Pipes (All Watersheds)
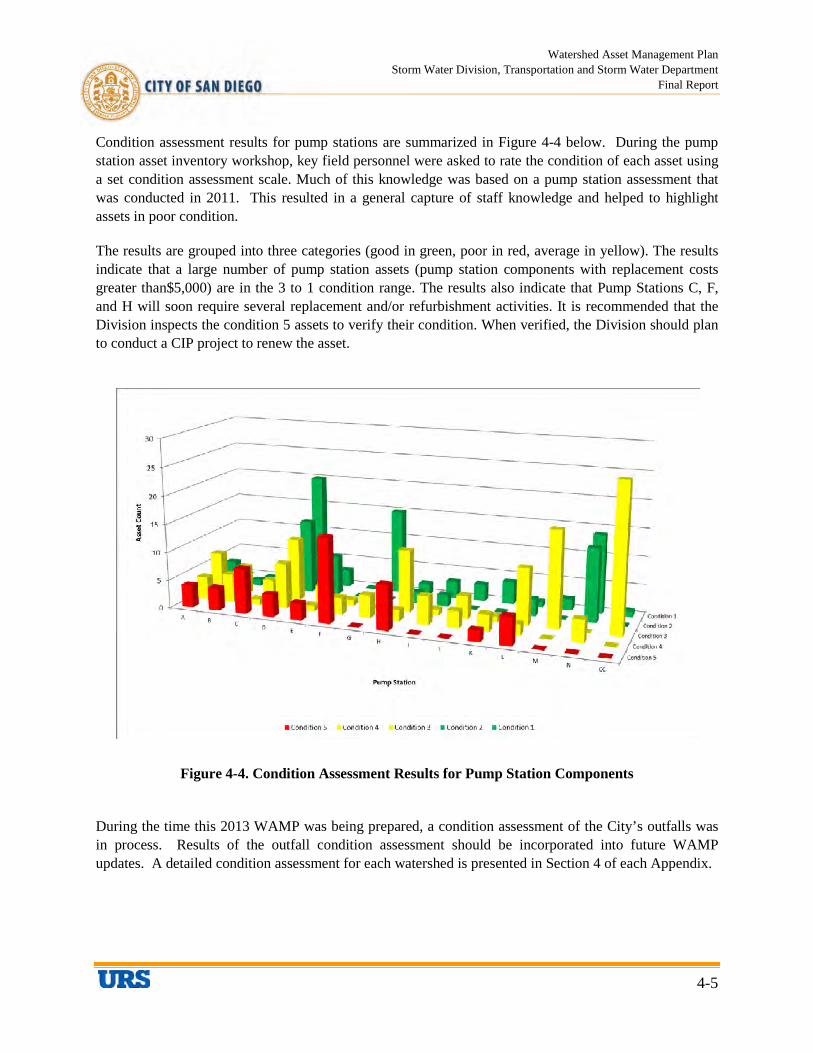
Watershed Asset Management Plan Storm Water Division, Transportation and Storm Water Department
Final Report
4-5
Condition assessment results for pump stations are summarized in Figure 4-4 below. During the pump station asset inventory workshop, key field personnel were asked to rate the condition of each asset using a set condition assessment scale. Much of this knowledge was based on a pump station assessment that was conducted in 2011. This resulted in a general capture of staff knowledge and helped to highlight assets in poor condition.
The results are grouped into three categories (good in green, poor in red, average in yellow). The results indicate that a large number of pump station assets (pump station components with replacement costs greater than$5,000) are in the 3 to 1 condition range. The results also indicate that Pump Stations C, F, and H will soon require several replacement and/or refurbishment activities. It is recommended that the Division inspects the condition 5 assets to verify their condition. When verified, the Division should plan to conduct a CIP project to renew the asset.
Figure 4-4. Condition Assessment Results for Pump Station Components
During the time this 2013 WAMP was being prepared, a condition assessment of the City’s outfalls was in process. Results of the outfall condition assessment should be incorporated into future WAMP updates. A detailed condition assessment for each watershed is presented in Section 4 of each Appendix.

Watershed Asset Management Plan Storm Water Division, Transportation and Storm Water Department
Final Report
4-6
The condition of soft and natural assets was also assessed. The condition was assigned based on the Division staff’s perception of the ability of the asset to achieve its LOS(s). As with hard assets, the condition results are grouped into three categories good (green), average (yellow), and poor (red). Results of the condition of soft and natural assets are presented in Figures 4-5 and 4-6, respectively.
Figure 4-5. Condition Assessment Results for Soft Assets
Figure 4-6. Condition Assessment Results for Natural Assets
GoodAveragePoor
0123456
LOS07
LOS08, 52
LOS09, 51,
56
LOS10
Los 11 LOS12a,55a
LOS12b,55b
LOS17
LOS24
LOS25
LOS26
LOS27, 32,33, 34,
35
LOS28
LOS36
LOS49, 54
Asse
t Cou
nt
Good Average Poor
GoodAveragePoor0
123456
LOS 04 LOS 13a LOS 13b LOS 14 LOS 18LOS 19
LOS 47
Asse
t Cou
nt
Good Average Poor
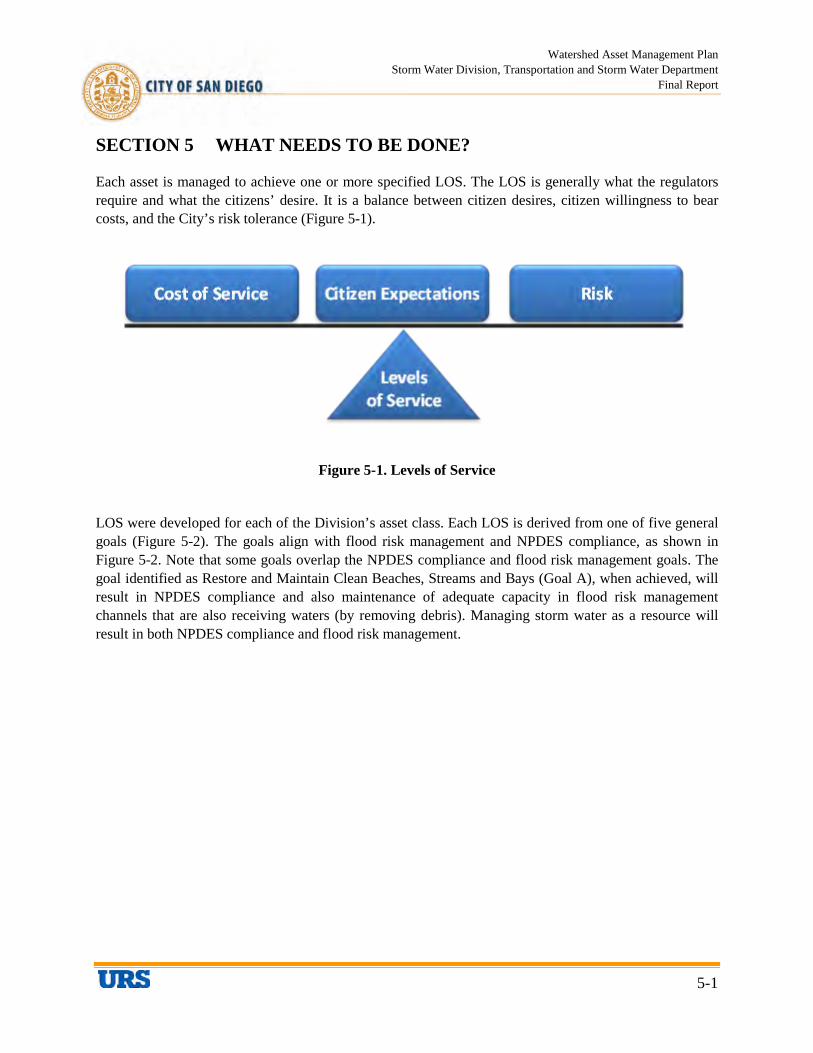
Watershed Asset Management Plan Storm Water Division, Transportation and Storm Water Department
Final Report
5-1
SECTION 5 WHAT NEEDS TO BE DONE?
Each asset is managed to achieve one or more specified LOS. The LOS is generally what the regulators require and what the citizens’ desire. It is a balance between citizen desires, citizen willingness to bear costs, and the City’s risk tolerance (Figure 5-1).
Figure 5-1. Levels of Service
LOS were developed for each of the Division’s asset class. Each LOS is derived from one of five general goals (Figure 5-2). The goals align with flood risk management and NPDES compliance, as shown in Figure 5-2. Note that some goals overlap the NPDES compliance and flood risk management goals. The goal identified as Restore and Maintain Clean Beaches, Streams and Bays (Goal A), when achieved, will result in NPDES compliance and also maintenance of adequate capacity in flood risk management channels that are also receiving waters (by removing debris). Managing storm water as a resource will result in both NPDES compliance and flood risk management.
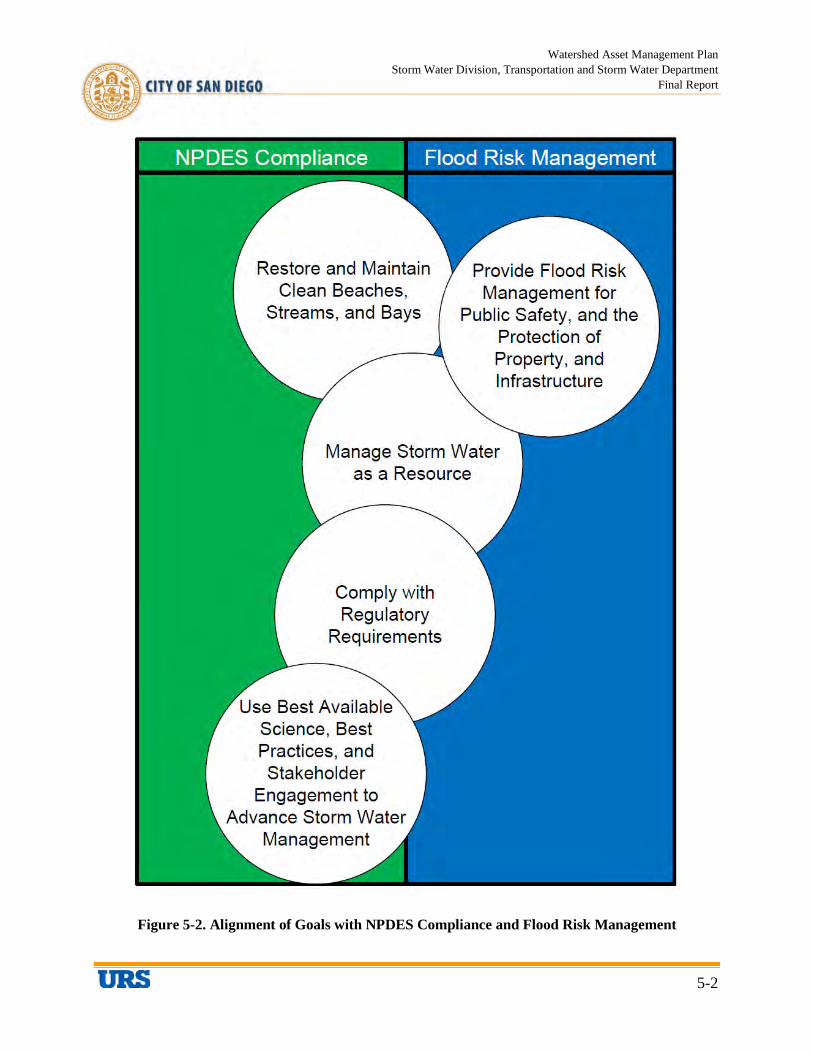
Watershed Asset Management Plan Storm Water Division, Transportation and Storm Water Department
Final Report
5-2
Figure 5-2. Alignment of Goals with NPDES Compliance and Flood Risk Management

Watershed Asset Management Plan Storm Water Division, Transportation and Storm Water Department
Final Report
5-3
Using best available science, best practices, and stakeholder engagement to advance storm water management will result in NPDES compliance and, at times, flood risk management. It will result in flood risk management when best available science allows for channel maintenance to occur without causing adverse impacts to other beneficiaries of the receiving water.
The assets are managed by the Division to achieve LOS that result in the achievement of the goals. The assets were segregated into primary and secondary LOS. Primary LOS are those that directly achieve one of the five goals. Secondary LOS are those that achieve a primary LOS. Table 5-1 shows the LOS that were developed for each asset class, how they relate to their specific secondary assets, and how they relate to the primary asset and its LOS. These LOS were developed through a series of workshops with Division staff and approved by the Division Deputy Director. These LOS should be re-evaluate from time-to-time to ensure they reflect current regulatory requirements and the citizens’ desire. The appendices present information regarding whether the assets are achieving their specified LOS, when they will fail to achieve their LOS, and what actions are needed for the assets to achieve their LOS. In some cases, the LOS refer to a schedule contained in the WAMP. For these situations, the schedule is documented in the supporting WAMP database (i.e., TEAMPlan). Specifically, schedules for specific actions to achieve the LOS can be interpreted as the times when costs are incurred to perform operation and maintenance activities or when there is a capital expenditure.

Watershed Asset Management Plan Storm Water Division, Transportation and Storm Water Department
Final Report
5-4
This page intentionally left blank
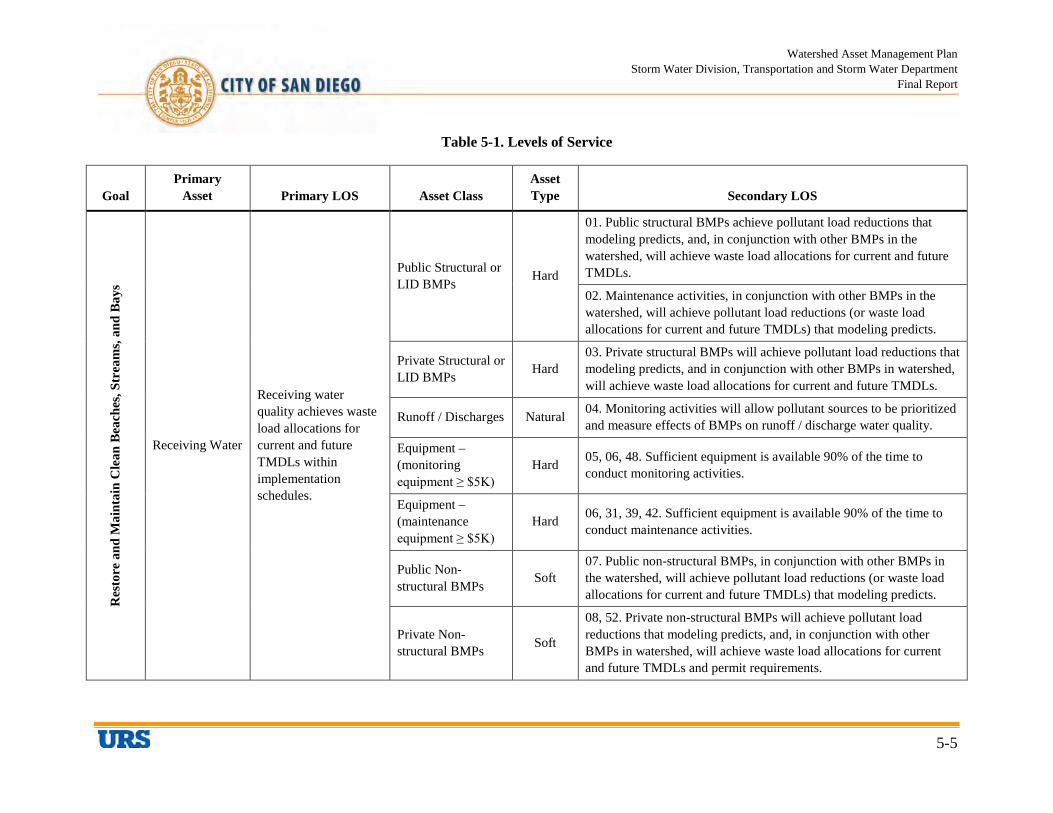
Watershed Asset Management Plan Storm Water Division, Transportation and Storm Water Department
Final Report
5-5
Table 5-1. Levels of Service
Goal Primary
Asset Primary LOS Asset Class Asset Type Secondary LOS
Res
tore
and
Mai
ntai
n C
lean
Bea
ches
, Str
eam
s, an
d B
ays
Receiving Water
Receiving water quality achieves waste load allocations for current and future TMDLs within implementation schedules.
Public Structural or LID BMPs Hard
01. Public structural BMPs achieve pollutant load reductions that modeling predicts, and, in conjunction with other BMPs in the watershed, will achieve waste load allocations for current and future TMDLs.
02. Maintenance activities, in conjunction with other BMPs in the watershed, will achieve pollutant load reductions (or waste load allocations for current and future TMDLs) that modeling predicts.
Private Structural or LID BMPs Hard
03. Private structural BMPs will achieve pollutant load reductions that modeling predicts, and in conjunction with other BMPs in watershed, will achieve waste load allocations for current and future TMDLs.
Runoff / Discharges Natural 04. Monitoring activities will allow pollutant sources to be prioritized and measure effects of BMPs on runoff / discharge water quality.
Equipment – (monitoring equipment ≥ $5K)
Hard 05, 06, 48. Sufficient equipment is available 90% of the time to conduct monitoring activities.
Equipment – (maintenance equipment ≥ $5K)
Hard 06, 31, 39, 42. Sufficient equipment is available 90% of the time to conduct maintenance activities.
Public Non-structural BMPs Soft
07. Public non-structural BMPs, in conjunction with other BMPs in the watershed, will achieve pollutant load reductions (or waste load allocations for current and future TMDLs) that modeling predicts.
Private Non-structural BMPs Soft
08, 52. Private non-structural BMPs will achieve pollutant load reductions that modeling predicts, and, in conjunction with other BMPs in watershed, will achieve waste load allocations for current and future TMDLs and permit requirements.
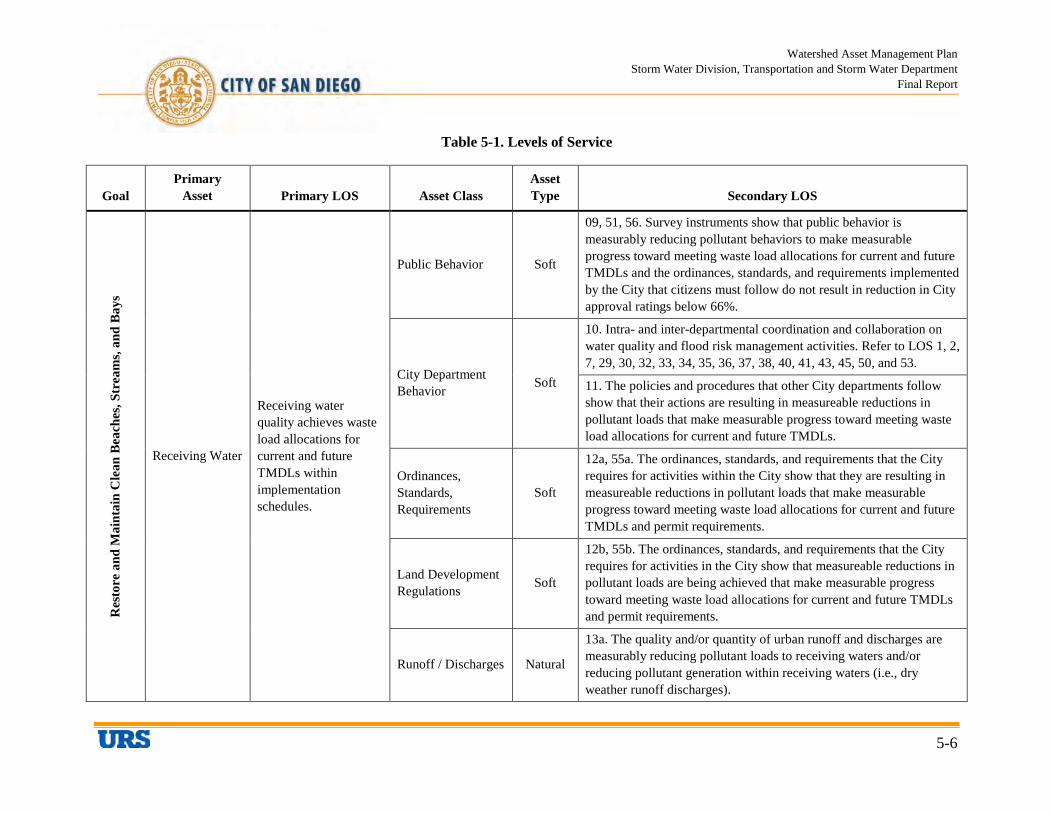
Watershed Asset Management Plan Storm Water Division, Transportation and Storm Water Department
Final Report
5-6
Table 5-1. Levels of Service
Goal Primary
Asset Primary LOS Asset Class Asset Type Secondary LOS
Res
tore
and
Mai
ntai
n C
lean
Bea
ches
, Str
eam
s, an
d B
ays
Receiving Water
Receiving water quality achieves waste load allocations for current and future TMDLs within implementation schedules.
Public Behavior Soft
09, 51, 56. Survey instruments show that public behavior is measurably reducing pollutant behaviors to make measurable progress toward meeting waste load allocations for current and future TMDLs and the ordinances, standards, and requirements implemented by the City that citizens must follow do not result in reduction in City approval ratings below 66%.
City Department Behavior Soft
10. Intra- and inter-departmental coordination and collaboration on water quality and flood risk management activities. Refer to LOS 1, 2, 7, 29, 30, 32, 33, 34, 35, 36, 37, 38, 40, 41, 43, 45, 50, and 53.
11. The policies and procedures that other City departments follow show that their actions are resulting in measureable reductions in pollutant loads that make measurable progress toward meeting waste load allocations for current and future TMDLs.
Ordinances, Standards, Requirements
Soft
12a, 55a. The ordinances, standards, and requirements that the City requires for activities within the City show that they are resulting in measureable reductions in pollutant loads that make measurable progress toward meeting waste load allocations for current and future TMDLs and permit requirements.
Land Development Regulations Soft
12b, 55b. The ordinances, standards, and requirements that the City requires for activities in the City show that measureable reductions in pollutant loads are being achieved that make measurable progress toward meeting waste load allocations for current and future TMDLs and permit requirements.
Runoff / Discharges Natural
13a. The quality and/or quantity of urban runoff and discharges are measurably reducing pollutant loads to receiving waters and/or reducing pollutant generation within receiving waters (i.e., dry weather runoff discharges).
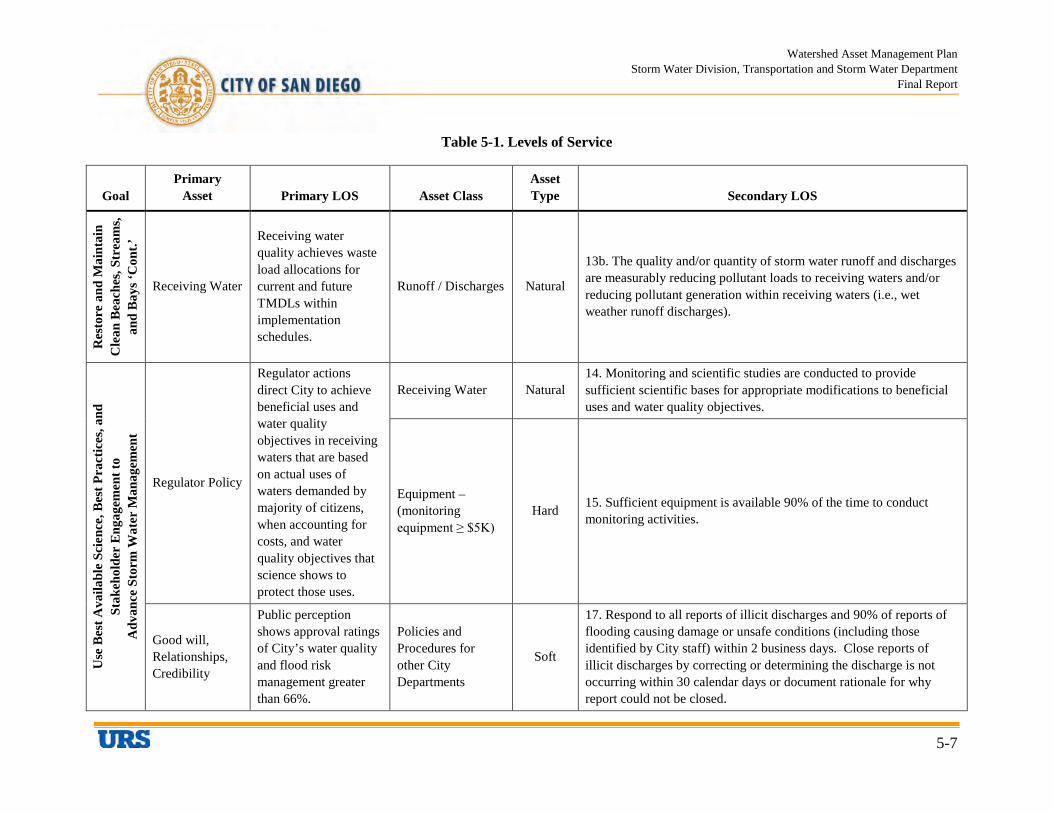
Watershed Asset Management Plan Storm Water Division, Transportation and Storm Water Department
Final Report
5-7
Table 5-1. Levels of Service
Goal Primary
Asset Primary LOS Asset Class Asset Type Secondary LOS
Res
tore
and
Mai
ntai
n C
lean
Bea
ches
, Str
eam
s, an
d B
ays ‘
Con
t.’
Receiving Water
Receiving water quality achieves waste load allocations for current and future TMDLs within implementation schedules.
Runoff / Discharges Natural
13b. The quality and/or quantity of storm water runoff and discharges are measurably reducing pollutant loads to receiving waters and/or reducing pollutant generation within receiving waters (i.e., wet weather runoff discharges).
Use
Bes
t Ava
ilabl
e Sc
ienc
e, B
est P
ract
ices
, and
St
akeh
olde
r E
ngag
emen
t to
A
dvan
ce S
torm
Wat
er M
anag
emen
t
Regulator Policy
Regulator actions direct City to achieve beneficial uses and water quality objectives in receiving waters that are based on actual uses of waters demanded by majority of citizens, when accounting for costs, and water quality objectives that science shows to protect those uses.
Receiving Water Natural 14. Monitoring and scientific studies are conducted to provide sufficient scientific bases for appropriate modifications to beneficial uses and water quality objectives.
Equipment – (monitoring equipment ≥ $5K)
Hard 15. Sufficient equipment is available 90% of the time to conduct monitoring activities.
Good will, Relationships, Credibility
Public perception shows approval ratings of City’s water quality and flood risk management greater than 66%.
Policies and Procedures for other City Departments
Soft
17. Respond to all reports of illicit discharges and 90% of reports of flooding causing damage or unsafe conditions (including those identified by City staff) within 2 business days. Close reports of illicit discharges by correcting or determining the discharge is not occurring within 30 calendar days or document rationale for why report could not be closed.

Watershed Asset Management Plan Storm Water Division, Transportation and Storm Water Department
Final Report
5-8
Table 5-1. Levels of Service
Goal Primary
Asset Primary LOS Asset Class Asset Type Secondary LOS
Man
age
Stor
m W
ater
as a
Res
ourc
e
Runoff / Discharges
Storm water runoff is captured for beneficial use when the project costs meet the formula of being less than or equal to the costs of developing an alternative local water resource (recycled water or ocean desalination) plus the costs of treating the runoff to meet storm water quality management requirements.
MHPAs Natural 18. Where costs meet the formula, runoff is treated, stored and/or infiltrated within the MHPAs within the timeframes identified within the Watershed Asset Management Plan.
City Property Natural 19. Where costs meet the formula, runoff is treated, stored and/or infiltrated within the City Parcels within the timeframes identified within the Watershed Asset Management Plan.
Channels Hard 20. Where costs meet the formula, water is diverted from channels into water storage systems for beneficial use within time frames identified in each WAMP.
Pipes Hard 21. Where costs meet the formula, water is diverted from storm drain pipes into water storage systems for beneficial use within time frames identified in WAMP.
Dams / Hydraulic Structures Hard
22. Dams and hydraulic structures are installed or upgraded where costs meet the formula, to capture, divert, and/or store storm water for beneficial use within timeframes identified in each WAMP.
D/Retention Basins Hard 23. Detention and/or retention basins are installed or upgraded where costs meet the formula, to capture, divert, and/or store storm water for beneficial use within time frames identified in each WAMP.
City Department Behavior Soft
24. The Water Branch takes the lead and sponsors storm water harvesting projects with costs shared based on benefits shared between water supply and NPDES compliance. The Division is responsible for infrastructure associated with NPDES compliance (i.e., storm water capture, containment or infiltration).
25. Other City departments cooperate by allowing the use of its parcels to capture, infiltrate, and / or store storm water for beneficial use.

Watershed Asset Management Plan Storm Water Division, Transportation and Storm Water Department
Final Report
5-9
Table 5-1. Levels of Service
Goal Primary
Asset Primary LOS Asset Class Asset Type Secondary LOS
Man
age
Stor
m W
ater
as a
Res
ourc
e ‘C
ont.”
Runoff / Discharges
Storm water runoff is captured for beneficial use when the project costs meet the formula of being less than or equal to the costs of developing an alternative local water resource (recycled water or ocean desalination) plus the costs of treating the runoff to meet storm water quality management requirements.
Good Will, Relationships, Credibility
Soft
26. Survey instruments show 66% or greater public acceptance of storm water harvesting for non-potable use.
27, 32, 33, 34, 35. Projects are not stopped by stakeholders or regulators through effective coordination and communication.
Regulatory Policy Soft 34. Coordinate with stakeholders on channel maintenance projects.
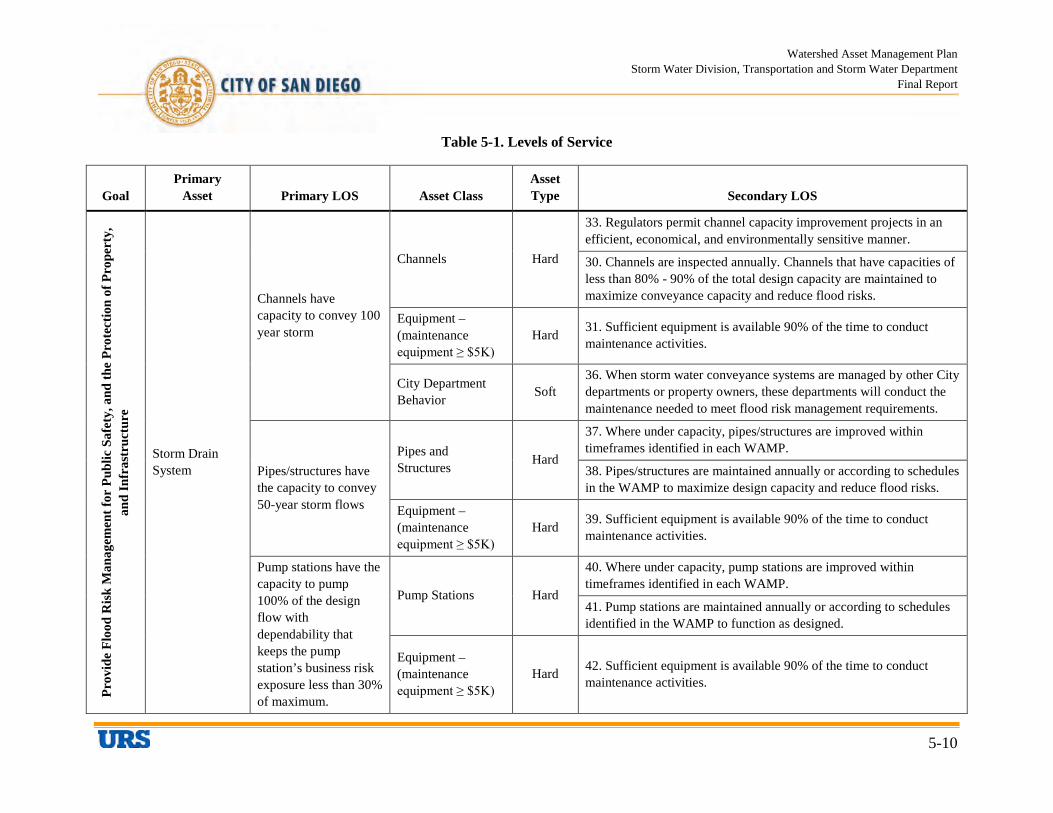
Watershed Asset Management Plan Storm Water Division, Transportation and Storm Water Department
Final Report
5-10
Table 5-1. Levels of Service
Goal Primary
Asset Primary LOS Asset Class Asset Type Secondary LOS
Prov
ide
Floo
d R
isk
Man
agem
ent f
or P
ublic
Saf
ety,
and
the
Prot
ectio
n of
Pro
pert
y,
and
Infr
astr
uctu
re
Storm Drain System
Channels have capacity to convey 100 year storm
Channels Hard
33. Regulators permit channel capacity improvement projects in an efficient, economical, and environmentally sensitive manner.
30. Channels are inspected annually. Channels that have capacities of less than 80% - 90% of the total design capacity are maintained to maximize conveyance capacity and reduce flood risks.
Equipment – (maintenance equipment ≥ $5K)
Hard 31. Sufficient equipment is available 90% of the time to conduct maintenance activities.
City Department Behavior Soft
36. When storm water conveyance systems are managed by other City departments or property owners, these departments will conduct the maintenance needed to meet flood risk management requirements.
Pipes/structures have the capacity to convey 50-year storm flows
Pipes and Structures Hard
37. Where under capacity, pipes/structures are improved within timeframes identified in each WAMP.
38. Pipes/structures are maintained annually or according to schedules in the WAMP to maximize design capacity and reduce flood risks.
Equipment – (maintenance equipment ≥ $5K)
Hard 39. Sufficient equipment is available 90% of the time to conduct maintenance activities.
Pump stations have the capacity to pump 100% of the design flow with dependability that keeps the pump station’s business risk exposure less than 30% of maximum.
Pump Stations Hard
40. Where under capacity, pump stations are improved within timeframes identified in each WAMP.
41. Pump stations are maintained annually or according to schedules identified in the WAMP to function as designed.
Equipment – (maintenance equipment ≥ $5K)
Hard 42. Sufficient equipment is available 90% of the time to conduct maintenance activities.
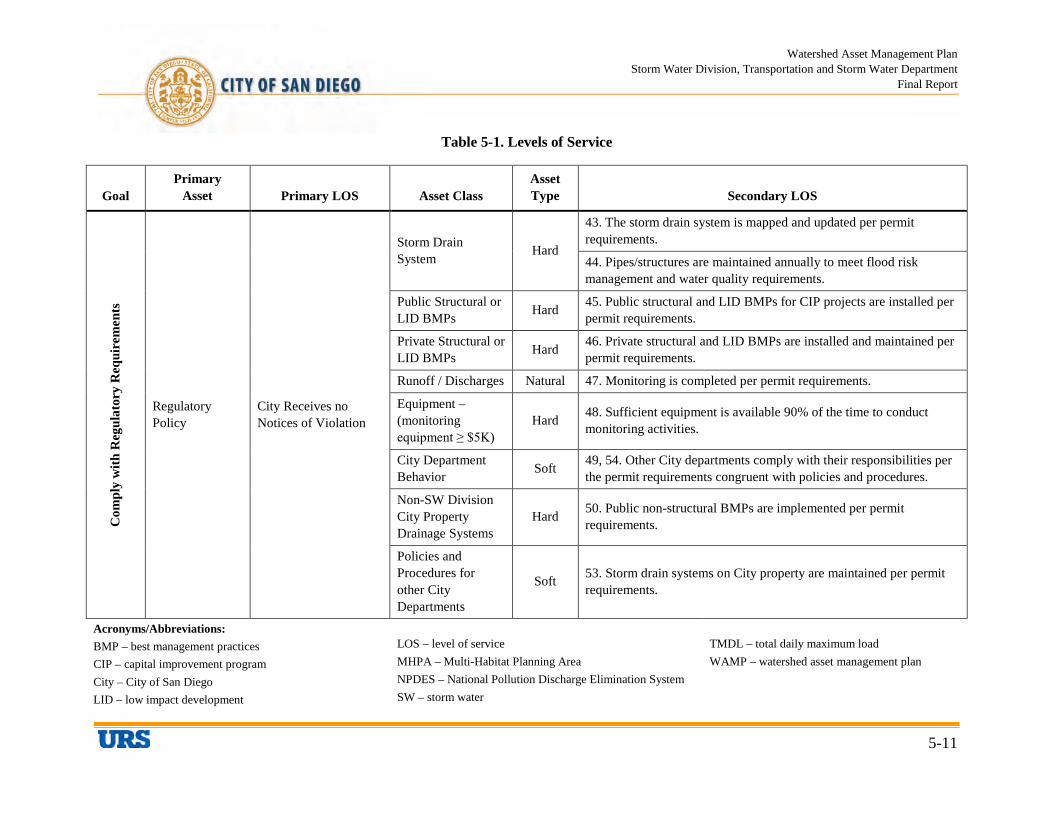
Watershed Asset Management Plan Storm Water Division, Transportation and Storm Water Department
Final Report
5-11
Table 5-1. Levels of Service
Goal Primary
Asset Primary LOS Asset Class Asset Type Secondary LOS
Com
ply
with
Reg
ulat
ory
Req
uire
men
ts
Regulatory Policy
City Receives no Notices of Violation
Storm Drain System Hard
43. The storm drain system is mapped and updated per permit requirements.
44. Pipes/structures are maintained annually to meet flood risk management and water quality requirements.
Public Structural or LID BMPs Hard 45. Public structural and LID BMPs for CIP projects are installed per
permit requirements.
Private Structural or LID BMPs Hard 46. Private structural and LID BMPs are installed and maintained per
permit requirements.
Runoff / Discharges Natural 47. Monitoring is completed per permit requirements.
Equipment – (monitoring equipment ≥ $5K)
Hard 48. Sufficient equipment is available 90% of the time to conduct monitoring activities.
City Department Behavior Soft 49, 54. Other City departments comply with their responsibilities per
the permit requirements congruent with policies and procedures.
Non-SW Division City Property Drainage Systems
Hard 50. Public non-structural BMPs are implemented per permit requirements.
Policies and Procedures for other City Departments
Soft 53. Storm drain systems on City property are maintained per permit requirements.
Acronyms/Abbreviations: BMP – best management practices CIP – capital improvement program City – City of San Diego LID – low impact development
LOS – level of service MHPA – Multi-Habitat Planning Area NPDES – National Pollution Discharge Elimination System SW – storm water
TMDL – total daily maximum load WAMP – watershed asset management plan
Watershed Asset Management Plan Storm Water Division, Transportation and Storm Water Department
Final Report
5-12
This page intentionally left blank
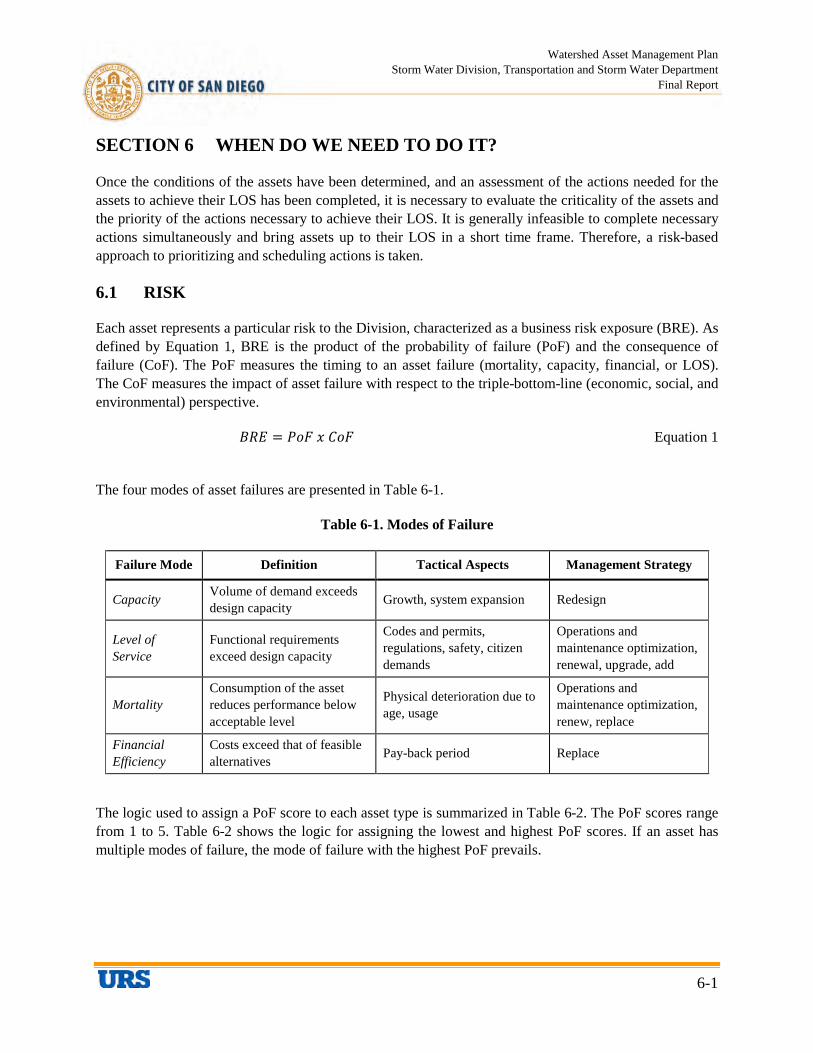
Watershed Asset Management Plan Storm Water Division, Transportation and Storm Water Department
Final Report
6-1
SECTION 6 WHEN DO WE NEED TO DO IT?
Once the conditions of the assets have been determined, and an assessment of the actions needed for the assets to achieve their LOS has been completed, it is necessary to evaluate the criticality of the assets and the priority of the actions necessary to achieve their LOS. It is generally infeasible to complete necessary actions simultaneously and bring assets up to their LOS in a short time frame. Therefore, a risk-based approach to prioritizing and scheduling actions is taken.
6.1 RISK
Each asset represents a particular risk to the Division, characterized as a business risk exposure (BRE). As defined by Equation 1, BRE is the product of the probability of failure (PoF) and the consequence of failure (CoF). The PoF measures the timing to an asset failure (mortality, capacity, financial, or LOS). The CoF measures the impact of asset failure with respect to the triple-bottom-line (economic, social, and environmental) perspective.
𝐵𝑅𝐸 = 𝑃𝑜𝐹 𝑥 𝐶𝑜𝐹 Equation 1
The four modes of asset failures are presented in Table 6-1.
Table 6-1. Modes of Failure
Failure Mode Definition Tactical Aspects Management Strategy
Capacity Volume of demand exceeds design capacity Growth, system expansion Redesign
Level of Service
Functional requirements exceed design capacity
Codes and permits, regulations, safety, citizen demands
Operations and maintenance optimization, renewal, upgrade, add
Mortality Consumption of the asset reduces performance below acceptable level
Physical deterioration due to age, usage
Operations and maintenance optimization, renew, replace
Financial Efficiency
Costs exceed that of feasible alternatives Pay-back period Replace
The logic used to assign a PoF score to each asset type is summarized in Table 6-2. The PoF scores range from 1 to 5. Table 6-2 shows the logic for assigning the lowest and highest PoF scores. If an asset has multiple modes of failure, the mode of failure with the highest PoF prevails.
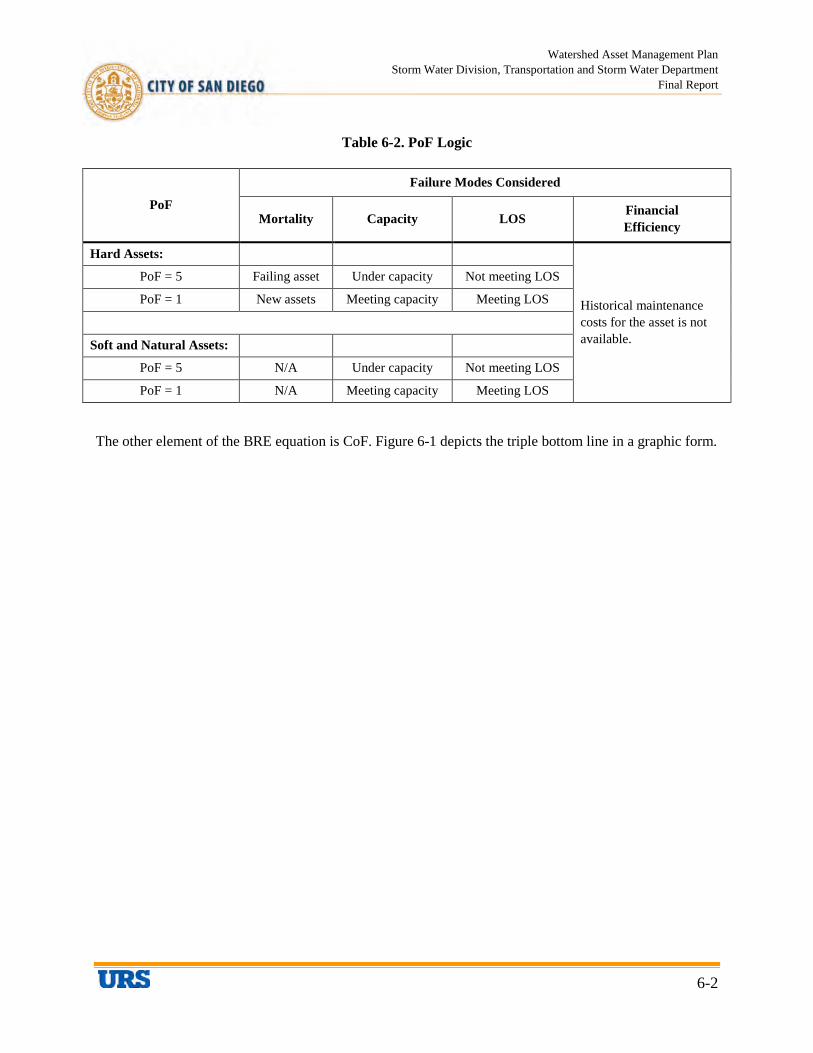
Watershed Asset Management Plan Storm Water Division, Transportation and Storm Water Department
Final Report
6-2
Table 6-2. PoF Logic
PoF
Failure Modes Considered
Mortality Capacity LOS Financial Efficiency
Hard Assets:
Historical maintenance costs for the asset is not available.
PoF = 5 Failing asset Under capacity Not meeting LOS
PoF = 1 New assets Meeting capacity Meeting LOS
Soft and Natural Assets:
PoF = 5 N/A Under capacity Not meeting LOS
PoF = 1 N/A Meeting capacity Meeting LOS
The other element of the BRE equation is CoF. Figure 6-1 depicts the triple bottom line in a graphic form.
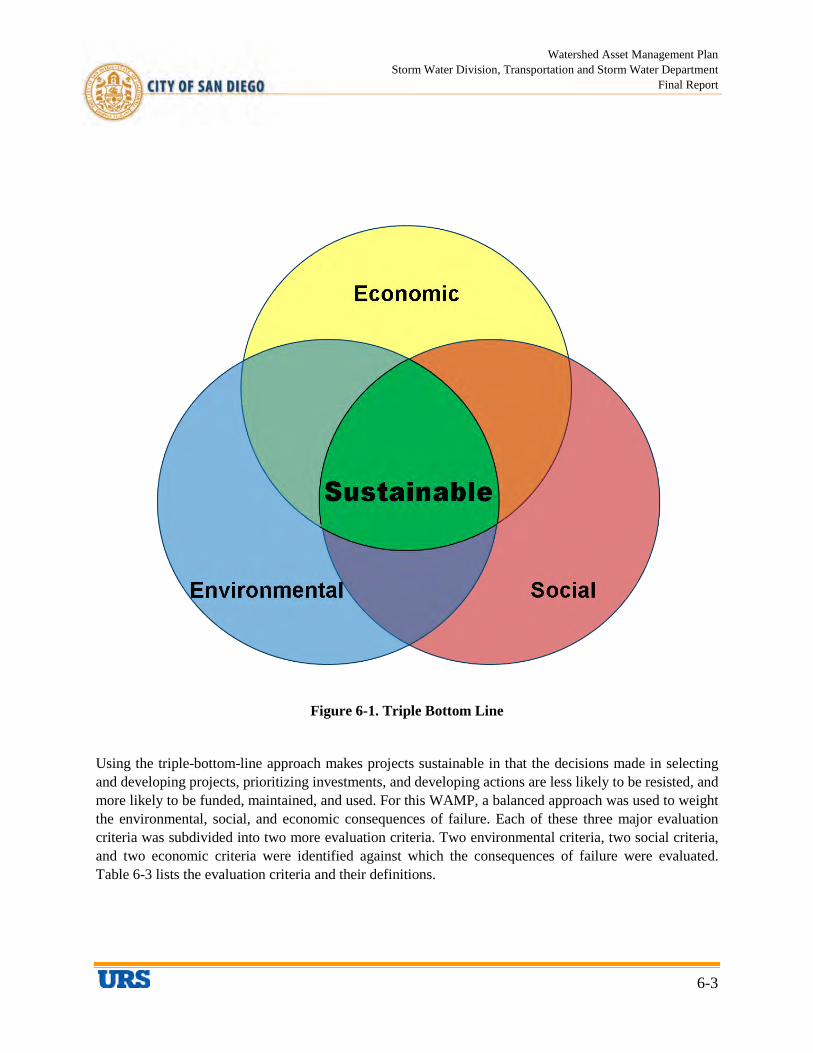
Watershed Asset Management Plan Storm Water Division, Transportation and Storm Water Department
Final Report
6-3
Figure 6-1. Triple Bottom Line
Using the triple-bottom-line approach makes projects sustainable in that the decisions made in selecting and developing projects, prioritizing investments, and developing actions are less likely to be resisted, and more likely to be funded, maintained, and used. For this WAMP, a balanced approach was used to weight the environmental, social, and economic consequences of failure. Each of these three major evaluation criteria was subdivided into two more evaluation criteria. Two environmental criteria, two social criteria, and two economic criteria were identified against which the consequences of failure were evaluated. Table 6-3 lists the evaluation criteria and their definitions.

Watershed Asset Management Plan Storm Water Division, Transportation and Storm Water Department
Final Report
6-4
Table 6-3. Definitions of Consequence of Failure Categories
Category Subcategory Description
Social
Public Perception Public perception of City's performance declines. This includes external or non-quantifiable potential economic costs associated with a decline in public perception of City performance.
Public Health and Safety
Injuries, death, or property damage occurs. This includes external or non-quantifiable potential economic costs associated with increased health or safety risks to citizens.
Environmental
Regulatory
Regulators take action. This includes external or non-quantifiable economic costs associated with a deterioration in trust of the regulators for which the City is taking appropriate actions to achieve compliance with a permit that is not explicit.
Environmental Quality
Measurements of environmental quality show declines (e.g. ecosystem health declines, standards are no longer met). This includes external or non-quantifiable economic costs associated with a degrading or degraded environmental quality or condition. Such economic costs could include reduction in property values, reductions in tourism, loss of jobs, and resulting reductions in tax revenues.
Economic
Short-term Financial Fines, settlements.
Long-term Financial Increased regulatory compliance costs, increased City of San Diego Storm Water Division requirements, increased costs to rebuild public trust, capital outlays, and for other reasons.
Each of the subcategories was weighted to account for its relative importance within the major categories. Each major category was given the same weight. Table 6-4 shows the relative weights assigned to the CoF for each subcategory and major category.
Table 6-4. CoF Category Weights
Category Sub-Category Weight % Overall Weight
Social Public Perception CoF
1 0.2 6.67
Public Health & Safety CoF 0.8 26.67
Environmental Regulatory CoF
1 0.7 23.33
Environmental Quality CoF 0.3 10.00
Economic Short Term Financial CoF
1 0.6 20.00
Long Term Financial CoF 0.4 13.33
Sum of Weights 3 3 100
Acronym: CoF – consequence of failure
Watershed Asset Management Plan Storm Water Division, Transportation and Storm Water Department
Final Report
6-5
A CoF score of 1 to 5 was assigned to each subcategory. This CoF was multiplied by the weight to achieve the overall weight percentage. The ultimate CoF could range from 3 to 15. For example, if the public perception of an asset failure would result in significant press coverage and pressure on elected officials, it was assigned a CoF of 5 for that category. That would be multiplied by 0.2 and then added to the CoF multiples for the other categories.
Due to the large number of assets, the CoF for hard assets is calculated using a systematic GIS-based approach that incorporates triple-bottom-line elements. The methodology also considers the previous Risk Assessment methodology adopted by the Division (Water Research Centre’s Sewer Rehabilitation Manual-SRM based method).
Specifically, the Repair Cost Factor (RCF) from the Pipeline Condition Assessment Strategy and Renewal Forecast, Appendix C, dated June 30, 2010 was used as one of the subcategory in Economic (SRM) and adding several new CoF elements to reflect the triple bottom line approach used in soft and natural assets.
Using the same triple-bottom-line approach, and considering additional information extracted from GIS, Table 6-5 summarizes the CoF components and over weight for hard assets. Main components in social and economic category consist of zoning and road class. Zoning consists of five different areas such as public services, business, airport and major tourist attractions, and schools. Road class consists of different types of roads such as freeway, prime arterial, major arterial, collector, local collector, and local street.
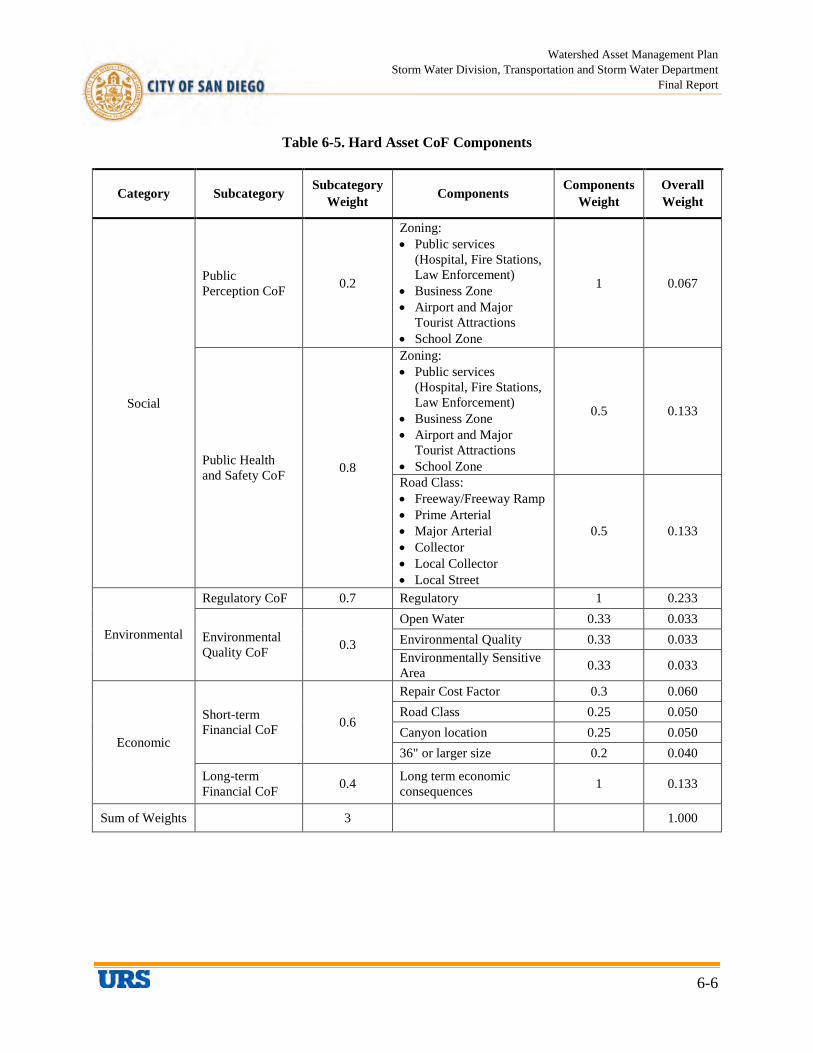
Watershed Asset Management Plan Storm Water Division, Transportation and Storm Water Department
Final Report
6-6
Table 6-5. Hard Asset CoF Components
Category Subcategory Subcategory Weight Components Components
Weight Overall Weight
Social
Public Perception CoF 0.2
Zoning: • Public services
(Hospital, Fire Stations, Law Enforcement)
• Business Zone • Airport and Major
Tourist Attractions • School Zone
1 0.067
Public Health and Safety CoF 0.8
Zoning: • Public services
(Hospital, Fire Stations, Law Enforcement)
• Business Zone • Airport and Major
Tourist Attractions • School Zone
0.5 0.133
Road Class: • Freeway/Freeway Ramp • Prime Arterial • Major Arterial • Collector • Local Collector • Local Street
0.5 0.133
Environmental
Regulatory CoF 0.7 Regulatory 1 0.233
Environmental Quality CoF 0.3
Open Water 0.33 0.033 Environmental Quality 0.33 0.033 Environmentally Sensitive Area 0.33 0.033
Economic
Short-term Financial CoF 0.6
Repair Cost Factor 0.3 0.060 Road Class 0.25 0.050 Canyon location 0.25 0.050 36" or larger size 0.2 0.040
Long-term Financial CoF 0.4 Long term economic
consequences 1 0.133
Sum of Weights 3 1.000

Watershed Asset Management Plan Storm Water Division, Transportation and Storm Water Department
Final Report
6-7
Repair Cost Factors (RCF) for pipelines is calculated based on depth, size, and soil type (see Table 6-6 below). Soils were assumed to be “good soil” (for construction purposes), unless they were within 20 feet of a creek or other water body. Note that for any pipes larger than 36 inches were also subject to a higher consequence of failure in regards to short-term economic impacts.
Table 6-6. Repair Cost Factor
Small-diameter Pipes (diameter ≤12”) Large-diameter Pipes (diameter >12”)
Bad Soil Good Soil Bad Soil Good Soil
RCF Depth RCF Depth RCF Depth RCF Depth
1.5 3-6 ft 1 3-6 ft 5.5 3-6 ft 4 3-6 ft
2.5 6-9 ft 2 6-9 ft 9 6-9 ft 7 6-9 ft
3.5 9-12 ft 3 9-12 ft 16 9-12 ft 13 9-12 ft
5 12-15 ft 4 12-15 ft 24 12-15 ft 19 12-15 ft
6.5 15-18 ft 5.5 15-18 ft 31 15-18 ft 26 15-18 ft
8.5 18-21 ft 7 18-21 ft 40 18-21 ft 33 18-21 ft
Acronyms: ft – feet RCF – repair cost factor
Overall, after multiplying the PoF with CoF, a BRE could range from 3 to 75, with 75 representing the highest BRE score. Figure 6-2 shows the BRE matrix. The assets in the upper right quadrant (D) have the highest PoF and CoF scores. These assets need immediate attention, and as such, resources should be prioritized accordingly. Quadrant (A) represents the area where assets have a low PoF and low CoF failure. Resources can be diverted from these assets to because of the low consequence of failure. As assets are managed using this approach, they will ultimately plot along a band that reaches from the upper left quadrant (B) to the lower right quadrant (C). The appendices present the BRE scores for the different assets as they relate to LOS, capacity, or mortality failure modes.
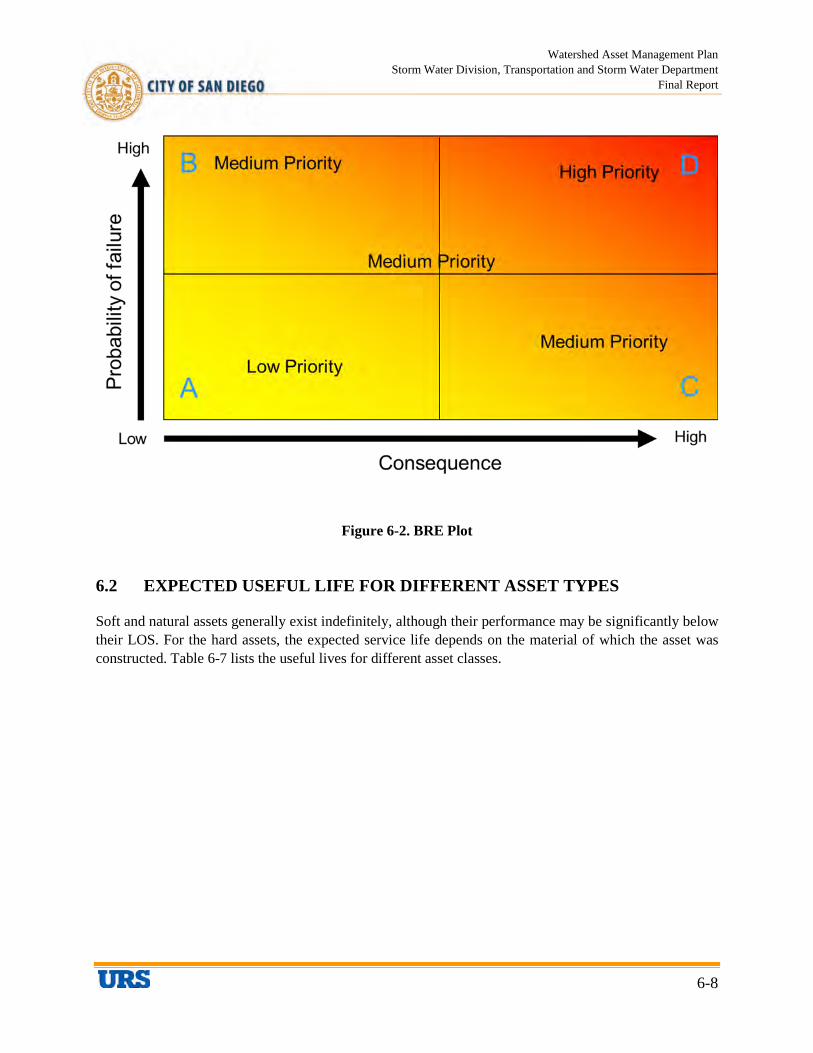
Watershed Asset Management Plan Storm Water Division, Transportation and Storm Water Department
Final Report
6-8
Figure 6-2. BRE Plot
6.2 EXPECTED USEFUL LIFE FOR DIFFERENT ASSET TYPES
Soft and natural assets generally exist indefinitely, although their performance may be significantly below their LOS. For the hard assets, the expected service life depends on the material of which the asset was constructed. Table 6-7 lists the useful lives for different asset classes.
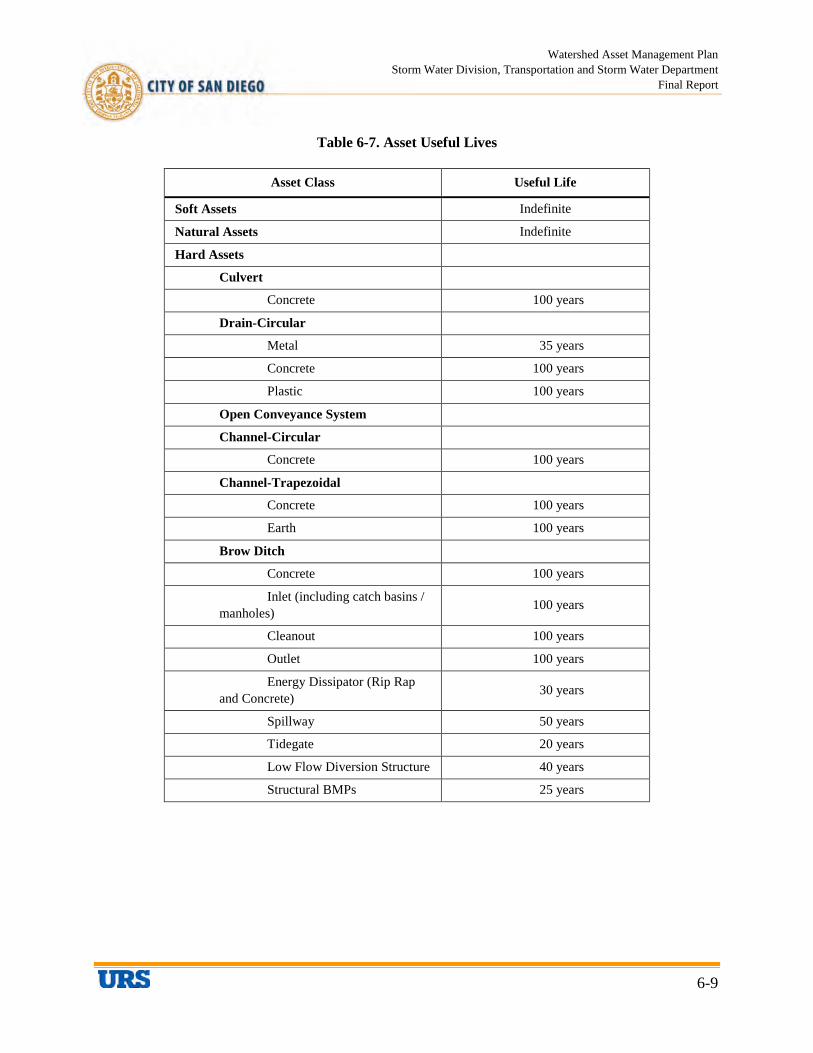
Watershed Asset Management Plan Storm Water Division, Transportation and Storm Water Department
Final Report
6-9
Table 6-7. Asset Useful Lives
Asset Class Useful Life
Soft Assets Indefinite
Natural Assets Indefinite
Hard Assets
Culvert
Concrete 100 years
Drain-Circular
Metal 35 years
Concrete 100 years
Plastic 100 years
Open Conveyance System
Channel-Circular
Concrete 100 years
Channel-Trapezoidal
Concrete 100 years
Earth 100 years
Brow Ditch
Concrete 100 years
Inlet (including catch basins / manholes) 100 years
Cleanout 100 years
Outlet 100 years
Energy Dissipator (Rip Rap and Concrete) 30 years
Spillway 50 years
Tidegate 20 years
Low Flow Diversion Structure 40 years
Structural BMPs 25 years

Watershed Asset Management Plan Storm Water Division, Transportation and Storm Water Department
Final Report
6-10
This page intentionally left blank

Watershed Asset Management Plan Storm Water Division, Transportation and Storm Water Department
Final Report
7-1
SECTION 7 HOW MUCH WILL IT COST?
This section documents the amount of investment required to meet and maintain the LOS for the Division’s storm water infrastructure system. In this section, the long-range investment projection for hard, soft and natural assets is presented.
7.1 PROBABLE COST ESTIMATION METHODOLOGY
Projections have been developed of probable costs for the actions identified to manage assets to achieve specified LOS. In general, two types of costs exist for which projections are provided, as described below.
• Operations and Maintenance: Costs that are incurred each year. This includes O&M of hard assets and operational costs for ongoing actions associated with managing soft and natural assets to achieved LOS.
• Capital: Costs that are incurred one time. This includes the following cost categories:
– costs pertaining to planning, permitting, design, construction, and commissioning of new or replaced hard assets
– costs pertaining to planning, permitting, design, construction, and commissioning of hard asset replenishment/refurbishment projects (e.g., rebuilding a pump),
– costs pertaining to development of program elements for achieving LOS with soft and natural assets, and
– costs pertaining to planning studies (e.g., drainage master planning) and other one-time costs that need to be spent to achieve any LOS, improve capacity, or replace/renew an asset.
Note that planning and some permitting costs may be budgeted as part of an operating budget and not as part of a capital budget within the Division. It is recommended that future WAMPs make that distinction and account for cost in the appropriate category.
The projected opinions of costs were developed using different methods, depending on the type of asset and the types of actions specified. Table 7-1 describes the estimation methods for the different types of assets/actions.
Watershed Asset Management Plan Storm Water Division, Transportation and Storm Water Department
Final Report
7-2
This page intentionally left blank

Watershed Asset Management Plan Storm Water Division, Transportation and Storm Water Department
Final Report
7-3
Table 7-1. Opinion of Probable Cost Projection Methods Employed
Asset/Action Type Opinion of Probable Cost Projection Method
All Assets - Current O&M FY 2014 budgets with staff input regarding division of budgets into asset categories where feasible.
Hard Assets – Future Capital Costs Hard Assets – Future Operations and Maintenance
LOS 01. Public structural BMPs achieve pollutant load reductions that modeling predicts, and, in conjunction with other BMPs in the watershed, will achieve waste load allocations for current and future TMDLs.
Standard construction unit costs for asset classes were provided by the Division staff. These costs were based on the Division’s recent projects and procurement. The estimated costs included, among others, planning, design, and construction. This replacement cost methodology is applied to the following asset classes: • Culvert • Storm Drain • Brow Ditch • Channel • Cleanout • Energy Dissipator • Inlet • Outlet • Spillway • Tidegate • Low Flow Diversions • Pump Stations • Equipment
Future O&M cost estimate for hard assets were estimated based on staff input during workshops. For each type of maintenance activity, labor requirements were identified at FTE level, contract requirements were identified, and equipment requirements were identified. In addition, the list of channel sections to be maintained (hotspots) was identified based on channel’s Master Maintenance Program (MMP), and history of channel maintenance in the past 5 years.
LOS 02. Maintenance activities, in conjunction with other BMPs in the watershed, will achieve pollutant load reductions (or waste load allocations for current and future TMDLs) that modeling predicts.
LOS 03. Private structural BMPs will achieve pollutant load reductions that modeling predicts, and in conjunction with other BMPs in watershed, will achieve waste load allocations for current and future TMDLs.
LOS 05, 06, 48. Sufficient equipment is available 90% of the time to conduct monitoring activities.
LOS 06, 31, 39, 42. Sufficient equipment is available 90% of the time to conduct maintenance activities.
LOS 15. Sufficient equipment is available 90% of the time to conduct monitoring activities
LOS 20. Where costs meet the formula, water is diverted from channels into water storage systems for beneficial use within time frames identified in each WAMP.
LOS 21. Where costs meet the formula, water is diverted from storm drain pipes into water storage systems for beneficial use within time frames identified in WAMP.
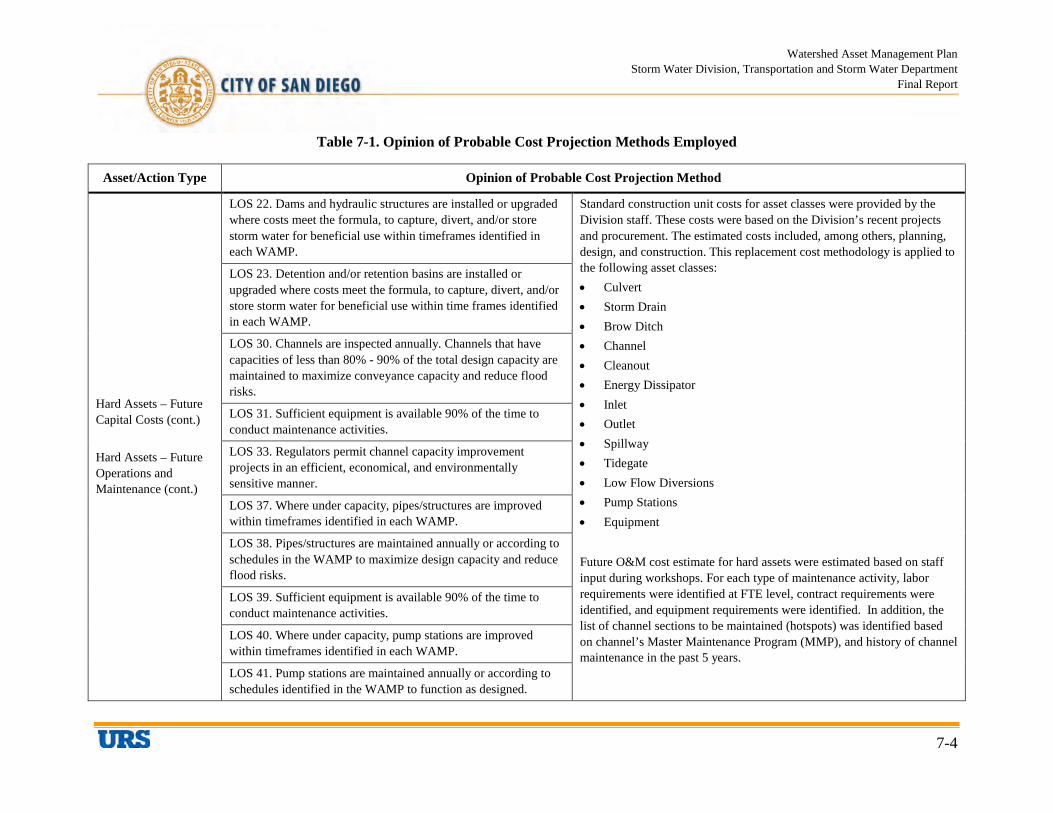
Watershed Asset Management Plan Storm Water Division, Transportation and Storm Water Department
Final Report
7-4
Table 7-1. Opinion of Probable Cost Projection Methods Employed
Asset/Action Type Opinion of Probable Cost Projection Method
Hard Assets – Future Capital Costs (cont.) Hard Assets – Future Operations and Maintenance (cont.)
LOS 22. Dams and hydraulic structures are installed or upgraded where costs meet the formula, to capture, divert, and/or store storm water for beneficial use within timeframes identified in each WAMP.
Standard construction unit costs for asset classes were provided by the Division staff. These costs were based on the Division’s recent projects and procurement. The estimated costs included, among others, planning, design, and construction. This replacement cost methodology is applied to the following asset classes: • Culvert • Storm Drain • Brow Ditch • Channel • Cleanout • Energy Dissipator • Inlet • Outlet • Spillway • Tidegate • Low Flow Diversions • Pump Stations • Equipment
Future O&M cost estimate for hard assets were estimated based on staff input during workshops. For each type of maintenance activity, labor requirements were identified at FTE level, contract requirements were identified, and equipment requirements were identified. In addition, the list of channel sections to be maintained (hotspots) was identified based on channel’s Master Maintenance Program (MMP), and history of channel maintenance in the past 5 years.
LOS 23. Detention and/or retention basins are installed or upgraded where costs meet the formula, to capture, divert, and/or store storm water for beneficial use within time frames identified in each WAMP.
LOS 30. Channels are inspected annually. Channels that have capacities of less than 80% - 90% of the total design capacity are maintained to maximize conveyance capacity and reduce flood risks.
LOS 31. Sufficient equipment is available 90% of the time to conduct maintenance activities.
LOS 33. Regulators permit channel capacity improvement projects in an efficient, economical, and environmentally sensitive manner.
LOS 37. Where under capacity, pipes/structures are improved within timeframes identified in each WAMP.
LOS 38. Pipes/structures are maintained annually or according to schedules in the WAMP to maximize design capacity and reduce flood risks.
LOS 39. Sufficient equipment is available 90% of the time to conduct maintenance activities.
LOS 40. Where under capacity, pump stations are improved within timeframes identified in each WAMP.
LOS 41. Pump stations are maintained annually or according to schedules identified in the WAMP to function as designed.

Watershed Asset Management Plan Storm Water Division, Transportation and Storm Water Department
Final Report
7-5
Table 7-1. Opinion of Probable Cost Projection Methods Employed
Asset/Action Type Opinion of Probable Cost Projection Method
Hard Assets – Future Capital Costs (cont.) Hard Assets – Future Operations and Maintenance (cont.)
LOS 42. Sufficient equipment is available 90% of the time to conduct maintenance activities.
Standard construction unit costs for asset classes were provided by the Division staff. These costs were based on the Division’s recent projects and procurement. The estimated costs included, among others, planning, design, and construction. This replacement cost methodology is applied to the following asset classes: • Culvert • Storm Drain • Brow Ditch • Channel • Cleanout • Energy Dissipator • Inlet • Outlet • Spillway • Tidegate • Low Flow Diversions • Pump Stations • Equipment
Future O&M cost estimate for hard assets were estimated based on staff input during workshops. For each type of maintenance activity, labor requirements were identified at FTE level, contract requirements were identified, and equipment requirements were identified. In addition, the list of channel sections to be maintained (hotspots) was identified based on channel’s Master Maintenance Program (MMP), and history of channel maintenance in the past 5 years.
LOS 43. The storm drain system is mapped and updated per permit requirements.
LOS 44. Pipes/structures are maintained annually to meet flood risk management and water quality requirements.
LOS 45. Public structural and LID BMPs for CIP projects are installed per permit requirements.
LOS 46. Private structural and LID BMPs are installed and maintained per permit requirements.
LOS 48. Sufficient equipment is available 90% of the time to conduct monitoring activities.
LOS 50. Public non-structural BMPs are implemented per permit requirements.
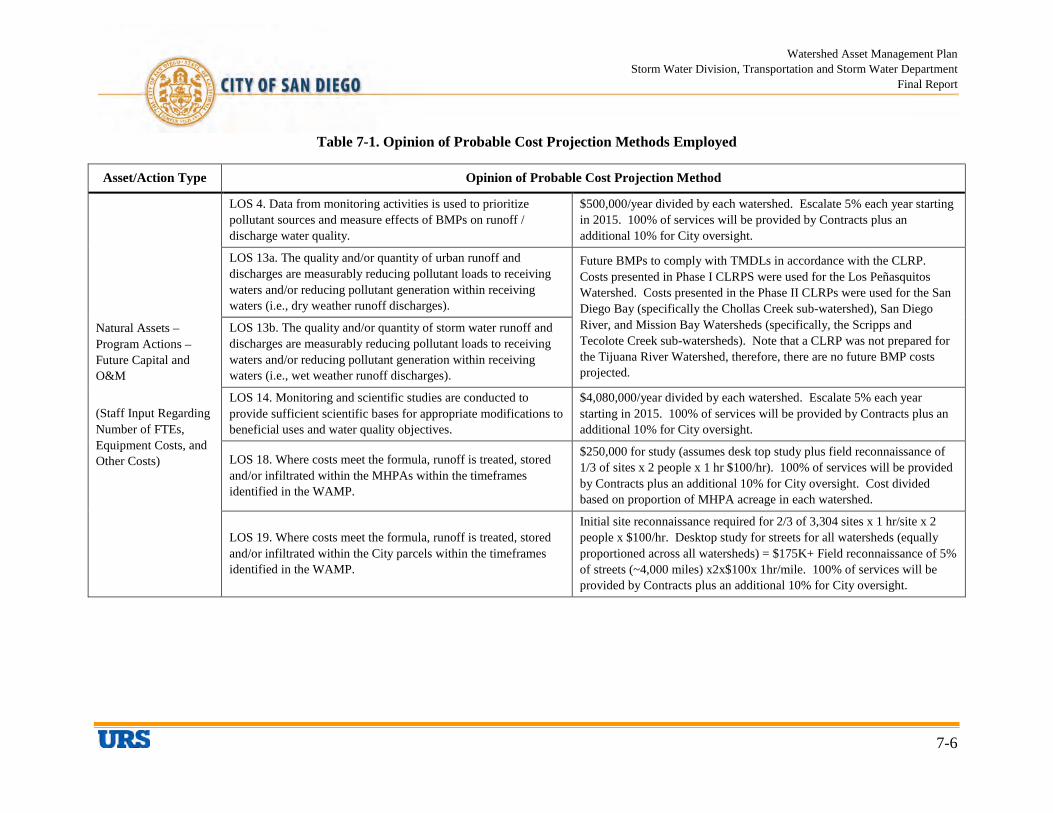
Watershed Asset Management Plan Storm Water Division, Transportation and Storm Water Department
Final Report
7-6
Table 7-1. Opinion of Probable Cost Projection Methods Employed
Asset/Action Type Opinion of Probable Cost Projection Method
Natural Assets – Program Actions – Future Capital and O&M (Staff Input Regarding Number of FTEs, Equipment Costs, and Other Costs)
LOS 4. Data from monitoring activities is used to prioritize pollutant sources and measure effects of BMPs on runoff / discharge water quality.
$500,000/year divided by each watershed. Escalate 5% each year starting in 2015. 100% of services will be provided by Contracts plus an additional 10% for City oversight.
LOS 13a. The quality and/or quantity of urban runoff and discharges are measurably reducing pollutant loads to receiving waters and/or reducing pollutant generation within receiving waters (i.e., dry weather runoff discharges).
Future BMPs to comply with TMDLs in accordance with the CLRP. Costs presented in Phase I CLRPS were used for the Los Peñasquitos Watershed. Costs presented in the Phase II CLRPs were used for the San Diego Bay (specifically the Chollas Creek sub-watershed), San Diego River, and Mission Bay Watersheds (specifically, the Scripps and Tecolote Creek sub-watersheds). Note that a CLRP was not prepared for the Tijuana River Watershed, therefore, there are no future BMP costs projected.
LOS 13b. The quality and/or quantity of storm water runoff and discharges are measurably reducing pollutant loads to receiving waters and/or reducing pollutant generation within receiving waters (i.e., wet weather runoff discharges).
LOS 14. Monitoring and scientific studies are conducted to provide sufficient scientific bases for appropriate modifications to beneficial uses and water quality objectives.
$4,080,000/year divided by each watershed. Escalate 5% each year starting in 2015. 100% of services will be provided by Contracts plus an additional 10% for City oversight.
LOS 18. Where costs meet the formula, runoff is treated, stored and/or infiltrated within the MHPAs within the timeframes identified in the WAMP.
$250,000 for study (assumes desk top study plus field reconnaissance of 1/3 of sites x 2 people x 1 hr $100/hr). 100% of services will be provided by Contracts plus an additional 10% for City oversight. Cost divided based on proportion of MHPA acreage in each watershed.
LOS 19. Where costs meet the formula, runoff is treated, stored and/or infiltrated within the City parcels within the timeframes identified in the WAMP.
Initial site reconnaissance required for 2/3 of 3,304 sites x 1 hr/site x 2 people x $100/hr. Desktop study for streets for all watersheds (equally proportioned across all watersheds) = $175K+ Field reconnaissance of 5% of streets (~4,000 miles) x2x$100x 1hr/mile. 100% of services will be provided by Contracts plus an additional 10% for City oversight.
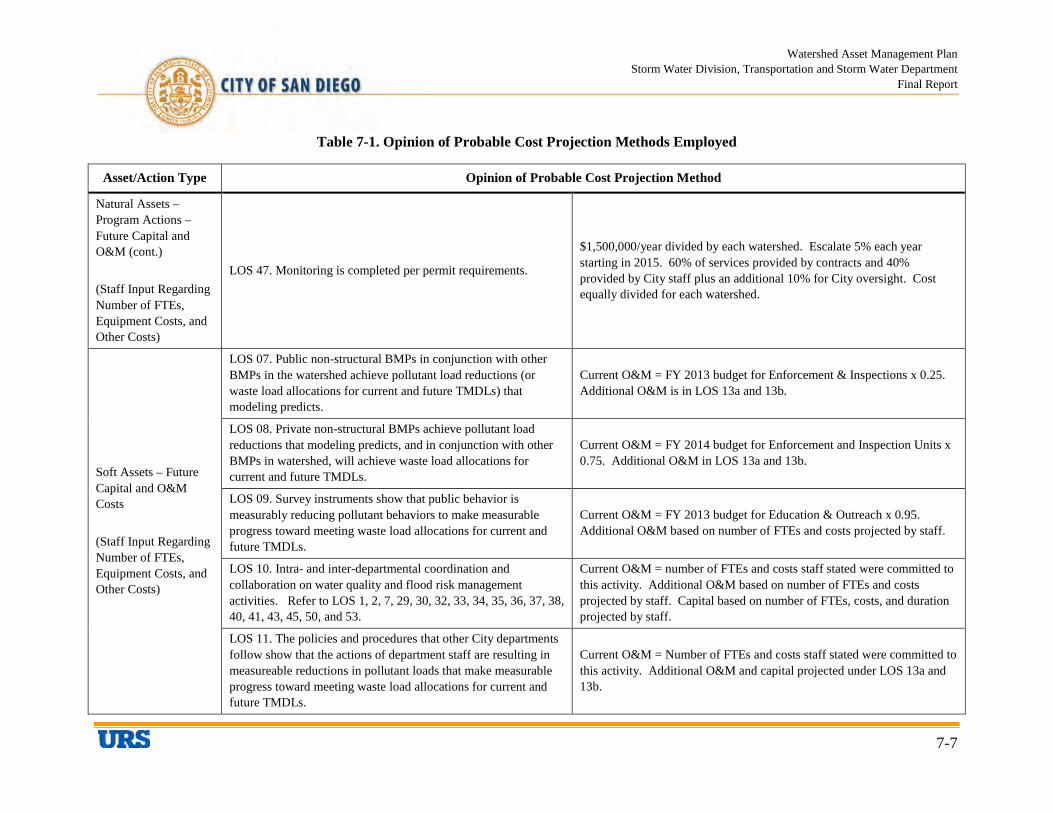
Watershed Asset Management Plan Storm Water Division, Transportation and Storm Water Department
Final Report
7-7
Table 7-1. Opinion of Probable Cost Projection Methods Employed
Asset/Action Type Opinion of Probable Cost Projection Method
Natural Assets – Program Actions – Future Capital and O&M (cont.) (Staff Input Regarding Number of FTEs, Equipment Costs, and Other Costs)
LOS 47. Monitoring is completed per permit requirements.
$1,500,000/year divided by each watershed. Escalate 5% each year starting in 2015. 60% of services provided by contracts and 40% provided by City staff plus an additional 10% for City oversight. Cost equally divided for each watershed.
Soft Assets – Future Capital and O&M Costs (Staff Input Regarding Number of FTEs, Equipment Costs, and Other Costs)
LOS 07. Public non-structural BMPs in conjunction with other BMPs in the watershed achieve pollutant load reductions (or waste load allocations for current and future TMDLs) that modeling predicts.
Current O&M = FY 2013 budget for Enforcement & Inspections x 0.25. Additional O&M is in LOS 13a and 13b.
LOS 08. Private non-structural BMPs achieve pollutant load reductions that modeling predicts, and in conjunction with other BMPs in watershed, will achieve waste load allocations for current and future TMDLs.
Current O&M = FY 2014 budget for Enforcement and Inspection Units x 0.75. Additional O&M in LOS 13a and 13b.
LOS 09. Survey instruments show that public behavior is measurably reducing pollutant behaviors to make measurable progress toward meeting waste load allocations for current and future TMDLs.
Current O&M = FY 2013 budget for Education & Outreach x 0.95. Additional O&M based on number of FTEs and costs projected by staff.
LOS 10. Intra- and inter-departmental coordination and collaboration on water quality and flood risk management activities. Refer to LOS 1, 2, 7, 29, 30, 32, 33, 34, 35, 36, 37, 38, 40, 41, 43, 45, 50, and 53.
Current O&M = number of FTEs and costs staff stated were committed to this activity. Additional O&M based on number of FTEs and costs projected by staff. Capital based on number of FTEs, costs, and duration projected by staff.
LOS 11. The policies and procedures that other City departments follow show that the actions of department staff are resulting in measureable reductions in pollutant loads that make measurable progress toward meeting waste load allocations for current and future TMDLs.
Current O&M = Number of FTEs and costs staff stated were committed to this activity. Additional O&M and capital projected under LOS 13a and 13b.
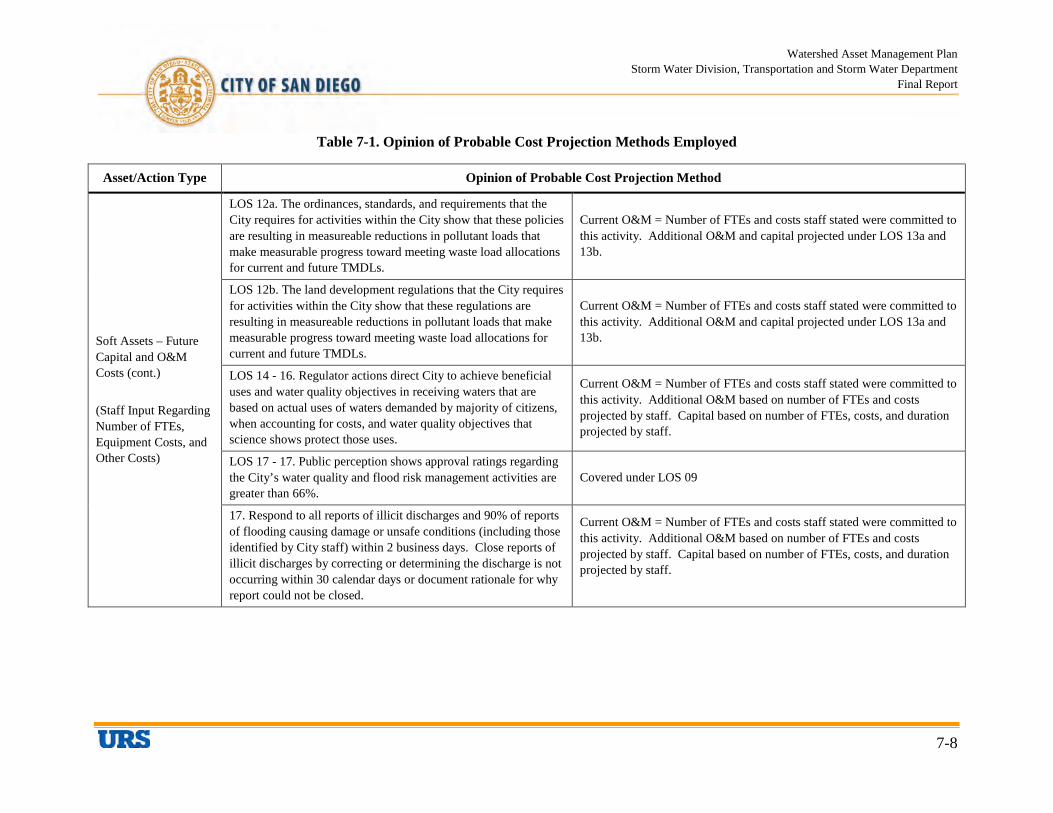
Watershed Asset Management Plan Storm Water Division, Transportation and Storm Water Department
Final Report
7-8
Table 7-1. Opinion of Probable Cost Projection Methods Employed
Asset/Action Type Opinion of Probable Cost Projection Method
Soft Assets – Future Capital and O&M Costs (cont.) (Staff Input Regarding Number of FTEs, Equipment Costs, and Other Costs)
LOS 12a. The ordinances, standards, and requirements that the City requires for activities within the City show that these policies are resulting in measureable reductions in pollutant loads that make measurable progress toward meeting waste load allocations for current and future TMDLs.
Current O&M = Number of FTEs and costs staff stated were committed to this activity. Additional O&M and capital projected under LOS 13a and 13b.
LOS 12b. The land development regulations that the City requires for activities within the City show that these regulations are resulting in measureable reductions in pollutant loads that make measurable progress toward meeting waste load allocations for current and future TMDLs.
Current O&M = Number of FTEs and costs staff stated were committed to this activity. Additional O&M and capital projected under LOS 13a and 13b.
LOS 14 - 16. Regulator actions direct City to achieve beneficial uses and water quality objectives in receiving waters that are based on actual uses of waters demanded by majority of citizens, when accounting for costs, and water quality objectives that science shows protect those uses.
Current O&M = Number of FTEs and costs staff stated were committed to this activity. Additional O&M based on number of FTEs and costs projected by staff. Capital based on number of FTEs, costs, and duration projected by staff.
LOS 17 - 17. Public perception shows approval ratings regarding the City’s water quality and flood risk management activities are greater than 66%.
Covered under LOS 09
17. Respond to all reports of illicit discharges and 90% of reports of flooding causing damage or unsafe conditions (including those identified by City staff) within 2 business days. Close reports of illicit discharges by correcting or determining the discharge is not occurring within 30 calendar days or document rationale for why report could not be closed.
Current O&M = Number of FTEs and costs staff stated were committed to this activity. Additional O&M based on number of FTEs and costs projected by staff. Capital based on number of FTEs, costs, and duration projected by staff.
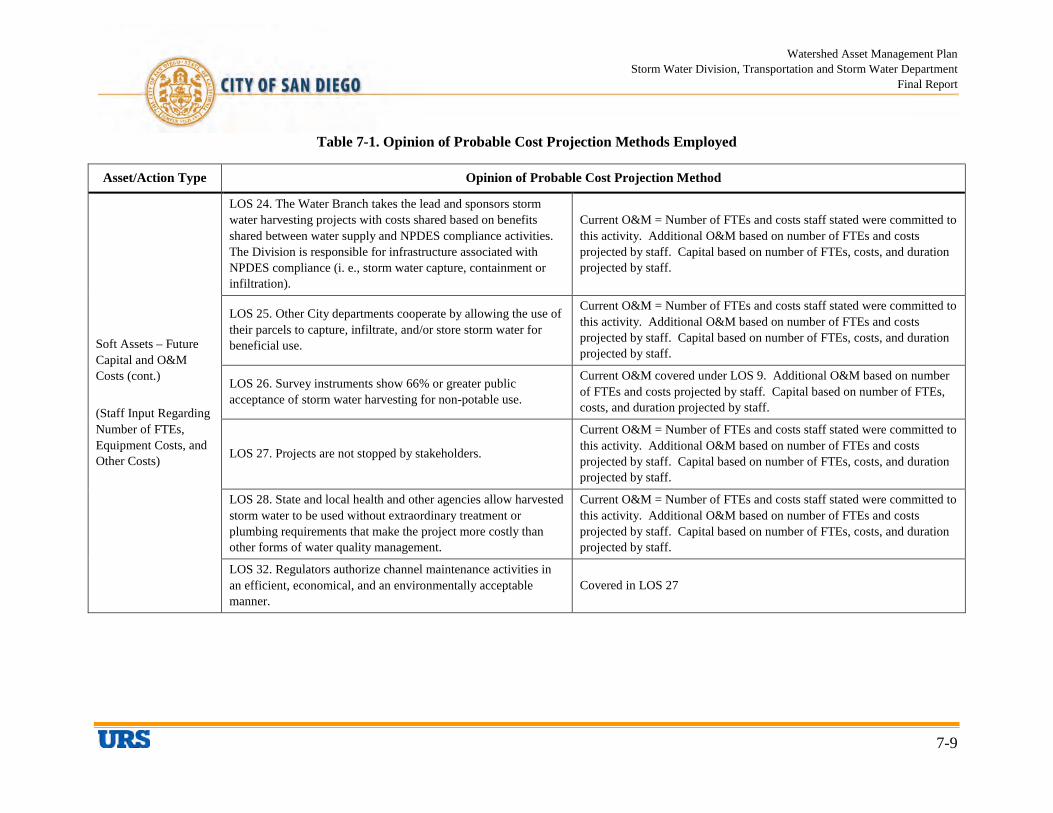
Watershed Asset Management Plan Storm Water Division, Transportation and Storm Water Department
Final Report
7-9
Table 7-1. Opinion of Probable Cost Projection Methods Employed
Asset/Action Type Opinion of Probable Cost Projection Method
Soft Assets – Future Capital and O&M Costs (cont.) (Staff Input Regarding Number of FTEs, Equipment Costs, and Other Costs)
LOS 24. The Water Branch takes the lead and sponsors storm water harvesting projects with costs shared based on benefits shared between water supply and NPDES compliance activities. The Division is responsible for infrastructure associated with NPDES compliance (i. e., storm water capture, containment or infiltration).
Current O&M = Number of FTEs and costs staff stated were committed to this activity. Additional O&M based on number of FTEs and costs projected by staff. Capital based on number of FTEs, costs, and duration projected by staff.
LOS 25. Other City departments cooperate by allowing the use of their parcels to capture, infiltrate, and/or store storm water for beneficial use.
Current O&M = Number of FTEs and costs staff stated were committed to this activity. Additional O&M based on number of FTEs and costs projected by staff. Capital based on number of FTEs, costs, and duration projected by staff.
LOS 26. Survey instruments show 66% or greater public acceptance of storm water harvesting for non-potable use.
Current O&M covered under LOS 9. Additional O&M based on number of FTEs and costs projected by staff. Capital based on number of FTEs, costs, and duration projected by staff.
LOS 27. Projects are not stopped by stakeholders.
Current O&M = Number of FTEs and costs staff stated were committed to this activity. Additional O&M based on number of FTEs and costs projected by staff. Capital based on number of FTEs, costs, and duration projected by staff.
LOS 28. State and local health and other agencies allow harvested storm water to be used without extraordinary treatment or plumbing requirements that make the project more costly than other forms of water quality management.
Current O&M = Number of FTEs and costs staff stated were committed to this activity. Additional O&M based on number of FTEs and costs projected by staff. Capital based on number of FTEs, costs, and duration projected by staff.
LOS 32. Regulators authorize channel maintenance activities in an efficient, economical, and an environmentally acceptable manner.
Covered in LOS 27
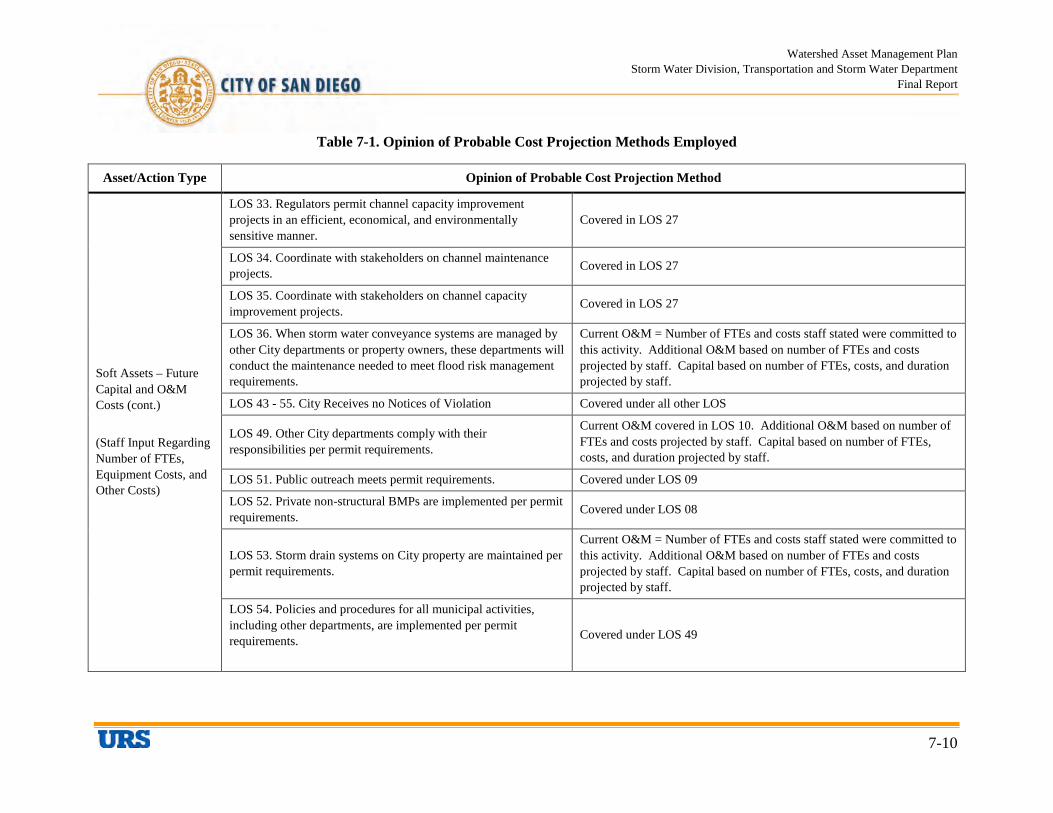
Watershed Asset Management Plan Storm Water Division, Transportation and Storm Water Department
Final Report
7-10
Table 7-1. Opinion of Probable Cost Projection Methods Employed
Asset/Action Type Opinion of Probable Cost Projection Method
Soft Assets – Future Capital and O&M Costs (cont.) (Staff Input Regarding Number of FTEs, Equipment Costs, and Other Costs)
LOS 33. Regulators permit channel capacity improvement projects in an efficient, economical, and environmentally sensitive manner.
Covered in LOS 27
LOS 34. Coordinate with stakeholders on channel maintenance projects. Covered in LOS 27
LOS 35. Coordinate with stakeholders on channel capacity improvement projects. Covered in LOS 27
LOS 36. When storm water conveyance systems are managed by other City departments or property owners, these departments will conduct the maintenance needed to meet flood risk management requirements.
Current O&M = Number of FTEs and costs staff stated were committed to this activity. Additional O&M based on number of FTEs and costs projected by staff. Capital based on number of FTEs, costs, and duration projected by staff.
LOS 43 - 55. City Receives no Notices of Violation Covered under all other LOS
LOS 49. Other City departments comply with their responsibilities per permit requirements.
Current O&M covered in LOS 10. Additional O&M based on number of FTEs and costs projected by staff. Capital based on number of FTEs, costs, and duration projected by staff.
LOS 51. Public outreach meets permit requirements. Covered under LOS 09
LOS 52. Private non-structural BMPs are implemented per permit requirements. Covered under LOS 08
LOS 53. Storm drain systems on City property are maintained per permit requirements.
Current O&M = Number of FTEs and costs staff stated were committed to this activity. Additional O&M based on number of FTEs and costs projected by staff. Capital based on number of FTEs, costs, and duration projected by staff.
LOS 54. Policies and procedures for all municipal activities, including other departments, are implemented per permit requirements.
Covered under LOS 49
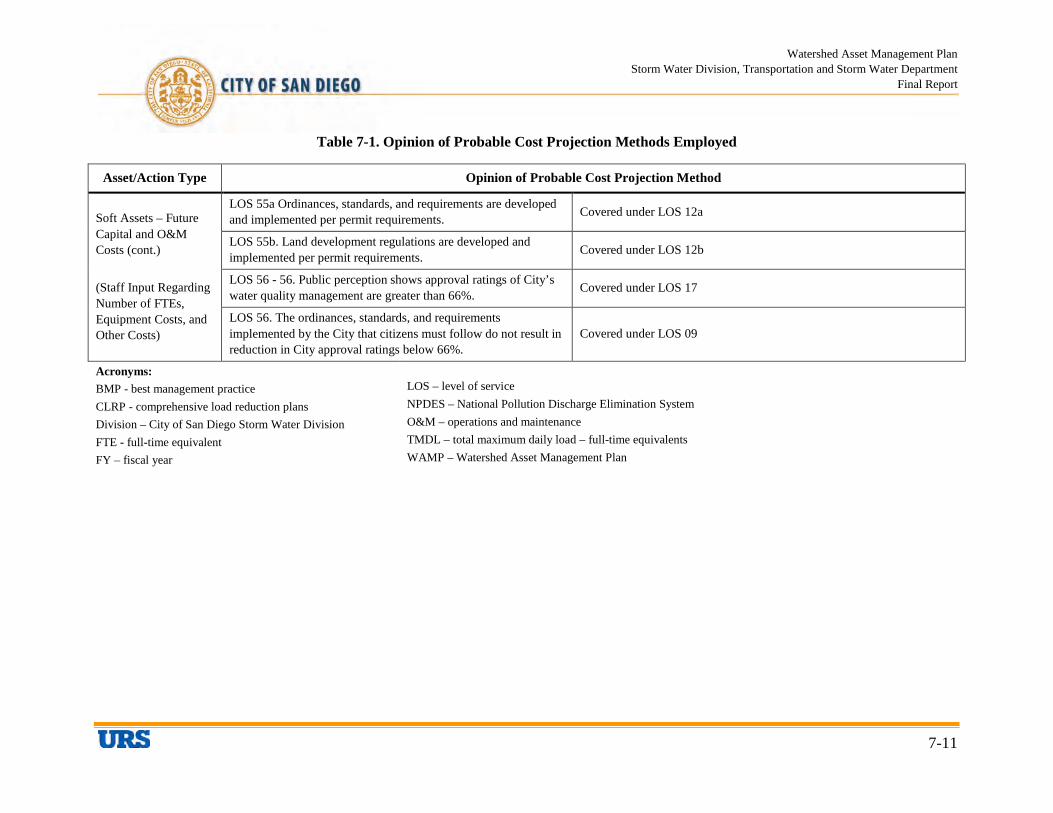
Watershed Asset Management Plan Storm Water Division, Transportation and Storm Water Department
Final Report
7-11
Table 7-1. Opinion of Probable Cost Projection Methods Employed
Asset/Action Type Opinion of Probable Cost Projection Method
Soft Assets – Future Capital and O&M Costs (cont.) (Staff Input Regarding Number of FTEs, Equipment Costs, and Other Costs)
LOS 55a Ordinances, standards, and requirements are developed and implemented per permit requirements. Covered under LOS 12a
LOS 55b. Land development regulations are developed and implemented per permit requirements. Covered under LOS 12b
LOS 56 - 56. Public perception shows approval ratings of City’s water quality management are greater than 66%. Covered under LOS 17
LOS 56. The ordinances, standards, and requirements implemented by the City that citizens must follow do not result in reduction in City approval ratings below 66%.
Covered under LOS 09
Acronyms: BMP - best management practice CLRP - comprehensive load reduction plans Division – City of San Diego Storm Water Division FTE - full-time equivalent FY – fiscal year
LOS – level of service NPDES – National Pollution Discharge Elimination System O&M – operations and maintenance TMDL – total maximum daily load – full-time equivalents WAMP – Watershed Asset Management Plan

Watershed Asset Management Plan Storm Water Division, Transportation and Storm Water Department
Final Report
7-12
This page intentionally left blank
Watershed Asset Management Plan Storm Water Division, Transportation and Storm Water Department
Final Report
7-13
The opinions regarding probable costs for work to be done on assets are provided in the individual appendices of this report.
7.2 NATURAL ASSET BMPS FOR TMDL COMPLIANCE COST MODEL
As noted above, the opinions of probable costs for BMPs that will be necessary to achieve the LOS for certain natural assets, such as runoff and discharges, to achieve TMDL waste load allocations (WLAs) were estimated using the CLRPs. CLRP watersheds are shown in Figure 7-1.
CLRP cost estimates were presented in the CLRPs in cost categories that included staff base salaries, staff fringe benefits, contract costs, information technology costs, capital costs, and various other costs. For the purpose of asset management planning, it is necessary to categorize between capital costs that recur only when an asset reaches the end of its useful life and operations and maintenance costs that occur regularly. For City budgetary planning, it is necessary to categorize between Capital Improvement Plan (CIP) budget requirements and General Fund budget requirements. CIP budgets can be bond-financed and so are approved through a different process than General Fund budgets.
For LOS 13a and 13b, thirty-six activities were identified in the CLRPs that would take place to achieve waste load allocations over time in TMDL watersheds. Of these 36 activities, activities 1 through 31 were generally programmatic in nature and activities 32 through 36 involved the construction of a publicly owned structural treatment control or low impact development best management practice. Programmatic activities (1-31) had some capital costs presented, which were likely purchases of equipment that would be used to implement the activities. Salary costs, fringe benefit costs, supplies and services costs, information technology costs, and energy and utilities costs were generally categorized as General Fund Operations and Maintenance costs. Capital expenditures, debt, and other costs were generally categorized as CIP Capital costs. Contracts were categorized as General Fund Operations and Maintenance costs for those activities largely programmatic in nature (1-31) and CIP Capital costs for those activities where capital infrastructure was constructed (32-36).
Table 7-2 shows the CLRP cost categories and which budget they were categorized in for the different CLRP activities.

Watershed Asset Management Plan Storm Water Division, Transportation and Storm Water Department
Final Report
7-14
Table 7-2. CLRP Cost Categories and WAMP Cost Categories Cross Reference for CLRP Activities
CLRP Cost Category CIP (Capital) General (O&M)
Salary Cost
1-36
Special Wages Cost
1-36
Fringe Benefits Cost
1-36
Supplies & Services
1-36
Contracts 32-36 1-31
Information Technology
1-36
Energy & Utilities
1-36
Capital Expenditures 1-36
Debt 1-36
Other 1-36
Note that there may be some modifications required for how CLRP costs are categorized in the WAMP based on the actual CLRP expenditure envisioned.
Table 7-3 shows the costs that were estimated in the Phase I and Phase II CLRPs.

Watershed Asset Management Plan Storm Water Division, Transportation and Storm Water Department
Final Report
7-15
Figure 7-1. CLRP Watersheds
Note that San Dieguito is no longer considered a CLRP watershed for the City of San Diego.
Watershed Asset Management Plan Storm Water Division, Transportation and Storm Water Department
Final Report
7-16
This page intentionally left blank

Watershed Asset Management Plan Storm Water Division, Transportation and Storm Water Department
Final Report
7-17
Table 7-3. Phase I and Phase II City of San Diego CLRP Opinions of Probable Costs
Activity
San Diego Bay
Los Peñasquitos San Diego River
Mission Bay
Chollas ASBS No 29 Scripps Tecolote
Capital Annual O&M Capital
Annual O&M Capital
Annual O&M Capital
Annual O&M Capital
Annual O&M Capital
Annual O&M
01 Enhance LID implementation for new development and redevelopment through zoning amendments 0 9,136 0 0 0 10,796 0 2,180 0 8,614 0 10,276
02 Train Development Services Department staff on LID regulatory changes and LID Design Manual 0 6,149 0 0 0 7,266 0 1,467 0 5,798 0 6,917
03 Develop regional training for and focus locally on enforcement of water-using mobile businesses 0 6,936 0 0 0 5,408 0 1,004 0 4,498 0 5,887
05 Design and implement property- and PGA-based inspections and accelerated enforcement 0 12,204 0 0 0 14,421 0 2,912 0 11,507 0 13,726
06 Amend SUSMP for Trash areas: require full four-sided enclosure, siting away from storm drains, cover; consider retrofit requirement 0 457 0 0 0 540 0 109 0 431 0 514
07 Amend SUSMP for: Animal-related facilities 0 457 0 0 0 540 0 109 0 431 0 514
08 Amend SUSMP for: Nurseries and garden centers 0 457 0 0 0 540 0 109 0 431 0 514
09 Amend SUSMP for: Auto-related uses 0 457 0 0 0 540 0 109 0 431 0 514
10 Update Minimum BMPs for existing residential, commercial & industrial development & enforce 0 5,228 0 0 0 6,177 0 1,247 0 4,929 0 5,880
11 Support partnership effort by social service providers to provide sanitation and trash management for persons experiencing homelessness 0 2,741 0 0 0 3,239 0 654 0 2,584 0 3,083
12 Develop pilot project to identify and carry out site disconnections in targeted areas 0 13,474 0 0 0 10,506 0 1,764 0 8,738 0 11,435
13 Continue to participate in source reduction initiatives 0 3,857 0 0 0 4,558 0 920 0 3,637 0 4,339
14a Expand residential BMP (irrigation, rainwater harvesting and turf conversion) rebate programs to multi-family housing in target areas 0 4,121 0 0 0 3,523 0 812 0 3,106 0 3,914
14b Residential BMP: Rain Barrel 437 1,076 0 0 20,218 1,384 1,684 117 5,459 374 5,616 384
14c Residential BMP: Irrigation Control (Turf Conversion) 49,136 921 0 0 228,657 2,136 7,642 181 53,453 694 43,789 625
14d Downspout Disconnect 104,770 566 0 0 299,250 1,461 68 0 89,303 436 84,471 414
15 Expand outreach to HOA common lands and HOA rebates 0 5,699 0 0 0 5,412 0 1,093 0 4,318 0 5,151
16 Increase enforcement of over-irrigation 0 0 0 0 0 0 0 0 0 0 0 0
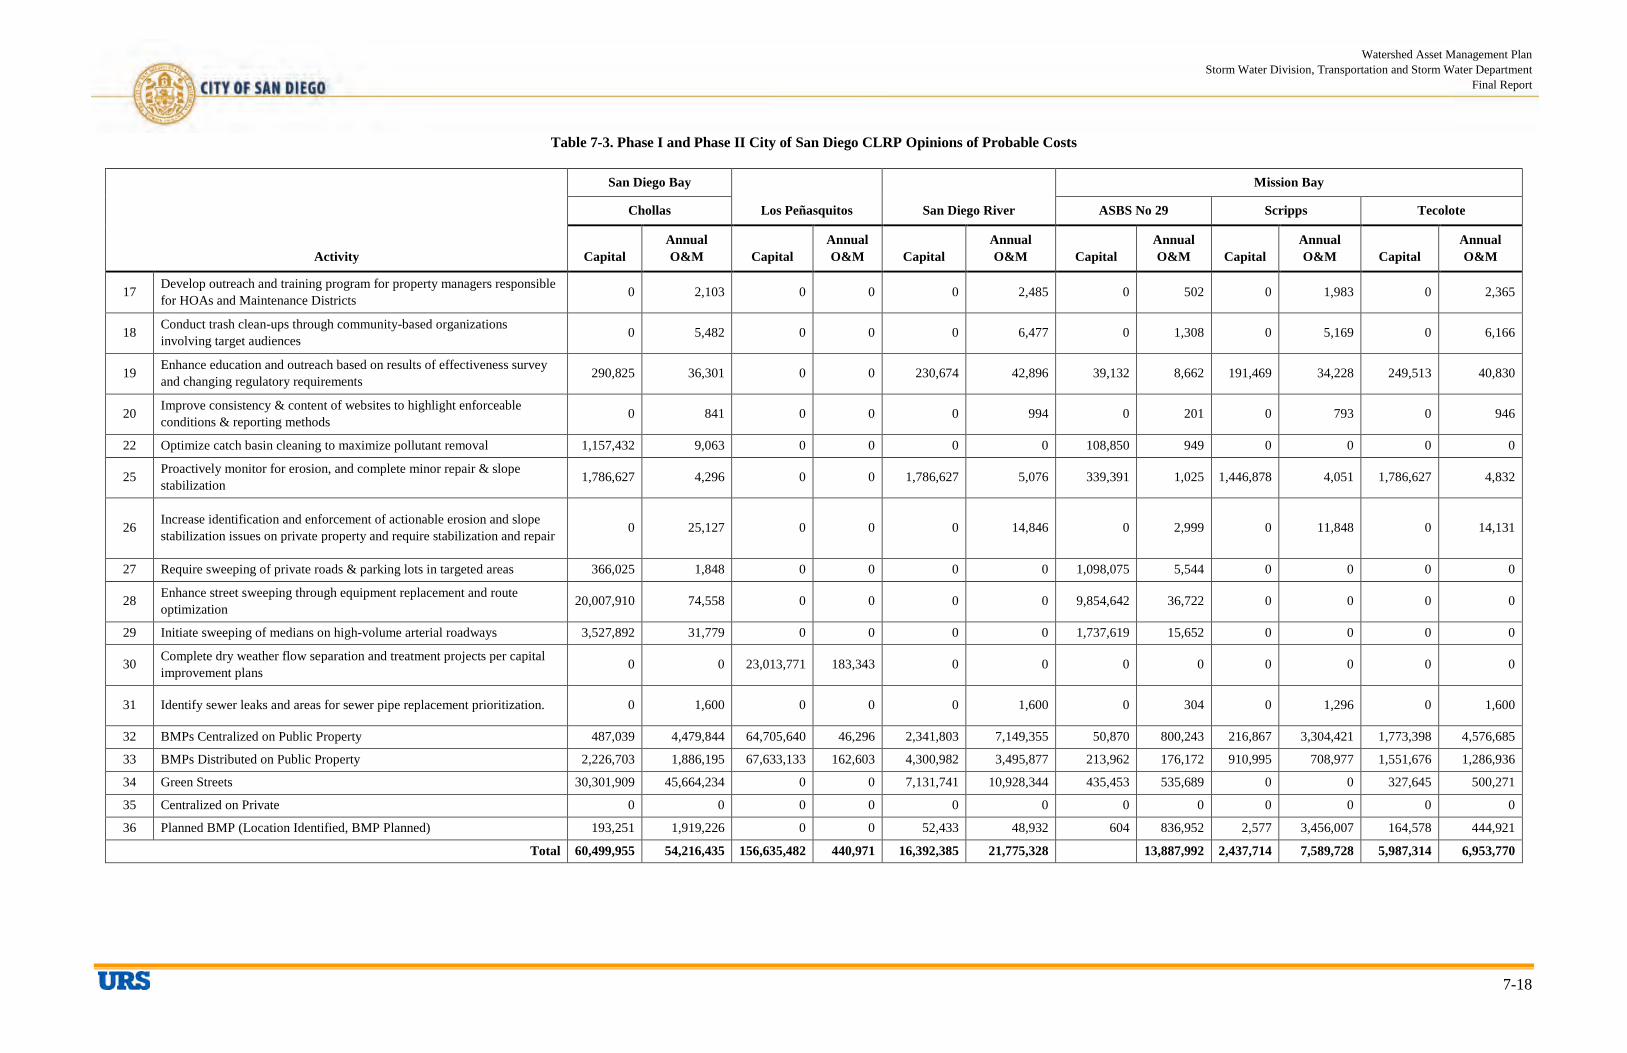
Watershed Asset Management Plan Storm Water Division, Transportation and Storm Water Department
Final Report
7-18
Table 7-3. Phase I and Phase II City of San Diego CLRP Opinions of Probable Costs
Activity
San Diego Bay
Los Peñasquitos San Diego River
Mission Bay
Chollas ASBS No 29 Scripps Tecolote
Capital Annual O&M Capital
Annual O&M Capital
Annual O&M Capital
Annual O&M Capital
Annual O&M Capital
Annual O&M
17 Develop outreach and training program for property managers responsible for HOAs and Maintenance Districts 0 2,103 0 0 0 2,485 0 502 0 1,983 0 2,365
18 Conduct trash clean-ups through community-based organizations involving target audiences 0 5,482 0 0 0 6,477 0 1,308 0 5,169 0 6,166
19 Enhance education and outreach based on results of effectiveness survey and changing regulatory requirements 290,825 36,301 0 0 230,674 42,896 39,132 8,662 191,469 34,228 249,513 40,830
20 Improve consistency & content of websites to highlight enforceable conditions & reporting methods 0 841 0 0 0 994 0 201 0 793 0 946
22 Optimize catch basin cleaning to maximize pollutant removal 1,157,432 9,063 0 0 0 0 108,850 949 0 0 0 0
25 Proactively monitor for erosion, and complete minor repair & slope stabilization 1,786,627 4,296 0 0 1,786,627 5,076 339,391 1,025 1,446,878 4,051 1,786,627 4,832
26 Increase identification and enforcement of actionable erosion and slope stabilization issues on private property and require stabilization and repair 0 25,127 0 0 0 14,846 0 2,999 0 11,848 0 14,131
27 Require sweeping of private roads & parking lots in targeted areas 366,025 1,848 0 0 0 0 1,098,075 5,544 0 0 0 0
28 Enhance street sweeping through equipment replacement and route optimization 20,007,910 74,558 0 0 0 0 9,854,642 36,722 0 0 0 0
29 Initiate sweeping of medians on high-volume arterial roadways 3,527,892 31,779 0 0 0 0 1,737,619 15,652 0 0 0 0
30 Complete dry weather flow separation and treatment projects per capital improvement plans 0 0 23,013,771 183,343 0 0 0 0 0 0 0 0
31 Identify sewer leaks and areas for sewer pipe replacement prioritization. 0 1,600 0 0 0 1,600 0 304 0 1,296 0 1,600
32 BMPs Centralized on Public Property 487,039 4,479,844 64,705,640 46,296 2,341,803 7,149,355 50,870 800,243 216,867 3,304,421 1,773,398 4,576,685
33 BMPs Distributed on Public Property 2,226,703 1,886,195 67,633,133 162,603 4,300,982 3,495,877 213,962 176,172 910,995 708,977 1,551,676 1,286,936
34 Green Streets 30,301,909 45,664,234 0 0 7,131,741 10,928,344 435,453 535,689 0 0 327,645 500,271
35 Centralized on Private 0 0 0 0 0 0 0 0 0 0 0 0
36 Planned BMP (Location Identified, BMP Planned) 193,251 1,919,226 0 0 52,433 48,932 604 836,952 2,577 3,456,007 164,578 444,921
Total 60,499,955 54,216,435 156,635,482 440,971 16,392,385 21,775,328 13,887,992 2,437,714 7,589,728 5,987,314 6,953,770
Watershed Asset Management Plan Storm Water Division, Transportation and Storm Water Department
Final Report
7-19
Note that these costs are for the development and O&M of structural and non-structural BMPs in areas that are subsets of the entire watershed management areas for which BMPs may ultimately be needed due to pending TMDLs provided in the 303(d) list. These costs are for the available BMPs. They include the following in general order of cost effectiveness:
• Maximization of non-structural programs to the extent practicable to optimize waste load reductions achievable with non-structural BMPs,
• Regional structural LID-type BMPs on City-owned parcels, not including streets,
• Distributed structural LID-type BMPs on City-owned parcels, not including streets,
• Green streets, and
• Regional structural LID-type BMPs on private parcels.
7.3 LONG-RANGE FORECAST
This section introduces the long-range renewal projection for the assets used to develop the City’s WAMP. The information in this section is based on the inputs, assumptions, and logic presented in the previous sections. The long-range forecast is a look at the future investment needs for the City. It provides a snapshot of the future based on the current knowledge and historical practices. Understanding the long-range investment needs is a key step in making sustainable and proactive management decisions.
Using the asset data in the asset register, asset replacement cost, and management strategies, a 100-year renewal and O&M projection were generated. A 100-year planning horizon was used to capture the full lifecycle of collection system assets. For proper asset management planning, a long-range planning horizon was required to fully capture the cyclic nature of the installation and replacement trends. A short-range (e.g., 5-year, 10-year) planning horizon often fails to consider the large capital requirement that may lie just beyond the analysis window. Due to the enormous capital investment needs of infrastructure assets, without a long-range consideration, an organization will not be able to financially prepare for renewal requirements.
In this section, the methodology used to generate the long range forecast and the results for soft, natural and hard assets are presented and discussed.
7.3.1 Soft Assets
The methodology used to calculate the long-term forecasts for soft assets is presented in Table 7-1.
7.3.2 Natural Assets
BMP implementation to meet the LOS for TMDL compliance of natural assets requires meeting specific regulatory schedules. Each TMDL has associated implementation schedules. Future TMDLs do not require installation of BMPs or compliance activities until after they are adopted and an implementation schedule is developed. In general, implementation schedules are 7 years long for dry weather BMPs and 20 years long for wet weather BMPs. There may be changes to these schedules, but for the current
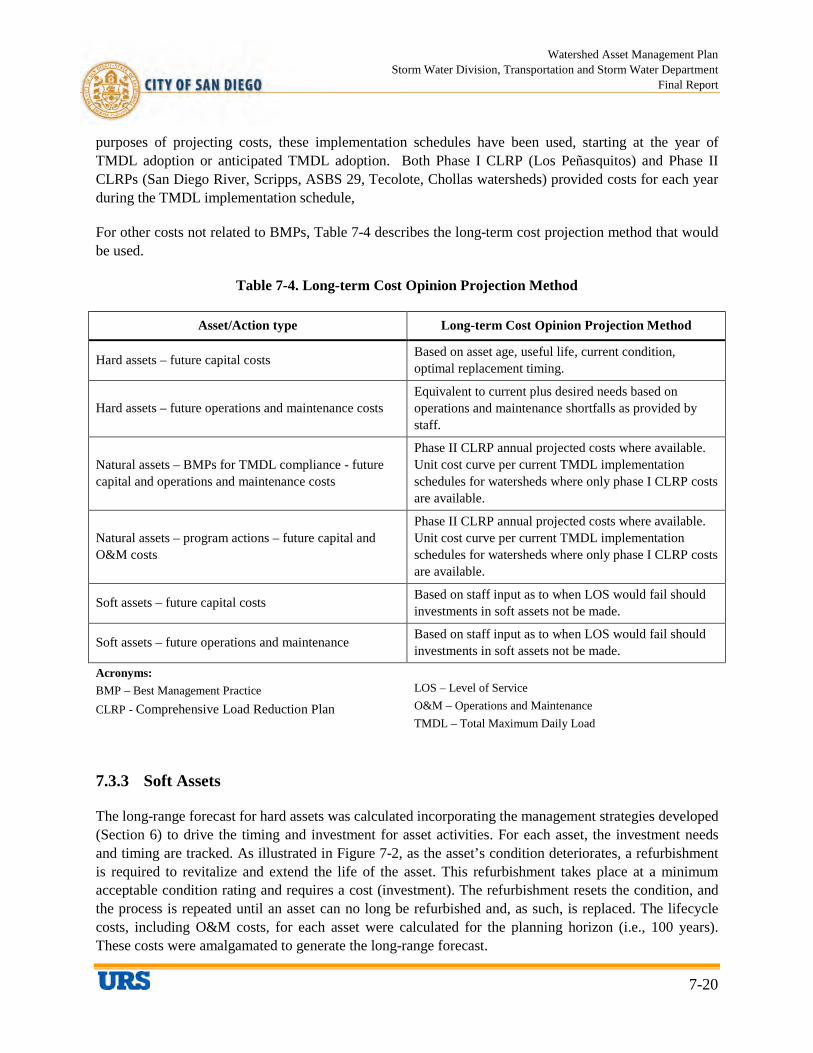
Watershed Asset Management Plan Storm Water Division, Transportation and Storm Water Department
Final Report
7-20
purposes of projecting costs, these implementation schedules have been used, starting at the year of TMDL adoption or anticipated TMDL adoption. Both Phase I CLRP (Los Peñasquitos) and Phase II CLRPs (San Diego River, Scripps, ASBS 29, Tecolote, Chollas watersheds) provided costs for each year during the TMDL implementation schedule,
For other costs not related to BMPs, Table 7-4 describes the long-term cost projection method that would be used.
Table 7-4. Long-term Cost Opinion Projection Method
Asset/Action type Long-term Cost Opinion Projection Method
Hard assets – future capital costs Based on asset age, useful life, current condition, optimal replacement timing.
Hard assets – future operations and maintenance costs Equivalent to current plus desired needs based on operations and maintenance shortfalls as provided by staff.
Natural assets – BMPs for TMDL compliance - future capital and operations and maintenance costs
Phase II CLRP annual projected costs where available. Unit cost curve per current TMDL implementation schedules for watersheds where only phase I CLRP costs are available.
Natural assets – program actions – future capital and O&M costs
Phase II CLRP annual projected costs where available. Unit cost curve per current TMDL implementation schedules for watersheds where only phase I CLRP costs are available.
Soft assets – future capital costs Based on staff input as to when LOS would fail should investments in soft assets not be made.
Soft assets – future operations and maintenance Based on staff input as to when LOS would fail should investments in soft assets not be made.
Acronyms: BMP – Best Management Practice CLRP - Comprehensive Load Reduction Plan
LOS – Level of Service O&M – Operations and Maintenance TMDL – Total Maximum Daily Load
7.3.3 Soft Assets
The long-range forecast for hard assets was calculated incorporating the management strategies developed (Section 6) to drive the timing and investment for asset activities. For each asset, the investment needs and timing are tracked. As illustrated in Figure 7-2, as the asset’s condition deteriorates, a refurbishment is required to revitalize and extend the life of the asset. This refurbishment takes place at a minimum acceptable condition rating and requires a cost (investment). The refurbishment resets the condition, and the process is repeated until an asset can no long be refurbished and, as such, is replaced. The lifecycle costs, including O&M costs, for each asset were calculated for the planning horizon (i.e., 100 years). These costs were amalgamated to generate the long-range forecast.
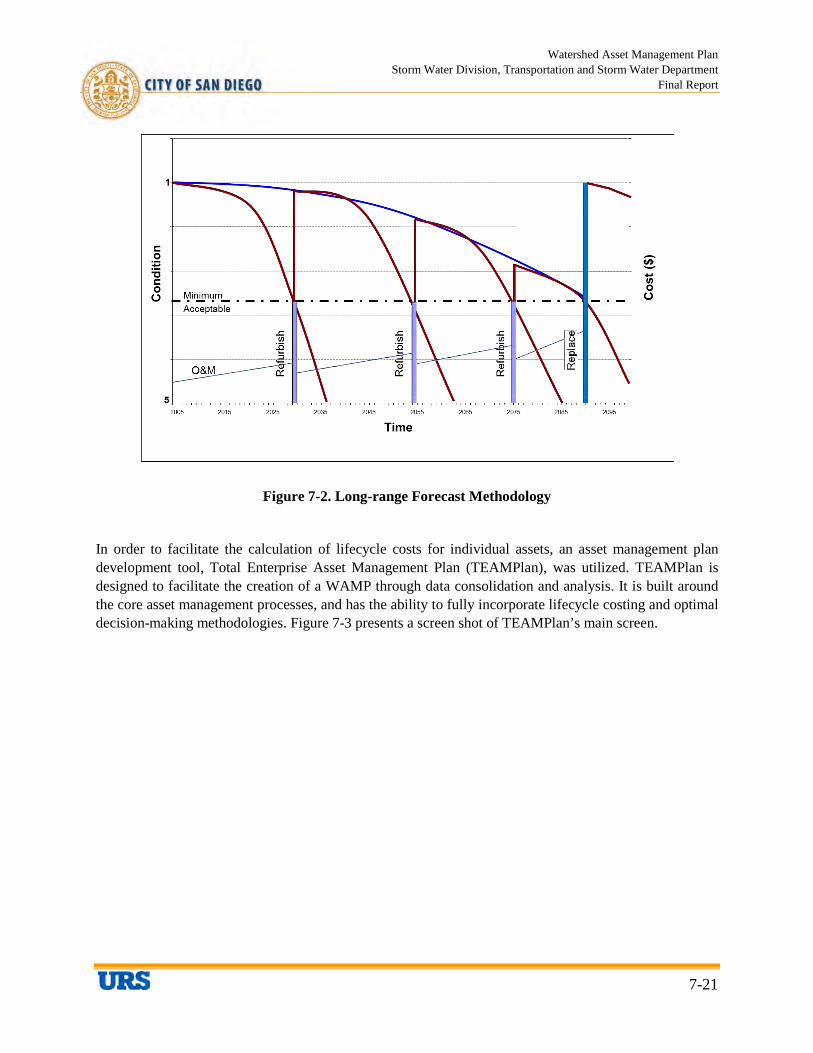
Watershed Asset Management Plan Storm Water Division, Transportation and Storm Water Department
Final Report
7-21
Figure 7-2. Long-range Forecast Methodology
In order to facilitate the calculation of lifecycle costs for individual assets, an asset management plan development tool, Total Enterprise Asset Management Plan (TEAMPlan), was utilized. TEAMPlan is designed to facilitate the creation of a WAMP through data consolidation and analysis. It is built around the core asset management processes, and has the ability to fully incorporate lifecycle costing and optimal decision-making methodologies. Figure 7-3 presents a screen shot of TEAMPlan’s main screen.
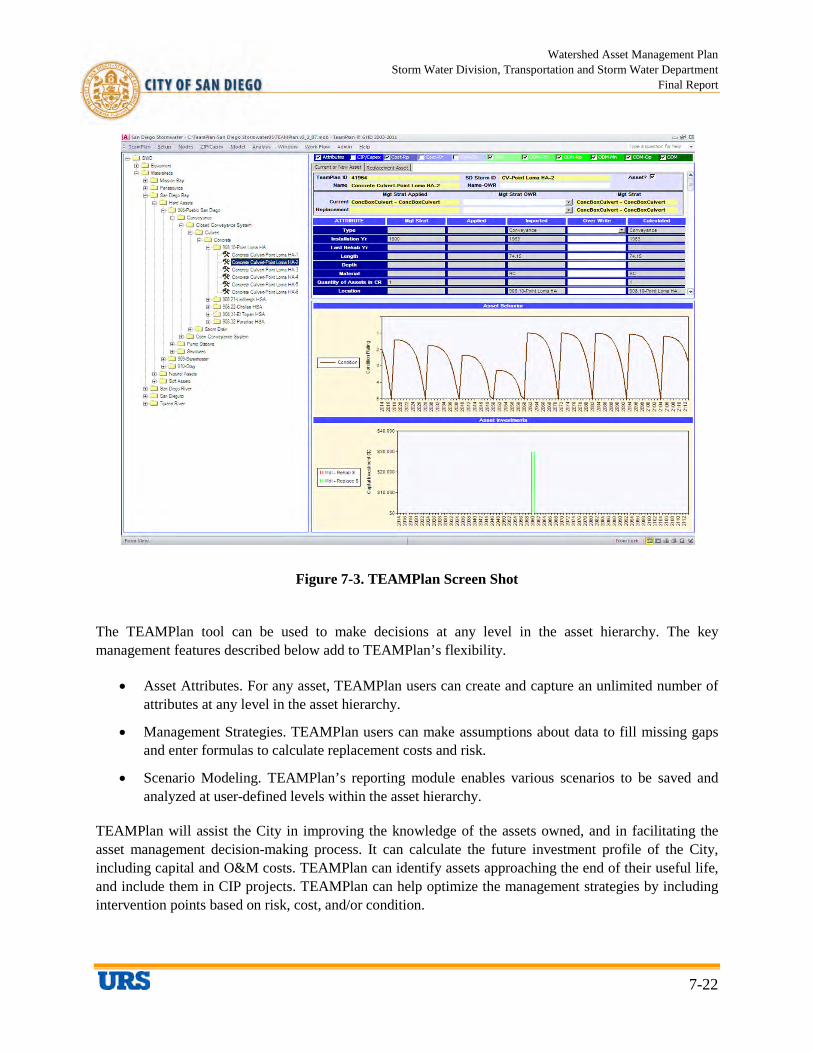
Watershed Asset Management Plan Storm Water Division, Transportation and Storm Water Department
Final Report
7-22
Figure 7-3. TEAMPlan Screen Shot
The TEAMPlan tool can be used to make decisions at any level in the asset hierarchy. The key management features described below add to TEAMPlan’s flexibility.
• Asset Attributes. For any asset, TEAMPlan users can create and capture an unlimited number of attributes at any level in the asset hierarchy.
• Management Strategies. TEAMPlan users can make assumptions about data to fill missing gaps and enter formulas to calculate replacement costs and risk.
• Scenario Modeling. TEAMPlan’s reporting module enables various scenarios to be saved and analyzed at user-defined levels within the asset hierarchy.
TEAMPlan will assist the City in improving the knowledge of the assets owned, and in facilitating the asset management decision-making process. It can calculate the future investment profile of the City, including capital and O&M costs. TEAMPlan can identify assets approaching the end of their useful life, and include them in CIP projects. TEAMPlan can help optimize the management strategies by including intervention points based on risk, cost, and/or condition.
Watershed Asset Management Plan Storm Water Division, Transportation and Storm Water Department
Final Report
7-23
7.3.4 Long-range Forecast
Using the methodology presented above and incorporating the management strategies and the asset valuations, the long-range forecast for the City was projected. A planning horizon of 100 years was used to ensure full capture of lifecycle costs (i.e., installation to disposal) of hard assets. Table 7-5 below summarizes the City’s investment needs for each asset type. The long-range forecast projects that the City will need to invest over $19.98 billion (based on 2013 dollars) to successfully manage and deliver the LOS. Over 100 years, this total amount equates to about $199.8 million per year. This number includes the regulatory compliance, capital, and O&M costs. It is important to note that some years will require greater expenditures and other years will require lower expenditures. The early years, especially, will require greater expenditures because of the current regulatory requirement to implement programs and BMPs to achieve TMDL waste load allocations. These expenditures are largely shown in the Natural Assets costs.
Table 7-5. Long-range Forecast by Asset Type
Asset Types Total 100 Years, All Watersheds
Hard Assets $7.0 Billion
Soft Assets $894 Million
Natural Assets $12.1 Billion
Total $19.98 Billion
Annual Average $199.8 Million
Figure 7-4 represents the projected results based on watershed and asset types. The distribution of total needs, by asset type (i.e., soft, natural, hard), is represented by respective colors.
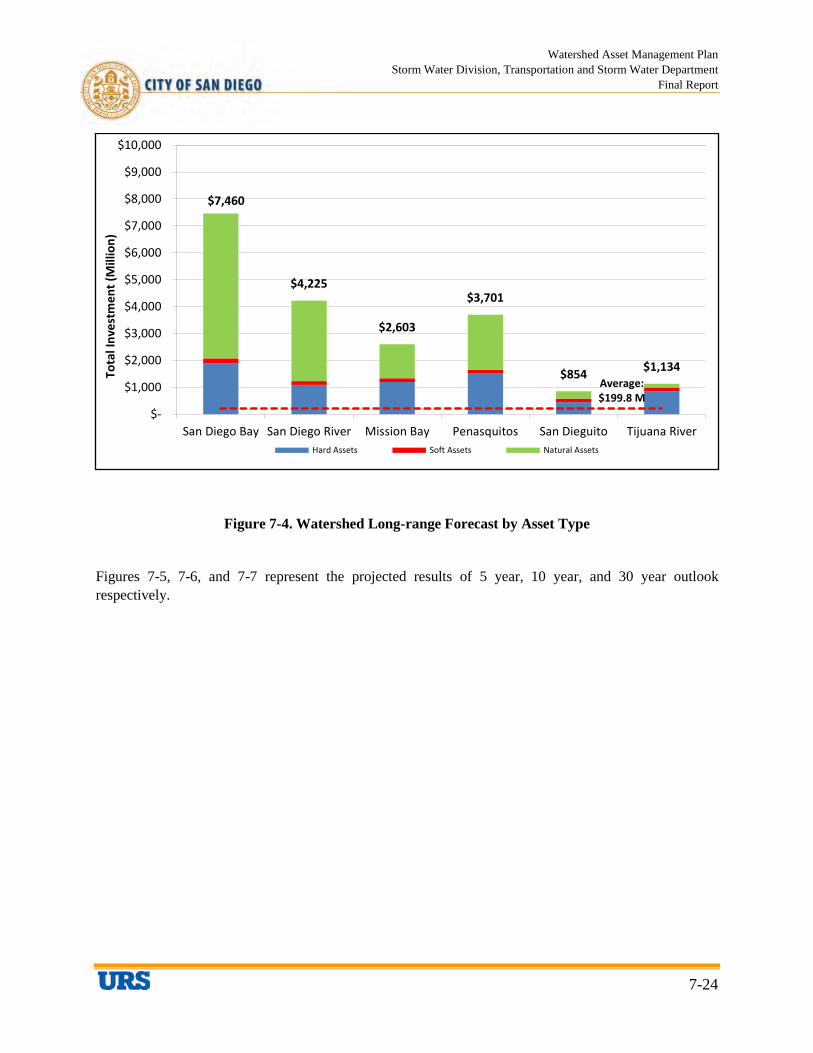
Watershed Asset Management Plan Storm Water Division, Transportation and Storm Water Department
Final Report
7-24
Figure 7-4. Watershed Long-range Forecast by Asset Type
Figures 7-5, 7-6, and 7-7 represent the projected results of 5 year, 10 year, and 30 year outlook respectively.
Average: $199.8 M
$7,460
$4,225
$2,603
$3,701
$854 $1,134
$-
$1,000
$2,000
$3,000
$4,000
$5,000
$6,000
$7,000
$8,000
$9,000
$10,000
San Diego Bay San Diego River Mission Bay Penasquitos San Dieguito Tijuana River
Tota
l Inv
estm
ent (
Mill
ion)
Hard Assets Soft Assets Natural Assets
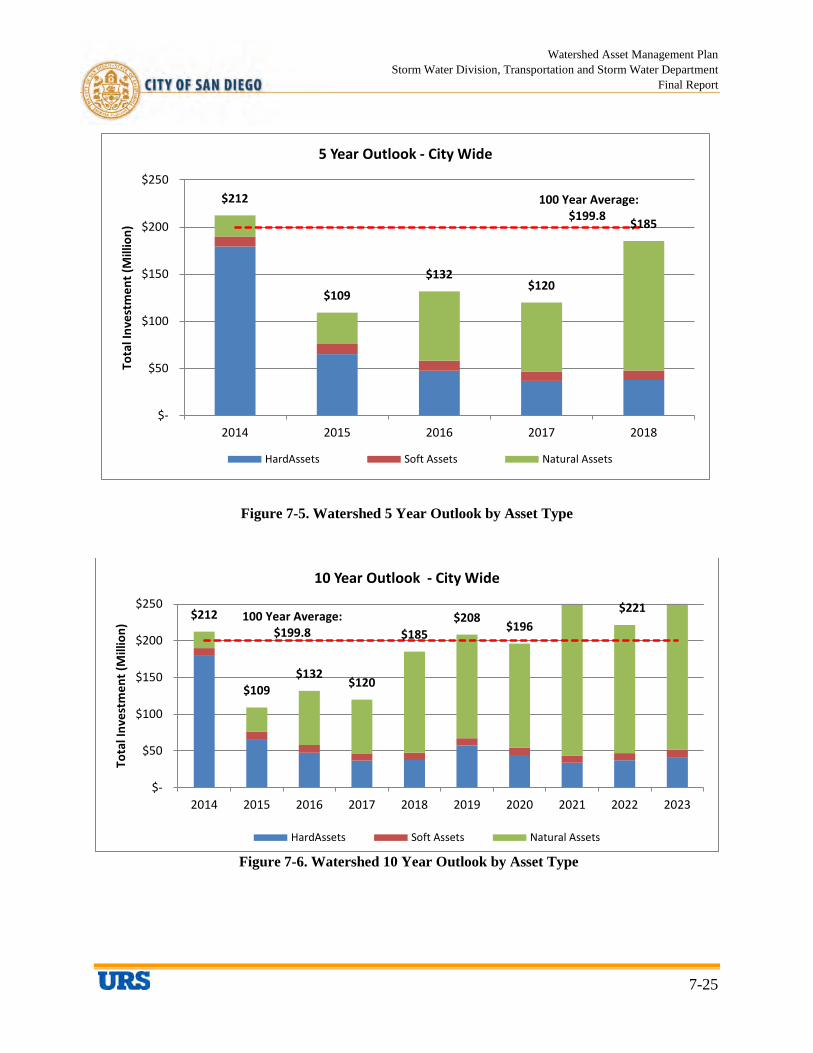
Watershed Asset Management Plan Storm Water Division, Transportation and Storm Water Department
Final Report
7-25
Figure 7-5. Watershed 5 Year Outlook by Asset Type
Figure 7-6. Watershed 10 Year Outlook by Asset Type
100 Year Average: $199.8
$212
$109
$132 $120
$185
$-
$50
$100
$150
$200
$250
2014 2015 2016 2017 2018
Tota
l Inv
estm
ent (
Mill
ion)
5 Year Outlook - City Wide
HardAssets Soft Assets Natural Assets
100 Year Average: $199.8
$212
$109 $132
$120
$185 $208
$196 $221
$-
$50
$100
$150
$200
$250
2014 2015 2016 2017 2018 2019 2020 2021 2022 2023
Tota
l Inv
estm
ent (
Mill
ion)
10 Year Outlook - City Wide
HardAssets Soft Assets Natural Assets
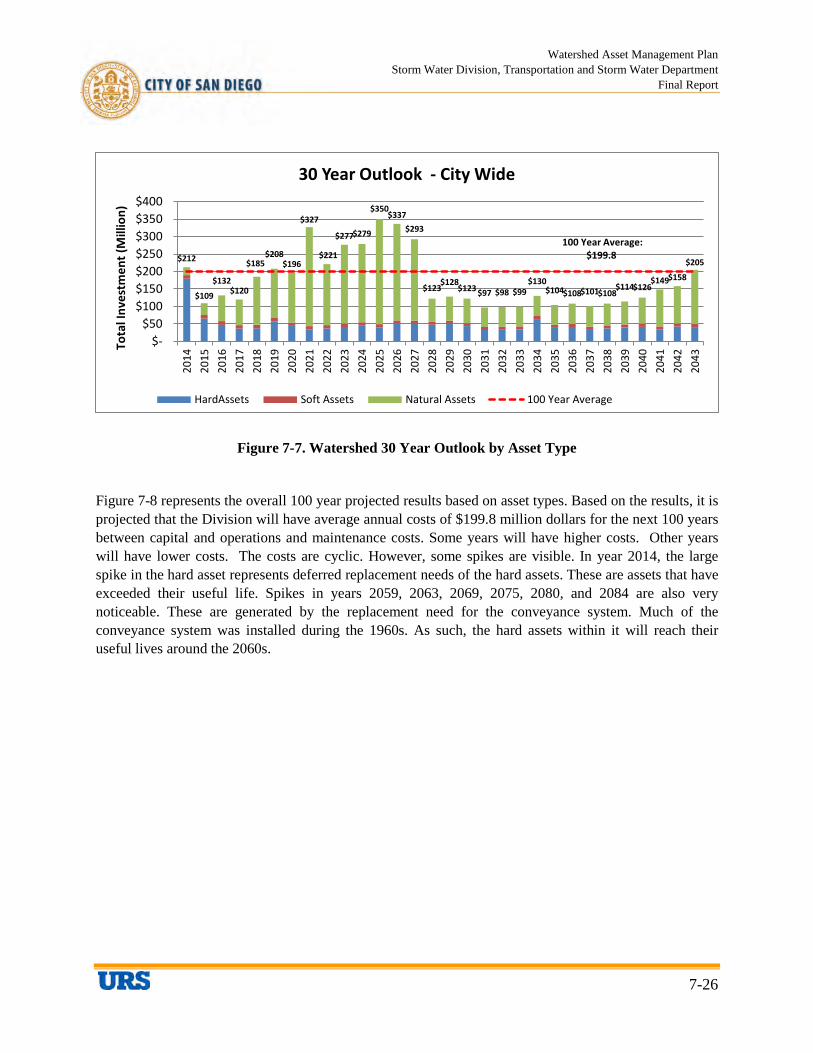
Watershed Asset Management Plan Storm Water Division, Transportation and Storm Water Department
Final Report
7-26
Figure 7-7. Watershed 30 Year Outlook by Asset Type
Figure 7-8 represents the overall 100 year projected results based on asset types. Based on the results, it is projected that the Division will have average annual costs of $199.8 million dollars for the next 100 years between capital and operations and maintenance costs. Some years will have higher costs. Other years will have lower costs. The costs are cyclic. However, some spikes are visible. In year 2014, the large spike in the hard asset represents deferred replacement needs of the hard assets. These are assets that have exceeded their useful life. Spikes in years 2059, 2063, 2069, 2075, 2080, and 2084 are also very noticeable. These are generated by the replacement need for the conveyance system. Much of the conveyance system was installed during the 1960s. As such, the hard assets within it will reach their useful lives around the 2060s.
100 Year Average: $199.8 $212
$109
$132 $120
$185 $208
$196
$327
$221
$277 $279
$350 $337
$293
$123 $128
$123 $97 $98 $99 $130
$104 $108 $101 $108 $114 $126
$149 $158
$205
$- $50
$100 $150 $200 $250 $300 $350 $400
2014
2015
2016
2017
2018
2019
2020
2021
2022
2023
2024
2025
2026
2027
2028
2029
2030
2031
2032
2033
2034
2035
2036
2037
2038
2039
2040
2041
2042
2043
Tota
l Inv
estm
ent (
Mill
ion)
30 Year Outlook - City Wide
HardAssets Soft Assets Natural Assets 100 Year Average Total
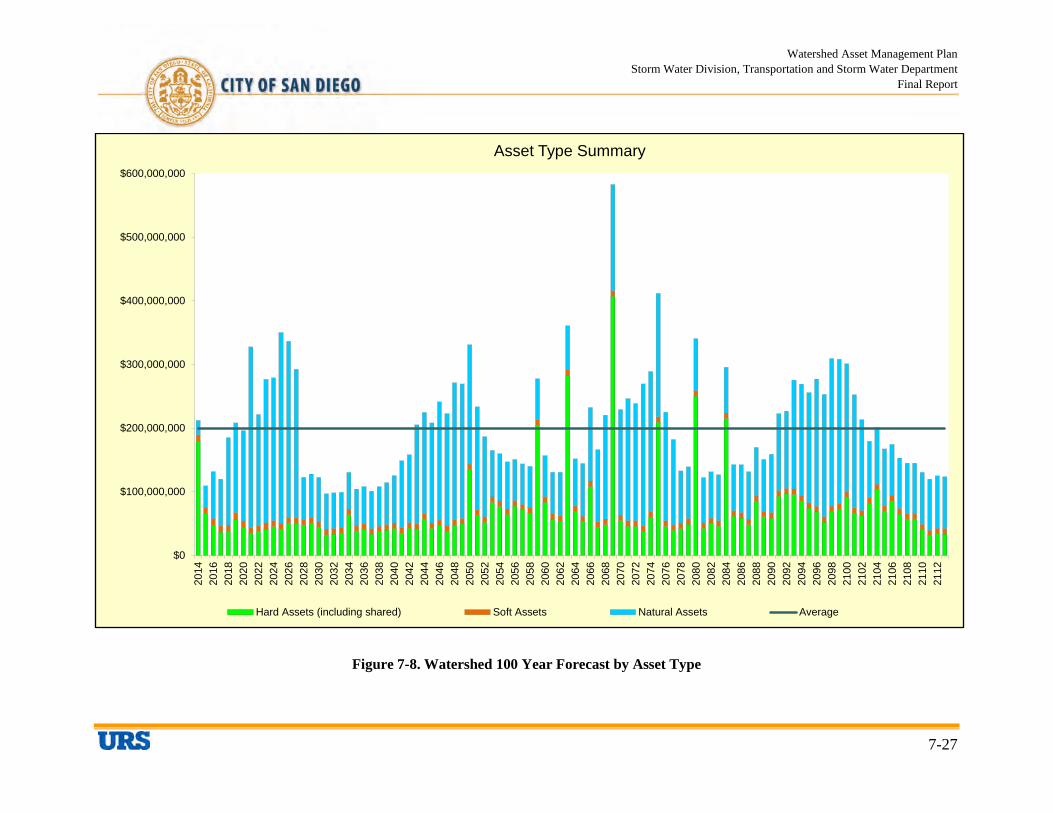
Watershed Asset Management Plan Storm Water Division, Transportation and Storm Water Department
Final Report
7-27
Figure 7-8. Watershed 100 Year Forecast by Asset Type
$0
$100,000,000
$200,000,000
$300,000,000
$400,000,000
$500,000,000
$600,000,000
2014
2016
2018
2020
2022
2024
2026
2028
2030
2032
2034
2036
2038
2040
2042
2044
2046
2048
2050
2052
2054
2056
2058
2060
2062
2064
2066
2068
2070
2072
2074
2076
2078
2080
2082
2084
2086
2088
2090
2092
2094
2096
2098
2100
2102
2104
2106
2108
2110
2112
Asset Type Summary
Hard Assets (including shared) Soft Assets Natural Assets Average

Watershed Asset Management Plan Storm Water Division, Transportation and Storm Water Department
Final Report
7-28
This page intentionally left blank
Watershed Asset Management Plan Storm Water Division, Transportation and Storm Water Department
Final Report
7-29
The peaks in the 100 year forecast graph caused by hard asset replacement were normalized to develop a more realistic forecast (Figure 7-9). Normalization of future hard asset replacement costs, which was driven by the uncertainty in the data, accounts for the uncertainties associated with the age of the assets that might deviate from the expected values. Therefore costs of hard asset replacements were distributed utilizing standard normal distribution to prior and after the expected year. For instance, for a hard asset replacement of $370 M in 2069, the costs are normally distributed with standard deviation of 10 years. This would result in $14.78 M expenditure in 2069, the expected year of hard asset replacement, and $4.96 M in year 2029, 40 years prior to the expected replacement year.

Watershed Asset Management Plan Storm Water Division, Transportation and Storm Water Department
Final Report
7-30
This page intentionally left blank

Watershed Asset Management Plan Storm Water Division, Transportation and Storm Water Department
Final Report
7-31
Figure 7-9. Watershed 100 Year Forecast by Activity Type - Normalized
$0
$50,000,000
$100,000,000
$150,000,000
$200,000,000
$250,000,000
$300,000,000
$350,000,000
$400,000,000
2014
2016
2018
2020
2022
2024
2026
2028
2030
2032
2034
2036
2038
2040
2042
2044
2046
2048
2050
2052
2054
2056
2058
2060
2062
2064
2066
2068
2070
2072
2074
2076
2078
2080
2082
2084
2086
2088
2090
2092
2094
2096
2098
2100
2102
2104
2106
2108
2110
2112
Activity Type Summary
New Capital Replacement Program Management Permit Maintenance Average
Watershed Asset Management Plan Storm Water Division, Transportation and Storm Water Department
Final Report
7-32
This page intentionally left blank
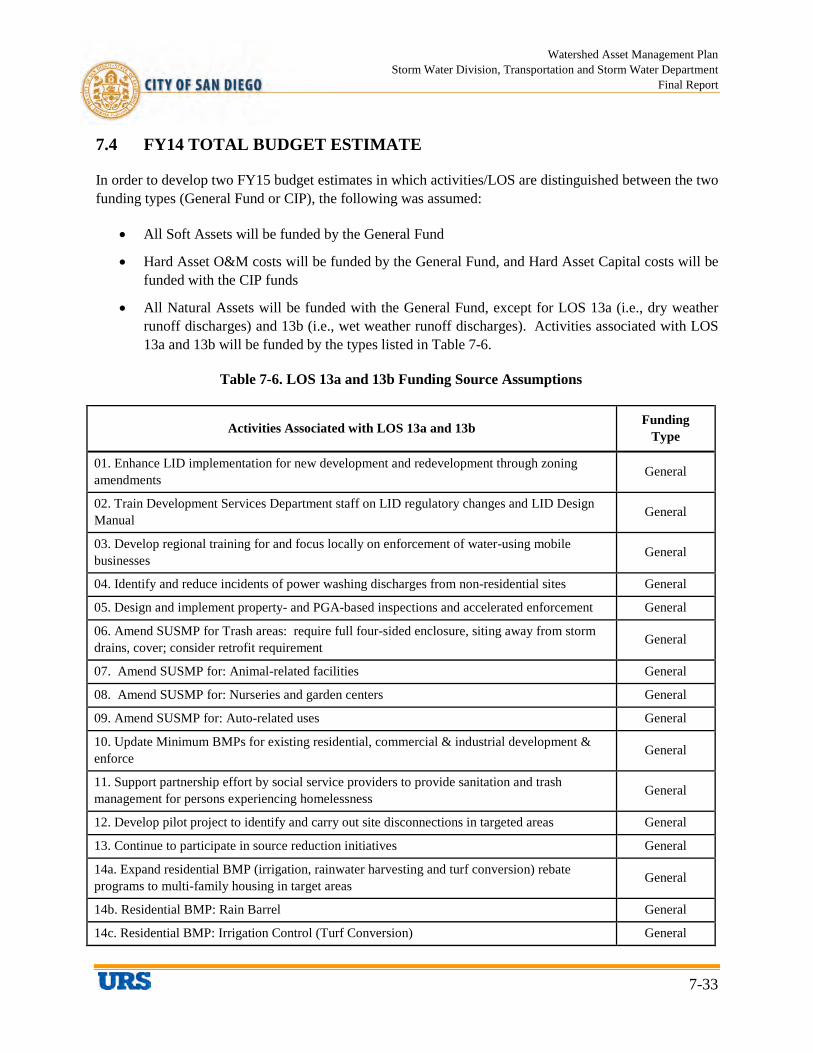
Watershed Asset Management Plan Storm Water Division, Transportation and Storm Water Department
Final Report
7-33
7.4 FY14 TOTAL BUDGET ESTIMATE
In order to develop two FY15 budget estimates in which activities/LOS are distinguished between the two funding types (General Fund or CIP), the following was assumed:
• All Soft Assets will be funded by the General Fund
• Hard Asset O&M costs will be funded by the General Fund, and Hard Asset Capital costs will be funded with the CIP funds
• All Natural Assets will be funded with the General Fund, except for LOS 13a (i.e., dry weather runoff discharges) and 13b (i.e., wet weather runoff discharges). Activities associated with LOS 13a and 13b will be funded by the types listed in Table 7-6.
Table 7-6. LOS 13a and 13b Funding Source Assumptions
Activities Associated with LOS 13a and 13b Funding
Type
01. Enhance LID implementation for new development and redevelopment through zoning amendments
General
02. Train Development Services Department staff on LID regulatory changes and LID Design Manual General
03. Develop regional training for and focus locally on enforcement of water-using mobile businesses
General
04. Identify and reduce incidents of power washing discharges from non-residential sites General
05. Design and implement property- and PGA-based inspections and accelerated enforcement General
06. Amend SUSMP for Trash areas: require full four-sided enclosure, siting away from storm drains, cover; consider retrofit requirement General
07. Amend SUSMP for: Animal-related facilities General
08. Amend SUSMP for: Nurseries and garden centers General
09. Amend SUSMP for: Auto-related uses General
10. Update Minimum BMPs for existing residential, commercial & industrial development & enforce
General
11. Support partnership effort by social service providers to provide sanitation and trash management for persons experiencing homelessness
General
12. Develop pilot project to identify and carry out site disconnections in targeted areas General
13. Continue to participate in source reduction initiatives General
14a. Expand residential BMP (irrigation, rainwater harvesting and turf conversion) rebate programs to multi-family housing in target areas
General
14b. Residential BMP: Rain Barrel General
14c. Residential BMP: Irrigation Control (Turf Conversion) General

Watershed Asset Management Plan Storm Water Division, Transportation and Storm Water Department
Final Report
7-34
Table 7-6. LOS 13a and 13b Funding Source Assumptions
Activities Associated with LOS 13a and 13b Funding
Type
14d. Downspout Disconnect General
15. Expand outreach to HOA common lands and HOA rebates General
16. Increase enforcement of over-irrigation General
17. Develop outreach and training program for property managers responsible for HOAs and Maintenance Districts
General
18. Conduct trash clean-ups through community-based organizations involving target audiences General
19. Enhance education and outreach based on results of effectiveness survey and changing regulatory requirements
General
20. Improve consistency & content of websites to highlight enforceable conditions & reporting methods
General
21. Contribute to County-led effort through regional education group for outreach, education, and policy measures for the equestrian community and property owners General
22. Optimize catch basin cleaning to maximize pollutant removal General
23. Proactively repair and replace MS4 components per capital improvement and asset management plans
CIP
24. Increase frequency of open channel cleaning & scour pond repair to reduce pollutant loads CIP
25. Proactively monitor for erosion, and complete minor repair & slope stabilization CIP
26. Increase identification and enforcement of actionable erosion and slope stabilization issues on private property and require stabilization and repair General
27. Require sweeping of private roads & parking lots in targeted areas General
28. Enhance street sweeping through equipment replacement and route optimization General
29. Initiate sweeping of medians on high-volume arterial roadways General
30. Complete dry weather flow separation and treatment projects per capital improvement plans CIP
31. Identify sewer leaks and areas for sewer pipe replacement prioritization. General
32. Centralized on Public CIP
33. Distributed on Public CIP
34. Green Streets CIP
35. Centralized on Private CIP
36. Planned BMP CIP

Watershed Asset Management Plan Storm Water Division, Transportation and Storm Water Department
Final Report
7-35
7.4.1 FY14 5 Year CIP and General Fund Budgetary Estimate
Table 7-7 shows the budget estimate from the two funding sources. The total budgetary estimate for 2014 is $212 million. Of the total, the budget from CIP is $150 million and the budget from general fund is $62 million. As a result of deferred replacement, first year costs are higher than subsequent year costs. As the backlog of replacement is worked through, the costs continue to reduce over time.
Watershed Asset Management Plan Storm Water Division, Transportation and Storm Water Department
Final Report
7-36
This page intentionally left blank
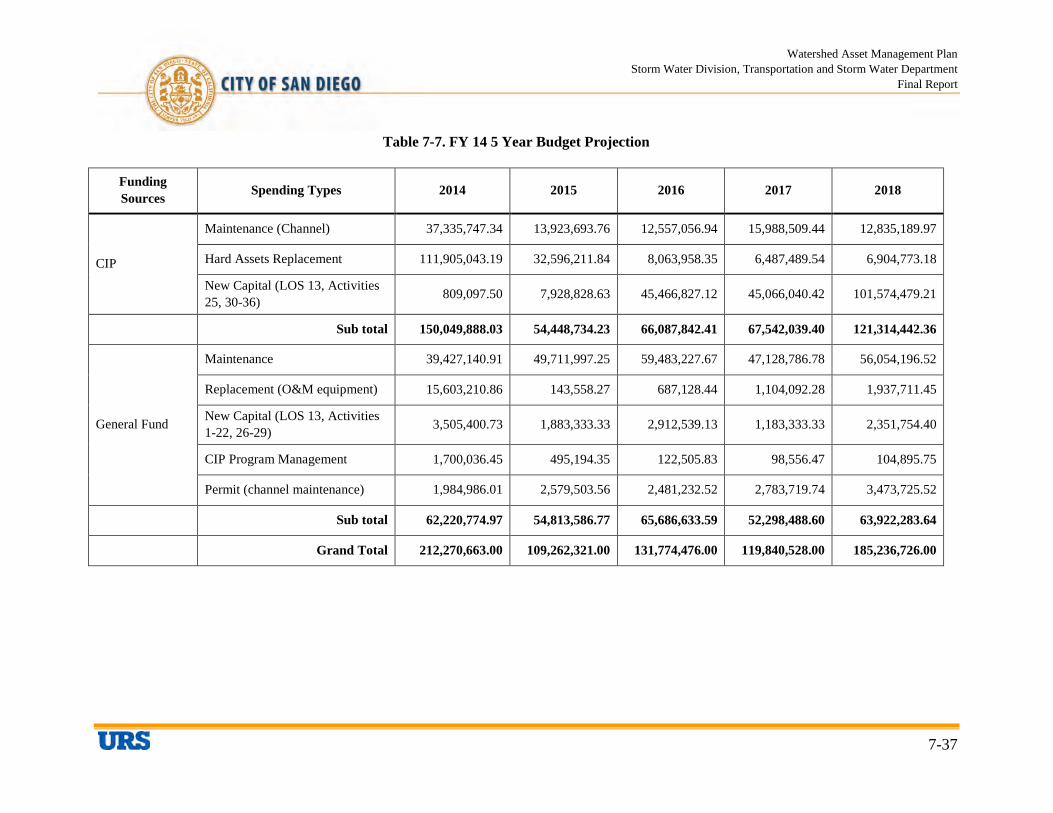
Watershed Asset Management Plan Storm Water Division, Transportation and Storm Water Department
Final Report
7-37
Table 7-7. FY 14 5 Year Budget Projection
Funding Sources Spending Types 2014 2015 2016 2017 2018
CIP
Maintenance (Channel) 37,335,747.34 13,923,693.76 12,557,056.94 15,988,509.44 12,835,189.97
Hard Assets Replacement 111,905,043.19 32,596,211.84 8,063,958.35 6,487,489.54 6,904,773.18
New Capital (LOS 13, Activities 25, 30-36) 809,097.50 7,928,828.63 45,466,827.12 45,066,040.42 101,574,479.21
Sub total 150,049,888.03 54,448,734.23 66,087,842.41 67,542,039.40 121,314,442.36
General Fund
Maintenance 39,427,140.91 49,711,997.25 59,483,227.67 47,128,786.78 56,054,196.52
Replacement (O&M equipment) 15,603,210.86 143,558.27 687,128.44 1,104,092.28 1,937,711.45
New Capital (LOS 13, Activities 1-22, 26-29) 3,505,400.73 1,883,333.33 2,912,539.13 1,183,333.33 2,351,754.40
CIP Program Management 1,700,036.45 495,194.35 122,505.83 98,556.47 104,895.75
Permit (channel maintenance) 1,984,986.01 2,579,503.56 2,481,232.52 2,783,719.74 3,473,725.52
Sub total 62,220,774.97 54,813,586.77 65,686,633.59 52,298,488.60 63,922,283.64
Grand Total 212,270,663.00 109,262,321.00 131,774,476.00 119,840,528.00 185,236,726.00
Watershed Asset Management Plan Storm Water Division, Transportation and Storm Water Department
Final Report
7-38
This page intentionally left blank
Watershed Asset Management Plan Storm Water Division, Transportation and Storm Water Department
Final Report
8-1
SECTION 8 FUNDING STRATEGIES: “HOW WILL WE PAY FOR IT?”
Once the anticipated needed funds are estimated to keep assets achieving LOS, it is necessary to determine how to fund the overall program. Funding mechanisms for the City’s WAMP are described below.
8.1 CURRENT FUNDING LEVELS
The Division is predominately funded from the City’s General Fund; revenue from storm drain fees and parking lot enforcement also provide funding. Bonds are used to finance capital projects, as necessary, and are repaid by the general fund. Revenue for the general fund is derived from property and sales taxes. The general fund is used to fund most City services, with the exception of enterprise-funded services, such as sewer and water. The Division is allocated funding based on storm water needs and the competing needs of other City departments, which include Police, Fire, Streets, Facilities, Parks, Special Events Centers, General Administration, and other City services.
Capital projects for storm drains system expansion to support new or redevelopment can be funded by the development fees charged to the developer. Current funding levels for the Division are not fixed and will fluctuate from year to year based on the City budget and economic conditions. In general, given the state of the storm drain system, the pending permit and TMDL compliance requirements, the Division is not funded at levels sufficient to meet LOS. The NPDES and TMDL compliance costs are generally new costs the City has incurred or will incur. Costs for compliance have been growing, and, with TMDLs, are expected to grow significantly as projected in this WAMP.
8.2 BUDGETARY SCENARIOS
Section 7 of this report identified the Division’s future funding requirements to sustain the infrastructure and to meet levels of service. However, given the budgetary and resource limitations of the Division, budgetary scenarios were analyzed to better understand the impacts to the assets with respect to varying funding levels.
The long-range funding requirements were modeled depicting the two funding sources: CIP and general. CIPs are typically bond funded and are approved under a process where the capital needs of the Division are reviewed and compared to the capital needs of other Departments and Divisions. Bonds are repaid from the general fund and not charged against the Division’s operating budget. As mentioned above, the general fund is competed for by other City services and the budget allocated to the Division can vary year to year. The same is true of CIP funds. For FY13, $34.5 million was allocated to the Division from the general fund. This budget covers all non-capital costs, including operations and maintenance. New capital infrastructure owned and operated by the Division requires budgetary increases to accommodate operations, maintenance, and permitting costs. The budgetary scenarios evaluated the funding levels needed to adequately meet the increased operations and maintenance needs created by the new Division operated infrastructure.
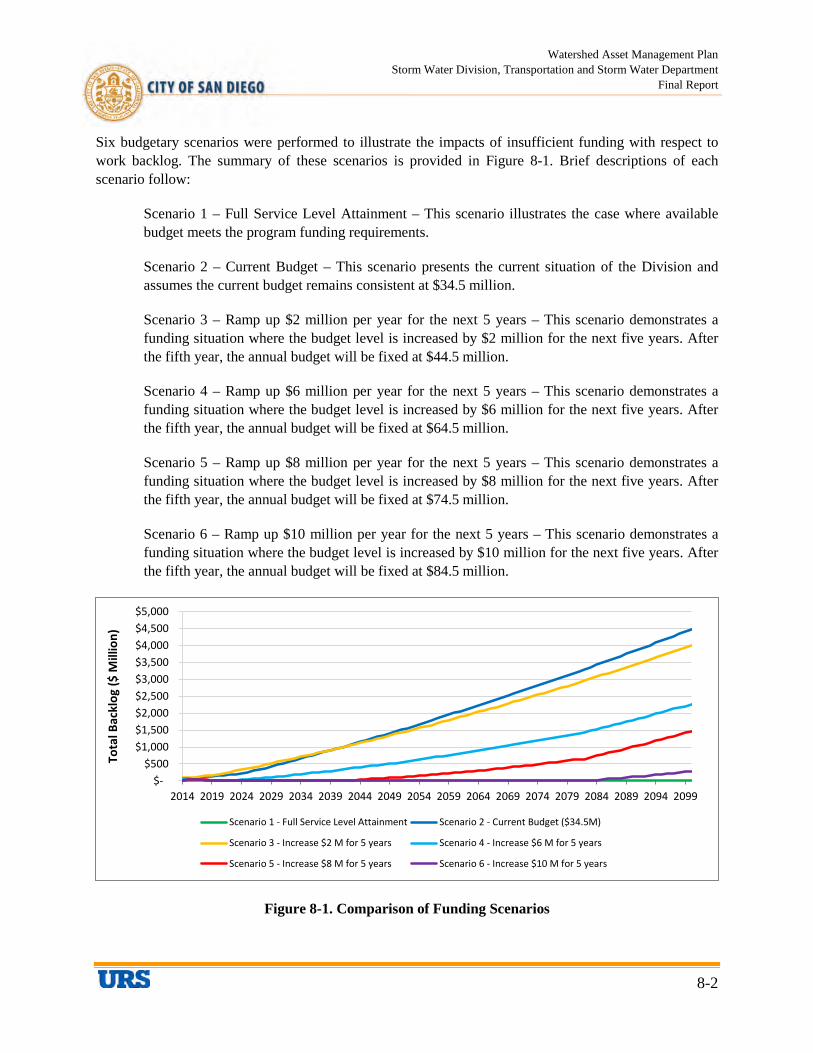
Watershed Asset Management Plan Storm Water Division, Transportation and Storm Water Department
Final Report
8-2
Six budgetary scenarios were performed to illustrate the impacts of insufficient funding with respect to work backlog. The summary of these scenarios is provided in Figure 8-1. Brief descriptions of each scenario follow:
Scenario 1 – Full Service Level Attainment – This scenario illustrates the case where available budget meets the program funding requirements.
Scenario 2 – Current Budget – This scenario presents the current situation of the Division and assumes the current budget remains consistent at $34.5 million.
Scenario 3 – Ramp up $2 million per year for the next 5 years – This scenario demonstrates a funding situation where the budget level is increased by $2 million for the next five years. After the fifth year, the annual budget will be fixed at $44.5 million.
Scenario 4 – Ramp up $6 million per year for the next 5 years – This scenario demonstrates a funding situation where the budget level is increased by $6 million for the next five years. After the fifth year, the annual budget will be fixed at $64.5 million.
Scenario 5 – Ramp up $8 million per year for the next 5 years – This scenario demonstrates a funding situation where the budget level is increased by $8 million for the next five years. After the fifth year, the annual budget will be fixed at $74.5 million.
Scenario 6 – Ramp up $10 million per year for the next 5 years – This scenario demonstrates a funding situation where the budget level is increased by $10 million for the next five years. After the fifth year, the annual budget will be fixed at $84.5 million.
Figure 8-1. Comparison of Funding Scenarios
$- $500
$1,000 $1,500 $2,000 $2,500 $3,000 $3,500 $4,000 $4,500 $5,000
2014 2019 2024 2029 2034 2039 2044 2049 2054 2059 2064 2069 2074 2079 2084 2089 2094 2099
Tota
l Bac
klog
($ M
illio
n)
Scenario 1 - Full Service Level Attainment Scenario 2 - Current Budget ($34.5M)
Scenario 3 - Increase $2 M for 5 years Scenario 4 - Increase $6 M for 5 years
Scenario 5 - Increase $8 M for 5 years Scenario 6 - Increase $10 M for 5 years
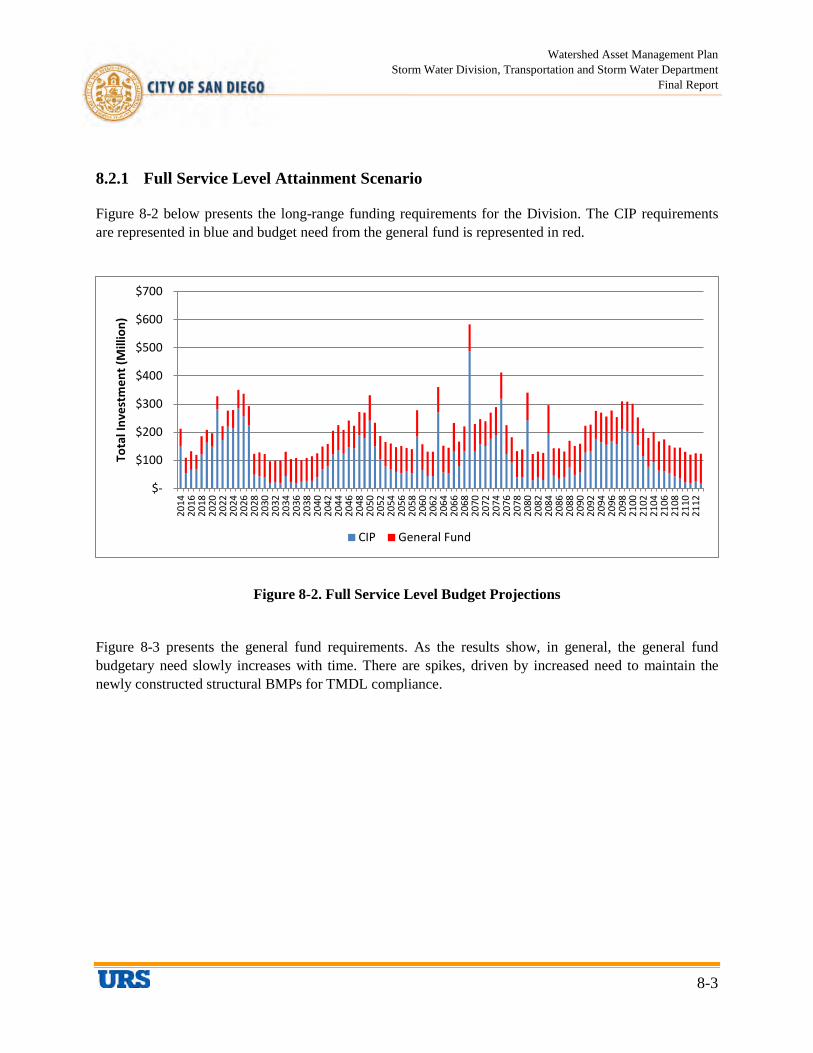
Watershed Asset Management Plan Storm Water Division, Transportation and Storm Water Department
Final Report
8-3
8.2.1 Full Service Level Attainment Scenario
Figure 8-2 below presents the long-range funding requirements for the Division. The CIP requirements are represented in blue and budget need from the general fund is represented in red.
Figure 8-2. Full Service Level Budget Projections
Figure 8-3 presents the general fund requirements. As the results show, in general, the general fund budgetary need slowly increases with time. There are spikes, driven by increased need to maintain the newly constructed structural BMPs for TMDL compliance.
$-
$100
$200
$300
$400
$500
$600
$700
2014
2016
2018
2020
2022
2024
2026
2028
2030
2032
2034
2036
2038
2040
2042
2044
2046
2048
2050
2052
2054
2056
2058
2060
2062
2064
2066
2068
2070
2072
2074
2076
2078
2080
2082
2084
2086
2088
2090
2092
2094
2096
2098
2100
2102
2104
2106
2108
2110
2112
Tota
l Inv
estm
ent (
Mill
ion)
CIP General Fund
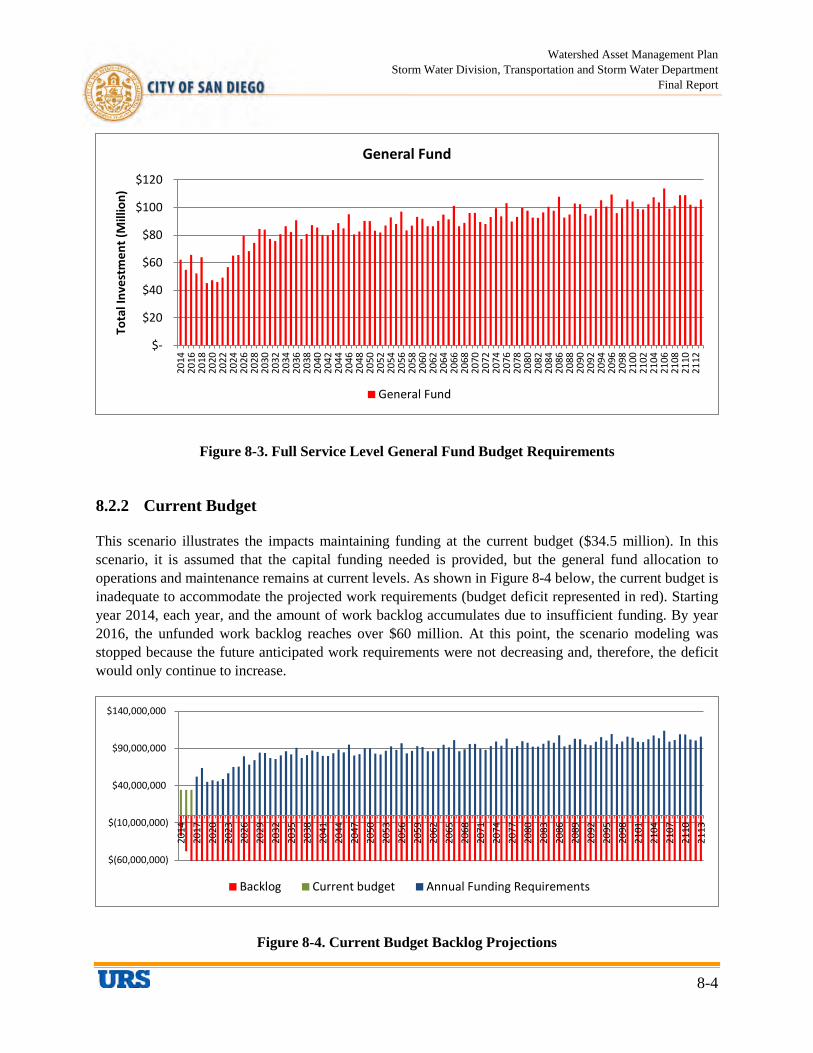
Watershed Asset Management Plan Storm Water Division, Transportation and Storm Water Department
Final Report
8-4
Figure 8-3. Full Service Level General Fund Budget Requirements
8.2.2 Current Budget
This scenario illustrates the impacts maintaining funding at the current budget ($34.5 million). In this scenario, it is assumed that the capital funding needed is provided, but the general fund allocation to operations and maintenance remains at current levels. As shown in Figure 8-4 below, the current budget is inadequate to accommodate the projected work requirements (budget deficit represented in red). Starting year 2014, each year, and the amount of work backlog accumulates due to insufficient funding. By year 2016, the unfunded work backlog reaches over $60 million. At this point, the scenario modeling was stopped because the future anticipated work requirements were not decreasing and, therefore, the deficit would only continue to increase.
Figure 8-4. Current Budget Backlog Projections
$-
$20
$40
$60
$80
$100
$12020
1420
1620
1820
2020
2220
2420
2620
2820
3020
3220
3420
3620
3820
4020
4220
4420
4620
4820
5020
5220
5420
5620
5820
6020
6220
6420
6620
6820
7020
7220
7420
7620
7820
8020
8220
8420
8620
8820
9020
9220
9420
9620
9821
0021
0221
0421
0621
0821
1021
12
Tota
l Inv
estm
ent (
Mill
ion)
General Fund
General Fund
$(60,000,000)
$(10,000,000)
$40,000,000
$90,000,000
$140,000,000
2014
2017
2020
2023
2026
2029
2032
2035
2038
2041
2044
2047
2050
2053
2056
2059
2062
2065
2068
2071
2074
2077
2080
2083
2086
2089
2092
2095
2098
2101
2104
2107
2110
2113
Backlog Current budget Annual Funding Requirements
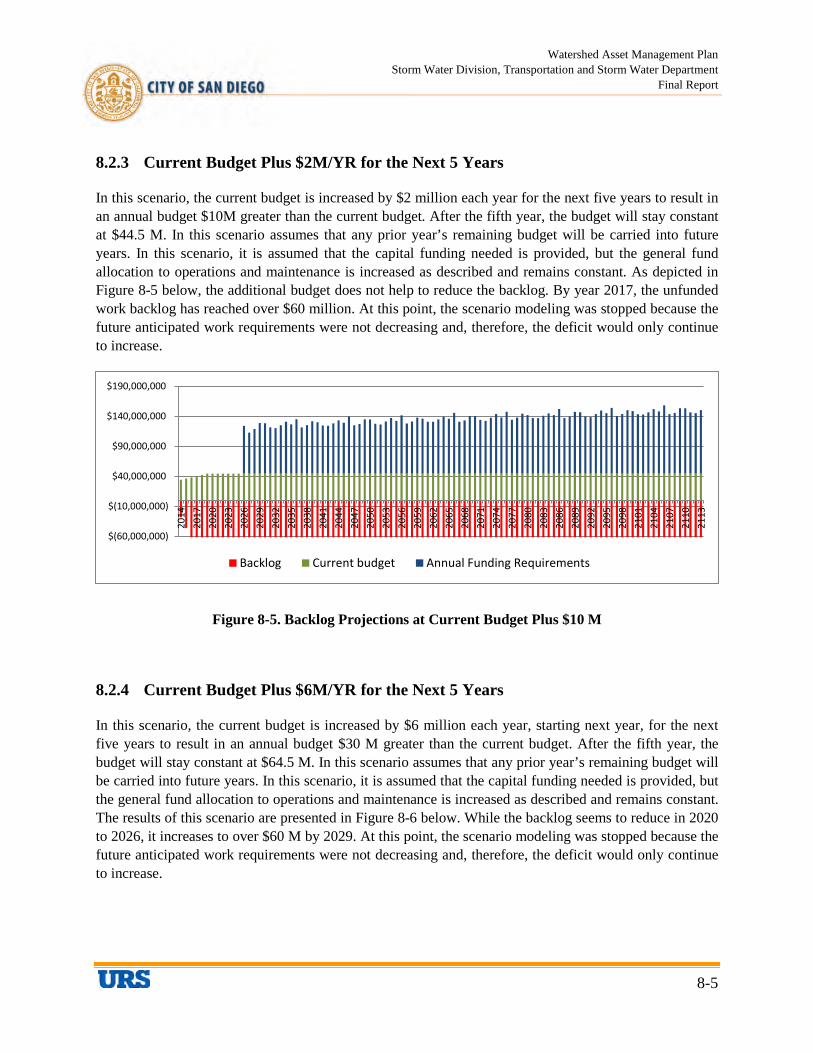
Watershed Asset Management Plan Storm Water Division, Transportation and Storm Water Department
Final Report
8-5
8.2.3 Current Budget Plus $2M/YR for the Next 5 Years
In this scenario, the current budget is increased by $2 million each year for the next five years to result in an annual budget $10M greater than the current budget. After the fifth year, the budget will stay constant at $44.5 M. In this scenario assumes that any prior year’s remaining budget will be carried into future years. In this scenario, it is assumed that the capital funding needed is provided, but the general fund allocation to operations and maintenance is increased as described and remains constant. As depicted in Figure 8-5 below, the additional budget does not help to reduce the backlog. By year 2017, the unfunded work backlog has reached over $60 million. At this point, the scenario modeling was stopped because the future anticipated work requirements were not decreasing and, therefore, the deficit would only continue to increase.
Figure 8-5. Backlog Projections at Current Budget Plus $10 M
8.2.4 Current Budget Plus $6M/YR for the Next 5 Years
In this scenario, the current budget is increased by $6 million each year, starting next year, for the next five years to result in an annual budget $30 M greater than the current budget. After the fifth year, the budget will stay constant at $64.5 M. In this scenario assumes that any prior year’s remaining budget will be carried into future years. In this scenario, it is assumed that the capital funding needed is provided, but the general fund allocation to operations and maintenance is increased as described and remains constant. The results of this scenario are presented in Figure 8-6 below. While the backlog seems to reduce in 2020 to 2026, it increases to over $60 M by 2029. At this point, the scenario modeling was stopped because the future anticipated work requirements were not decreasing and, therefore, the deficit would only continue to increase.
$(60,000,000)
$(10,000,000)
$40,000,000
$90,000,000
$140,000,000
$190,000,000
2014
2017
2020
2023
2026
2029
2032
2035
2038
2041
2044
2047
2050
2053
2056
2059
2062
2065
2068
2071
2074
2077
2080
2083
2086
2089
2092
2095
2098
2101
2104
2107
2110
2113
Backlog Current budget Annual Funding Requirements

Watershed Asset Management Plan Storm Water Division, Transportation and Storm Water Department
Final Report
8-6
Figure 8-6. Backlog Projections at Current Budget Plus $30 M
8.2.5 Current Budget Plus $8M/YR for the Next 5 Years
In this scenario, the current budget is increased by $8 million each year, starting next year, for the next five years to result in an annual budget $40 M greater than the current budget. After the fifth year, the budget will stay constant at $74.5 M. In this scenario assumes that any prior year’s remaining budget will be carried into future years. In this scenario, it is assumed that the capital funding needed is provided, but the general fund allocation to operations and maintenance is increased as described and remains constant. The results of this scenario are presented in Figure 8-7 below. The impact of the immediate increase in budget is dramatic. The scenario demonstrates that immediately increasing the annual budget by $8 million for the next five years greatly reduces the amount of work backlog accumulated. However, for years 2014 to 2019, increase of $8 million per year is still not sufficient. Work backlog still accumulates during those years. However, the increased budget starts to benefit after year 2017 where the work backlog starts to diminish. By year 2020, at the annual budget of $74.5 million, the work backlog is eliminated. However, in 2041, the work deficit re-appears and work becomes backlogged again with the backlog increasing thereafter.
$(60,000,000)
$(10,000,000)
$40,000,000
$90,000,000
$140,000,000
$190,000,000
$240,000,000
2014
2017
2020
2023
2026
2029
2032
2035
2038
2041
2044
2047
2050
2053
2056
2059
2062
2065
2068
2071
2074
2077
2080
2083
2086
2089
2092
2095
2098
2101
2104
2107
2110
2113
Backlog Current budget Annual Funding Requirements
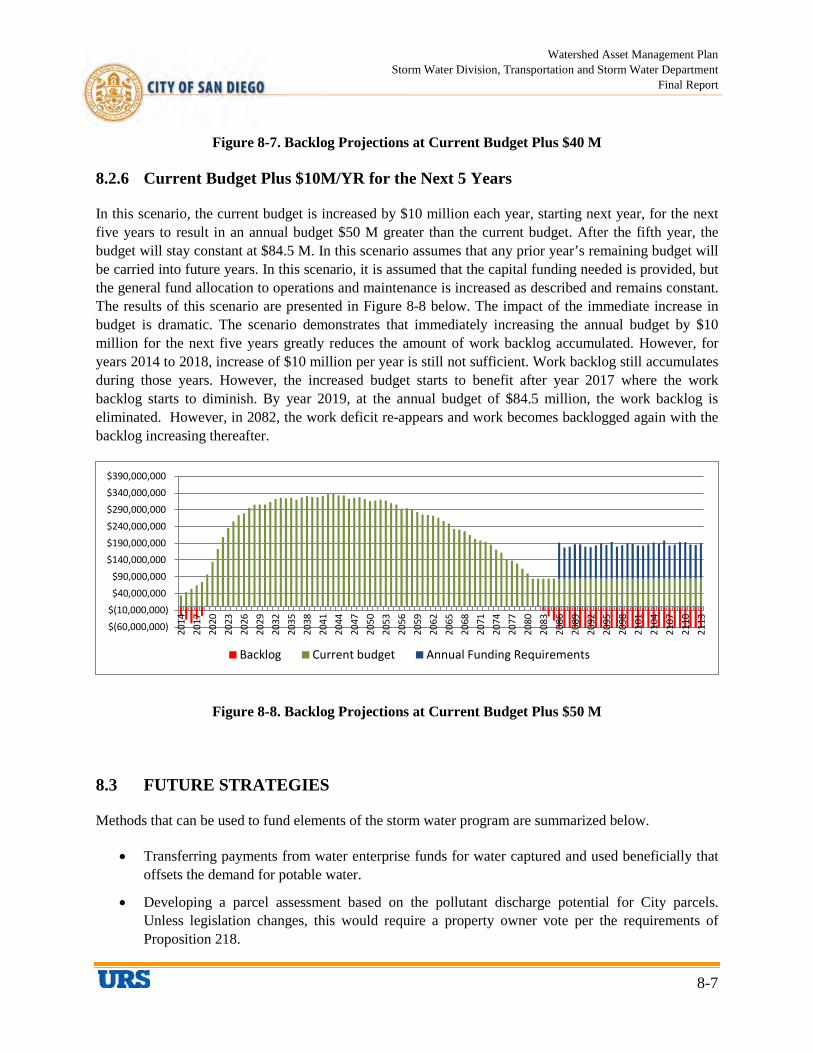
Watershed Asset Management Plan Storm Water Division, Transportation and Storm Water Department
Final Report
8-7
Figure 8-7. Backlog Projections at Current Budget Plus $40 M
8.2.6 Current Budget Plus $10M/YR for the Next 5 Years
In this scenario, the current budget is increased by $10 million each year, starting next year, for the next five years to result in an annual budget $50 M greater than the current budget. After the fifth year, the budget will stay constant at $84.5 M. In this scenario assumes that any prior year’s remaining budget will be carried into future years. In this scenario, it is assumed that the capital funding needed is provided, but the general fund allocation to operations and maintenance is increased as described and remains constant. The results of this scenario are presented in Figure 8-8 below. The impact of the immediate increase in budget is dramatic. The scenario demonstrates that immediately increasing the annual budget by $10 million for the next five years greatly reduces the amount of work backlog accumulated. However, for years 2014 to 2018, increase of $10 million per year is still not sufficient. Work backlog still accumulates during those years. However, the increased budget starts to benefit after year 2017 where the work backlog starts to diminish. By year 2019, at the annual budget of $84.5 million, the work backlog is eliminated. However, in 2082, the work deficit re-appears and work becomes backlogged again with the backlog increasing thereafter.
Figure 8-8. Backlog Projections at Current Budget Plus $50 M
8.3 FUTURE STRATEGIES
Methods that can be used to fund elements of the storm water program are summarized below.
• Transferring payments from water enterprise funds for water captured and used beneficially that offsets the demand for potable water.
• Developing a parcel assessment based on the pollutant discharge potential for City parcels. Unless legislation changes, this would require a property owner vote per the requirements of Proposition 218.
$(60,000,000) $(10,000,000) $40,000,000 $90,000,000
$140,000,000 $190,000,000 $240,000,000 $290,000,000 $340,000,000 $390,000,000
2014
2017
2020
2023
2026
2029
2032
2035
2038
2041
2044
2047
2050
2053
2056
2059
2062
2065
2068
2071
2074
2077
2080
2083
2086
2089
2092
2095
2098
2101
2104
2107
2110
2113
Backlog Current budget Annual Funding Requirements
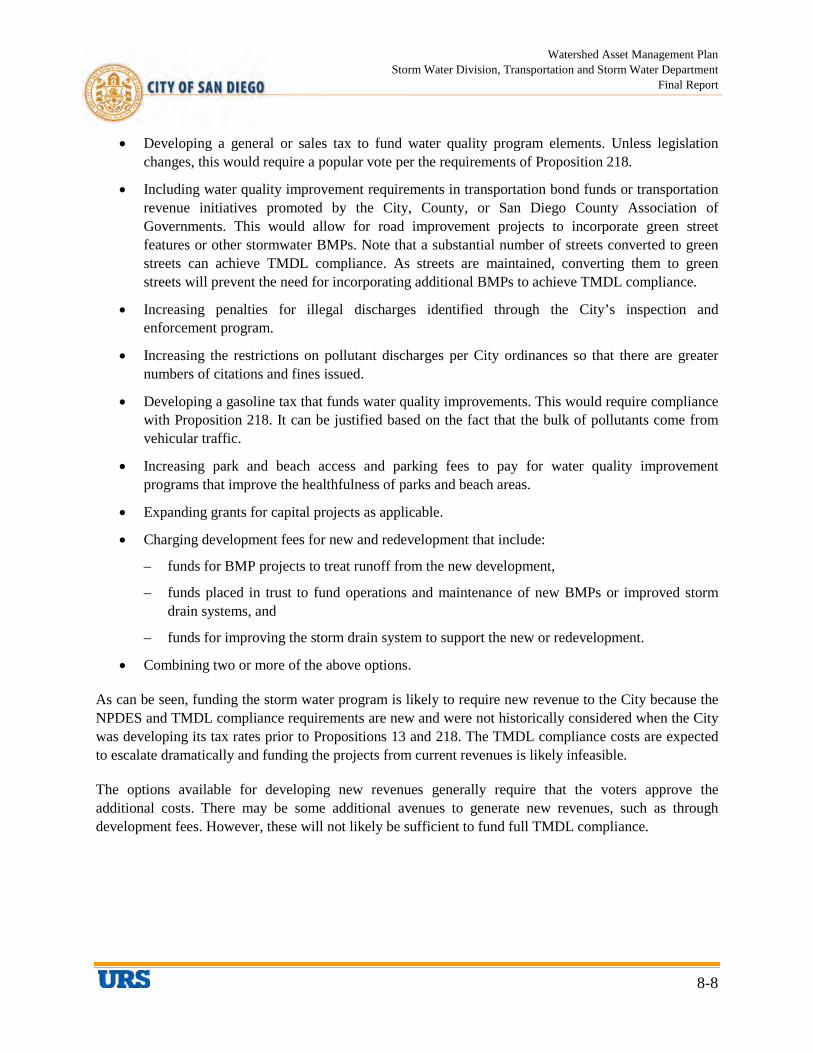
Watershed Asset Management Plan Storm Water Division, Transportation and Storm Water Department
Final Report
8-8
• Developing a general or sales tax to fund water quality program elements. Unless legislation changes, this would require a popular vote per the requirements of Proposition 218.
• Including water quality improvement requirements in transportation bond funds or transportation revenue initiatives promoted by the City, County, or San Diego County Association of Governments. This would allow for road improvement projects to incorporate green street features or other stormwater BMPs. Note that a substantial number of streets converted to green streets can achieve TMDL compliance. As streets are maintained, converting them to green streets will prevent the need for incorporating additional BMPs to achieve TMDL compliance.
• Increasing penalties for illegal discharges identified through the City’s inspection and enforcement program.
• Increasing the restrictions on pollutant discharges per City ordinances so that there are greater numbers of citations and fines issued.
• Developing a gasoline tax that funds water quality improvements. This would require compliance with Proposition 218. It can be justified based on the fact that the bulk of pollutants come from vehicular traffic.
• Increasing park and beach access and parking fees to pay for water quality improvement programs that improve the healthfulness of parks and beach areas.
• Expanding grants for capital projects as applicable.
• Charging development fees for new and redevelopment that include:
– funds for BMP projects to treat runoff from the new development,
– funds placed in trust to fund operations and maintenance of new BMPs or improved storm drain systems, and
– funds for improving the storm drain system to support the new or redevelopment.
• Combining two or more of the above options.
As can be seen, funding the storm water program is likely to require new revenue to the City because the NPDES and TMDL compliance requirements are new and were not historically considered when the City was developing its tax rates prior to Propositions 13 and 218. The TMDL compliance costs are expected to escalate dramatically and funding the projects from current revenues is likely infeasible.
The options available for developing new revenues generally require that the voters approve the additional costs. There may be some additional avenues to generate new revenues, such as through development fees. However, these will not likely be sufficient to fund full TMDL compliance.

Watershed Asset Management Plan Storm Water Division, Transportation and Storm Water Department
Final Report
9-1
SECTION 9 ASSET MANAGEMENT IMPROVEMENT PLAN
The following paragraphs describe the components of the Asset Management Improvement Plan.
9.1 CONFIDENCE LEVEL RATING
The confidence-level rating (CLR) is used not only to measure the current asset management practice, but also to identify and prioritize future improvements. The confidence level rating provides a measure by which the Division can track the improvement of the WAMP and the associated management decisions.
In developing a first iteration WAMP, an organization will seldom have perfect data to support the asset portfolio. As illustrated in Figure 9-1, asset management is a process of continuous improvement. The Division can make improvements to the WAMP as the quantity and quality of data improves. The Division realized that data were not available across the asset types and classes, and may not be as accurate as desired. Through the WAMP development process, the Division gained a better understanding of the data gaps and developed mitigation plans to improve the overall data quality. Any assumed data will be superseded by actual data when it becomes available. As the first iteration, it is typical that the WAMP has a confidence level rating score of 60% or below. In addition, the confidence level varies over the planning horizon, as the planning period is extended (short-range versus long-range), the accuracy of the predictions decreases. For example, the confidence level for a 10-year projection will be much higher than with a projection of 80 to 100 years. It is important to have a high confidence level in early years (years 1 through 10), as the WAMP will form the basis for future capital and operational investment programs.
The CLR is based on the following key elements. These key elements play a critical role in the accuracy of the future renewal funding requirements projection and the acceptance of the asset management plan.
1. Asset Inventory – Measures the completeness of the asset data. (Did the asset register include the assets owned by the Division?)
2. Data Quality – Measures the quality and completeness of the data attributes used to develop the AMP. (How many data assumptions were used to complete the asset management plan?)
3. Asset Hierarchy – Measures the quality of the asset hierarchy used to develop the WAMP. (How effective and efficient is the asset hierarchy used to develop the asset management plan?)
4. Asset Replacement Cost – Measures the accuracy of the estimated replacement costs of the assets and systems. (How accurate is the estimated replacement cost of the asset?)
5. Management Strategies – Measures the accuracy of the management strategies and renewal strategies used in the WAMP. (How representative is the useful life?).
6. Business Risk Exposure – Measures the accuracy of the risk assessment performed. (Is the risk assessment representative of the actual risks facing the organization?).
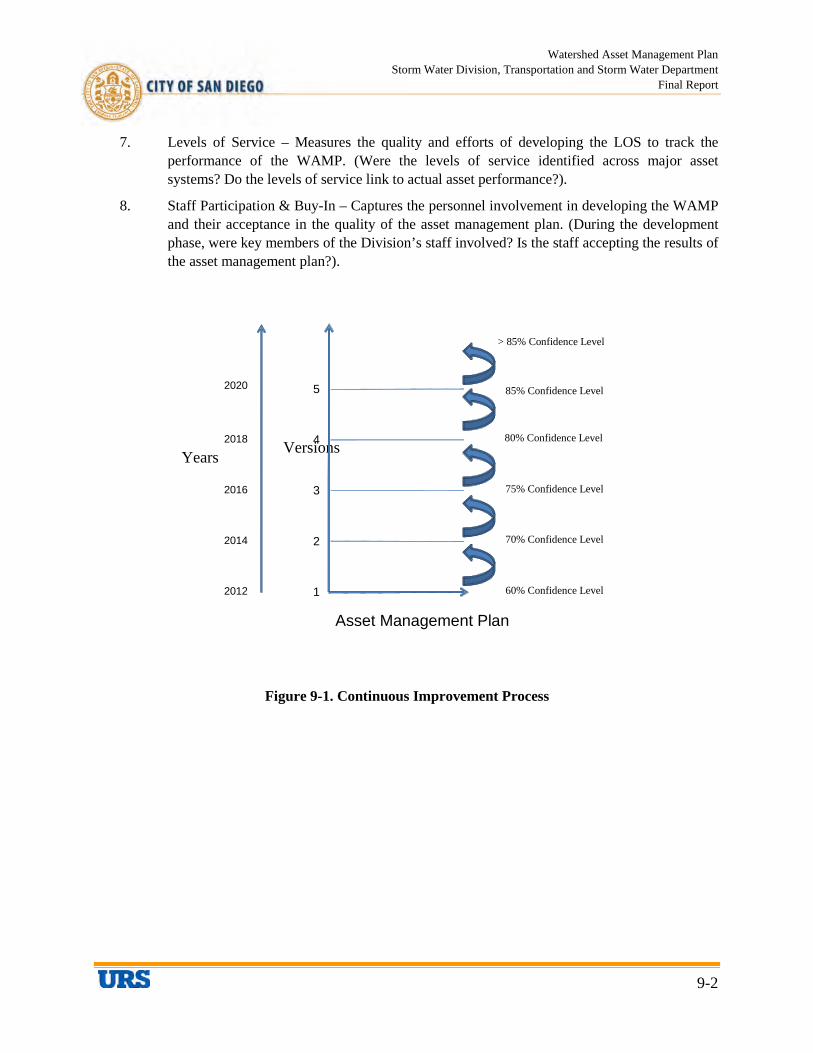
Watershed Asset Management Plan Storm Water Division, Transportation and Storm Water Department
Final Report
9-2
7. Levels of Service – Measures the quality and efforts of developing the LOS to track the performance of the WAMP. (Were the levels of service identified across major asset systems? Do the levels of service link to actual asset performance?).
8. Staff Participation & Buy-In – Captures the personnel involvement in developing the WAMP and their acceptance in the quality of the asset management plan. (During the development phase, were key members of the Division’s staff involved? Is the staff accepting the results of the asset management plan?).
Figure 9-1. Continuous Improvement Process
Asset Management Plan
Versions
1
2
3
4
5
Years
2012
2014
2016
2018
2020
60% Confidence Level
70% Confidence Level
75% Confidence Level
85% Confidence Level
> 85% Confidence Level
80% Confidence Level

Watershed Asset Management Plan Storm Water Division, Transportation and Storm Water Department
Final Report
9-3
Each CLR element listed above is assigned a weighting factor. The weighting factor quantifies the criticality of the key element with respect to the overall accuracy and quality of the WAMP. For example, the weighting of asset hierarchy is much lower than data quality, since the asset hierarchy only affects the organization of data and does not directly impact the accuracy of the future renewal funding requirement projections. Table 9-1 presents the primary weighting for each of the key CLR elements.
Table 9-1. Primary, Secondary, and Tertiary Weighting
Key Confidence Level Elements Primary Weighting
Asset Inventory 15%
Data Quality 15%
Asset Hierarchy 5%
Asset Replacement Cost 15%
Management Strategies 20%
Business Risk Exposure 10%
Levels of Service 10%
Staff Participation and Staff Buy-in 10%
Average Confidence Level Rating 100%
A secondary weighting adjusts the importance of different asset types (i.e., hard assets, soft assets, and natural assets) with respect to one another within the same key element. The tertiary weighting is applied among the different asset classes within each asset types. Currently, an equal weight is assigned to each asset type and asset classes within asset type. The actual CLR itself is assessed at the asset class level. Table 9-2 shows the complete list of asset types and asset classes with their associated secondary and tertiary weighting.
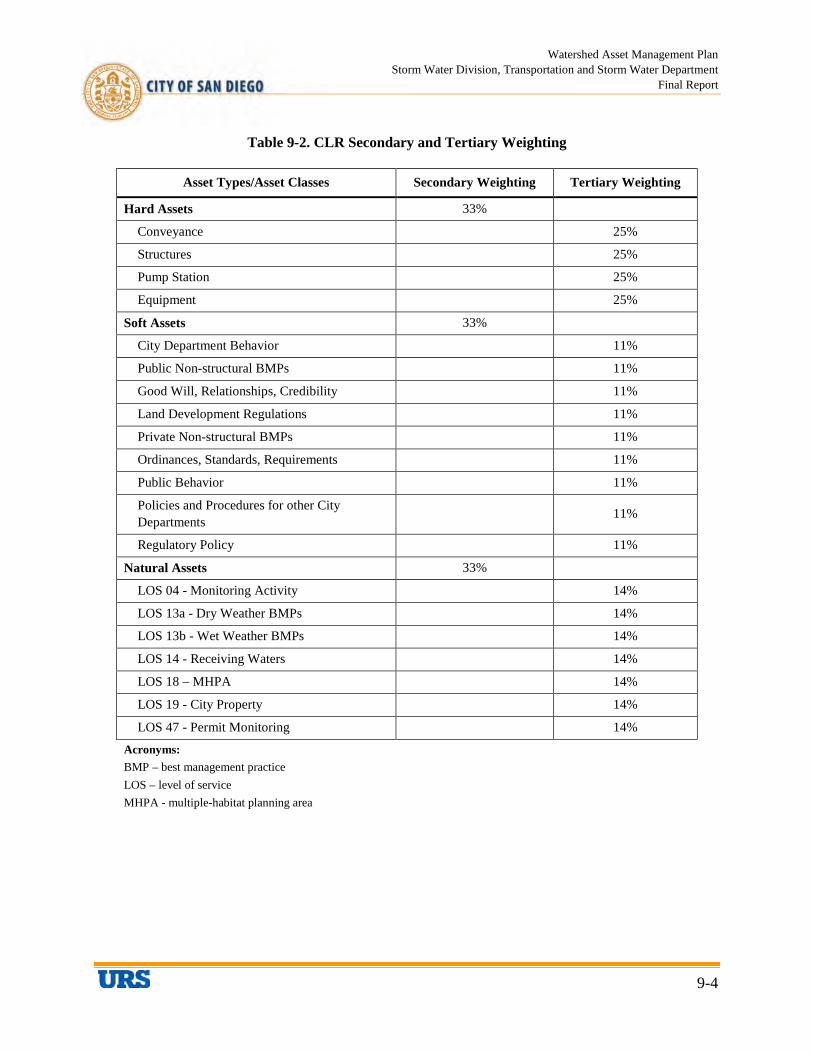
Watershed Asset Management Plan Storm Water Division, Transportation and Storm Water Department
Final Report
9-4
Table 9-2. CLR Secondary and Tertiary Weighting
Asset Types/Asset Classes Secondary Weighting Tertiary Weighting
Hard Assets 33%
Conveyance
25%
Structures
25%
Pump Station
25%
Equipment
25%
Soft Assets 33%
City Department Behavior
11%
Public Non-structural BMPs
11%
Good Will, Relationships, Credibility
11%
Land Development Regulations
11%
Private Non-structural BMPs
11%
Ordinances, Standards, Requirements
11%
Public Behavior
11%
Policies and Procedures for other City Departments
11%
Regulatory Policy
11%
Natural Assets 33%
LOS 04 - Monitoring Activity
14%
LOS 13a - Dry Weather BMPs
14%
LOS 13b - Wet Weather BMPs
14%
LOS 14 - Receiving Waters
14%
LOS 18 – MHPA
14%
LOS 19 - City Property
14%
LOS 47 - Permit Monitoring
14%
Acronyms: BMP – best management practice LOS – level of service MHPA - multiple-habitat planning area
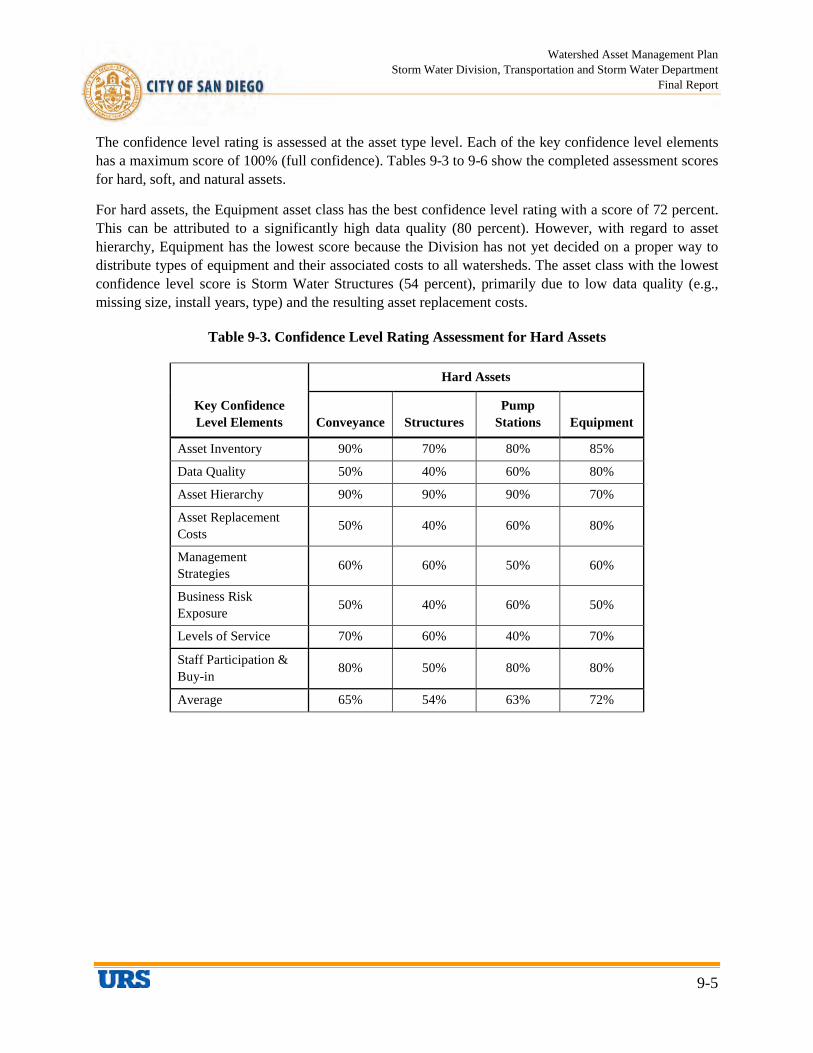
Watershed Asset Management Plan Storm Water Division, Transportation and Storm Water Department
Final Report
9-5
The confidence level rating is assessed at the asset type level. Each of the key confidence level elements has a maximum score of 100% (full confidence). Tables 9-3 to 9-6 show the completed assessment scores for hard, soft, and natural assets.
For hard assets, the Equipment asset class has the best confidence level rating with a score of 72 percent. This can be attributed to a significantly high data quality (80 percent). However, with regard to asset hierarchy, Equipment has the lowest score because the Division has not yet decided on a proper way to distribute types of equipment and their associated costs to all watersheds. The asset class with the lowest confidence level score is Storm Water Structures (54 percent), primarily due to low data quality (e.g., missing size, install years, type) and the resulting asset replacement costs.
Table 9-3. Confidence Level Rating Assessment for Hard Assets
Key Confidence Level Elements
Hard Assets
Conveyance Structures Pump
Stations Equipment
Asset Inventory 90% 70% 80% 85%
Data Quality 50% 40% 60% 80%
Asset Hierarchy 90% 90% 90% 70%
Asset Replacement Costs 50% 40% 60% 80%
Management Strategies 60% 60% 50% 60%
Business Risk Exposure 50% 40% 60% 50%
Levels of Service 70% 60% 40% 70%
Staff Participation & Buy-in 80% 50% 80% 80%
Average 65% 54% 63% 72%
Watershed Asset Management Plan Storm Water Division, Transportation and Storm Water Department
Final Report
9-6
This page intentionally left blank

Watershed Asset Management Plan Storm Water Division, Transportation and Storm Water Department
Final Report
9-7
For soft assets, Land Development Regulations, Ordinances, Standards, Requirements, and Policy and Procedures for other City Departments have the best confidence level rating with an average score of 75 percent. This can be attributed to significantly high data quality (90 percent), which, in turn, resulted in a good prediction of asset valuation. For the rest of the asset classes, the confidence level is lower because of the low asset valuation confidence; asset valuation confidence is low because many assumptions were used in the valuation process.
Table 9-4. Confidence Level Rating Assessment for Soft Assets
Key Confidence Level Elements
Soft Assets
City Department Behavior
Public Non-
structural BMPs
Good Will, Relationships,
Credibility
Land Development Regulations
Private Non-
structural BMPs
Ordinances, Standards,
Requirements
Public Behavior
Policies and Procedures
for other City
Departments
Regulatory Policy
Asset Inventory 90% 90% 90% 90% 90% 90% 90% 90% 90%
Data Quality 75% 75% 80% 90% 80% 90% 80% 90% 55%
Asset Hierarchy 90% 90% 90% 90% 90% 90% 90% 90% 90%
Asset Valuation 30% 30% 30% 70% 30% 70% 30% 70% 30%
Management Strategies 60% 60% 50% 70% 60% 60% 50% 60% 60%
Business Risk Exposure 60% 60% 60% 60% 60% 60% 60% 60% 60%
Levels of Service 60% 60% 60% 60% 60% 60% 60% 60% 60%
Staff Participation and Buy-In 80% 80% 80% 80% 80% 80% 80% 80% 80%
Average 66% 66% 65% 76% 67% 74% 65% 74% 63%
For natural assets, LOS 18 (MHPA), LOS 19 (City Property), and LOS 47 (Permit Monitoring) have the best confidence level rating with an average score around 78 percent. This can be attributed to significantly high asset inventory (80 - 95 percent) and data quality (80 - 90 percent) which, in turn, resulted in a good prediction of asset valuation. On the other hand, LOS 13a and 13b have the lowest confidence level rating of 58 percent mostly due to the lack of asset inventory and hierarchy.

Watershed Asset Management Plan Storm Water Division, Transportation and Storm Water Department
Final Report
9-8
This page intentionally left blank
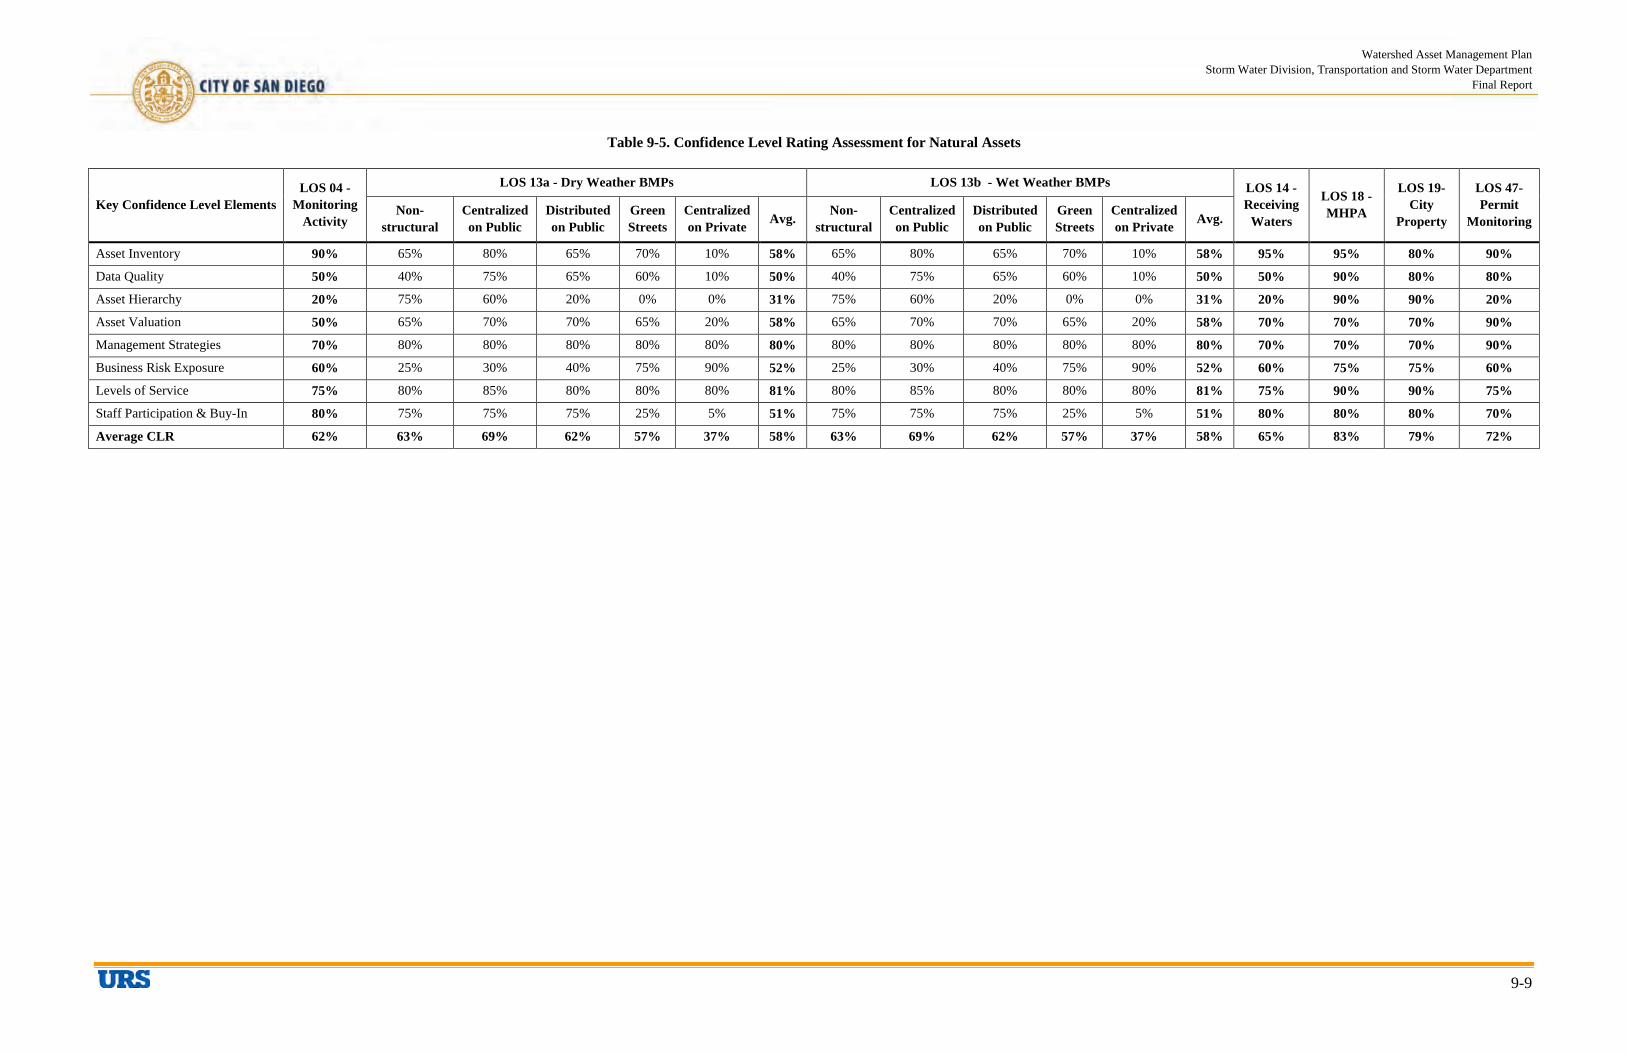
Watershed Asset Management Plan Storm Water Division, Transportation and Storm Water Department
Final Report
9-9
Table 9-5. Confidence Level Rating Assessment for Natural Assets
Key Confidence Level Elements LOS 04 -
Monitoring Activity
LOS 13a - Dry Weather BMPs LOS 13b - Wet Weather BMPs LOS 14 -Receiving
Waters
LOS 18 -MHPA
LOS 19-City
Property
LOS 47-Permit
Monitoring Non-
structural Centralized on Public
Distributed on Public
Green Streets
Centralized on Private Avg. Non-
structural Centralized on Public
Distributed on Public
Green Streets
Centralized on Private Avg.
Asset Inventory 90% 65% 80% 65% 70% 10% 58% 65% 80% 65% 70% 10% 58% 95% 95% 80% 90%
Data Quality 50% 40% 75% 65% 60% 10% 50% 40% 75% 65% 60% 10% 50% 50% 90% 80% 80%
Asset Hierarchy 20% 75% 60% 20% 0% 0% 31% 75% 60% 20% 0% 0% 31% 20% 90% 90% 20%
Asset Valuation 50% 65% 70% 70% 65% 20% 58% 65% 70% 70% 65% 20% 58% 70% 70% 70% 90%
Management Strategies 70% 80% 80% 80% 80% 80% 80% 80% 80% 80% 80% 80% 80% 70% 70% 70% 90%
Business Risk Exposure 60% 25% 30% 40% 75% 90% 52% 25% 30% 40% 75% 90% 52% 60% 75% 75% 60%
Levels of Service 75% 80% 85% 80% 80% 80% 81% 80% 85% 80% 80% 80% 81% 75% 90% 90% 75%
Staff Participation & Buy-In 80% 75% 75% 75% 25% 5% 51% 75% 75% 75% 25% 5% 51% 80% 80% 80% 70%
Average CLR 62% 63% 69% 62% 57% 37% 58% 63% 69% 62% 57% 37% 58% 65% 83% 79% 72%

Watershed Asset Management Plan Storm Water Division, Transportation and Storm Water Department
Final Report
9-10
This page intentionally left blank
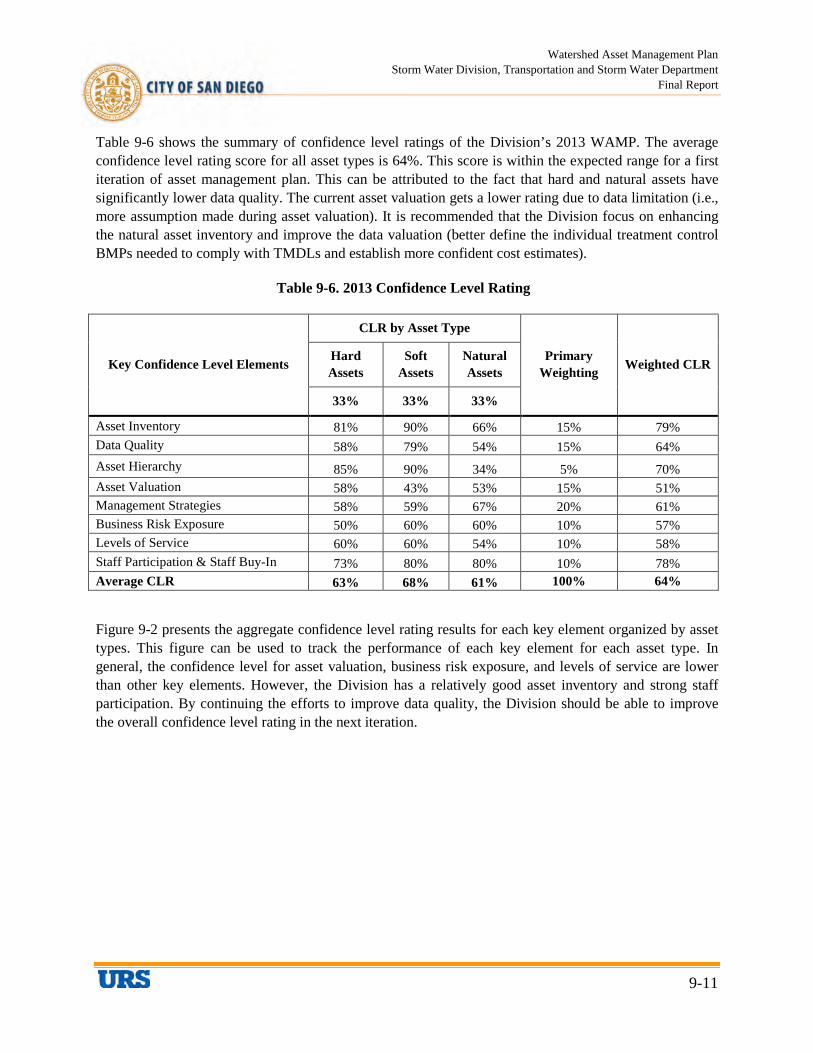
Watershed Asset Management Plan Storm Water Division, Transportation and Storm Water Department
Final Report
9-11
Table 9-6 shows the summary of confidence level ratings of the Division’s 2013 WAMP. The average confidence level rating score for all asset types is 64%. This score is within the expected range for a first iteration of asset management plan. This can be attributed to the fact that hard and natural assets have significantly lower data quality. The current asset valuation gets a lower rating due to data limitation (i.e., more assumption made during asset valuation). It is recommended that the Division focus on enhancing the natural asset inventory and improve the data valuation (better define the individual treatment control BMPs needed to comply with TMDLs and establish more confident cost estimates).
Table 9-6. 2013 Confidence Level Rating
Key Confidence Level Elements
CLR by Asset Type
Primary Weighting Weighted CLR Hard
Assets Soft
Assets Natural Assets
33% 33% 33%
Asset Inventory 81% 90% 66% 15% 79% Data Quality 58% 79% 54% 15% 64% Asset Hierarchy 85% 90% 34% 5% 70% Asset Valuation 58% 43% 53% 15% 51% Management Strategies 58% 59% 67% 20% 61% Business Risk Exposure 50% 60% 60% 10% 57% Levels of Service 60% 60% 54% 10% 58% Staff Participation & Staff Buy-In 73% 80% 80% 10% 78% Average CLR 63% 68% 61% 100% 64%
Figure 9-2 presents the aggregate confidence level rating results for each key element organized by asset types. This figure can be used to track the performance of each key element for each asset type. In general, the confidence level for asset valuation, business risk exposure, and levels of service are lower than other key elements. However, the Division has a relatively good asset inventory and strong staff participation. By continuing the efforts to improve data quality, the Division should be able to improve the overall confidence level rating in the next iteration.
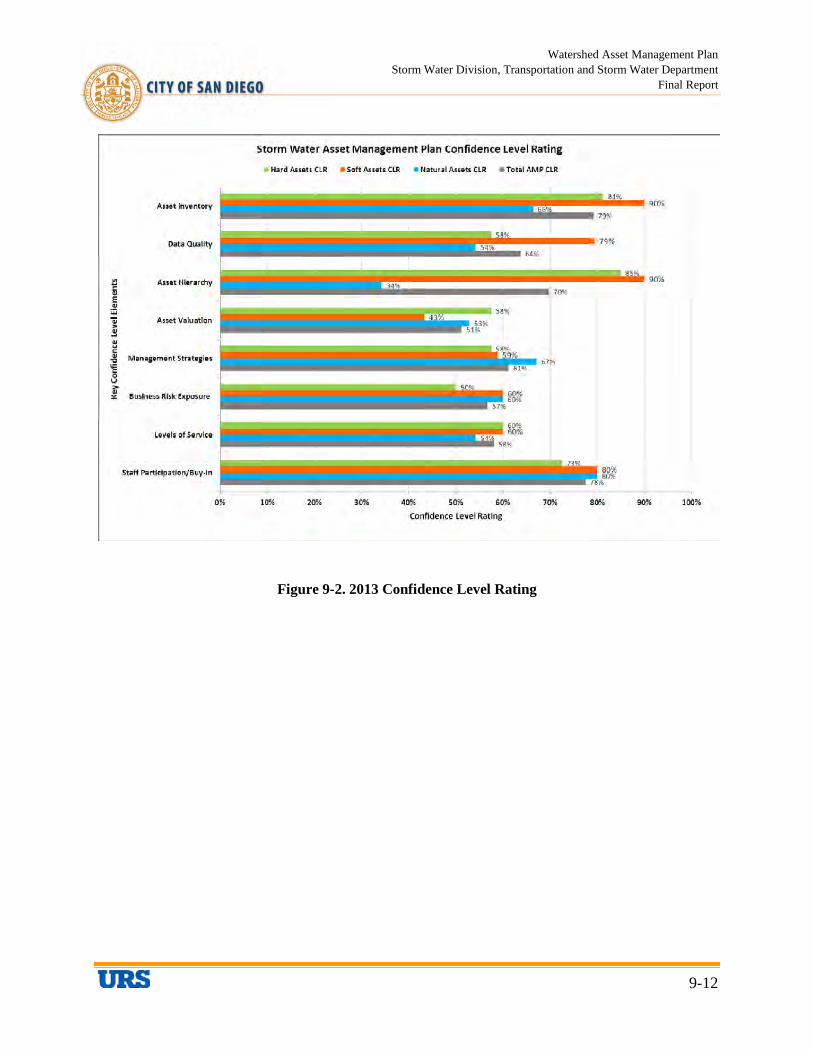
Watershed Asset Management Plan Storm Water Division, Transportation and Storm Water Department
Final Report
9-12
Figure 9-2. 2013 Confidence Level Rating

Watershed Asset Management Plan Storm Water Division, Transportation and Storm Water Department
Final Report
10-1
SECTION 10 RECOMMENDATIONS
Based on information presented in Sections 1 through 9 of this WAMP, recommendations were developed for the assets within each watershed regarding the actions to be taken and projects to be completed to manage the assets to achieve LOS. Overall, a number of activities are needed to improve the overall asset management planning program. A number of uncertainties exist regarding the condition of the assets, the ability of assets to achieve LOS, and the projects necessary for the assets to achieve LOS. These uncertainties are applicable City-wide. The general recommendations provided below can be applied and generally are a high priority in order for the Division to become more proactive in managing assets to achieve LOS.
1. Continue to improve the asset management plan on an annual basis by refining data to increase the level of confidence, and to effectively manage assets at the appropriate hierarchy.
2. Continue to develop a drainage master plan that assesses the hydraulic capacity of the storm drain pipes and inlets, and identifies under-capacity areas and the degree to which they are under capacity.
3. During all planning efforts – flood risk management, NPDES compliance, and TMDL implementation, create cross-functional teams that seek out opportunities to find synergy between projects and program elements that achieve multiple benefits of flood risk management and water quality improvement, if feasible.
4. Complete the Water Quality Improvement Plans and further refine the scheduling of the planning/design and construction costs for CLRP/WQIP BMPs to achieve water quality compliance.
5. While doing routine field inspections, measure the following and input this information into the GEO-SAP system:
• inlet size and material,
• pipe size, invert depths, and material,
• channel size, geometry, material, and depths.
6. Continue to conduct condition assessments of assets (e.g., outfalls) and incorporate the results into future WAMP updates.
7. Include right-of-way as assets in WAMP updates for use as potential future BMPs (e.g. green streets).
8. For mitigation sites developed in response to permitting or other environmental requirements, capture the mitigation sites as assets with specific levels of service tied to the mitigation requirements and project life cycle costs for such assets in the updated WAMPs.
9. Allocate O&M budgets by asset categories and watershed to the extent practicable. Set up a staff charging system that aligns staff time and expenses to specific assets. This will allow for better tracking of costs to perform O&M activities needed to maintain asset LOS.

Watershed Asset Management Plan Storm Water Division, Transportation and Storm Water Department
Final Report
10-2
10. Refine cost categories during future WAMP updates to allocate planning costs, which includes environmental document development and reviews, for capital and maintenance projects into operations and maintenance and program budgets rather than capital budgets, as appropriate.
11. Apply the WAMP to proactively drive future decisions and actions.
12. Document business process flows (e.g., Division budget planning process, etc.) and capture critical asset data and processes. By doing so, the Division will be able to identify areas of potential efficiency gains and specific resources needed to perform the activities.
13. Continue refining the asset inventory (i.e., specific assets) and apply the process down to the appropriate level of the asset hierarchy.
14. Develop and incorporate a process or structure to stratify CLRP activities that are associated with LOS 13a and 13b. Each CLRP activity should be established as a tertiary LOS.
15. Review high risk (based on BRE score) assets shown in each appendix and develop management strategies to promote efficiency to lower risk.
16. Identify assets where additional maintenance or rehabilitation would cost effectively extend that asset’s useful life. Adequate and timely maintenance will result in maintaining the asset’s level of service.
17. Educate and train staff on the implementation of the WAMP.
18. Perform a cost of service study and identify a dedicated funding source.
In addition to these general recommendations, several recommendations are watershed-specific. These recommendations are presented in Appendices A through F.
Watershed Asset Management Plan Storm Water Division, Transportation and Storm Water Department
Final Report
i
Table of Contents
A.1 Introduction ................................................................................................................................ A-1
A.1.1 San Diego Bay Watershed Description ........................................................................... A-1 A.1.2 San Diego Watershed Coordinators ................................................................................ A-4 A.1.3 Water Quality .................................................................................................................. A-4 A.1.4 Flood Risk Management ............................................................................................... A-15
A.2 Asset Inventory – “What Do We Own?” ............................................................................... A-21
A.2.1 Hard Assets ................................................................................................................... A-21 A.2.2 Natural Assets ............................................................................................................... A-23 A.2.3 Soft Assets ..................................................................................................................... A-23
A.3 Asset Management Costs: “What is Worth?” ....................................................................... A-24
A.4 What Is Its Condition? ............................................................................................................ A-28
A.5 What Needs To Be Done .......................................................................................................... A-36
A.6 When Do We Need It? ............................................................................................................. A-49
A.6.1 Soft and Natural BRE.................................................................................................... A-49 A.6.2 Hard Asset BRE ............................................................................................................ A-63
A.7 How Much Will It Cost?.......................................................................................................... A-75
A.8 Funding Strategies “How Will We Pay For It?” ................................................................... A-80
A.9 Assessment Management Improvement Plan ........................................................................ A-81
A.10 Recommendations .................................................................................................................... A-81
Watershed Asset Management Plan Storm Water Division, Transportation and Storm Water Department
Final Report
ii
List of Tables, Figures, and Appendices Tables
Table A-1. San Diego Bay WMA Jurisdictional Breakdown ........................................................... A-1
Table A-2. San Diego Bay Watershed Baseline High-priority Water Quality Problems ................. A-5 Table A-3. San Diego Bay Watershed Impaired Water Bodies ........................................................ A-7
Table A-4. San Diego Bay Watershed Channels ............................................................................ A-17
Table A-5. San Diego Bay Watershed Hard Assets ........................................................................ A-21
Table A-6. The Shared Equipment .................................................................................................. A-23
Table A-7. San Diego Bay Watershed Natural Asset Classes/Subclasses and Quantities .............. A-23
Table A-8. San Diego Bay Watershed Soft Asset Subclasses and Quantities ................................ A-24
Table A-9. San Diego Bay Watershed Assets Replacement Costs ................................................. A-25
Table A-10. Actions needed for Assets to Achieve LOSs ................................................................ A-37
Table A-11. Soft and Natural Asset BRE Scores - San Diego Bay Watershed ................................ A-51
Table A-12. FY 2014 Activity Summary – San Dieog Bay Watershed ............................................ A-83
Table A-13. FY 2014 Activity Summary – Shared Assets ............................................................... A-92
Figures
Figure A-1. San Diego Bay Watershed .............................................................................................. A-2
Figure A-2. Distribution of Storm Water Structures by Asset Count - San Diego Bay Watershed . A-22
Figure A-3. Distribution of Storm Water Conveyance by Length - San Diego Bay Watershed ...... A-22
Figure A-4. San Diego Bay Watershed Hard Assets Replacement Costs ........................................ A-26
Figure A-5. San Diego Bay Watershed Conveyance System Replacement Costs ........................... A-26
Figure A-6. San Diego Bay Watershed Storm Water Structures Replacement Costs ...................... A-27
Figure A-7. The Division’s Equipment Replacement Costs ............................................................ A-28 Figure A-8. Installation Profile - San Diego Bay Watershed ........................................................... A-29
Figure A-9. Summary of Hard Asset Conditions - San Diego Bay Watershed ................................ A-30
Figure A-10. Summary of Hard Asset Conditions by Asset Class - San Diego Bay Watershed ....... A-31
Figure A-11. Summary of Conveyance System Conditions - San Diego Bay Watershed ................. A-32
Figure A-12. Summary of Conditions of Storm Water Structures - San Diego Bay Watershed ........ A-33
Figure A-13. Summary of Conditions of Pump Station Assets - San Diego Bay Watershed ............ A-34
Figure A-14. Summary of Conditions of Equipment Assets .............................................................. A-35
Figure A-15. Consumption Profile - San Diego Bay Watershed ........................................................ A-36
Figure A-16. Hard Asset Risk Category Map .................................................................................... A-63
Figure A-17. Hard Asset BRE Scores by Asset Classes - San Diego Bay Watershed ....................... A-64
Figure A-18. BRE Summary of Conveyance System BRE Scores - San Diego Bay Watershed ...... A-65
Figure A-19. Conveyance System CoF Score Map - San Diego Bay Watershed .............................. A-66
Figure A-20. Conveyance System PoF Score Map - San Diego Bay Watershed ............................... A-67
Figure A-21. Conveyance System BRE Score Map - San Diego Bay Watershed ............................. A-68
Figure A-22. Storm Water Structure BRE Scores- San Diego Bay Watershed ................................. A-69
Figure A-23. Storm Water Structure CoF Score Map - San Diego Bay Watershed........................... A-70
Watershed Asset Management Plan Storm Water Division, Transportation and Storm Water Department
Final Report
iii
Figure A-24. Storm Water Structure PoF Score Map - San Diego Bay Watershed ........................... A-71
Figure A-25. Storm Water Structure BRE Score Map - San Diego Bay Watershed .......................... A-72
Figure A-26. Pump Station Asset BRE Scores - San Diego Bay Watershed ..................................... A-73
Figure A-27. Summary of Equipment Assets – San Diego City Wide .............................................. A-74
Figure A-28. Watershed 5 Year Average Forecast by Asset Type – San Diego Bay Watershed ...... A-76
Figure A-29. Watershed 10 Year Average Forecast by Asset Type – San Diego Bay Watershed .... A-76
Figure A-30. Watershed 30 Year Average Forecast by Asset Type – San Diego Bay Watershed .... A-77
Figure A-31. 100 Year Forecast by Asset Type - San Diego Bay Watershed .................................... A-78
Figure A-32. 100 Year Forecast by Activity Type - San Diego Bay Watershed ............................... A-79
Watershed Asset Management Plan Storm Water Division, Transportation and Storm Water Department
Final Report
iv
This page intentionally left blank