storage configuration guide: choosing the right ... · storage configuration guide: choosing the...
TRANSCRIPT

WHITEPAPER
STORAGE CONFIGURATION GUIDE:
CHOOSING THE RIGHT ARCHITECTURE FOR THE
APPLICATION AND ENVIRONMENT
This document is designed to aid in the configuration and deployment of Nexsan
storage solutions to meet specific performance requirements ranging from backup to virtual server
infrastructures. It is intended as a guide and should not supersede advice or information provided by an
Imation Systems Engineer.
JAMES PECKSENIOR SOLUTIONS ENGINEER, IMATION

WHITEPAPER 2
Imation Corp. 1 Imation Way, Oakdale, MN 55128-3414 | p. 651.704.4000 f. 651.537.4675 | www.imation.com/nexsan© Imation Corp. Nexsan, the Nexsan logo, E-Series, FASTier, E-Centre and NestOS are trademarks of Imation Corp. All other trademarks are property of their respective owners. (Rev. 10/02/13)
TECHNICAL BACKGROUNDThe ever-changing and fast moving IT market can make choosing, designing and deploying a storage system challenging. This fact has been compounded in recent years by the rapid development and rise of virtual server technology, which blurs legacy notions of server, network and storage architectures. Now more than ever, efficiently designing a storage system is critical as it provides an underpinning for all elements within the IT infrastructure. A significant number of IT departments are soon to encounter performance issues within their virtual infrastructures, if they have not already. This may often be due to a view of storage as a minor consideration within the infrastructure and a lack of understanding about the importance of IOPs.
As IT staff rapidly deploys virtual machines at an exponential rate, they inevitably reach the limit of the performance of the spinning disks, exceeding the storage IOP limits before the capacity limits. As a result, a significant amount of capacity is left over and is impossible to utilize. Consider the 4 main components within virtualization: CPU, Memory, Network and Disk Storage. In recent years we have witnessed CPU power continue to increase in alignment with ”Moore’s Law,” doubling approximately every two years and providing an ever increasing number of processing cores and clock speeds. We see memory sizes increasing rapidly due to low-cost RAM modules and developments of faster connectivity such as 10Gbit Ethernet and 40Gbit Infiniband. All of this allows for more VM’s to be deployed at increased levels of performance.
However, when we look at disk technology, we observe that classic spinning disks remain limited by the same mechanical components, which constrains the number of IOPs and thus the number of VMs they can support, despite improvements in interface speed. Although SSD technology will alter the relationship between storage and VMs, it is still in the early phases of adoption and may not become mainstream for several years due to cost and capacity constraints as well as reliability concerns. To simply sum up the problem, the IT industry’s thirst for greater numbers of virtual machines puts significant pressure on the storage infrastructure which can only be addressed by more efficient design. The following examines the major aspects of designing a storage system to meet modern demands, as well as touching on such phenomena as parity
“ ...the IT industry’s thirst for great numbers of virtual machines puts significant pressure on the storage infrastructure which can only be addressed by more efficient design.

WHITEPAPER 3
Imation Corp. 1 Imation Way, Oakdale, MN 55128-3414 | p. 651.704.4000 f. 651.537.4675 | www.imation.com/nexsan© Imation Corp. Nexsan, the Nexsan logo, E-Series, FASTier, E-Centre and NestOS are trademarks of Imation Corp. All other trademarks are property of their respective owners. (Rev. 10/02/13)
WHEN DID STORAGE BECOME SO CRITICAL?Looking at a modern virtual infrastructure, the hypervisor does an excellent job of making server hardware a commodity component, regardless of the technology used - VMware, Xen or Hyper-V. By making servers ‘virtual’ an IT department can move them between hardware swiftly and without downtime, leaving the physical machine to be viewed as little more than a CPU with a bit of memory. Conversely, in a VM environment, the storage system grows in importance as it becomes the underpinning of the entire infrastructure. In a traditional environment, most (if not all) physical servers have their own internal system disks and only rely on the SAN for application storage. In a virtualized environment the traditional system disks are provisioned from the central storage which not only adds load but also randomizes the data pattern as many virtual servers all contend for the same disk resource. Consider this example; customer “A” looks to consolidate and virtualize their infrastructure. They have 25 Windows server, 5 Linux servers with a small SAN of 18 SAS drives to support MS Exchange, an ERP system, 2 small SQL databases and user home directories. The customer in this scenario will often invest in several new servers with a drastically increased number of CPU cores and large amount of memory but will neglect the storage. The customer likely considers using the existing small SAN as the VM storage. The physical environment contains at least 78 SAS drives. However, the general view is that this can be consolidated into just 18 disks within the existing SAN. This is where problems begin because not only are the number of spindles drastically reduced, but the workload is simultaneously randomized and put into contention for access to storage resources. The result is poor performance due to shortsighted, inefficient storage design.
PERFORMANCE VS CAPACITY In the classic disk drive market, the rules of ”Moore’s Law” can be observed with significant capacity increases every 18 months. However, what we do NOT see is significant increase in spinning disk performance. Disk vendors have continually upgraded the disk interface in an attempt to mask the shortcoming. But this does not affect sustained performance as it is limited to the physical mechanics which have remained unchanged for many years. This is clearly visible when benchmarking a SATA1 vs SATA2 drive or a 3Gbit SAS vs 6Gbit SAS drive. The sustained performance results remain the same. In the past this may not have presented a challenge as disk capacity remained so low that most SAN solutions have included upwards of 50+ disks to provide any useful capacity. This many disks provided plenty of IOPs per GB of capacity. In the current technology climate a prevalence of cost-effective SATA drives provide the same capacity with a fraction
0.001
1980Jan
1985Jan
Capacity
Capa
city
(GB)
Peformance
Year
1990Jan
1995Jan
2000Jan
2005Jan
2010Jan
2015Jan
0.01
0.1
1
10
100
1000
10000
PERFORMANCEVS CAPACITYBALANCING PERFORMANCE, CAPACITY AND COST
CORRECT DISK FOR THE JOB
CapacityPerformance
Price
SATASASSSD

WHITEPAPER 4
Imation Corp. 1 Imation Way, Oakdale, MN 55128-3414 | p. 651.704.4000 f. 651.537.4675 | www.imation.com/nexsan© Imation Corp. Nexsan, the Nexsan logo, E-Series, FASTier, E-Centre and NestOS are trademarks of Imation Corp. All other trademarks are property of their respective owners. (Rev. 10/02/13)
of the number of disks required. This significantly lowers the number of IOPs per GB and, if used in the wrong environment like a highly transactional database or large virtual server infrastructure, these disks and their IOP capability will bottleneck long before the capacity limit is reached. It is also worth looking at the approximate break-even cost points of different disk technologies. At the 100-3000 IOP range, SATA drives provide a very cost effective platform with pricing usually provided in price per GB. At the 3000-10000 IOP range SAS drives are usually the default technology as reaching this level of performance with SATA requires a vast amount of spindles and thus, wasted capacity. High-performance disks are typically priced per GB, but sometimes per IOP. At the 10000+ IOP range, SSD begins to make financial sense. Within this range it is typical to find only small capacity requirements as only a fraction of a customer’s overall storage requires such levels of performance (keeping in mind that an average customer’s overall storage is over 70% static and never used). Once the 8000+ IOPs marker is reached, resellers frequently price per IOP as a price per GB becomes misleading and unattractive to the non-storage-savvy purchasing department. With this in mind, it is clear that balancing performance, capacity and cost is key to deigning an efficient storage system in a virtualized environment.
Consider the graphs and tables to further explain these concepts. NOTE: IOP figures are based on random workload and are intentionally conservative.
To understand the importance of these concepts, consider that in a standard (non-virtualized) environment each server utilizes its own independent local disk (sometimes referred to as ‘boot’). Moving this server to a virtualized environment dictates that it must ‘share’ its boot disk resource with many other virtual machines causing a state of contention with all VM’s competing for performance from the same resource pool. It is very common to find a customer implementing far fewer disks in their virtual infrastructure than they had deployed in the physical model. As such, each virtual machine gets only the performance of a fraction of one disk. This causes a random data pattern which decreases performance.
SATA – IOPs per GB
IO per second
Capacity (GB)
IOPs per GB
90 250 .36
90 500 .18
90 1000 .09
90 2000 .05
90 3000 .03
SATA – IOPs per VM (based on an average VM of 45GB)
Capacity (GB) IOPs per GB IOPs per VM
250 .36 16.2
500 .18 8.1
1000 .09 4.05
2000 .05 2.25
3000 .03 1.35
15k rpm SAS – IOPs per GB
IOPs per second
Capacity (GB)
IOPs per GB
190 300 0.63
190 450 0.42
190 600 0.32
15k rpm SAS – IOPs per VM (based on an average VM of 45GB)
Capacity (GB) IOPs per GB IOPs per VM
300 0.63 28.35
450 0.42 18.9
600 0.32 14.4

WHITEPAPER 5
Imation Corp. 1 Imation Way, Oakdale, MN 55128-3414 | p. 651.704.4000 f. 651.537.4675 | www.imation.com/nexsan© Imation Corp. Nexsan, the Nexsan logo, E-Series, FASTier, E-Centre and NestOS are trademarks of Imation Corp. All other trademarks are property of their respective owners. (Rev. 10/02/13)
I/O DATA PATTERNS – RANDOM VS SEQUENTIAL, READ VS WRITEThe pattern in which an application or ‘host’ server reads or writes its data can significantly affect the level of performance the storage system is able to provide. This can be further compounded by the choice of RAID level used as each RAID protection technique has a differing effect on write performance. This is generally referred to as ‘parity penalty’. Data patterns are usually referred to as either Random or Sequential. A random data pattern infers that the data is written or read from random areas of the disk platter. This has two main effects on the performance of a RAID system. First, it drastically reduces the effectiveness of the controller cache as cache relies on patterns to ‘guess’ which blocks of data will be read or written next. In a random data pattern this is not possible as a random sequence of events can never be ‘guessed’ and, as such, cached. The second crucial effect of random patterns on storage systems is an increased number of ‘seeks’. A seek refers to the point at which a disk head has to move to the next requested block of data. If this block of data is randomly placed it means the disks actuator arm and head must move a significant distance to ‘seek’ the block for each read or write. This adds significant overhead and lowers performance. SATA drives suffer under very random workloads as they only spin at 7200rpm. They utilize larger disk platters causing longer seek and access times (average 8.1ms access time). SAS drives are better suited as they spin at 15,000rpm and have smaller platters. Thus, each seek takes about half the time when compared to SATA drives (average 3.3ms access time). In extreme high-performance applications, SSD can be used as it has no moving parts and therefore seek times are near non-existent.
At this point it is worth noting a new disk type that has entered the storage market. NL-SAS (Near Line SAS) has caused some confusion in recent years as it shares the name with SAS but offers SATA-like capacities. Do not be fooled by this. An NL-SAS drive is nothing more than a SATA disk with a SAS connector and therefore offers the same performance characteristics as a SATA drive.
The key elements in understanding the performance of a spinning disk in a random workload are the spin speed (RPM) and access time. The faster a disk spins, the more IOPs it will provide. In stark contrast, a sequential data pattern is one of structure and predictability. Some common examples of applications characterized by a sequential data pattern are data backup and video streaming. In these applications, the files are typically large and are written to the disk in continuous blocks and sectors. With this in mind, the RAID controller and disks can more easily ‘guess’ and/or cache the impending blocks of data to increase performance. In addition the disk actuator arm and head does not need to move a great distance to seek the next requested block. Such sequential applications are usually designed
I/O DATAPATTERNS
Block 1
Block 2Block 3
Block 4
Block 5
RANDOM WORKLOAD
SEQUENTAL WORKLOAD
Block 1
Block 2
Block 3
Block 4
Block 5

WHITEPAPER 6
Imation Corp. 1 Imation Way, Oakdale, MN 55128-3414 | p. 651.704.4000 f. 651.537.4675 | www.imation.com/nexsan© Imation Corp. Nexsan, the Nexsan logo, E-Series, FASTier, E-Centre and NestOS are trademarks of Imation Corp. All other trademarks are property of their respective owners. (Rev. 10/02/13)
around MB/s (throughput). This design is rarely limited by disk speed and more commonly limited by the controller and interconnect. So, in a storage design for sequential applications, SATA, SAS and SSD disks provide very similar levels of performance. The quick rule of thumb is that sequential patterns are those with large or streaming files (backup, archive, video etc.) and are best suited to SATA drives. Random workloads are typically those with very small files or storage requests which have no consistent structure (Virtual servers, virtual desktops, transactional databases, etc.) and are best suited to SAS or possibly SSD. The following illustrations demonstrate Random and Sequential disk patterns.
THE IMPACT OF RAIDUnderstanding data patterns and disk types is crucial when discussing storage design for specific applications. However, there are additional considerations. The RAID level/type must also be considered. The storage concept of “parity penalty” refers to the performance cost or performance impact of protecting data via RAID. This performance penalty only exists on writes. So, it is important to understand if the environment is write intensive or read intensive. Fortunately, most environments are the latter. These are the RAID protection parity penalties:
• RAID 0: ~0% overhead vs reads
• RAID 1+0: ~50% overhead vs reads
• RAID 5: ~75% overhead vs reads
• RAID 6: ~85% overhead vs reads
Parity penalty depends on the way a block of data is written by the RAID protection level. Keep in mind that generating parity bits for each stripe of data incurs overhead. These figures are only truly visible in random write scenarios. In a sequential write environment, the RAID controller cache helps mitigate the performance impact. With these write overhead costs in mind, consider some best practices. SSD drives are designed for random workloads, so should typically be configured in a RAID 1+0 to maximize performance (unless an environment is 100% read). SAS drives are also aimed at performance. Therefore, RAID 1+0 or RAID 5 should be used. SATA drives are aimed at capacity with throughput, and due to their huge capacities should be configured in RAID 6. RAID 6 also provides additional security and peace of mind during rebuilds for backup applications where SATA drives are preferred. Note: RAID 5 may be considered when using 2TB drives or smaller. RAID 1+0 may also be considered in very high-scale virtual infrastructures of 2,000+ virtual machines.
I/O DATAPATTERNSSEQUENTIAL READ IOPs
512
b
1 kb
2 kb
4 kb
8 kb
16 k
b
32 k
b
64 k
b
128
kb
256
kb
512
kb
1 m
b
2 m
b
4 m
b
IO/s
ec
SSDSAS SATA
RANDOM READ IOPs
512
b
1 kb
2 kb
4 kb
8 kb
16 k
b
32 k
b
64 k
b
128
kb
256
kb
512
kb
1 m
b
2 m
b
4 m
b
IO/s
ec
SSDSAS SATA
WHITEPAPER 7
Imation Corp. 1 Imation Way, Oakdale, MN 55128-3414 | p. 651.704.4000 f. 651.537.4675 | www.imation.com/nexsan© Imation Corp. Nexsan, the Nexsan logo, E-Series, FASTier, E-Centre and NestOS are trademarks of Imation Corp. All other trademarks are property of their respective owners. (Rev. 10/02/13)
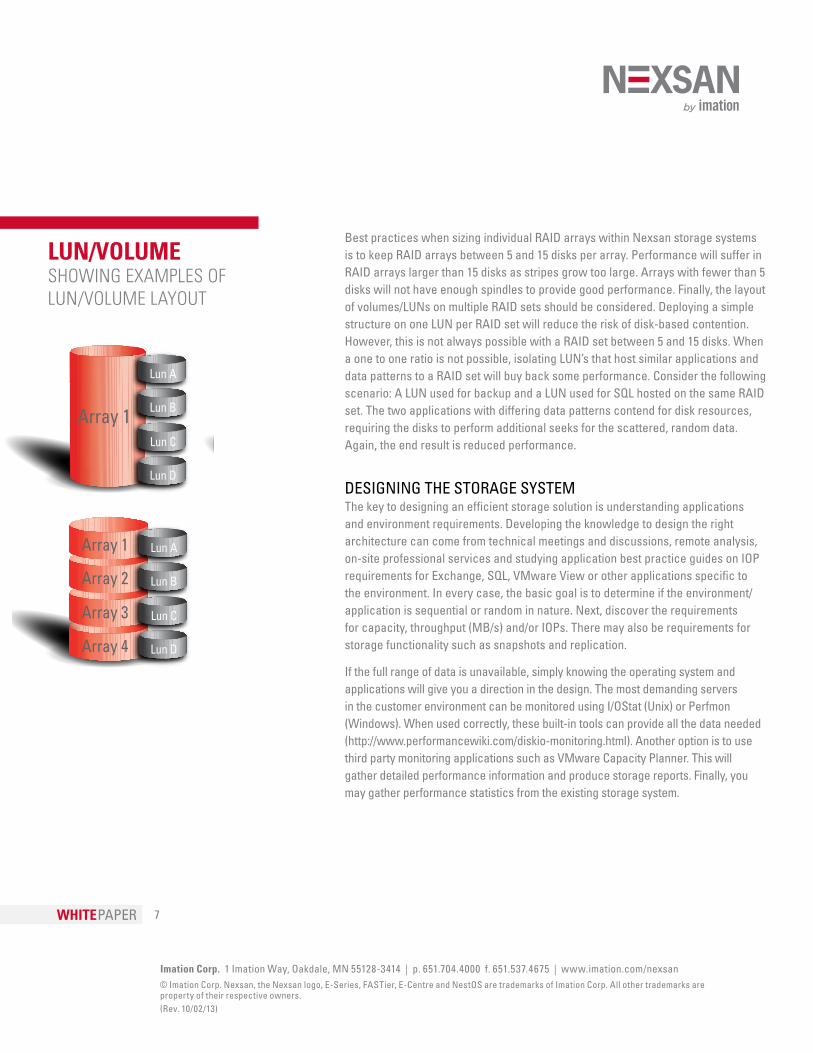
Best practices when sizing individual RAID arrays within Nexsan storage systems is to keep RAID arrays between 5 and 15 disks per array. Performance will suffer in RAID arrays larger than 15 disks as stripes grow too large. Arrays with fewer than 5 disks will not have enough spindles to provide good performance. Finally, the layout of volumes/LUNs on multiple RAID sets should be considered. Deploying a simple structure on one LUN per RAID set will reduce the risk of disk-based contention. However, this is not always possible with a RAID set between 5 and 15 disks. When a one to one ratio is not possible, isolating LUN’s that host similar applications and data patterns to a RAID set will buy back some performance. Consider the following scenario: A LUN used for backup and a LUN used for SQL hosted on the same RAID set. The two applications with differing data patterns contend for disk resources, requiring the disks to perform additional seeks for the scattered, random data. Again, the end result is reduced performance.
DESIGNING THE STORAGE SYSTEMThe key to designing an efficient storage solution is understanding applications and environment requirements. Developing the knowledge to design the right architecture can come from technical meetings and discussions, remote analysis, on-site professional services and studying application best practice guides on IOP requirements for Exchange, SQL, VMware View or other applications specific to the environment. In every case, the basic goal is to determine if the environment/application is sequential or random in nature. Next, discover the requirements for capacity, throughput (MB/s) and/or IOPs. There may also be requirements for storage functionality such as snapshots and replication.
If the full range of data is unavailable, simply knowing the operating system and applications will give you a direction in the design. The most demanding servers in the customer environment can be monitored using I/OStat (Unix) or Perfmon (Windows). When used correctly, these built-in tools can provide all the data needed (http://www.performancewiki.com/diskio-monitoring.html). Another option is to use third party monitoring applications such as VMware Capacity Planner. This will gather detailed performance information and produce storage reports. Finally, you may gather performance statistics from the existing storage system.
Array 1
Lun D Array 4
Array 3
Array 2
Array 1
Lun D
Lun C Lun C
Lun B Lun B
Lun A Lun A
Array 1
Lun D Array 4
Array 3
Array 2
Array 1
Lun D
Lun C Lun C
Lun B Lun B
Lun A Lun A
LUN/VOLUMESHOWING EXAMPLES OF LUN/VOLUME LAYOUT

WHITEPAPER 8
Imation Corp. 1 Imation Way, Oakdale, MN 55128-3414 | p. 651.704.4000 f. 651.537.4675 | www.imation.com/nexsan© Imation Corp. Nexsan, the Nexsan logo, E-Series, FASTier, E-Centre and NestOS are trademarks of Imation Corp. All other trademarks are property of their respective owners. (Rev. 10/02/13)
MB/s cumulative throughput over all RAID sets (per fully populated system)
Dual controller E18 SATA (FC connected)
Raid5 Read 1.8GB/s
Raid5 Write 450MB/s
Dual controller E48 SATA (FC connected)
Raid5 Read 2.3GB/s
Raid5 Write 800MB/s
Dual controller E60 SATA (FC connected)
Raid5 Read 2.4GB/s
Raid5 Write 900MB/s
All this data offers a starting point for designing the storage solution. In a random I/0 environment, you will want to balance IOPs and capacity. In a sequential environment, the design will focus on capacity and throughput or MB/s. It is worth noting that sequential storage systems are much easier to configure as the MB/s almost always exceed the requirements. Here are some general rules to help in the design (figures offer an approximate range):
CONCLUSION The pace at which server and storage technology is advancing, particularly in the area of virtualization, has left large gaps in knowledge among general IT departments. This has lead to poorly designed architectures resulting in performance challenges. Well-educated, experienced and technically competent storage resellers have a great opportunity to help these IT departments through professional analysis, systems design, installation services and training. A quality reseller can help future-proof the customer against growing data and performance hungry databases and server virtualization technology. To speak with a Nexsan solutions expert or to speak with an authorized Imation reseller nearest you, call us at 866.4.NEXSAN.
Average sustained random IOPs (per disk)
SATA 7.2 rpm 90 random read IOPs
SAS 15k rpm 190 random read IOPs
SSD 2500 random read IOPs
Example of network design for host connection types
Inter-connect
Type
Port Speed
Max theoreti-cal IOPs
Max theoreti-cal MB/s
FC 2GBit 65,000 180
FC 4GBit 100,000 360
FC 8GBit 130,000 720
iSCSI 1GBit 12,000 80
iSCSI 10GBit 80,000 530