stop and search iag north warwickshire q4 2015 16 filethis report provides data on stop & search...
TRANSCRIPT
Stop and Search IAG Report
Alliance & North Warwickshire Policing Area
2015/2016 Quarter 4
1st April – 31st March
Stop and Search IAG - Alliance 2015/16
1
This report provides data on Stop & Search encounters conducted by Warwickshire Police and West Mercia Police (The Alliance)
from the 1st
April 2015 to the 31st
March 2016. The report provides an overview of the Stop & Search encounters conducted by the
Alliance with a focus on Stop & search encounters conducted in the South Warwickshire Policing Area.
Stop & Search encounters for the Alliance policing area
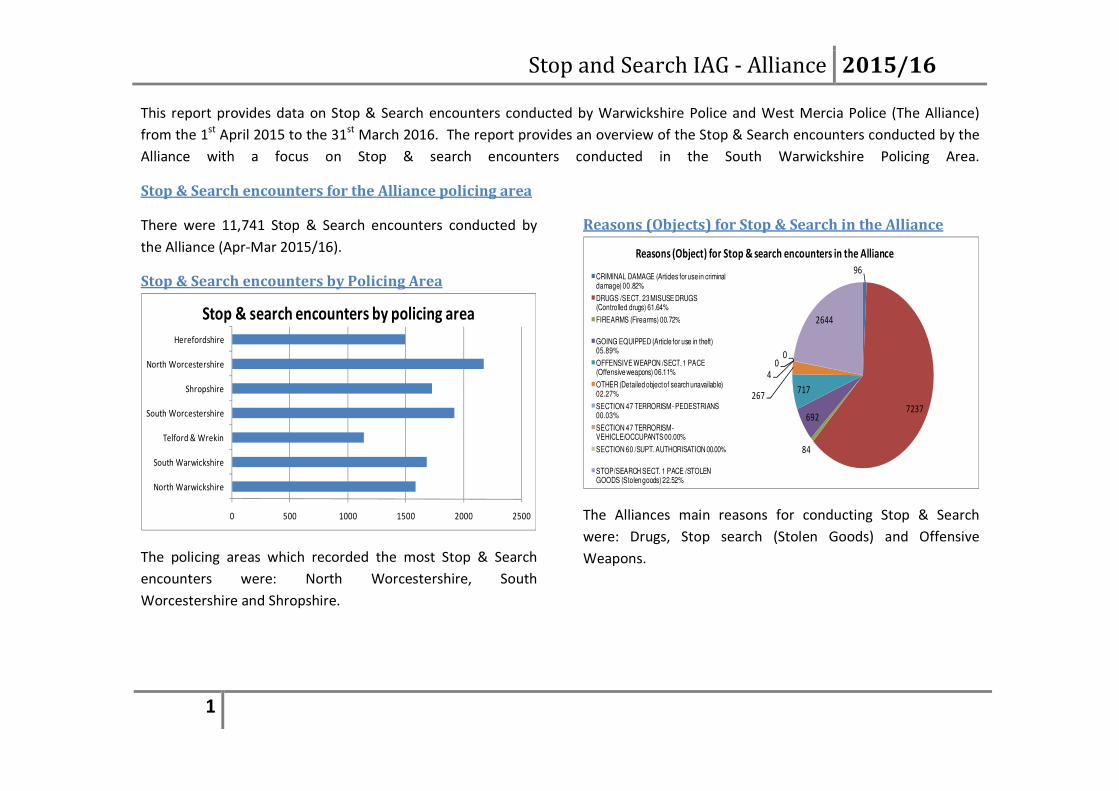
There were 11,741 Stop & Search encounters conducted by
the Alliance (Apr-Mar 2015/16).
Stop & Search encounters by Policing Area
0 500 1000 1500 2000 2500
North Warwickshire
South Warwickshire
Telford & Wrekin
South Worcestershire
Shropshire
North Worcestershire
Herefordshire
Stop & search encounters by policing area
The policing areas which recorded the most Stop & Search
encounters were: North Worcestershire, South
Worcestershire and Shropshire.
Reasons (Objects) for Stop & Search in the Alliance
96
7237
84
692
717267
40
0
2644
Reasons (Object) for Stop & search encounters in the Alliance
CRIMINAL DAMAGE (Articles for use in criminal damage) 00.82%
DRUGS /SECT. 23 MISUSE DRUGS (Controlled drugs) 61.64%
FIREARMS (Firearms) 00.72%
GOING EQUIPPED (Article for use in theft) 05.89%
OFFENSIVE WEAPON /SECT. 1 PACE (Offensive weapons) 06.11%
OTHER (Detailed object of search unavailable) 02.27%
SECTION 47 TERRORISM - PEDESTRIANS 00.03%
SECTION 47 TERRORISM -VEHICLE/OCCUPANTS 00.00%
SECTION 60 /SUPT. AUTHORISATION 00.00%
STOP/SEARCH SECT. 1 PACE /STOLEN GOODS (Stolen goods) 22.52%
The Alliances main reasons for conducting Stop & Search
were: Drugs, Stop search (Stolen Goods) and Offensive
Weapons.
Stop and Search IAG - Alliance 2015/16
2 *Index value is a ratio of the Percentage of stop search encounters divided by Percentage population (census)
**Disproportionality a ratio of Stop & search encounters per 1000 pop divided by the White Stop & search encounters per 1000 pop
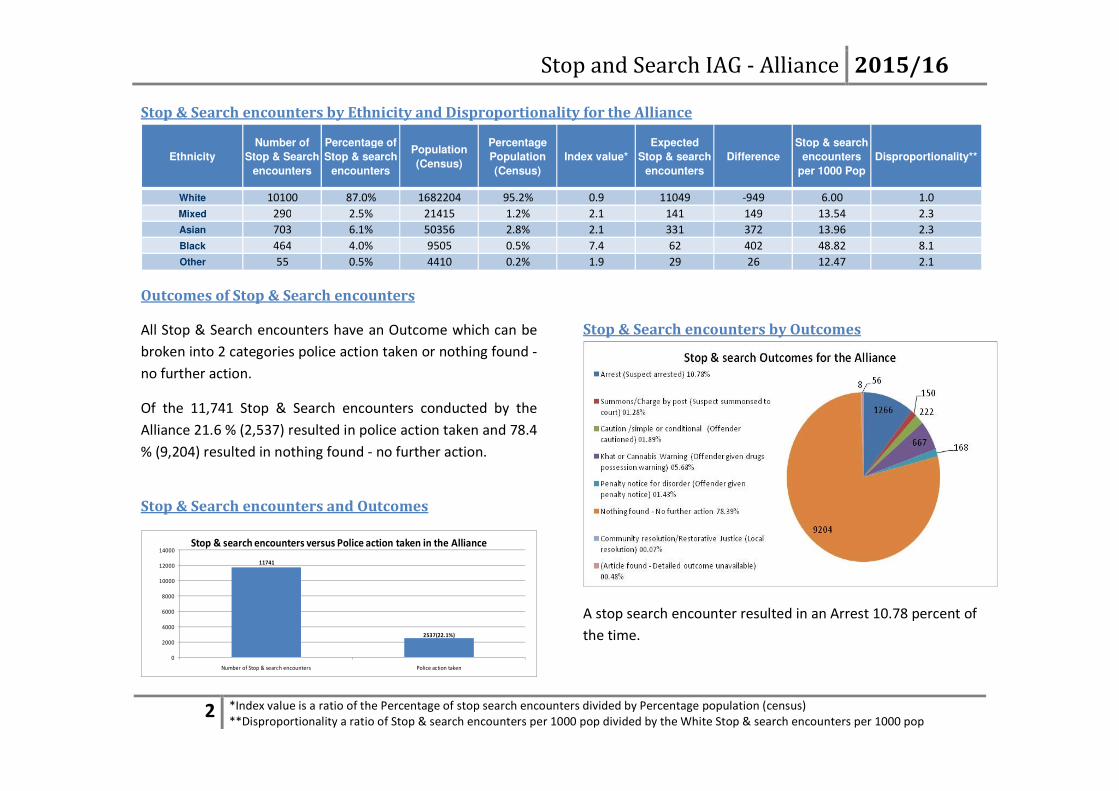
Stop & Search encounters by Ethnicity and Disproportionality for the Alliance
Ethnicity
Number of
Stop & Search
encounters
Percentage of
Stop & search
encounters
Population
(Census)
Percentage
Population
(Census)
Index value*
Expected
Stop & search
encounters
Difference
Stop & search
encounters
per 1000 Pop
Disproportionality**
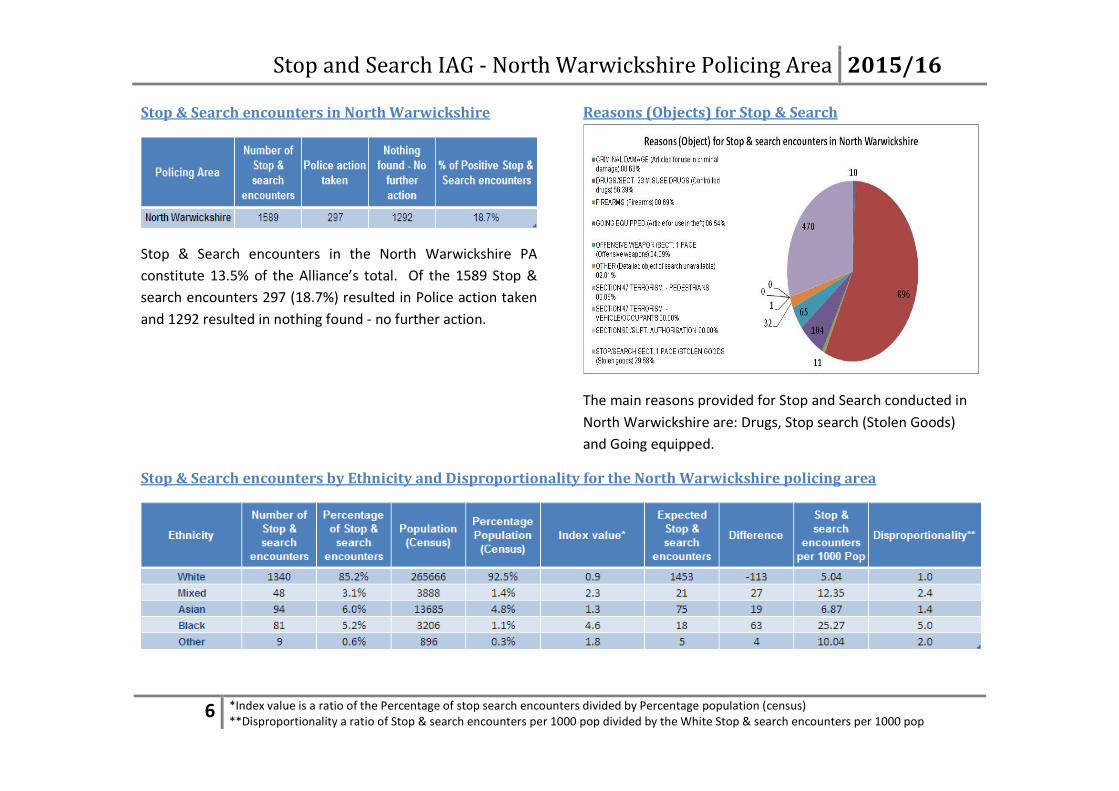
White 10100 87.0% 1682204 95.2% 0.9 11049 -949 6.00 1.0
Mixed 290 2.5% 21415 1.2% 2.1 141 149 13.54 2.3
Asian 703 6.1% 50356 2.8% 2.1 331 372 13.96 2.3
Black 464 4.0% 9505 0.5% 7.4 62 402 48.82 8.1
Other 55 0.5% 4410 0.2% 1.9 29 26 12.47 2.1
Outcomes of Stop & Search encounters
All Stop & Search encounters have an Outcome which can be
broken into 2 categories police action taken or nothing found -
no further action.
Of the 11,741 Stop & Search encounters conducted by the
Alliance 21.6 % (2,537) resulted in police action taken and 78.4
% (9,204) resulted in nothing found - no further action.
Stop & Search encounters and Outcomes
11741
2537(22.1%)
0
2000
4000
6000
8000
10000
12000
14000
Number of Stop & search encounters Police action taken
Stop & search encounters versus Police action taken in the Alliance
Stop & Search encounters by Outcomes
A stop search encounter resulted in an Arrest 10.78 percent of
the time.
Stop and Search IAG - Alliance 2015/16
3
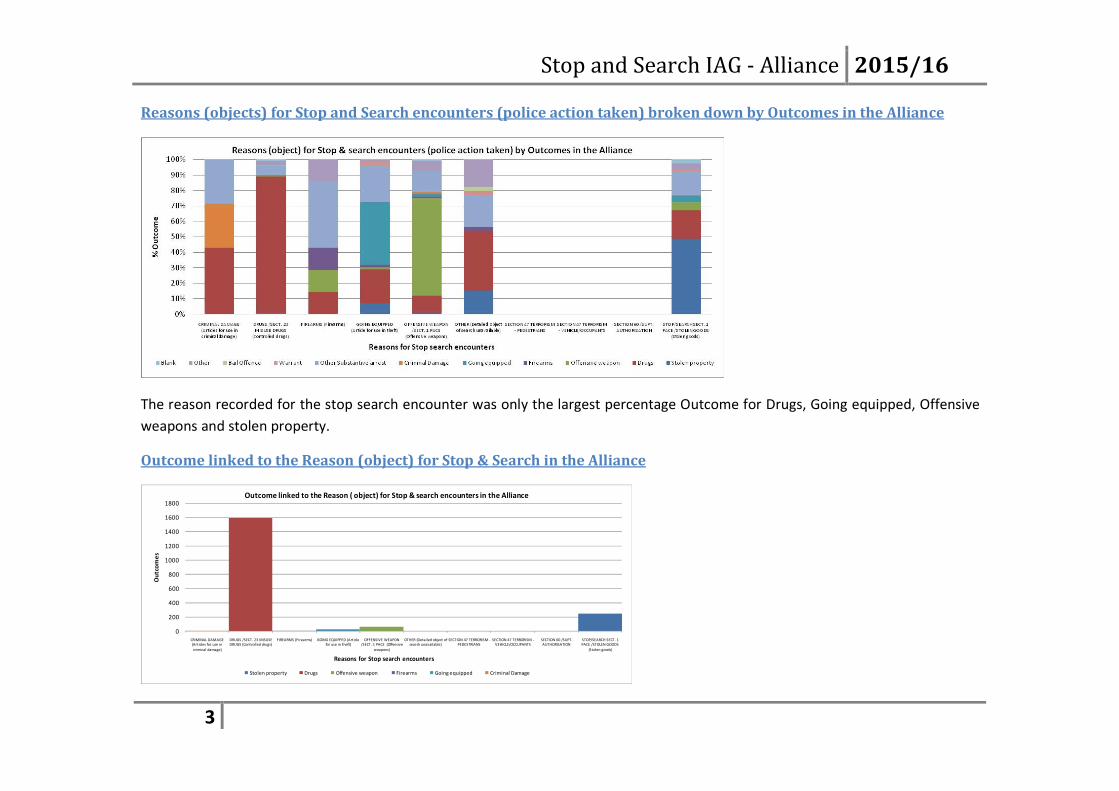
Reasons (objects) for Stop and Search encounters (police action taken) broken down by Outcomes in the Alliance
The reason recorded for the stop search encounter was only the largest percentage Outcome for Drugs, Going equipped, Offensive
weapons and stolen property.
Outcome linked to the Reason (object) for Stop & Search in the Alliance
0
200
400
600
800
1000
1200
1400
1600
1800
CRIMINAL DAMAGE (Articles for use in
criminal damage)
DRUGS /SECT. 23 MISUSE DRUGS (Controlled drugs)
FIREARMS (Firearms) GOING EQUIPPED (Article for use in theft)
OFFENSIVE WEAPON /SECT. 1 PACE (Offensive
weapons)
OTHER (Detailed object of search unavailable)
SECTION 47 TERRORISM -PEDESTRIANS
SECTION 47 TERRORISM -VEHICLE/OCCUPANTS
SECTION 60 /SUPT. AUTHORISATION
STOP/SEARCH SECT. 1 PACE /STOLEN GOODS
(Stolen goods)
Ou
tco
me
s
Reasons for Stop search encounters
Outcome linked to the Reason ( object) for Stop & search encounters in the Alliance
Stolen property Drugs Offensive weapon Firearms Going equipped Criminal Damage
Stop and Search IAG - Alliance 2015/16
4
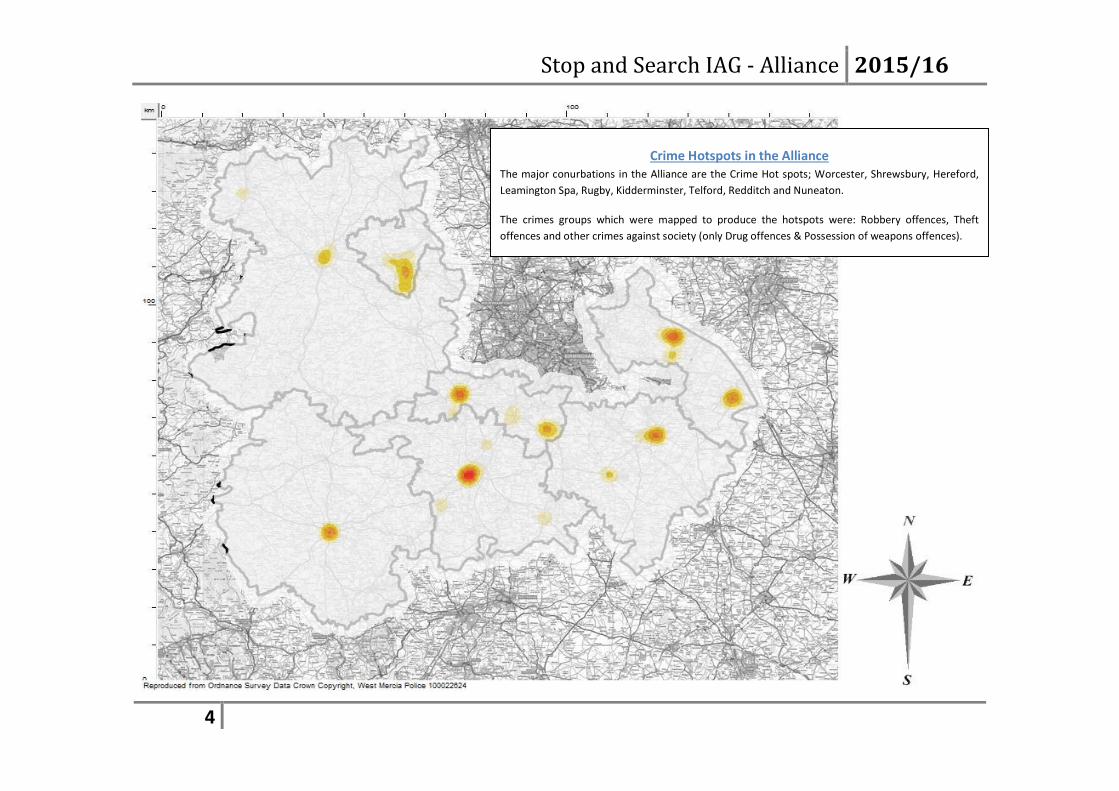
Crime Hotspots in the Alliance
The major conurbations in the Alliance are the Crime Hot spots; Worcester, Shrewsbury, Hereford,
Leamington Spa, Rugby, Kidderminster, Telford, Redditch and Nuneaton.
The crimes groups which were mapped to produce the hotspots were: Robbery offences, Theft
offences and other crimes against society (only Drug offences & Possession of weapons offences).

Stop and Search IAG - Alliance 2015/16
5
Stop & Search encounters conducted in the Alliance
12.2% (1277) of Stop & Search encounters are not mapped due to incorrect or no
mapping co-ordinates being entered.
Stop and Search IAG - North Warwickshire Policing Area 2015/16
6 *Index value is a ratio of the Percentage of stop search encounters divided by Percentage population (census)
**Disproportionality a ratio of Stop & search encounters per 1000 pop divided by the White Stop & search encounters per 1000 pop
Stop & Search encounters in North Warwickshire
Stop & Search encounters in the North Warwickshire PA
constitute 13.5% of the Alliance’s total. Of the 1589 Stop &
search encounters 297 (18.7%) resulted in Police action taken
and 1292 resulted in nothing found - no further action.
Reasons (Objects) for Stop & Search
The main reasons provided for Stop and Search conducted in
North Warwickshire are: Drugs, Stop search (Stolen Goods)
and Going equipped.
Stop & Search encounters by Ethnicity and Disproportionality for the North Warwickshire policing area
Stop and Search IAG - North Warwickshire Policing Area 2015/16
7
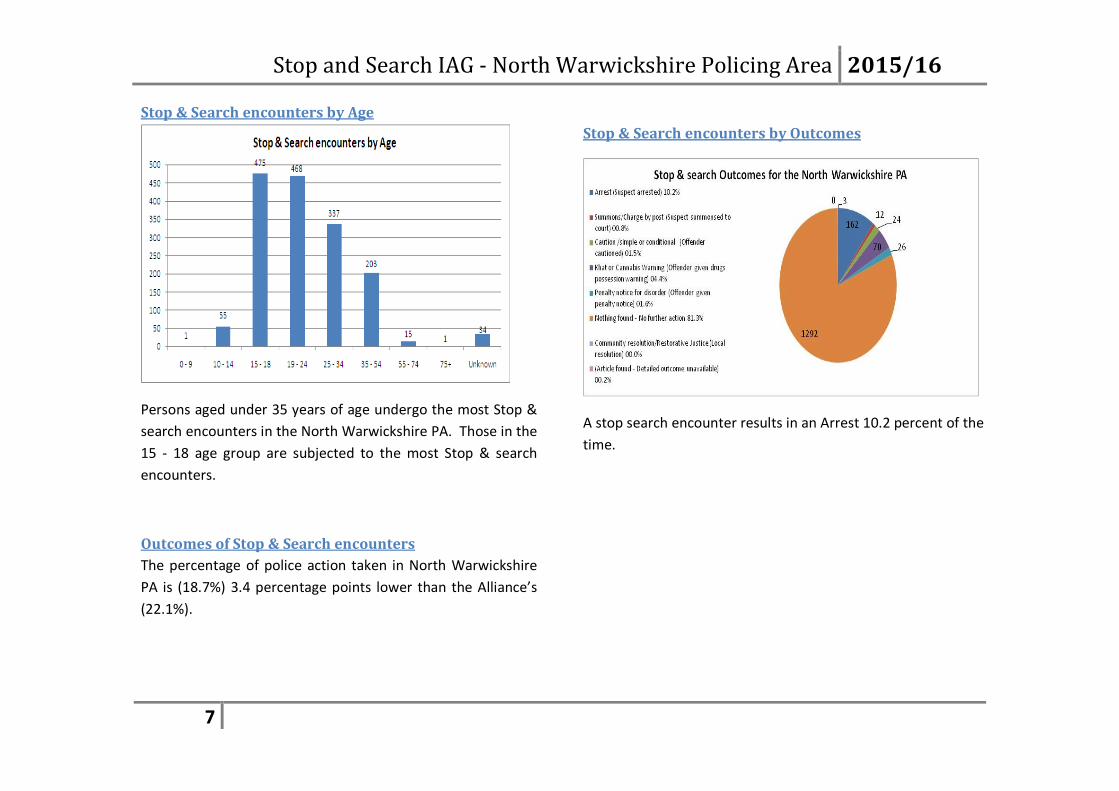
Stop & Search encounters by Age
Persons aged under 35 years of age undergo the most Stop &
search encounters in the North Warwickshire PA. Those in the
15 - 18 age group are subjected to the most Stop & search
encounters.
Outcomes of Stop & Search encounters
The percentage of police action taken in North Warwickshire
PA is (18.7%) 3.4 percentage points lower than the Alliance’s
(22.1%).
Stop & Search encounters by Outcomes
A stop search encounter results in an Arrest 10.2 percent of the
time.
Stop and Search IAG - North Warwickshire Policing Area 2015/16
8 *Index value is a ratio of the Percentage of stop search encounters divided by Percentage population (census)
**Disproportionality a ratio of Stop & search encounters per 1000 pop divided by the White Stop & search encounters per 1000 pop
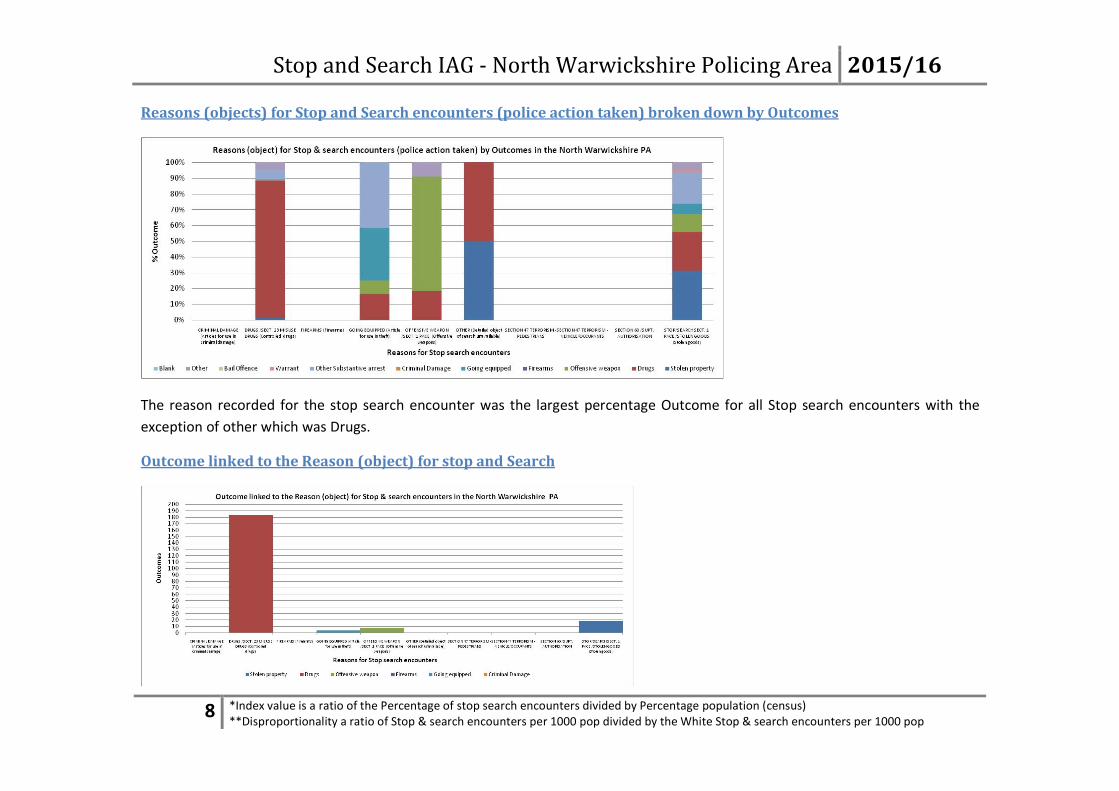
Reasons (objects) for Stop and Search encounters (police action taken) broken down by Outcomes
The reason recorded for the stop search encounter was the largest percentage Outcome for all Stop search encounters with the
exception of other which was Drugs.
Outcome linked to the Reason (object) for stop and Search
Stop and Search IAG - Alliance 2015/16
9
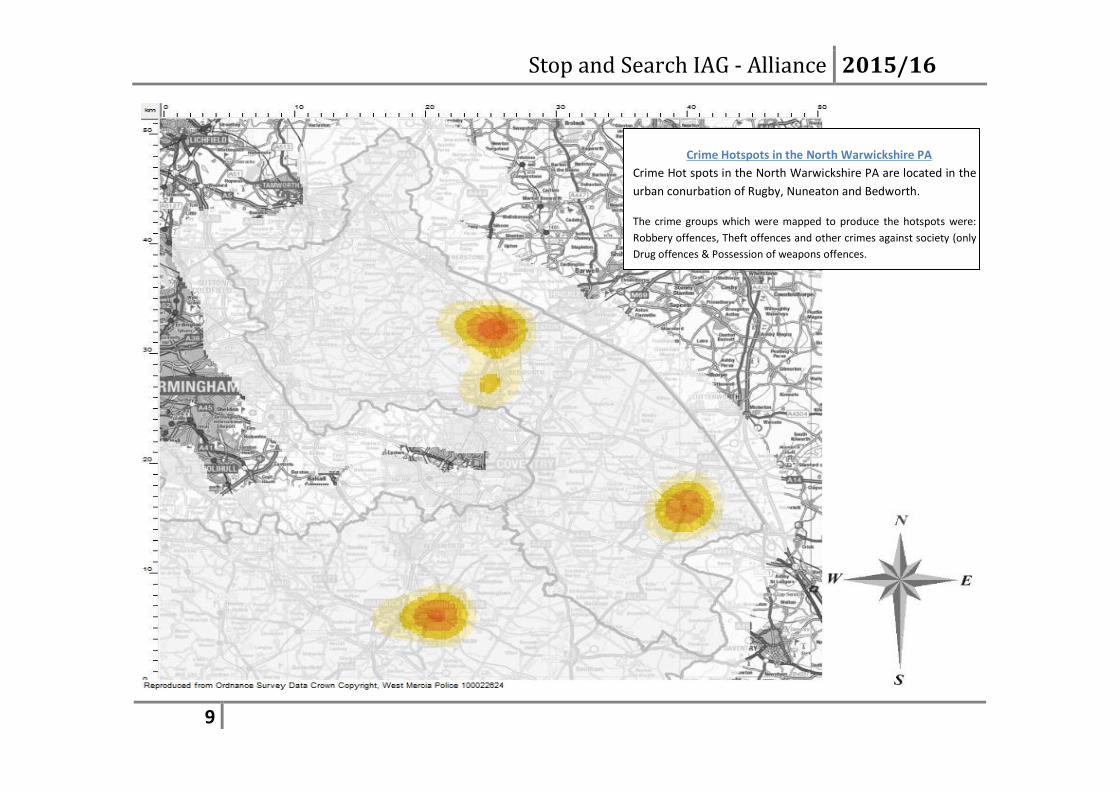
Crime Hotspots in the North Warwickshire PA
Crime Hot spots in the North Warwickshire PA are located in the
urban conurbation of Rugby, Nuneaton and Bedworth.
The crime groups which were mapped to produce the hotspots were:
Robbery offences, Theft offences and other crimes against society (only
Drug offences & Possession of weapons offences.
Stop and Search IAG - Alliance 2015/16
10
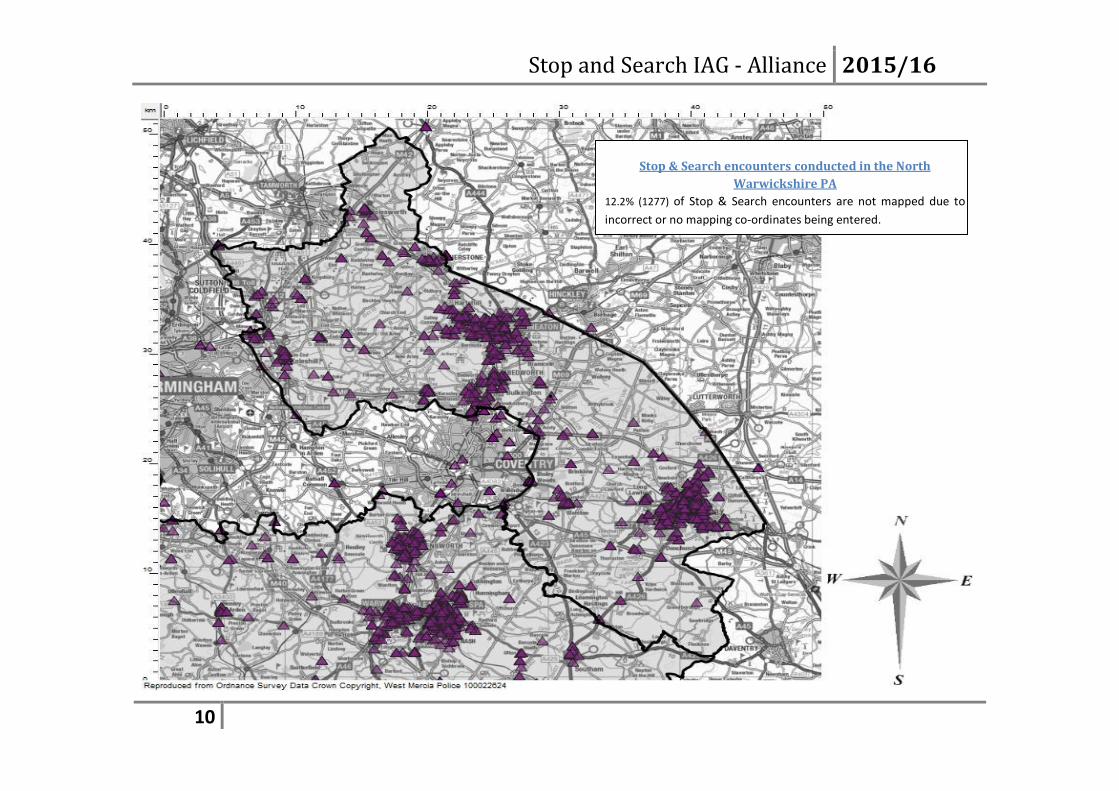
Stop & Search encounters conducted in the North
Warwickshire PA
12.2% (1277) of Stop & Search encounters are not mapped due to
incorrect or no mapping co-ordinates being entered.
Stop and Search IAG - Alliance 2015/16
11
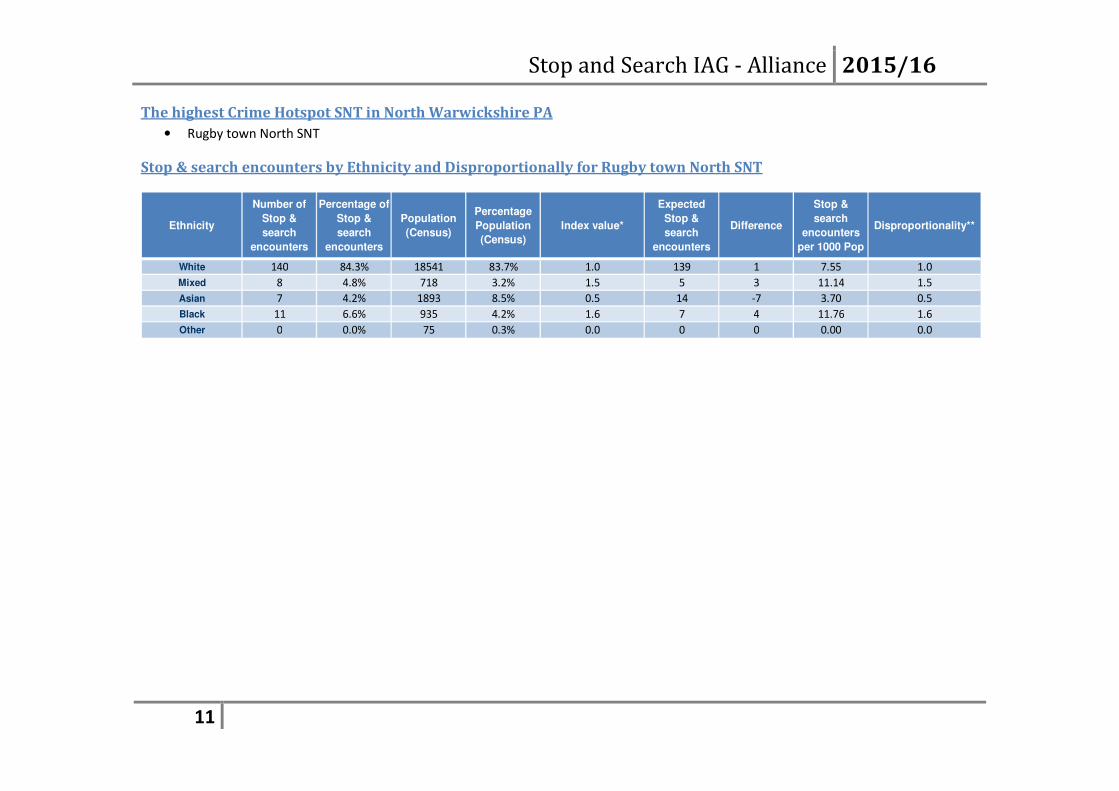
The highest Crime Hotspot SNT in North Warwickshire PA
• Rugby town North SNT
Stop & search encounters by Ethnicity and Disproportionally for Rugby town North SNT
Ethnicity
Number of
Stop &
search
encounters
Percentage of
Stop &
search
encounters
Population
(Census)
Percentage
Population
(Census)
Index value*
Expected
Stop &
search
encounters
Difference
Stop &
search
encounters
per 1000 Pop
Disproportionality**
White 140 84.3% 18541 83.7% 1.0 139 1 7.55 1.0
Mixed 8 4.8% 718 3.2% 1.5 5 3 11.14 1.5
Asian 7 4.2% 1893 8.5% 0.5 14 -7 3.70 0.5
Black 11 6.6% 935 4.2% 1.6 7 4 11.76 1.6
Other 0 0.0% 75 0.3% 0.0 0 0 0.00 0.0