stone degradation using limestone as indicator. deterioration of stone materials chemical weathering...
TRANSCRIPT
Stone degradationusing limestone as indicator
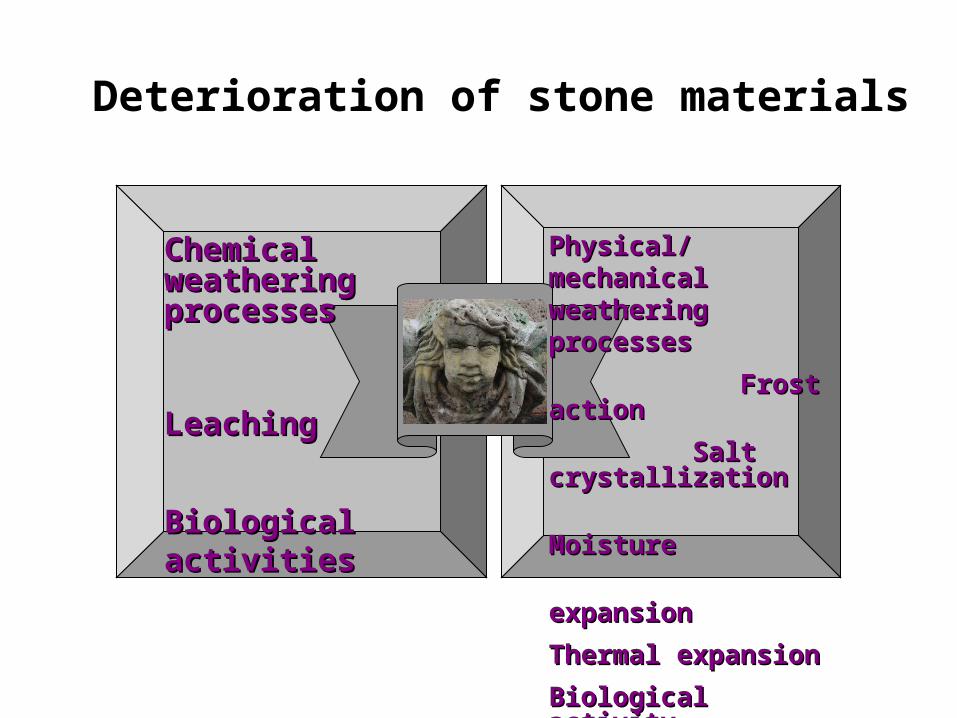
Deterioration of stone materials
Chemical Chemical weathering weathering processesprocesses
LeachingLeaching
Chemical Chemical reactionsreactions
Biological Biological activitiesactivities
Physical/Physical/mechanical mechanical weathering weathering processesprocesses
Frost Frost actionaction
Salt Salt crystallizationcrystallization
MoistureMoisture
expansionexpansion
Thermal Thermal expansionexpansion
Biological activityBiological activity

General deterioration forms
unsheltered unsheltered conditionsconditions
1st stage - black 1st stage - black crustscrusts
2nd stage - loss of 2nd stage - loss of materialmaterial
sheltered sheltered conditionsconditions

St. Paul’s Cathedral, London
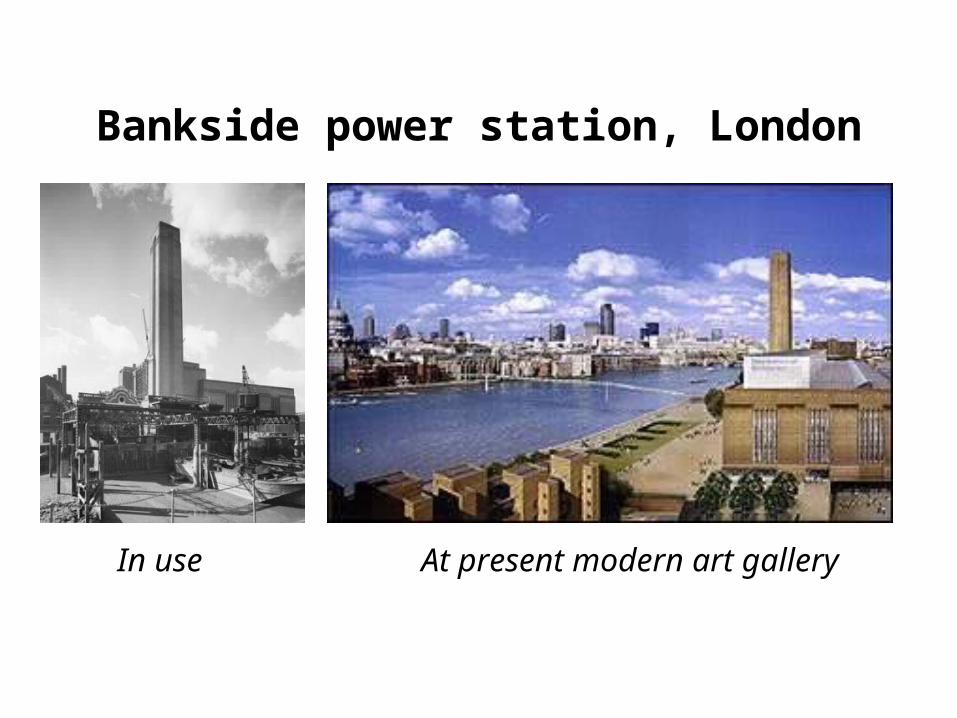
Bankside power station, London
In use At present modern art gallery
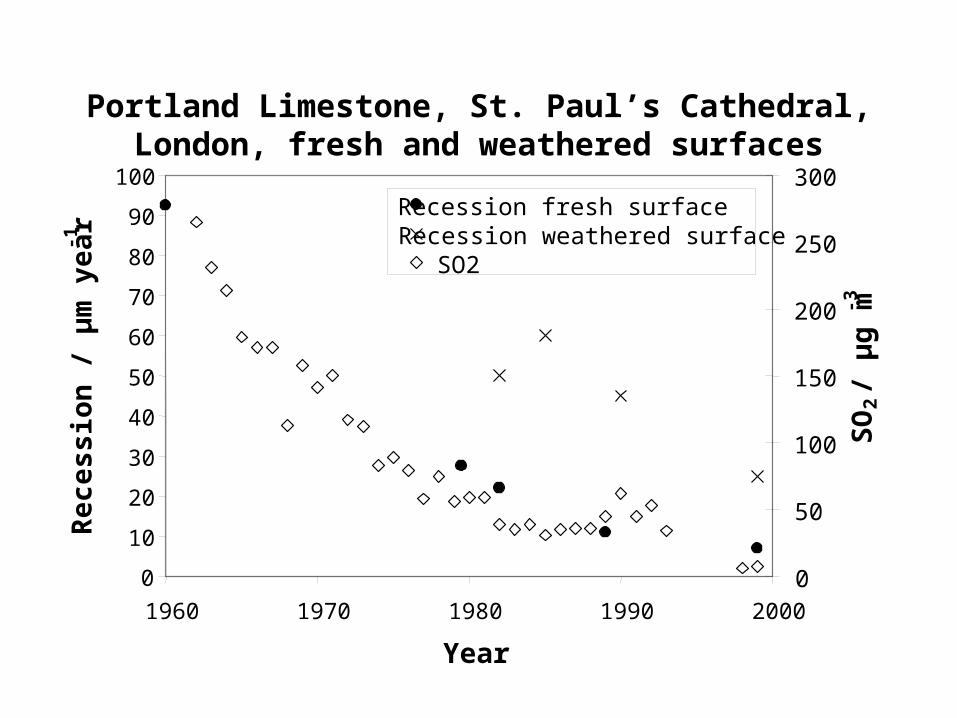
Portland Limestone, St. Paul’s Cathedral, London, fresh and weathered surfaces
0
10
20
30
40
50
60
70
80
90
100
1960 1970 1980 1990 2000
Year
Rec
essi
on
/ µ
m y
ear-1
0
50
100
150
200
250
300
SO
2 /
µg
m-3
Recession fresh surfaceRecession weathered surfaceSO2
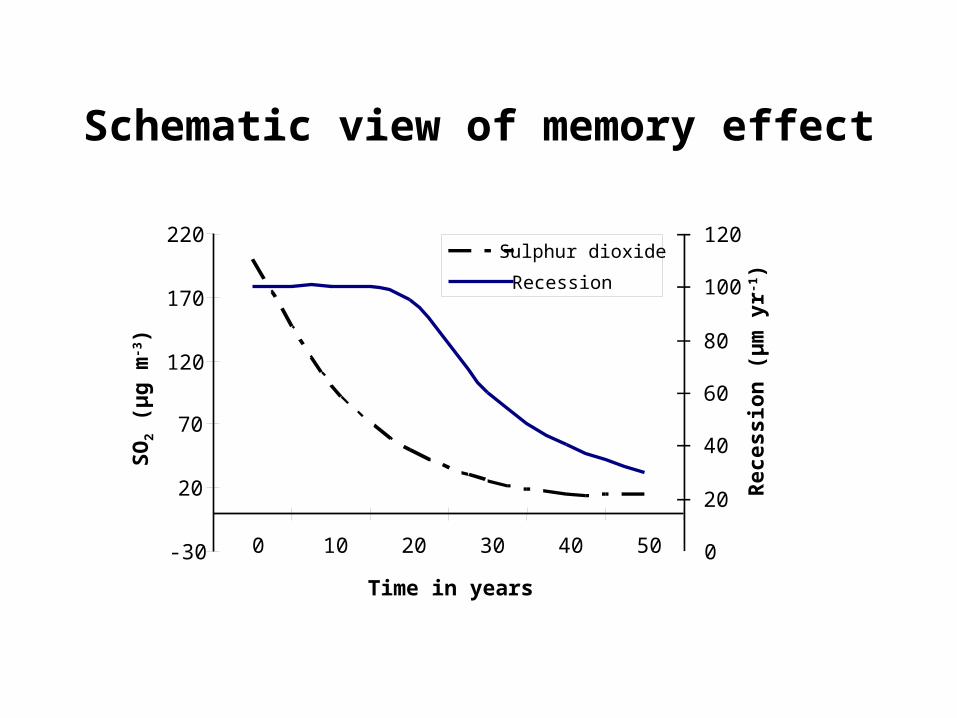
Schematic view of memory effect
-30
20
70
120
170
220
0 10 20 30 40 50
Time in years
SO
2 (µ
g m
-3)
0
20
40
60
80
100
120
Rec
essi
on
(µ
m y
r-1)
Sulphur dioxide
Recession
The multi-pollutant programme
• ICP Materials exposure 1997 - 2001
• EU 5FP project MULTI-ASSESS incl. HNO3 and particles 2002 - 2003
• Comparative exposure of different calcareous stone materials
• Assessment of threshold levels for pollution, deterioration and soiling
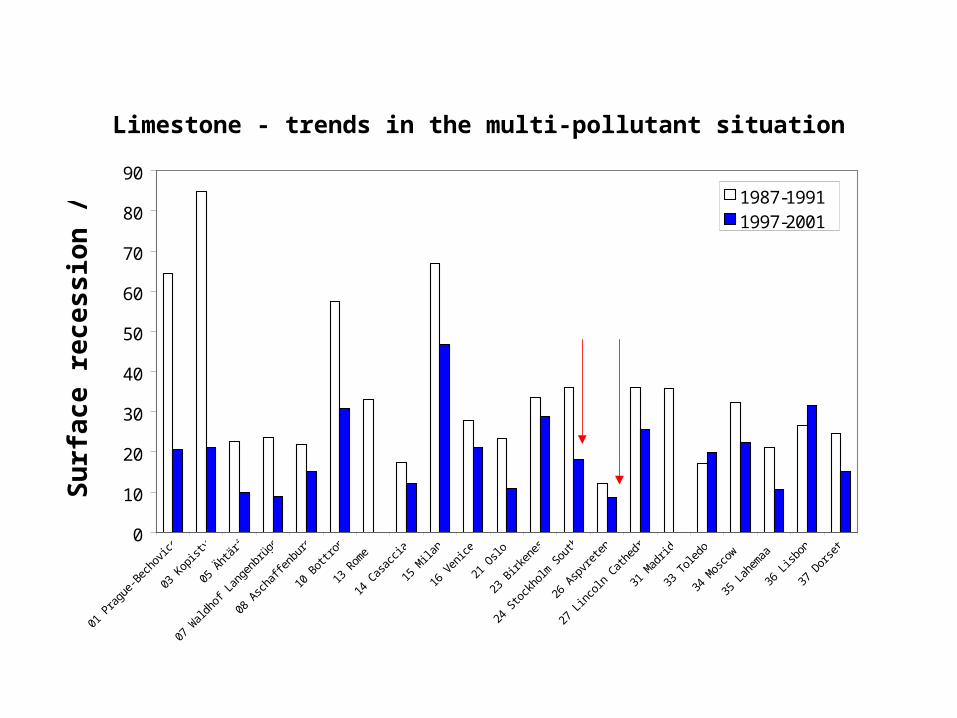
Limestone - trends in the multi-pollutant situation
0
10
20
30
40
50
60
70
80
90
01 P
ragu
e-Bec
hovic
e
03 K
opist
y
05 Ä
htär
i
07 W
aldho
f Lan
genb
rüge
08 A
scha
ffenb
urg
10 B
ottro
p
13 R
ome
14 C
asac
cia
15 M
ilan
16 V
enice
21 O
slo
23 B
irken
es
24 S
tock
holm
Sou
th
26 A
spvr
eten
27 L
incoln
Cat
hedr
al
31 M
adrid
33 To
ledo
34 M
osco
w
35 L
ahem
aa
36 L
isbon
37 D
orse
t
Su
rfa
ce
re
ce
ss
ion
/ µ
m
1987-19911997-2001
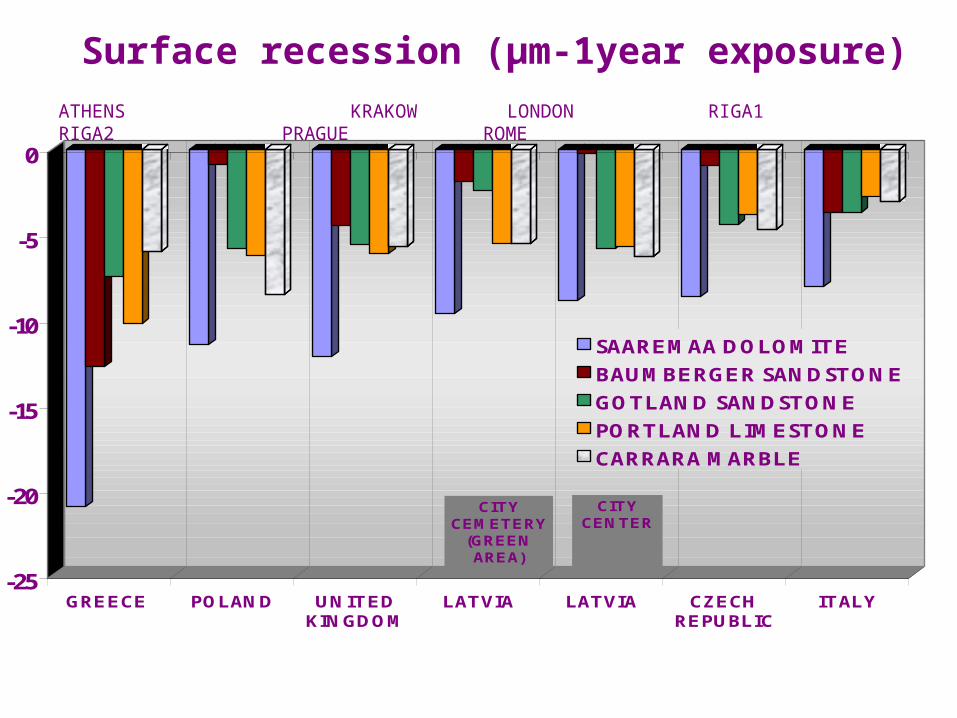
Surface recession (µm-1year exposure)
-25
-20
-15
-10
-5
0
GREECE POLAND UNITEDKINGDOM
LATVIA LATVIA CZECHREPUBLIC
ITALY
SAAREMAA DOLOMITE
BAUMBERGER SANDSTONE
GOTLAND SANDSTONE
PORTLAND LIMESTONE
CARRARA MARBLE
CITY CEMETERY
(GREEN AREA)
CITY CENTER
ATHENS KRAKOW LONDON RIGA1 RIGA2 PRAGUE ROME

Background to Portland Limestone
• The quarries are located on the Isle of Portland in Dorset, England.
• The tablets have been used in all recent UNECE, EU and SIDA programmes
• Portland has been quarried since the Roman period but became popular in the 17th century when Inigo Jones and Sir Christopher Wren used it in many buildings including St.Paul's Cathedral, London. Portland has remained popular with architects and builders because of its fine grain and good durability, and because it weathers very evenly.

Now the demonstration…
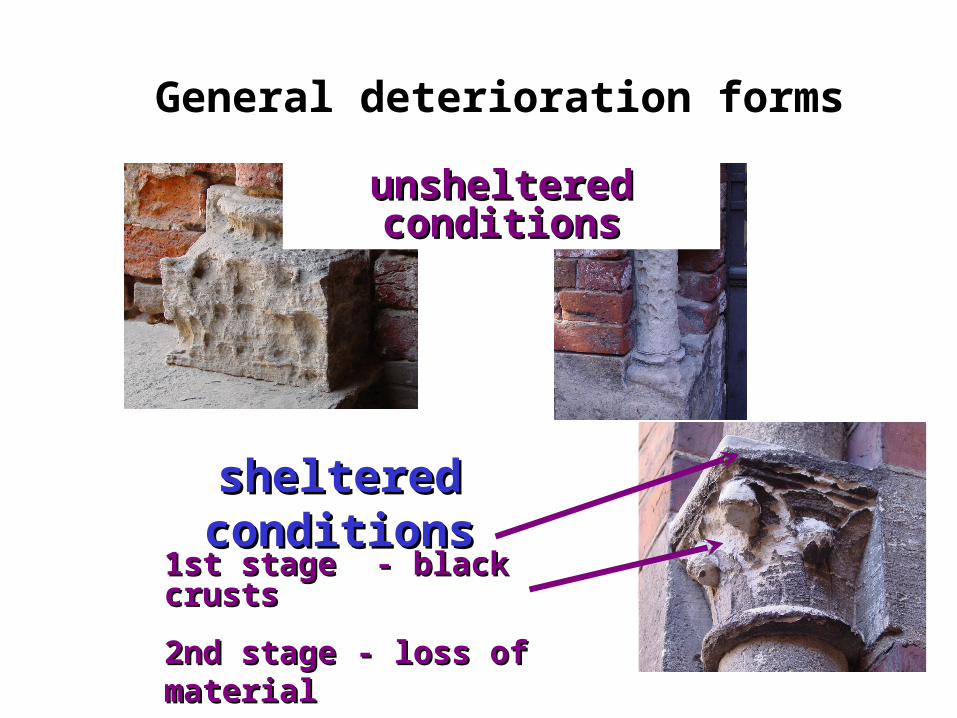
General deterioration forms
unsheltered unsheltered conditionsconditions
1st stage - black 1st stage - black crustscrusts
2nd stage - loss of 2nd stage - loss of materialmaterial
sheltered sheltered conditionsconditions
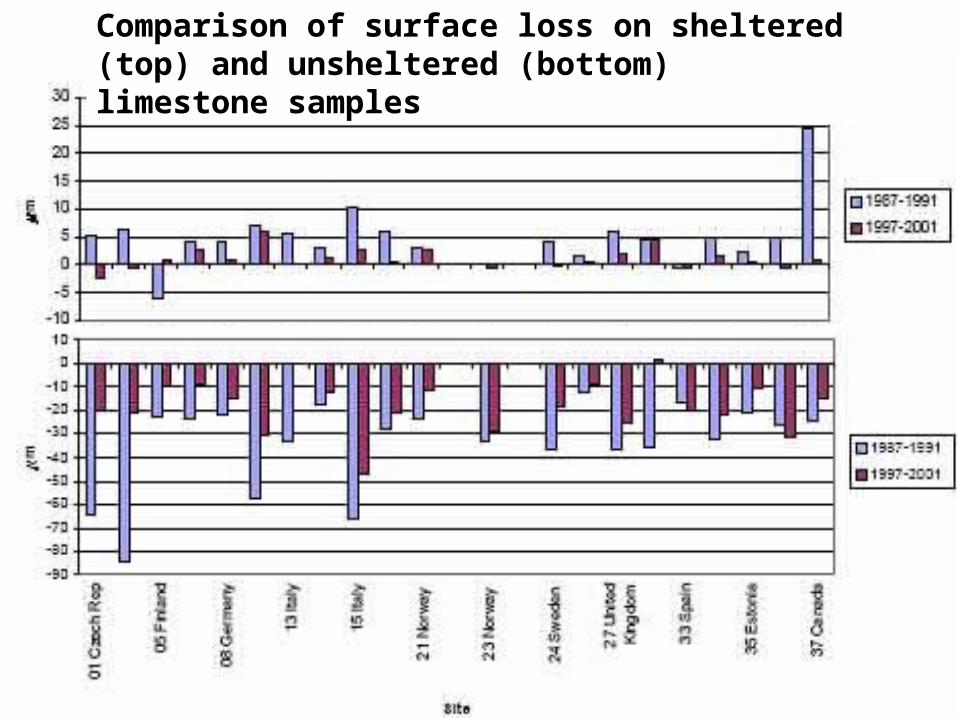
Comparison of surface loss on sheltered (top) and unsheltered (bottom) limestone samples
Exposure in sheltered position
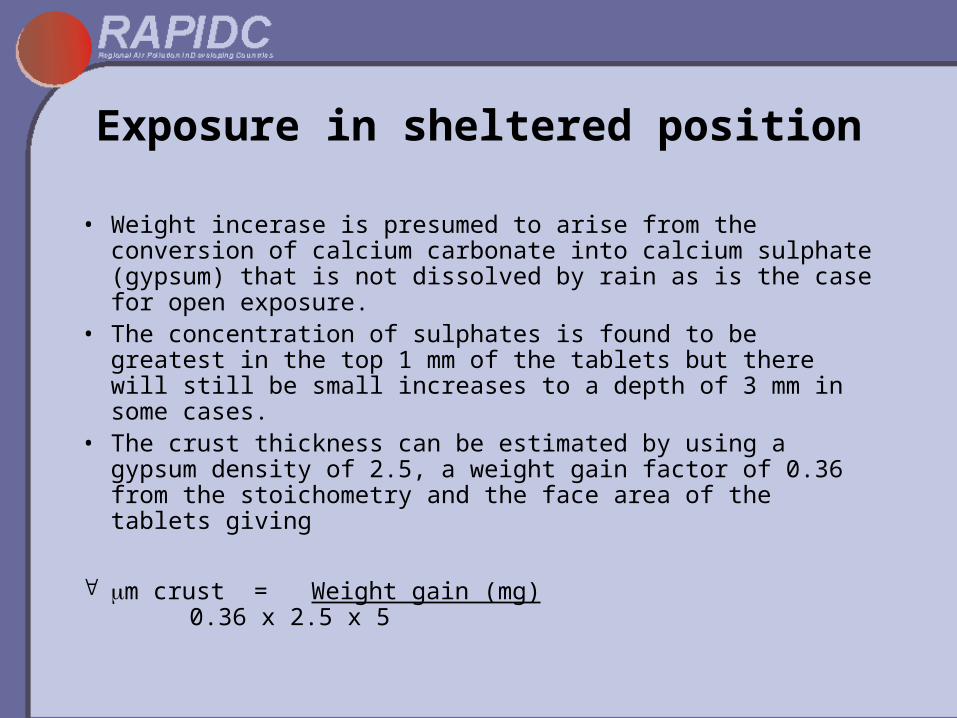
• Weight incerase is presumed to arise from the conversion of calcium carbonate into calcium sulphate (gypsum) that is not dissolved by rain as is the case for open exposure.
• The concentration of sulphates is found to be greatest in the top 1 mm of the tablets but there will still be small increases to a depth of 3 mm in some cases.
• The crust thickness can be estimated by using a gypsum density of 2.5, a weight gain factor of 0.36 from the stoichometry and the face area of the tablets giving
m crust = Weight gain (mg)0.36 x 2.5 x 5
The distribution of soluble material
• A powder sample is obtained by drilling at four places on a 50 x 50 mm surface. Samples are obtained initially at 1 mm depth from the surface at 2 diagonally opposed locations on the tablet.
•
• The concentrations of the major cations (Na+, K+, Ca2+ Mg2+ ) and anions (Cl-, NO3
- SO42-) are obtained by de-ionised water
extraction (20 ml for 30 minutes) and measured by ion chromatography or some other appropriate method.