stockreport fdx spring2014 - carson college of business · 2" " investmentthesis&...
TRANSCRIPT

1
Date: 2-‐22-‐2014
Analyst Name: Ian McCauley & Taylor Yotz
CIF Stock Recommendation Report (Spring 2014)
Company Name and Ticker: FedEx Corp. (FDX)
Section (A) Investment Summary
Recommendation Buy: Yes No Target Price: $145
Stop-‐Loss Price: $115
Sector: Industrial
Industry: Integrated Shipping & Logistics
Market Cap (in Billions): $41.01 Billion
# of Shrs. O/S (in Millions): 3.16 Million
Current Price: $131.35
52 WK Hi: $144.39
52 WK Low: $90.61
EBO Valuation: $82.09
Morningstar (MS) Fair Value Est.: $137.00
MS FV Uncertainty: Medium
MS Consider Buying: $95.90
MS Consider Selling: $184.95
EPS (TTM): 5.23
EPS (FY1): $6.99 (May 2014)
EPS (FY2): $8.94 (May 2015)
MS Star Rating: 3 Stars
Next Fiscal Yr. End ”Year”: “Month”: 2014, May (05)
Last Fiscal Qtr. End: Less Than 8 WK: Y N
If Less Than 8 WK, next Earnings Ann. Date: N/A
Analyst Consensus Recommendation: 2.10 -‐ Outperform
Forward P/E: 14.06
Mean LT Growth: 15.21
PEG: 0.8
Beta: 1.45
% Inst. Ownership: 80.48%
Inst. Ownership-‐ Net Buy: Y N
Short Interest Ratio: 5.20
Short as % of Float: 4.10%
Ratio Analysis Company Industry Sector
P/E (TTM) 26 17.42 25.53
P/S (TTM) 0.94 0.41 1.95
P/B (MRQ) 2.45 1.08 2.07
P/CF (TTM) 10.34 2.88 10.06
Dividend Yield 0.44 1.92 1.92
Total Debt/Equity (MRQ) 17.05 42.09 70.37
Net Profit Margin (TTM) 3.39 2.04 7.90
ROA (TTM) 5.10 2.25 5.08
ROE (TTM) 10.0 5.15 11.05

2
Investment Thesis ● We recommend that the Cougar Investment Fund invest in Fedex Corp. (to be referred to as “FDX”) ● Morningstar’s analysis reveals that FDX is currently undervalued -‐ currently priced at $131.35, but it is estimated at $137.00. Furthermore, Morningstar expects to increase its fair value estimate in the future. ● FDX is subject to cyclical trends and consumer buying patterns. This is a positive thing for this stock;; online shopping is expanding and the Industrial sector -‐ of which this stock belongs -‐ is showing sluggish, but steady growth.
● FDX is shielded by very powerful barriers to entry. FDX is capable of handling most types of shipping, which requires a massive international shipping network and is difficult and costly to replicate. DHL, a worthy competitor, was forced to leave the US parcel market in 2009.
● FDX is subject to fuel price shocks and
global economic cycles -‐ both of which are expected to be favorable in the coming future.
Summary Provide brief summary of your analysis in each section that follows
Company Profile: FedEx Corporation provides a portfolio of transportation, e-‐commerce and business services. It operates in four business segments: FedEx Express, FedEx Ground, FedEx Freight and FedEx Services. The company is headquartered in Memphis, Tennessee. Fundamental Valuation: The fundamental (EBO) valuation revealed results that differed greatly from reality. The EBO valuation showed that FDX is extremely overvalued, however, manipulating the inputs revealed results that were more inline with analysts projections. Due to the strong consensus amongst analysts, we believe that there were significant flaws in our EBO valuation, which led to misguided results. Relative Valuation: As stated previously, this industry has very barriers to entry. This means that FDX has only one true competitor in the S&P 500, UPS (United Parcel Service). UPS and FDX have very comparable multiples and commonly outperform the other included competitors by several multiples. Unfortunately, there was a lack of available data for some of the ratio calculations in this report. Revenue and Earnings Estimates: FDX has not consistently beat, met or misses estimates. The success of quarterly earnings reports vary, however, the stock’s price remains on its course of steady appreciation. This speaks volumes to the sentiment that investors and analysts have in this company. Analyst Recommendations: Consensus among analysts is mixed. We’ve seen a variety of upgrades and downgrades without any consistent pattern. Overall, this outlook on this stock has remained positive. This positive outlook is held despite the aforementioned struggles in earnings and revenues.

3
Institutional Ownership: FDX stock is largely held by mutual funds and institutions. To be precise, the stock is 80.48% owned by institutions. We have seen a net sell lately, but this is relatively small and there is still a very strong institutional ownership. Short Interest: Short interest numbers have been relatively steady, but high. FDX’s short interest numbers are above those of the company’s competitors and they reflect a bearish sentiment in this arena. Stock Price Chart: The charts are very positive for FDX. In the short-‐timeframe charts, we can see some issues where the FDX stock (along with UPS) took a dip, but we have seen a steady recovery from that. Overall, we see a stock stock performance that consistently outperforms XLI and the S&P 500. Furthermore, the stock charts confirm the cyclicity of this stock -‐ movements between the stock and the indices typically match and slightly exaggerated.
4
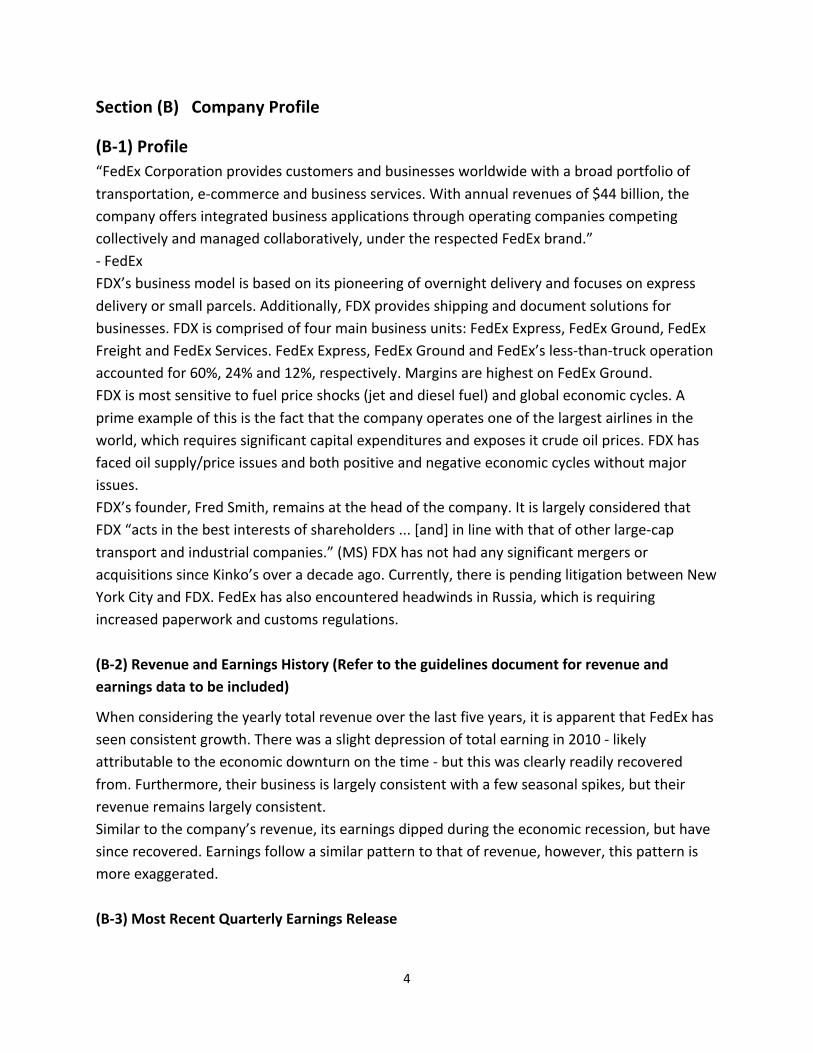
Section (B) Company Profile
(B-‐1) Profile “FedEx Corporation provides customers and businesses worldwide with a broad portfolio of transportation, e-‐commerce and business services. With annual revenues of $44 billion, the company offers integrated business applications through operating companies competing collectively and managed collaboratively, under the respected FedEx brand.” -‐ FedEx FDX’s business model is based on its pioneering of overnight delivery and focuses on express delivery or small parcels. Additionally, FDX provides shipping and document solutions for businesses. FDX is comprised of four main business units: FedEx Express, FedEx Ground, FedEx Freight and FedEx Services. FedEx Express, FedEx Ground and FedEx’s less-‐than-‐truck operation accounted for 60%, 24% and 12%, respectively. Margins are highest on FedEx Ground. FDX is most sensitive to fuel price shocks (jet and diesel fuel) and global economic cycles. A prime example of this is the fact that the company operates one of the largest airlines in the world, which requires significant capital expenditures and exposes it crude oil prices. FDX has faced oil supply/price issues and both positive and negative economic cycles without major issues. FDX’s founder, Fred Smith, remains at the head of the company. It is largely considered that FDX “acts in the best interests of shareholders ... [and] in line with that of other large-‐cap transport and industrial companies.” (MS) FDX has not had any significant mergers or acquisitions since Kinko’s over a decade ago. Currently, there is pending litigation between New York City and FDX. FedEx has also encountered headwinds in Russia, which is requiring increased paperwork and customs regulations. (B-‐2) Revenue and Earnings History (Refer to the guidelines document for revenue and earnings data to be included)
When considering the yearly total revenue over the last five years, it is apparent that FedEx has seen consistent growth. There was a slight depression of total earning in 2010 -‐ likely attributable to the economic downturn on the time -‐ but this was clearly readily recovered from. Furthermore, their business is largely consistent with a few seasonal spikes, but their revenue remains largely consistent. Similar to the company’s revenue, its earnings dipped during the economic recession, but have since recovered. Earnings follow a similar pattern to that of revenue, however, this pattern is more exaggerated. (B-‐3) Most Recent Quarterly Earnings Release

5
FDX’s most recent earnings release was on December 18th, 2013. Despite a 3% rise in overall revenue, the company struggled in this holiday shopping season and it missed the expected revenue consensus. The consensus amongst 28 analysts was that earnings would be $1.64, and FDX missed this with earnings of $1.57. Despite the miss on both earnings and revenue expectations -‐ largely attributable to the difficult holiday shopping season -‐ the stock still performed well, which shows the confidence investors and analysts have in this company. On the heels of the December 18th earnings release, the stock price had a delayed reaction, but climbed nonetheless. Section (C) Fundamental Valuation (EBO)
Inputs (provide below input values used in your analysis)
EPS forecasts (FY1 & FY2): $6.99 & $8.94
Long-‐term growth rate: 15.21%
*** Indicate next to the number if you made an adjustment to the consensus LTG estimate. Justify at the bottom of this panel how you derive the adjusted value, if any *** Book value /share (along with book value and number of shares outstanding):
Book value: $17,398.00
# of shares outstanding: 318.00 M

6
Book value / share: $54.711
Dividend payout ratio: 11.15%
Next fiscal year end: 2014 (3-‐31-‐2014)
Current fiscal month: 10 (February, May being 1)
Target ROE: 4.26%
*** Indicate next to the number if you made an adjustment to the target ROE estimate. Justify at the bottom of this panel how you derive the adjusted value, if any *** Discount rate 12.11%
Input for discount rate:
Risk-‐free rate: 3.69%
Beta: 1.45
Market risk premium: 9.5%
Output
Above normal growth period chosen: 2018 (5 years)
*** Justify at the bottom of this panel your choice of abnormal growth period ***
EBO valuation (Implied price from the spreadsheet): $82.09
Morningstar analysts expect revenue to grow through 2018, therefore, we consider 2018 as the proper time to make our EBO valuation. We believe that 2018 (a five-‐year investment horizon) will yield an implied price of $82.09.
This fundamental valuation is well below the stock’s current price. Most recently, FDX traded at $131.35 with a 52-‐week low of $90.61. This means that the EBO valuation is not only well below the current price, but even outside of the 52-‐week range.
This valuation was likely flawed and contains several potential “soft spots.” We expect some soft spots to be due to the fact that (1) the market risk premium was selected ambiguously and is likely unrepresentative of FDX’s true position;; (2) that FDX’s beta does accurately capture the expected uptick in the company’s business due to improving economic conditions;; and (3) that the valuation of the company may be skewed by the fact that its fiscal year is nearly over.
Sensitivity Analysis
1) Explain the input values used in sensitivity analysis. Compare the fundamental values obtained here in relation to the value from the base case
2) Other observations worth noting
EBO valuation would be (you can include more than one scenario in each of the following):

7
$88.42 if changing above normal growth period to 2020 (7-‐year investment horizon)
$93.33 if changing growth rate from mean (consensus) to the highest estimate 20.40
$73.69 if changing growth rate from mean (consensus) to the lowest estimate 11.00
$92.89 if changing discount rate to 11.00%
Would not change if changing target ROE to in any way

8
Section (D) Relative Valuation
Due to the very high barriers to entry, FDX only has one competitor in the S&P 500, UPS (United Parcel Service). Evaluating the table above, you can see that FDX and UPS are similar to each other, while the other included competitors are clearly quite dissimilar. FDX and UPS have the most comparable ratios in all categories. The other companies included in this comparison often fall short by several multiples when compared to FDX or UPS. Unfortunately, the information needed to complete a thorough comparison of value between FDX and UPS was not available.
9
Section (E) Revenue and Earnings Estimates
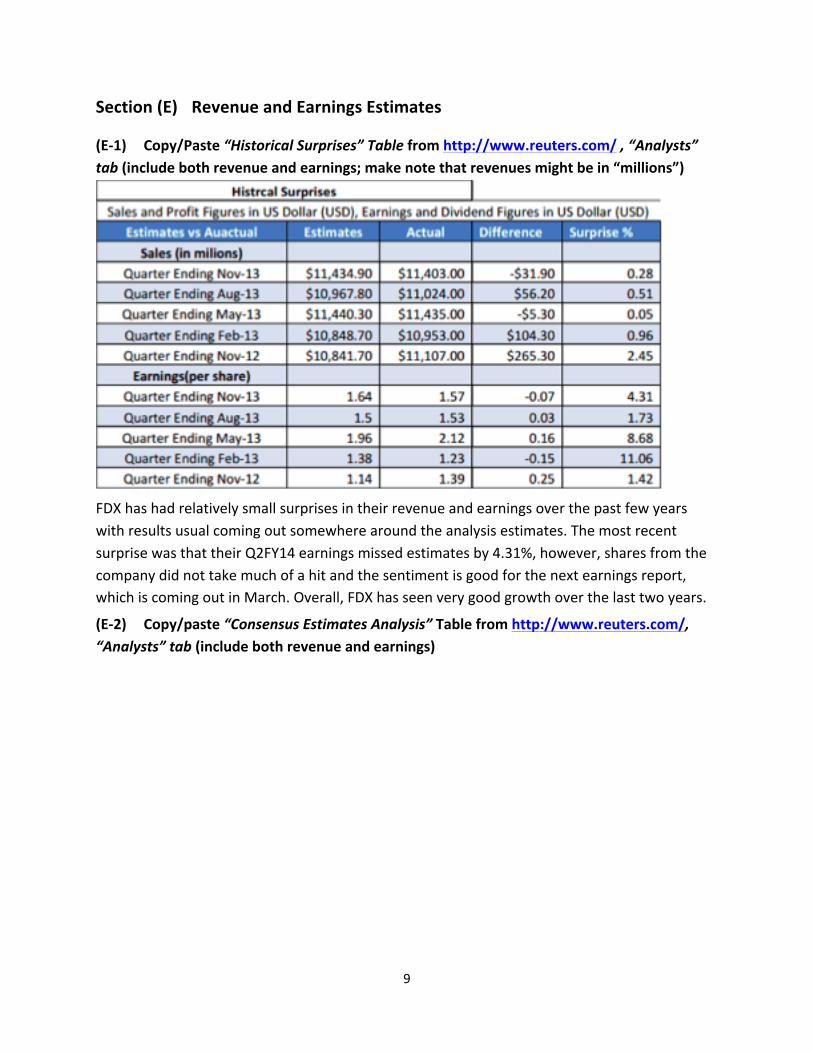
(E-‐1) Copy/Paste “Historical Surprises” Table from http://www.reuters.com/ , “Analysts” tab (include both revenue and earnings; make note that revenues might be in “millions”)
FDX has had relatively small surprises in their revenue and earnings over the past few years with results usual coming out somewhere around the analysis estimates. The most recent surprise was that their Q2FY14 earnings missed estimates by 4.31%, however, shares from the company did not take much of a hit and the sentiment is good for the next earnings report, which is coming out in March. Overall, FDX has seen very good growth over the last two years.
(E-‐2) Copy/paste “Consensus Estimates Analysis” Table from http://www.reuters.com/, “Analysts” tab (include both revenue and earnings)

10
The largest divergence can be seen in year ending FY2 especially in earnings. LT growth rate has significantly less analysis, which is probably the reason for having such a large range.
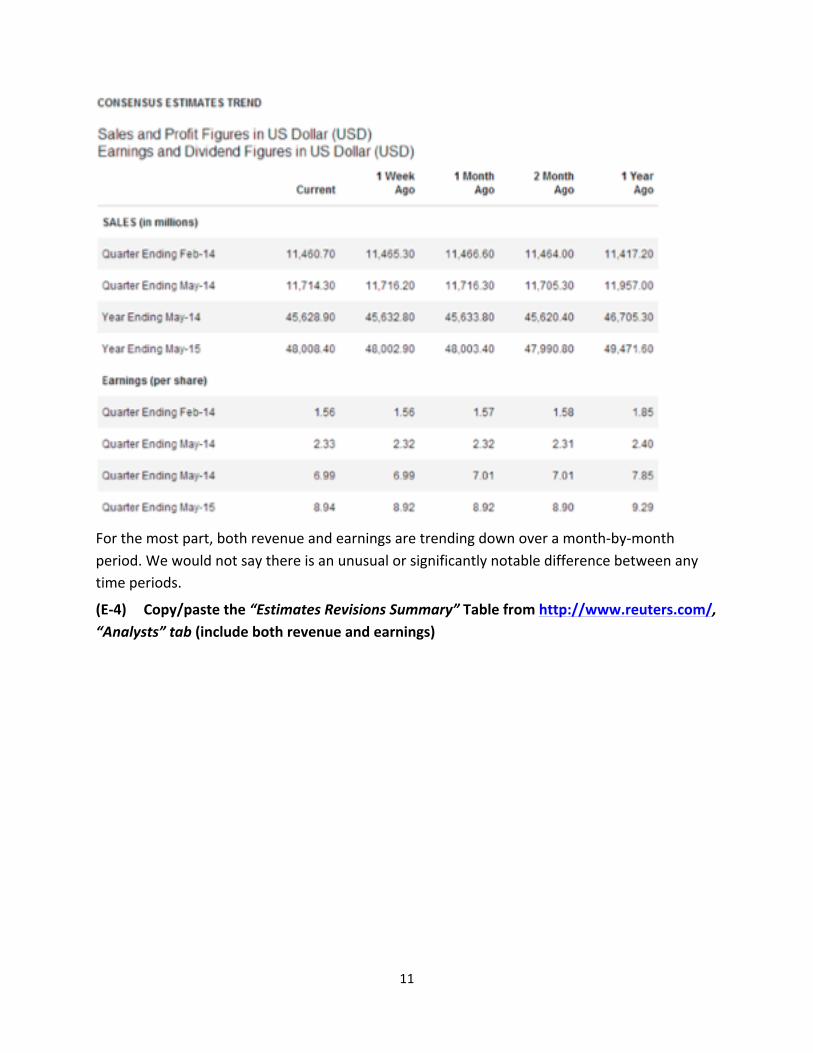
(E-‐3) Copy/paste “Consensus Estimates Trend” Table from http://www.reuters.com/, “Analysts” tab (include both revenue and earnings)
11
For the most part, both revenue and earnings are trending down over a month-‐by-‐month period. We would not say there is an unusual or significantly notable difference between any time periods.
(E-‐4) Copy/paste the “Estimates Revisions Summary” Table from http://www.reuters.com/, “Analysts” tab (include both revenue and earnings)

12
Over the last four weeks, there has been more negative revisions for revenue and earnings than positive revisions. Overall, however, there has not been that many revisions made -‐ only 29 revision made, in total. There have been no positive revisions for revenue, but we’ve seen three negative revisions last week and nine in the last four weeks. There have been two negative revisions for earnings in the last week and nine in the last four weeks. Earnings also had five positive revisions over the last four weeks. Overall, we would say the trend is for negative revisions especially for the 2014 periods, but results are mixed.
(E-‐5) “Consensus Earnings Revisions” from CNBC
Go to http://www.cnbc.com/, “news”, “earnings”, “calendar”, “consensus revisions”. Look for whether your stock had consensus earnings revision today. Copy/paste the information to the following table if any. Go back one day, copy/paste the information if there was consensus earnings revision. Repeat the process back one month. Add rows to the table if needed.

13
The most recent earnings report date was 12/18/13 and the next earnings report date will be 3/18/14. The most recent revision came on 2/18/14, which is a month away from the next earnings report. The only other revision came on 1/21/14, which is about a month after the last earnings report. It seems that they perform a revision once a month right around the date the earnings report comes out. Looking over the revisions, we’ve noticed that they are very small revisions and that the stock has moved very little on and around those days. One interesting thing is that between the two report dates FDX has dropped from a high of $142 a share to $128 and is now beginning to pick back up. We think this shows how important this next earnings report (will include the holiday season) is going to be for FDX.

14
Section (F) Analysts’ Recommendations
(F-‐1) Reuters Most Recent Three Months Analysts Recommendations Copy/paste the “Analyst Recommendations and Revisions” Table from http://www.reuters.com/ , “Analysts” tab. NOTE: Make sure you copy the entire table including “Mean Rating” at the bottom of the table.
Analyst have been recommending a strong hold to buy rating on FDX over the last 3 months with little change. This tends to be the general sentiment from all the different analyze reports on Morningstar and Reuters. Yahoo finance and Reuters have nearly the same mean rating of 2.2/2.1. The analyst seem to think FDX is positioned very well in the delivery industry, but are slightly worried about how they will be affected by slow growth economy, especially globally as they have been working on expanding their services around the global. The second worry is gas price volatility. We think this is a good stock to buy and hold as a long term investment, especially if the global economy really starts to come back this year and next.

15
(F-‐2) Most Recent One Month Analysts Upgrades/Downgrades from CNBC Go to http://www.cnbc.com/, “news”, “earnings”, “calendar”, “upgrades” and “downgrades”. There have been no upgrades or downgrades from CNBC within the most recent month.

16
Section (G) Institutional Ownership
The majority of FDX’s stock is held by institutions, which shows that many experts believe FDX is a solid company that is in a position to continue creating profit-‐margin growth and long-‐term success. FDX is also 41.42% held in mutual funds, which tells us that it is a great longer-‐term-‐investment type of stock that will see steady and consistent growth in the future. There has been a net sell by the institutions, but this is relatively minor and the stock is still largely held by institutions, nonetheless.

17
Section (H) Short Interest
(H-‐1) Short Interest Data from http://www.nasdaq.com/ (NASDAQ’s website)

18

19

20

21
(H-‐2) Short Interest Data From http://finance.yahoo.com/
FDX has seen relatively steady short interest numbers over the last year. At the beginning of this year, the number of short sales rose from 3 million to 14 million, which sent days to cover spiking from 2 to 6. We believe this was caused by some bad news coming out of service for FDX in Russia right around that date, which also caused the stock price to dip $10.00 in just 12 days. Since then, we have seen the stock price beginning to come back up and the volume of short sales and days to cover coming back down. With a 5.2 short ratio, there is definitely bearish sentiment regarding FDX’s short position, especially compared with its competitors with UPS at 2.3 and LUV at 1.40.

22
Section (I) Stock Charts
For (I-‐1) – (I-‐3), the stock price charts should include (1) your stock, (2) 1 competitor, (3) sector ETF, and (4) SP500
(I-‐1) A three months price chart
(I-‐2) A one year price chart
(I-‐3) A five year price chart

23
In the 3-‐month chart, FDX was beating the S&P, XLI and UPS until January, when news about holiday shipping problems came out, which sent both UPS and FDX dipping fairly hard below the S&P, and XLI. This news, coupled with problems in Russia and poor economic numbers globally, have hurt the delivery market. Since then, we have seen a rise in both UPS and FDX’s stock prices. We are waiting on the next very important earnings report, which comes out in March. In the last year, we saw FDX start off rough with some poor report numbers in May and August, but since October, they have seen a huge jump and have outperformed all benchmarks with a very bullish sentiment from investors. Over the last five years, we have seen FDX consistently outperform the S&P 500, XLI and UPS with the trend continuing. (I-‐4) Technical Indicators (“Moving Average” and “Relative Strength Index” from http://finance.yahoo.com/)

24
In the 50 to 10 day moving average, we see a death cross happen right around January 28th, a few days after the stock took that 10 point dip due to suspended service in Russia (new import regulations and extra paper work). Since then, the stock has been coming back and -‐ depending on this next earnings report -‐ we think the stock could see another golden cross. As for the 50 to 200 day moving average, we see a death cross around 9/12 and then a gold cross around mid-‐December 2012 and it has continued

25
above the 200 day moving average since then with a slight dip as of late. The RSI is also at 50, which puts the stock right between undersold and overbought levels. With all the other indicators, this leads us to believe this is a good time to get in on FDX.