stock market liberalization, economic reform, and emerging
DESCRIPTION
TRANSCRIPT

Stock Market Liberalization, Economic Reform,and Emerging Market Equity Prices
PETER BLAIR HENRY*
ABSTRACT
A stock market liberalization is a decision by a country’s government to allowforeigners to purchase shares in that country’s stock market. On average, a coun-try’s aggregate equity price index experiences abnormal returns of 3.3 percent permonth in real dollar terms during an eight-month window leading up to the im-plementation of its initial stock market liberalization. This result is consistentwith the prediction of standard international asset pricing models that stock mar-ket liberalization may reduce the liberalizing country’s cost of equity capital byallowing for risk sharing between domestic and foreign agents.
A stock market liberalization is a decision by a country’s government toallow foreigners to purchase shares in that country’s stock market. Standardinternational asset pricing models ~IAPMs! predict that stock market liber-alization may reduce the liberalizing country’s cost of equity capital by al-lowing for risk sharing between domestic and foreign agents ~Stapleton andSubrahmanyan ~1977!, Errunza and Losq ~1985!, Eun and Janakiramanan~1986!, Alexander, Eun, and Janakiramanan ~1987!, and Stulz ~1999a, 1999b!!.
This prediction has two important empirical implications for those emerg-ing countries that liberalized their stock markets in the late 1980s and early1990s. First, if stock market liberalization reduces the aggregate cost of eq-uity capital then, holding expected future cash f lows constant, we shouldobserve an increase in a country’s equity price index when the market learnsthat a stock market liberalization is going to occur. The second implication is
* Assistant Professor of Economics, Graduate School of Business, Stanford University, Stan-ford, CA 94305-5015. This paper is a revised version of Chapter 1 of my Ph.D. thesis at theMassachusetts Institute of Technology. I thank Christian Henry and Lisa Nelson for their sup-port and encouragement. I am grateful to Steve Buser, Paul Romer, Andrei Shleifer, JeremyStein, René Stulz ~the editor!, and two anonymous referees for helpful comments on earlierdrafts. I also thank Olivier Blanchard, Rudi Dornbusch, Stanley Fischer, Jeffrey Kling, DonLessard, Tim Opler, Jim Poterba, Peter Reiss, Ken Singleton, Robert Solow, Ingrid Werner, andseminar participants at Harvard, MIT, Northwestern, Ohio State, Stanford, UNC-Chapel Hill,and the University of Virginia. I am grateful to Nora Richardson and Joanne Campbell foroutstanding research assistance and to Charlotte Pace for superb editorial assistance. The In-ternational Finance Corporation and the Research Foundation of Chartered Financial Analystsgenerously allowed me to use the Emerging Markets Database. Ross Levine generously sharedhis extensive list of capital control liberalization dates. Finally, I would like to thank the NationalScience Foundation, The Ford Foundation, and the Stanford Institute for Economic Policy Re-search ~SIEPR! for financial support. All remaining errors are my own.
THE JOURNAL OF FINANCE • VOL. LV, NO. 2 • APRIL 2000
529

that we should observe an increase in physical investment following stockmarket liberalizations, because a fall in a country’s cost of equity capital willtransform some investment projects that had a negative net present value~NPV! before liberalization into positive NPV endeavors after liberalization.This second effect of stock market liberalization should generate higher growthrates of output and have a broader impact on economic welfare than thefinancial windfall to domestic shareholders ~see Henry ~1999a!!. This paperexamines whether the data are consistent with the first of these two impli-cations. Specifically, an event study approach is used to assess whether stockmarket liberalization is associated with a revaluation of equity prices and afall in the cost of equity capital.
In the sample of 12 emerging countries examined in this paper, stock mar-kets experience average abnormal returns of 4.7 percent per month in realdollar terms during an eight-month window leading up to the implementa-tion of a country’s initial stock market liberalization. After controlling forcomovements with world stock markets, economic policy reforms, and mac-roeconomic fundamentals, the average abnormal return, 3.3 percent per monthover the same horizon, is smaller but still economically and statistically sig-nificant. Estimates using five-month, two-month, and implementation-month-only windows are all associated with statistically significant stock pricerevaluation. The largest monthly estimate, 6.5 percent, is associated withthe implementation-month-only estimate.
These facts are consistent with a fundamental prediction of the standardIAPM. If an emerging country’s stock market is completely segmented fromthe rest of the world, then the equity premium embedded in its aggregatevaluation will be proportional to the variance of the country’s aggregatecash f lows. Once liberalization takes place and the emerging country’s stockmarket becomes fully integrated, its equity premium will be proportional tothe covariance of the country’s aggregate cash f lows with those of a worldportfolio. If, in spite of foreign ownership restrictions, the emerging marketis not completely segmented ~Bekaert and Harvey ~1995!! then the emergingmarket’s equilibrium valuation will incorporate an equity premium that liessomewhere between the autarky and fully integrated premium.1
The general consensus ~see Stulz ~1999a, 1999b!, Tesar and Werner ~1998!,Bekaert and Harvey ~2000!, and Errunza and Miller ~1998!! is that the localprice of risk ~the variance! exceeds the global price of risk ~the covariance!.Therefore, we expect the equity premium to fall when a completely or mildlysegmented emerging country liberalizes its stock market.2 Holding expected
1 See also Errunza, Losq, and Padmanabhan ~1992!, who demonstrate that emerging mar-kets are neither fully integrated nor completely segmented. Even if the emerging country pro-hibits developed-country investors from investing in its domestic equity market, developed-country investors may be able to construct portfolios of developed-country securities that mimicthe returns on the emerging country’s stock market.
2 Markets that are mildly segmented ex ante should experience a smaller decline than fullysegmented markets. See Errunza and Losq ~1989!.
530 The Journal of Finance

future cash f lows constant, this fall in the equity premium will cause apermanent fall in the aggregate cost of equity capital and an attendant re-valuation of the aggregate equity price index.3
One of the key issues in constructing estimates of the cumulative abnor-mal returns associated with a country’s initial stock market liberalizationlies in establishing the date of the initial liberalization and picking an ap-propriate time interval around this date. After providing a detailed descrip-tion of the dating procedure and the reasons for using an eight-month eventwindow, the empirical analysis in this paper begins by focusing on the be-havior of stock prices during the eight-month window. After controlling forcomovements with world stock returns, macroeconomic reforms, and macro-economic fundamentals, the average monthly revaluation effect associatedwith the eight-month stock market liberalization window is 3.3 percent, whichimplies a total revaluation of 26 percent.
Although these results suggest a revaluation of equity prices in anticipationof the initial stock market liberalization, using a relatively long window is prob-lematic because policymakers may behave like managers who issue equityfollowing a run-up in stock prices ~Ritter ~1991! and Loughran and Ritter~1995!!. Using an eight-month event window may overstate the liberalizationeffect if policymakers try to liberalize during a period of unusually high re-turns. To address this problem, the paper also presents estimates based onshorter event windows. Estimates using five-month, two-month, and one-month ~implementation-month-only! windows are all associated with a sta-tistically significant stock price revaluation. The largest effect, 6.5 percent, isassociated with the implementation-month-only estimate, which suggests thatthe revaluation associated with a country’s initial stock market liberalizationis not an artifact of using long windows. Further checks of robustness of theresults are performed by estimating the revaluation effect using implementation-month-only windows and alternative liberalization dates that have been pro-posed by other authors. These results are quantitatively and qualitatively similarto the benchmark results. Finally, the paper also demonstrates that stock mar-ket liberalizations that follow the initial liberalization are associated with muchsmaller and statistically insignificant revaluations.
This paper presents the first careful empirical estimates of the impact ofstock market liberalization on emerging market equity prices. A number ofpapers examine the effect of stock market liberalization on market integra-
3 This is the case of an unanticipated liberalization. If the liberalization is announced beforeit actually occurs, then there will be a jump in price upon announcement followed by mild priceappreciation until the liberalization is implemented. The reason for price appreciation betweenannouncement and implementation is as follows: Let P * . P be the integrated capital marketequilibrium price. Upon announcement of a future liberalization at time T, the current pricewill jump only part of the way to P * because no risk sharing takes place until T *. However,since the price at T * must be P * and there can be no anticipated price jumps, the price mustgradually appreciate between T and T *. Also, if there is uncertainty as to whether the an-nounced stock market liberalization is going to occur, there may be significant price apprecia-tion, as news confirming the liberalization becomes public knowledge.
Stock Market Liberalization 531

tion ~Errunza et al. ~1992!, Buckberg ~1995!, Bekaert ~1995!, and Bekaertand Harvey ~1995!!; however, none of these papers estimate the valuationimpact of stock market liberalization. Kim and Singal’s ~2000! evidence thatemerging market stock returns are abnormally high in the months leadingup to liberalization provides crucial initial evidence on the valuation ques-tion, but they acknowledge that there were confounding events throughoutthe sample period for which they do not control. In a related paper, Bekaertand Harvey ~2000! show that liberalization tends to decrease aggregate div-idend yields and argue that the price change ref lects a change in the cost ofcapital rather than a change in earnings or profits of firms.4 They control forthe potentially confounding effect of economic reforms by using proxy vari-ables such as credit ratings.
An important contribution of this paper relative to Bekaert and Harvey~2000! is that rather than using ready-made proxy variables to control foreconomic reforms, I construct a novel data set of economic policy reforms~Henry ~1999b!! for each of the 12 countries in my sample. Using this timeseries of economic policy changes to control explicitly for economic reformsprovides transparent evidence on the impact of stock market liberalization.
Specifically, in addition to disentangling the effect of stock market liber-alization from the effects of macroeconomic stabilization, trade liberaliza-tion, privatization, and the easing of exchange controls, the paper also providesa first set of estimates of the impact of these macroeconomic reforms on thestock market. For example, in the sample of countries considered here, stockmarkets experience average abnormal returns of 2.1 percent per month inreal dollar terms during the eight months leading up to trade liberalization.The trade reform window frequently overlaps with the window for stockmarket liberalization. Therefore, estimating the effect of stock market lib-eralization without controlling for trade reforms may result in upward bi-ased estimates. Moreover, the stock price responses to trade and othermacroeconomic reforms are of independent interest.
The remainder of this paper proceeds as follows. Section I presents thedata and descriptive findings. Section II describes the methodology that isused to identify a country’s initial stock market liberalization and measureits valuation impact. Section III presents the empirical results. Section IVdiscusses some potential interpretation problems. Section V summarizes themain results and conclusions.
I. Data and Descriptive Findings
A. Stock Market Data
The sample examined in this paper includes 12 emerging markets: Argen-tina, Brazil, Chile, Colombia, Mexico, and Venezuela in Latin America, andIndia, Malaysia, Korea, the Philippines, Taiwan, and Thailand in Asia. These
4 Errunza and Miller ~1998! and Foerster and Karolyi ~1999! provide firm level evidence onthe related topic of ADR issuance.
532 The Journal of Finance

countries were chosen because of the general interest in the two regions.Indonesia was excluded from the Asian list because Indonesian stock marketdata are available only after the date on which its stock market was liber-alized. All emerging stock market data are taken from the InternationalFinance Corporation’s ~IFC! Emerging Markets Data Base ~EMDB!. Returnsfor individual countries come from the IFC Total Return Index ~U.S. dollardenominated!. The Morgan Stanley Capital Index for Europe, Asia, and theFar East is also from the EMDB. Data on the S&P 500 come from the IMF’sInternational Financial Statistics ~IFS!. Each country’s U.S. dollar total re-turn index is def lated by the U.S. consumer price index, which comes fromthe IFS. All of the data are monthly. All returns are logarithmic.
B. Stock Market Liberalization Dates
B.1. Implementation Dates
Testing the hypothesis that a country’s first stock market liberalizationcauses equity price revaluation requires a systematic procedure for identi-fying the date of each country’s first stock market liberalization. Officialpolicy decree dates are used when they are available; otherwise, two alter-natives are pursued. First, many countries initially permitted foreign own-ership through country funds. Since government permission is presumably anecessary condition for establishment of these funds, the date when the firstcountry fund is established is a proxy for the official implementation date.The second way of indirectly capturing official implementation dates is tomonitor the IFC’s Investability Index. The investability index is the ratio ofthe market capitalization of stocks that foreigners can legally hold to totalmarket capitalization. A large jump in the investability index is evidence of anofficial liberalization. In what follows, the date of a country’s first stock mar-ket liberalization is defined as the first month with a verifiable occurrence ofany of the following: liberalization by policy decree, establishment of the firstcountry fund, or an increase in the investability index of at least 10 percent.
Table I lists the date on which each of the 12 countries first liberalized itsstock market, as well as the means by which it liberalized. In particular,where the initial liberalization is through a country fund, the specific nameof the country fund is given. Table II provides a comparison of the liberal-ization dates in Table I with other liberalization dates in the literature. Spe-cifically, column ~2! of Table II lists the liberalization dates identified usingthe procedure outlined in the preceding paragraph. Columns ~3! through ~5!list the official liberalization dates of Bekaert and Harvey ~2000!, Kim andSingal ~2000!, and Buckberg ~1995! respectively. Column ~6! lists the earliestdate of the preceding four columns. Three of the 12 dates in column ~2! arepreceded by dates in column ~6!. An investigation of the three dates preced-ing those given in column ~2! yielded no confirmation of the September 1987opening for Thailand or the December 1988 opening for Venezuela. The Feb-ruary 1991 date for Colombia actually refers to La Apertura, which was atrade liberalization not a stock market liberalization. Hence, the liberaliza-
Stock Market Liberalization 533

Table I
First Stock Market LiberalizationThe stock market liberalization dates are based on information obtained from the followingsources: Levine and Zervos ~1994!; The Wilson Directory of Emerging Market Funds; IFC In-vestable Indices; Park and Van Agtmael ~1993!; Price ~1994!; The Economist Intelligence Unit,various issues; The Economist Guide to World Stock Markets ~1988!; and the IMF’s ExchangeArrangements and Restrictions, various issues.
Country
Date of FirstStock MarketLiberalization Details about the Liberalization
Argentina November 1989 Policy Decree: The liberalization began with the New For-eign Investment Regime in November 1989. Legal limitson the type and nature of foreign investments are re-duced ~Park and Van Agtmael ~1993!, p. 326!.
Brazil March 1988 Country Fund Introduction: “The Brazil Fund Incorpo-rated” ~The Wilson Directory of Emerging Market Funds,p. 17!.
Chile May 1987 Country Fund Introduction: “The Toronto Trust MutualFund” ~The Wilson Directory of Emerging Market Funds,p. 17!.
Colombia December 1991 Policy Decree: Resolution 52 allowed foreign investors topurchase up to 100 percent of locally listed companies~Price ~1994!!.
India June 1986 Country Fund Introduction: “The India Fund” ~The Wil-son Directory of Emerging Market Funds, p. 12!.
Korea June 1987 Country Fund Introduction: “The Korea Europe Fund Lim-ited” ~The Wilson Directory of Emerging Market Funds,p. 13!.
Malaysia May 1987 Country Fund Introduction: “The Wardley GS MalaysiaFund” ~The Wilson Directory of Emerging Market Funds,p. 14!.
Mexico May 1989 Policy Decree: Restrictions on foreign portfolio inflows weresubstantially liberalized ~Levine and Zervos ~1994!!.
The Philippines May 1986 Country Fund Introduction: “The Thornton PhilippinesRedevelopment Fund Limited” ~The Wilson Directory ofEmerging Market Funds, p. 15!.
Taiwan May 1986 Country Fund Introduction: “The Taipei Fund” ~The Wil-son Directory of Emerging Market Funds, p. 15!.
Thailand January 1988 Country Fund Introduction: “The Siam Fund Limited” ~TheWilson Directory of Emerging Market Funds, p. 16!.
Venezuela January 1990 Policy Decree: Decree 727 completely opened the marketto foreign investors except for bank stocks ~~Levine andZervos ~1994!!.
534 The Journal of Finance

tion dates in column ~2! also represent the earliest verifiable stock marketliberalization dates listed in Table I. This is important because the goal hereis to identify the first stock market liberalization in any particular country.The empirical analysis in Section III begins with the dates in column ~2!but, for comparison, results based on the other dates are also presented.
B.2. Announcement Dates
A search for announcement dates corresponding to the implementationdates listed in Table I was conducted using the database Lexis0Nexis Re-search Software version 4.06. Consultations with library science staff sug-gested that Lexis0Nexis offers two distinct advantages relative to Bloombergand the Dow Jones News Retrieval. First, Bloomberg has relatively littlecoverage prior to 1991. Second, Dow Jones News Retrieval covers a subset ofthe news sources spanned by Lexis0Nexis. Lexis0Nexis covers more than2,300 full-text information sources from U.S. and overseas newspapers, mag-azines, journals, newsletters, wire services, and broadcast transcripts. It alsocovers abstract material from more than 1,000 information sources.
The search algorithm used was as follows. If the initial stock market lib-eralization came via a country fund, the search was conducted using thename of the country fund. If the initial stock market liberalization was nota country fund, then the following search phrases were used: stock marketliberalization, stock market opening, capital market liberalization, capitalmarket opening, restrictions on foreign capital, foreign investment, and for-eign portfolio investment.
Table II
Comparison of Official Liberalization Dates across AuthorsThe dates in column ~2! are constructed using the dating procedure described in the paper. Thedates in columns ~3! through ~5! are taken from Bekaert and Harvey ~2000!, Kim and Singal~2000!, and Buckberg ~1995!, respectively. Column 6 shows the earliest date given for a countryin the preceding four columns.
~1!Country
~2!Dating
Procedure
~3!Bekaert &
Harvey
~4!Kim &Singal
~5!Buckberg
~6!Earliest
Argentina 11-89 11-89 11-89 10-91 11-89Brazil 3-88 5-91 5-91 5-91 3-88Chile 5-87 1-92 9-87 10-89 5-87Colombia 12-91 2-91 2-91 10-91 2-91India 6-86 11-92 11-92 NA 6-86Korea 6-87 1-92 1-92 NA 6-87Malaysia 5-87 12-88 12-88 NA 5-87Mexico 5-89 5-89 11-89 5-89 5-89The Philippines 5-86 6-91 7-86 10-89 5-86Taiwan 5-86 1-91 1-91 NA 5-86Thailand 1-88 9-87 8-88 NA 9-87Venezuela 1-90 1-90 1-90 12-88 12-88
Stock Market Liberalization 535

Table III presents the complete results of the search. The first column ofthe table lists the country and the implementation date of its first stockmarket liberalization. Column 2 lists all announcement dates that were un-covered by the search. For seven of 12 countries the earliest news of stockmarket liberalization comes on or after the actual implementation date. Ofthe five countries for which the announcement date precedes the actual lib-eralization date, three have announcements occurring only one month inadvance. Given the legal, political, and logistical complexities of enactingsuch a policy, it is hard to believe that the market first learns of the under-taking only a month before it happens. By way of comparison, the averagetime between announcement and listing for American Depositary Receipts~ADRs! is three months, and ADRs are issued in markets that have alreadybeen liberalized. For the remaining two countries, Colombia and Taiwan,only Taiwan’s announcement date seems reasonable. The headline for Co-lombia actually corresponds not to the stock market, but to its major tradeliberalization, La Apertura. The central point of Table III is that announce-ment dates uncovered using a source such as Lexis0Nexis are likely to bepoor proxies for the date at which information about the liberalization firstreached market participants. In the absence of credible announcement dates,the only reliable way of capturing all of the price changes associated withthe liberalization is to estimate abnormal returns over a generous window oftime preceding the liberalization. A detailed discussion of the construction ofsuch a window is postponed until Section II.
C. Descriptive Findings
Figure 1 motivates the analysis by plotting the average cumulative abnor-mal return ~triangles! across all 12 countries in event time. T * is the monthin which the stock market liberalization was implemented ~see the dates inTable I!. Figure 1 suggests a revaluation of aggregate equity prices in an-ticipation of stock market liberalization; the cumulative abnormal returnfrom T * 2 12 to T * is on the order of 40 percent.5
As a way of checking the consistency of the cumulative abnormal returnplot with other work, Figure 1 also plots the cumulative abnormal change inthe log of the dividend yield ~squares!. As one would expect, the respectiveplots are near mirror images: Realized returns increase as the dividend yielddecreases. The cumulative decline in dividend yields from T * 2 12 to T * ison the order of 30 percent. Since the average level of the dividend yield inthese countries prior to liberalization is about four percent, the 30 percentdecline reported in Figure 1 suggests an average fall in the dividend yield ofabout 100 basis points.6 This estimate of 100 basis points is slightly larger
5 Kim and Singal ~2000! also find that emerging countries experience positive abnormalreturns in the months leading up to stock market liberalization. Errunza and Miller ~1998! findsimilar results using firm level data.
6 Ln~0.04! 2 Ln~0.03! is approximately equal to 0.3. Therefore, a 30 percent fall in the div-idend yield from a level of four percent implies a fall of approximately 100 basis points.
536 The Journal of Finance

than the range of declines ~5 to 90 basis points! reported by Bekaert andHarvey ~2000!, but once controls are introduced in Section III, this numberfalls well within the range of Bekaert and Harvey’s estimates.
Though Figure 1 suggests a causal channel from stock market liberaliza-tion to stock prices and the cost of equity capital, the graph needs to beinterpreted with caution because it does not control for any other reforms. Inparticular, note that there is a stock price revaluation of about 20 percentfrom T * to T * 1 4. The dividend yield also continues to fall after implemen-tation of the liberalization. Since there is no theoretical reason to expect astock-market-liberalization-induced revaluation after implementation, Fig-ure 1 suggests that favorable, unanticipated macroeconomic events tend tooccur following stock market liberalizations. Macroeconomic reforms are thefocus of the next subsection.
D. Economic Reforms
Conducting an event study is the most direct and transparent way of as-sessing the impact of stock market liberalization on emerging market equityprices. However, unlike the typical event study in finance where the econo-
Figure 1. The behavior of stock returns and dividend yields around the first stockmarket liberalization. The variable on the y-axis is the continuously compounded abnormalpercentage change. T * is the month in which the stock market liberalization was implemented.The upward trending series ~triangles! is a plot of the cumulative residuals from a panel re-gression of the real dollar return from all 12 countries on a constant and 11 country-specificdummies. The downward trending series ~squares! is a plot of the cumulative residuals from apanel regression of the change in the natural log of the dividend yield on a constant and 11country-specific dummies.
Stock Market Liberalization 537

Tab
leII
I
An
nou
nce
men
tD
ates
for
Fir
stS
tock
Mar
ket
Lib
era
liza
tio
ns
Th
ean
nou
nce
men
tsw
ere
proc
ure
dvi
aL
exis
-Nex
isS
oftw
are
vers
ion
4.06
usi
ng
the
sear
chpr
oced
ure
desc
ribe
din
the
pape
r.
~1!
Cou
ntr
yan
dIm
plem
enta
tion
Dat
e
~2!
An
nou
nce
men
tD
ate~
s!~3
!S
ourc
e~4
!H
eadl
ine
Arg
enti
na
~Nov
embe
r19
89!
Dec
embe
r11
,19
89T
he
Fin
anci
alT
imes
Arg
enti
na
fun
dai
ms
atpr
ivat
ised
com
pan
ies.
Bra
zil
~Mar
ch19
88!
Mar
ch23
,19
88T
he
Toro
nto
Fin
anci
alP
ost
Som
eli
keit
hot
:Sh
ares
inth
efu
nd
wil
lbe
offe
red
toth
epu
blic
shor
tly
byfi
rst
Bos
ton
Cor
pora
tion
and
Mer
rill
Lyn
chC
apit
alM
arke
tsM
arch
31,
1988
PR
New
swir
eB
razi
lF
un
dC
omm
onS
tock
Off
ered
Apr
il4,
1988
Inst
itu
tion
alIn
vest
or,
Inc.
Bra
zil
Fu
nd
isH
ot
Ch
ile
~May
1987
!F
ebru
ary
7,19
96T
he
Reu
ter
Eu
rope
anB
usi
nes
sR
epor
tM
icro
pal
nam
esbe
st19
95em
ergi
ng
mar
ket
fun
ds.
Th
eTo
ron
toT
rust
Ch
ile
Fu
nd,
lau
nch
edin
1987
,is
Mic
ropa
l’sbe
stpe
rfor
min
gem
ergi
ng
mar
ket
fun
dov
erth
epa
stse
ven
year
s
Col
ombi
a~D
ecem
ber
1991
!F
ebru
ary,
1991
Nat
ion
alT
rade
Dat
aB
ank
Mar
ket
repo
rts
Col
ombi
a-E
con
omic
Pol
icy
and
Tra
deP
ract
ices
.T
he
adm
inis
trat
ion
ofP
resi
den
tG
avir
iah
asem
bark
edon
“la
aper
tura
”~t
he
open
ing!
,abo
ldpl
anto
low
erta
riff
san
dot
her
barr
iers
tofo
reig
ntr
ade
Indi
a~J
un
e19
86!
May
12,
1986
Th
eF
inan
cial
Tim
esM
aver
ick
Bri
ngs
inth
eS
avin
gs.
Th
ego
vern
men
tap
prov
edth
eU
nit
tru
stof
Indi
a’s
~UT
I!co
llab
orat
ion
wit
hM
erri
llL
ynch
tola
un
chth
eIn
dia
Fu
nd
Jun
e17
,19
86T
he
Fin
anci
alT
imes
Mor
eD
etai
lsG
iven
for
Indi
aF
un
d.T
he
Indi
ango
vern
men
tla
stw
eek
appr
oved
the
prop
osal
wh
ich
for
the
firs
tti
me
wil
lal
low
fore
ign
ers
toin
vest
inth
eIn
dian
stoc
km
arke
ts
538 The Journal of Finance

Kor
ea~J
un
e19
87!
Mar
ch21
,19
87T
he
Eco
nom
ist
Sou
thK
orea
nS
ecu
riti
es;A
uth
oris
edE
ntr
yO
nly
Mal
aysi
a~M
ay19
87!
Apr
il8,
1987
Jiji
Pre
ssL
imit
edA
rab-
Mal
aysi
anM
erch
ant
Ban
k—IF
CM
ove
toT
apU
.S.
Mar
ket.
May
11,
1987
U.P
.I.
Mal
aysi
anF
un
dO
ffer
ing
Incr
ease
d
Mex
ico
~May
1989
!M
ay15
,19
89R
eute
rsM
exic
oA
nn
oun
ces
New
For
eign
Inve
stm
ent
Ru
les
July
8,19
89T
he
New
York
Tim
esM
exic
oE
ases
For
eign
Cu
rb.T
he
gove
rnm
ent
has
open
edM
exic
o’s
stoc
kex
chan
geto
fore
ign
inve
stm
ent
Ph
ilip
pin
es~M
ay19
86!
Sep
tem
ber
22,
1986
Bu
sin
ess
Wee
kF
orA
quin
o,U
.S.
Bu
sin
ess
Wil
lB
ea
Tou
ghS
ell.
Tex
t:H
ong
Kon
g-ba
sed
Th
orn
ton
Man
agem
ent
~Asi
a!L
td.
rece
ntl
yla
un
ched
the
Ph
ilip
pin
esR
edev
elop
men
tF
un
dw
hic
hin
vest
sin
Ph
il-
ippi
ne
stoc
ks
Tai
wan
~May
1986
!Ju
ly3,
1985
Cen
tral
New
sA
gen
cyL
ocal
Sec
uri
ties
Inve
stm
ent
Com
pan
yF
orm
edin
Tai
pei
Det
ails
:A
25m
illi
ondo
llar
inve
stm
ent
fun
dto
beca
lled
the
Tai
pei
Fu
nd
wil
lbe
rais
edso
onJu
ne
28,
1986
Th
eE
con
omis
tA
sian
Fu
nds
Det
ails
:T
he
Tai
pei
Fu
nd
was
form
edon
May
22n
d
Th
aila
nd
~Jan
uar
y19
88!
Apr
il27
,19
88T
he
Fin
anci
alT
imes
An
oth
erT
hai
Fu
nd
toJo
inth
eM
arke
tD
etai
ls:
the
fun
dw
ases
tabl
ish
edin
Jan
uar
y
Ven
ezu
ela
~Jan
uar
y19
90!
Dec
embe
r,19
89S
outh
Mag
azin
eS
cram
ble
atth
eF
rin
ge;
Th
ird
Wor
ldS
tock
Mar
kets
Det
ails
:L
iber
alis
atio
nis
proc
eedi
ng
inA
rgen
tin
aan
dV
enez
uel
a
Stock Market Liberalization 539

metrician can be reasonably certain that the event in question is isolatedfrom other inf luential events, the shift from closed to open capital marketsusually coincides with four equally important changes in economic policy:macroeconomic stabilization, trade liberalization, privatization, and the eas-ing of exchange controls.
Table IV, which lists all confounding macroeconomic events occurring withina 15-month window around the initial stock market liberalization, forcefullyillustrates this point. Argentina provides a good illustration of why attentionto concurrent economic reforms is a critical part of this event study. At leastpart of the dramatic increase in Argentine stock prices during 1989 wasprobably due to the implementation of a sweeping stabilization plan. Thereare many other conspicuous examples: IMF negotiations, a free trade agree-ment, and the overthrow of Marcos in the Philippines ~1986!; privatizationin Malaysia ~1987!; a Brady debt reduction deal in Venezuela ~1990!; privat-ization and tariff reductions in Colombia ~1992!.7
The theory used to explain the stock price effects of a capital market lib-eralization assumes that everything else is held constant when this changeis made. To construct an estimate that we can use to test the theory, it isnecessary to hold constant the other reform measures and isolate a purecapital market effect. Additionally, the stock market’s response to the otherreforms is interesting in its own right. Using the full list of events allows formeasurement of the price response to each of the four major reforms.
In addition to the problem of confounding macroeconomic reforms, fourother methodological issues are involved in measuring the impact of stockmarket liberalization on equity prices: construction of the event windows inthe absence of announcement dates, multiple stock market liberalizations,and accounting for macroeconomic fundamentals and policy endogeneity. Thenext section discusses these issues in detail.
II. Methodological Issues
A. Construction of Event Windows
In the absence of reliable announcement dates, the average time betweenannouncement and listing for American Depositary Receipts ~three months!8
provides an announcement proxy. Suppose the government announces in monthT * 2 3 that it will open the stock market to foreign investors in month T *.Since there can be no anticipated price jumps, the price must jump on theannouncement and then gradually appreciate in such a way that there is nojump in price when the liberalization occurs at T *. Measuring the impact ofstock market liberalization in this textbook world would be straightforward:Regress real returns on a constant, a set of control variables, and two dummies.
7 For a complete chronological listing of events in each country see Henry ~1999b!. The com-plete list of events is also available at http:00www.afajof.org.
8 I thank an anonymous referee for bringing this fact to my attention.
540 The Journal of Finance

The first dummy would pick up the level effect of the initial jump at T * 2 3,and the second dummy would measure the slope effect due to gradual priceappreciation in months T * 2 2, T * 2 1, and T *.9
Errunza and Miller ~1998! argue that, unlike the canonical example whereall market participants learn about the future opening at the same time, inpractice there is likely to be widespread information leakage prior to anyofficial announcement in emerging markets.10 Given that learning about afuture liberalization is a gradual process in which market participants re-ceive the news at different times, and given the theoretical expectation of norevaluation implementation, an event window of T * 2 7 to T * is used to testfor a revaluation effect. Again, T * refers to the implementation dates inTable I.
The magnitude and statistical significance of abnormal returns duringthe liberalization window are evaluated by estimating the following panelregression:
Rit 5 ai 1 g{Liberalizeit 1 eit . ~1!
The ai are country-specific dummies. Liberalizeit is a dummy variable thattakes on the value one in each of the eight months from T * 2 7 to T *
associated with country i ’s first stock market liberalization.11 Hence, theparameter g measures the average monthly abnormal return across all 12countries during the eight-month stock market liberalization window.
B. Multiple Stock Market Liberalizations
Table AI shows that most countries’ initial stock market liberalization didnot constitute a complete opening to foreign investors. Rather, stock marketliberalization is a gradual process generally involving several liberalizationssubsequent to the first. Inasmuch as it is part of a broader set of economicreforms geared toward increased openness, news of the first stock marketliberalization is also implicit news about the entire future schedule of stockmarket liberalizations. Consequently, future stock market liberalizations are
9 Footnote 3 explains why there will be an initial jump followed by price appreciation.10 They give an example of the leakage problem in the context of Indian ADRs.11 If all market participants learned about the liberalization at the same time and there was
no uncertainty about when the liberalization was going to occur, then the Liberalize variablewould only need to be on during the month in which the announcement occurred. In reality,however, learning about an impending liberalization is a gradual process. The technique ofallowing the dummy variable to be on during the entire announcement window is well estab-lished ~see, e.g., MacKinlay ~1997!!. This dummy variable method is a variant of standard eventstudy methodology. Standard event studies are unable to take into account exogenous shifts inthe equation parameters that may occur during the event window. The dummy variable methodavoids specification errors while yielding the same information on returns that would be ob-tained from the cumulative abnormal residual in event studies ~see Ozler ~1989! and Binder~1998!!.
Stock Market Liberalization 541

Tab
leIV
Fir
stS
tock
Mar
ket
Lib
eral
izat
ion
san
dC
onte
mp
oran
eou
sE
con
om
icR
efo
rms
T*
isth
eda
teof
the
cou
ntr
y’s
stoc
km
arke
tli
bera
liza
tion
inev
ent
tim
e.F
orex
ampl
e,in
Arg
enti
na
any
even
tli
sted
inth
eT*
26
box
occu
rred
onor
betw
een
Jun
ean
dA
ugu
stof
1989
.A
llev
ents
are
take
nfr
omT
he
Eco
nom
ist
Inte
llig
ence
Un
it:
Qu
arte
rly
Eco
nom
icR
epor
ts.
Afu
llch
ro-
nol
ogy
ofev
ents
ispr
esen
ted
inH
enry
~199
9b!.
Eve
nt
Tim
eC
oun
try,
Dat
eof
Lib
eral
izat
ion
Typ
eof
Lib
eral
izat
ion
T*
212
T*
29
T*
26
T*
23
T*
T*
13
Arg
enti
na
Nov
embe
r19
89L
imit
son
fore
ign
capi
tal
redu
ced
Air
lin
epr
ivat
izat
ion
;du
alex
chan
gera
tesy
stem
fail
s
Str
uct
ura
lad
just
men
tfu
nds
froz
en;
econ
omic
team
resi
gns
Pri
vati
zati
onst
abil
izat
ion
plan
IMF
agre
emen
tE
xch
ange
rate
deva
lued
by35
perc
ent
IMF
agre
emen
tfr
ozen
Bra
zil
Mar
ch19
88C
oun
try
Fu
nd
Fin
ance
min
iste
rre
sign
s
Sec
ond
Cru
zado
Pla
n
New
prop
osal
ssu
bmit
ted
tocr
edit
ors
Non
eC
apit
algo
ods
duti
esre
duce
dT
arif
fsre
duce
d
Ch
ile
May
1987
Cou
ntr
yF
un
dN
one
Att
empt
onP
inoc
het
’sli
fe
Non
eL
arge
stba
nks
priv
atiz
ed;
new
debt
repa
ymen
tte
rms
Non
eTw
ofl
oods
and
anea
rth
quak
e
Col
ombi
aD
ecem
ber
1991
Inve
stab
ilit
yIn
dex
jum
ps46
perc
ent
Res
tric
tion
son
prof
itre
mit
tan
ceea
sed
Tar
iffs
redu
ced;
exte
rnal
debt
refi
nan
ced
Tar
iffs
cut;
cred
itco
ntr
ols
rela
xed
Exc
han
geco
ntr
ols
ease
dP
riva
tiza
tion
ofte
leco
min
dust
rybe
gin
s
Non
e
Indi
aJu
ne
1986
Cou
ntr
yF
un
dN
one
Non
eN
one
Non
eN
one
Att
empt
onP
rim
eM
inis
ter’
sli
fe
542 The Journal of Finance

Kor
eaJu
ne
1987
Cou
ntr
yF
un
dN
one
Non
eF
alse
rum
ors
ofK
imIl
Su
ng’
sde
ath
Tar
iffs
redu
ced
onco
nsu
mer
dura
bles
Pro
trac
ted
stu
den
tpr
otes
ts
Tar
iff
cuts
ann
oun
ced
Mal
ayas
iaF
ebru
ary
1987
Cou
ntr
yF
un
dN
one
Nat
ion
alE
con
omic
Pla
n~N
EP
!fr
ozen
NE
Pto
beex
ten
ded
past
1990
Pri
vati
zati
onof
tele
com
indu
stry
Ru
bber
pric
est
abil
izat
ion
pact
reac
hed
Non
e
Mex
ico
May
1989
Inve
stab
ilit
yin
dex
jum
ps41
0pe
rcen
t
Sal
inas
elec
ted;
U.S
.go
vt.
give
s$3
.5B
tobo
ost
refo
rms
Pac
toex
ten
ded
Pri
vati
zati
onof
two
stat
em
ines
Bra
dyP
lan
appr
oved
byU
.S.
Con
gres
s;IM
Fag
reem
ent
Non
eB
rady
agre
emen
tw
ith
cred
itor
s
Th
eP
hil
ippi
nes
May
1986
Cou
ntr
yF
un
dD
ebt
resc
hed
uli
ng
sign
ed
IMF
targ
ets
mis
sed
$2.
9bi
llio
nof
publ
icde
btre
sch
edu
led
Mar
cos
over
thro
wn
Impo
rtre
stri
ctio
ns
lift
ed
Tal
ksop
enw
ith
IMF
Tai
wan
May
1986
Cou
ntr
yF
un
dN
one
Non
eIn
vest
men
tin
fore
ign
secu
riti
esal
low
ed
Non
eIm
port
ban
sli
fted
Exc
han
geco
ntr
ols
ease
d
Th
aila
nd
Jan
uar
y19
88C
oun
try
Fu
nd
Gen
eral
Yon
gch
aiyu
tca
lls
for
refo
rms
Non
eA
SE
AN
free
trad
eag
reem
ent
exte
nde
d
Non
eN
one
Non
e
Ven
ezu
ela
Jan
uar
y19
90F
ull
mar
ket
acce
ssex
cept
ban
kst
ocks
Tra
deli
bera
liza
tion
;ad
just
men
tlo
anap
prov
ed
Non
eN
one
Eas
ier
prof
itre
mit
tan
cefo
rfo
reig
nfi
rms
$680
mil
lion
stru
ctu
ral
adju
stm
ent
loan
Bra
dyde
al;
Agr
icu
ltu
ral
tari
ffs
redu
ced
Stock Market Liberalization 543

probably anticipated at the time of the first stock market liberalization.Because subsequent liberalizations are probably anticipated, there are tworelevant states of the world to consider:
State 1: When the first stock market liberalization occurs, future liberal-izations are anticipated, and it is known that they will take place with aprobability of 1.
State 2: When the first stock market liberalization occurs, future liberal-izations are anticipated, but there is some positive probability that each ofthe subsequent liberalizations will not occur.
If State 1 is the true state of the world, then the only revaluation occurswhen the first stock market liberalization is announced. Although there willbe a gradual appreciation of prices until the entire liberalization process iscompleted, this slope effect12 will be hard to detect given the noise in thedata. If State 2 is the true state of the world, then in addition to the firstprice jump there may also be revaluations as each scheduled liberalizationdate approaches and market participants receive news confirming that itwill take place according to schedule.
These two distinct states of the world raise the important question of howto measure the effects of the initial stock market liberalization versus thoseof subsequent liberalizations. Testing for revaluation effects by using a dummyvariable that takes on the value one during the event window of each andevery stock market liberalization is likely to understate the true effects ofstock market liberalization if S1 is the true state of the world. On the otherhand, it is also important to know whether subsequent stock market liber-alizations induce revaluation effects. This discussion argues for creating twodummy variables. The first, called Liberalize, takes on the value one duringthe event window of the first stock market liberalization. The second, calledLiberalize2, takes on the value one during all liberalization windows sub-sequent to the first.
C. Macroeconomic Fundamentals and Policy Endogeneity
As the ultimate goal is to estimate the size of the aggregate equity priceresponse to stock market liberalization holding expected future cash f lowsconstant, equation ~1! will need augmentation. In Sections III.C and III.DI control for expected future cash f lows by adding a set of economic reformdummies and macroeconomic fundamentals as right-hand-side variables. Moregenerally, a fundamental concern with estimating the stock price response toliberalization is that policymakers have an incentive to liberalize the stockmarket when it is doing well. A policymaker who liberalizes the stock mar-ket when prices are depressed risks being accused of selling off the countryat fire-sale prices. Summers ~1994! makes a similar point in the context of
12 Footnote 3 explains why there may be a slope effect.
544 The Journal of Finance

privatization. To the extent that stock market performance depends on eco-nomic conditions, the decision to liberalize depends on the economy’s currentand expected future performance. Although controlling for macroeconomicfundamentals partially controls for this concern, the standard event studyapproach may yield upward-biased estimates if policymakers time liberal-izations to coincide with news about positive future macroeconomic shocks.On the other hand, some liberalizations have been undertaken during cri-ses. Nevertheless, the potential endogeneity of the liberalization decisionrequires cautious interpretation of the estimated revaluation effect. This is-sue is raised again in Section III.E.
III. Results
Sections A through D estimate the average cumulative impact of a coun-try’s first stock market liberalization on aggregate market returns over theeight-month liberalization window described in Section II. Section A beginswith a benchmark specification, equation ~1!, that is comparable to Kim andSingal’s ~2000! earlier work. Sections B through D pose three alternativespecifications that take seriously the notion that comovements with foreignstock markets, contemporaneous economic reforms, or a favorable shock tomacroeconomic fundamentals might be responsible for the sharp increase invaluations. Section E discusses some of the interpretation difficulties in-volved in using a relatively long event window, and also presents resultsbased on shorter windows. All of the estimates in Sections F and G useimplementation-month-only windows. Section F also tests for a revaluationeffect using alternative event dates. Specifically, the implementation datesof all the authors in Table II are used along with exactly the same battery ofcontrols as in Sections A through E. Section G estimates the average effectof the second and all subsequent stock market liberalizations.
A. Benchmark Estimates
The results from estimating equation ~1! are given in column ~1a! of Table V.The coefficient of 0.047 on Liberalize is highly significant. On average, acountry’s first stock market liberalization is preceded by a total revaluationof 38 percent in U.S. dollar terms. The total revaluation number is calcu-lated by multiplying the average monthly abnormal return during the win-dow by the length of the window ~4.7 percent per month 3 eight months 537.6 percent!. Panel B of Table V provides estimates of the impact of liber-alization on dividend yields. The specification is identical to equation ~1!except that the left-hand-side variable is the change in the log of the divi-dend yield. The dividend yield results are not as strong as those for returns.Specifically, the coefficient of 20.024 on Liberalize in the dividend yieldspecification implies an average fall in dividend yields of about 50 basispoints. Again, this is consistent with Bekaert and Harvey ~2000! who also
Stock Market Liberalization 545

find a small fall in dividend yields around liberalization. Errunza and Miller~1998! also report dividend yield results that are not as significant as thosefor stock returns. Nevertheless, the negative coefficient on Liberalize in col-umn ~1b! of the dividend yield regressions is qualitatively consistent with aone-time equity price revaluation resulting from a fall in the cost of equitycapital.
Table V
Stock Market Reactions to First Stock Market LiberalizationThe regressions are performed using monthly stock market data from December 1976 to De-cember 1994 for Argentina, Brazil, Chile, India, Korea, Mexico, and Thailand. For the othercountries the data are monthly from December 1984 to December 1994. The dividend yield dataare also monthly and cover the period from December 1984 to December 1994. Liberalize is adummy variable for the event window of the first stock market liberalization. The event win-dow begins seven months prior to the implementation month and ends in the implementationmonth. For example, for a stock market liberalization that was implemented in November 1989,the event window begins in April 1989 and ends in November 1989. RLDC, RUS, and REAFE arethe dividend-inclusive monthly return on the IFC global index, the S&P 500, and the MorganStanley Capital Index for Europe, Asia, and the Far East, respectively. Stabilize, Trade, Pri-vatize, and Exchange are dummy variables for the event windows of macroeconomic stabiliza-tion, trade opening, privatization, and exchange controls, respectively. Each of the event windowsfor these economic reform variables begins seven months prior to the implementation of thereform and ends in the implementation month. A constant plus 11 country dummies were alsoestimated but not reported. Heteroskedasticity-consistent ~White! standard errors are inparentheses.
Panel A: Stock Returns Panel B: Dln~D0P!
~1a! ~2a! ~3a! ~4a! ~1b! ~2b! ~3b! ~4b!
Liberalize 0.047*** 0.041*** 0.039*** 0.033*** 20.024* 20.019 20.015 20.010~0.010! ~0.0124! ~0.012! ~0.011! ~0.015! ~0.015! ~0.015! ~0.017!
RLDC 0.522*** 0.517*** 0.525*** 20.350*** 20.341*** 20.339***~0.148! ~0.015! ~0.142! ~0.114! ~0.110! ~0.115!
RUS 0.250*** 0.278*** 0.278*** 20.355* 20.365* 20.446**~0.102! ~0.109! ~0.109! ~0.200! ~0.205! ~0.200!
REAFE 20.008 20.006 20.018 20.043** 20.045** 20.027~0.044! ~0.044! ~0.042! ~0.020! ~0.022! ~0.024!
Stabilize 0.003 0.003 20.003 0.003~0.010! ~0.010! ~0.010! ~0.010!
Trade 0.025*** 0.021*** 20.039*** 20.037**~0.005! ~0.048! ~0.015! ~0.016!
Privatize 0.016** 0.010 20.029 20.030~0.007! ~0.008! ~0.019! ~0.021!
Exchange 20.005 20.002 0.010 0.007~0.015! ~0.015! ~0.049! ~0.045!
OR2 0.007 0.076 0.083 0.147 0.000 0.018 0.023 0.027
No. of obs. 2292 2292 2292 2292 1569 1569 1569 1569
*, **, and *** indicate significant difference at the 10, 5, and 1 percent levels, respectively.
546 The Journal of Finance

B. Controlling for World Stock Returns
A glaring omission associated with specification ~1! is the effect of comove-ments with foreign stock markets. The following specification measures theabnormal return associated with a country’s first stock market liberalizationafter controlling for the effects of foreign stock market f luctuations:
Rit 5 ai 1 b1 RtLDC 1 b2 Rt
US 1 b3 RtEAFE 1 g{Liberalizeit 1 eit , ~2!
where RtLDC 5 the continuously compounded real dollar return on an index of
emerging market funds at time t; RtUS 5 the continuously compounded real
return on the S&P 500 index at time t; and RtEAFE 5 the continuously com-
pounded real dollar return on Morgan Stanley’s Europe, Asia, and Far East~EAFE! stock market index at time t. If the run-up in emerging marketequity prices is the result of booming foreign stock markets, then the coef-ficient on the Liberalize dummy in equation ~2! should be significantly re-duced relative to specification ~1!.
Column ~2a! of Table V shows the results. As evidenced by the sharp in-crease in adjusted R2 as compared with that in column ~1a!, the inclusion ofworld stock returns dramatically improves the regression fit. Not surpris-ingly, the largest beta is associated with other emerging market returns;own-country returns are most sensitive to movements in other emergingmarkets.13 On average, when the aggregate emerging market index rises byone percentage point, an individual country’s index will rise by 0.5 percent-age points. The U.S. beta is smaller than the emerging market beta, but isalso significant. The EAFE beta is not significant. Although comovementswith foreign stock markets are an important explanatory factor for emerg-ing market returns, their inclusion has little effect on the Liberalize coeffi-cient. The monthly point estimate is now 0.041. The coefficient on Liberalizein the dividend yield specifications is still negative, but is no longer significant.
C. Controlling for Concurrent Economic Reforms
Four variables are constructed to control for the effect of the followingeconomic reforms: macroeconomic stabilization, trade liberalization, privat-ization, and the easing of exchange controls. These variables are denotedStabilize, Trade, Privatize, and Exchange respectively. The underlying dataused to construct these variables are the policy events in Tables IV and V,and the full event list. For example, Table IV indicates that in May of 1986the Philippines lifted import restrictions. Thus, May of 1986 is T * for thisparticular trade liberalization, and the variable Trade takes on the value
13 It is possible that the strong correlation results from the fact that each country in thesample is also a part of the emerging market index. Excluding the LDC returns from theright-hand side does not alter the sign or magnitude of the other betas.
Stock Market Liberalization 547

one in each of the eight months from October 1985 through May 1986. Theexact same methodology is followed for every occurrence of each type of re-form in all 12 countries. The following panel model is then estimated:
Rit 5 ai 1 b1 RtLDC 1 b2 Rt
US 1 b3 RtEAFE 1 g1 Liberalizeit 1 g2 Stabilizeit
1 g3Tradeit 1 g4 Privatizeit 1 g5 Exchangeit 1 eit . ~3!
Column ~3a! of Table V shows the results. After controlling for world stockreturns and macroeconomic reforms, the Liberalize coefficient is now 0.039.Although they barely affect the Liberalize coefficient, the macroeconomicreforms are themselves associated with equity price revaluation. For in-stance, the coefficient on Trade is 0.025 and the Privatize coefficient is 0.016.This implies that trade liberalization and privatization are associated withcumulative revaluations of 20 percent and 13 percent respectively. The Sta-bilize coefficient also has the expected sign, but does not have a statisticallysignificant effect on stock returns.14 The coefficient on Exchange is negative,but also insignificant.
It is interesting to ask whether the estimated stock market revaluationeffects of liberalization are statistically distinguishable from those of theeconomic reforms. The null hypothesis that the Liberalize coefficient is equalto the Trade and Privatize coefficients is rejected at the 10 percent level.
Given their magnitude and significance, the Trade and Privatize coeffi-cients merit some further discussion. The Trade result is consistent withrecent studies, such as that of Sachs and Warner ~1995!, which find tradeliberalization to be the single economic reform most closely tied to futuregrowth. Trade liberalization may reduce the cost of imported intermediateinputs, thereby increasing expected future profitability.15 This interpreta-tion, that trade liberalization signals higher future profitability, is also con-sistent with the negative and significant coefficient on Trade in the dividendyield specification in column ~3b!. The sign of the Privatize coefficient isconsistent with a story that says placing state enterprises in private handsraises their efficiency and expected future profitability.16 Indeed, this storyis corroborated by Boubakri and Cosset ~1998! who find evidence that pri-vatization leads to improved firm performance.
14 Every IMF agreement is counted as a stabilization plan, but in reality some agreementsare not so much “news” in the sense of being a new stabilization plan as they are a continuationof an already existing plan. This may bias against finding a significant effect of stabilization,but is favorable to omitting some agreements and running the risk of attributing to liberaliza-tion that which is due to stabilization.
15 For a formal model along these lines see Basu and Morey ~1998!.16 The efficiency argument is one of two competing effects of privatization on equity prices.
The other effect is that the news that privatization is coming may increase the supply of sharesin the country, driving down equity prices in some models. That privatization positively impactsthe stock market would seem to suggest that the efficiency effect dominates.
548 The Journal of Finance

D. Controlling for Macroeconomic Fundamentals
After controlling for comovements with foreign markets and concurrenteconomic reforms, the first stock market liberalization still has a point es-timate of 0.039. However, macroeconomic factors have not been accountedfor. This is a potentially serious problem because of the possibility that ex-ogenous macroeconomic shocks unrelated to reform might cause a run-up inequity prices. Therefore, not accounting for country fundamentals might leadto an overstatement of the effects of stock market liberalization. This cri-tique is addressed by adding distributed lags and leads of the growth ratesof country macroeconomic fundamentals17 to the right-hand side of regres-sion ~3! as in Fama ~1981!. Let Fit be a vector of country fundamentals. Thefollowing regression is estimated:
Rit 5 ai 1 b1 RtLDC 1 b2 Rt
US 1 b3 RtEAFE 1 g1 Liberalizeit 1 g2 Stabilizeit
1 g3Tradeit 1 g4 Privatizeit 1 g5 Exchangeit 1 d~L!D~ln Fit ! 1 eit .~4!
The results are listed in column ~4a! of Table V. ~To conserve space, the esti-mates of the fundamentals are not included since they are not of direct interest.!
This time the story is substantially altered. After controlling for the funda-mentals, the Liberalize coefficient falls to 0.033. At first glance this may notseem like much of a discrepancy from the 0.047 in specification ~1!. However,cumulated over the entire eight-month liberalization window, the new esti-mate implies a total revaluation of 26 percent, or two-thirds of the total re-valuation implied by the original point estimate. Furthermore, the Privatizecoefficient is no longer significant. One possible explanation for the attenu-ation of the Privatize coefficient is that governments decide to privatize whenmacroeconomic conditions are strong. In the absence of fundamentals on theright-hand side, the Privatize dummy simply picks up this correlation. Fi-nally, the hypothesis that the Liberalize and Trade coefficients are the samecan no longer be rejected. After accounting for the effects of macroeconomic ac-tivity on the stock market, trade opening has as large a revaluation effect asstock market liberalization. That the effects of stock market liberalization aresubstantially diminished by adding macroeconomic fundamentals to the right-hand side supports the argument in Section II that policymakers time marketopenings to coincide with good economic conditions.
E. Shorter Window Lengths
In the absence of verifiable announcement dates, the four preceding sub-sections ~A–D! use an event window of eight months to capture potentialannouncement effects and to allow for the possibility of information leakage.
17 The fundamentals are domestic industrial production, the U.S. Treasury bill rate, domes-tic inf lation, the real exchange rate, and a political stability index. After trying a number ofspecifications I ended up including one-month lagged, current, and one-month leads of thefundamentals.
Stock Market Liberalization 549

The use of this relatively long event window raises the following problem ininterpreting the results. Policymakers may time stock market liberalizationin the same way that managers time equity issuance to follow a period ofsignificant run-up in their firm’s equity price ~Ritter ~1991!, Loughran andRitter ~1995!!. If this is the case then the results in Table V may be anartifact of the relatively long event window. This section reestimates theresponse of equity prices to liberalization using shorter event windows. Spe-cifically, equation ~4! is reestimated using windows of three different lengthsfor the Liberalize variable: five months ~T * 2 4 to T * !, two months ~T * 2 1to T * !, and one month ~T * only!. The reform variables remain exactly asdescribed in Section III.C.
The results, which are presented in Table VI, indicate that the equityprice revaluation associated with stock market liberalization is relativelyrobust to the choice of window length. Although the statistical significanceis not as strong as for the eight-month window, the Liberalize coefficient of0.030 for the five-month window ~T * 2 4 to T * ! is almost identical to theeight-month coefficient of 0.033. Interestingly, the point estimate for thetwo-month window ~T * 2 1 to T * !, 0.050, is larger than that for both thefive-month and eight-month windows. The implementation-month-only ~T * !point estimate, 0.065, is the largest of all. The fact that the strongest resultsare those for the window that is least susceptible to the market-timing cri-tique is indeed suggestive of a revaluation effect of stock market liberaliza-tion. Given that the interpretation difficulties are least severe with theimplementation-month-only estimation windows, all of the results in Sec-tions III.F and III.G will rely on estimates using T * only windows.
F. Other Initial Stock Market Liberalization Dates
Sections III.A through III.E present results based on the stock marketliberalization dates in Table I. Now I estimate the impact of stock marketliberalization using the other liberalization dates. The Appendix provides, inTable AII, a chronological listing of all the unique liberalization dates inTable II, columns ~2! through ~5!. A variable called LiberalizeAll, which takesa value of one on each of the implementation dates listed in column ~1! ofTable AII, is created. The specifications given in equations ~1! through ~4!are reestimated, replacing Liberalize with LiberalizeAll. The LiberalizeAllcoefficient can be interpreted as the average implementation-month-only re-valuation across all the unique liberalization dates in Table II.
Table AIII, columns ~1a! through ~4a!, presents the results. The Liberalizecoefficient is highly significant in all stock return regressions. After control-ling for all relevant factors, the coefficient of 0.052 on LiberalizeAll is slightlysmaller than the coefficient of 0.065 on the Liberalize variable in Table VI.18
The fall in dividend yields is only statistically significant in the first regres-sion ~1b!, but the results in specifications ~2b! through ~4b! are qualitatively
18 That the point estimate for LiberalizeAll is somewhat smaller than that for Liberalize isconsistent with the fact that a number of the stock market liberalization dates used in con-structing LiberalizeAll occur later than those used to construct Liberalize.
550 The Journal of Finance
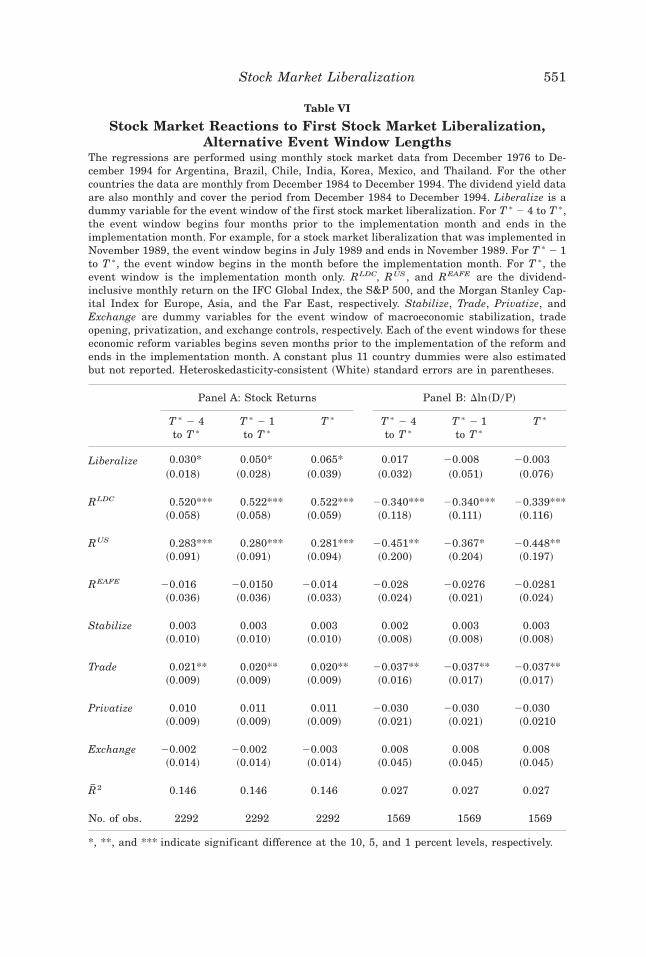
Table VI
Stock Market Reactions to First Stock Market Liberalization,Alternative Event Window Lengths
The regressions are performed using monthly stock market data from December 1976 to De-cember 1994 for Argentina, Brazil, Chile, India, Korea, Mexico, and Thailand. For the othercountries the data are monthly from December 1984 to December 1994. The dividend yield dataare also monthly and cover the period from December 1984 to December 1994. Liberalize is adummy variable for the event window of the first stock market liberalization. For T * 2 4 to T *,the event window begins four months prior to the implementation month and ends in theimplementation month. For example, for a stock market liberalization that was implemented inNovember 1989, the event window begins in July 1989 and ends in November 1989. For T * 2 1to T *, the event window begins in the month before the implementation month. For T *, theevent window is the implementation month only. RLDC, RUS, and REAFE are the dividend-inclusive monthly return on the IFC Global Index, the S&P 500, and the Morgan Stanley Cap-ital Index for Europe, Asia, and the Far East, respectively. Stabilize, Trade, Privatize, andExchange are dummy variables for the event window of macroeconomic stabilization, tradeopening, privatization, and exchange controls, respectively. Each of the event windows for theseeconomic reform variables begins seven months prior to the implementation of the reform andends in the implementation month. A constant plus 11 country dummies were also estimatedbut not reported. Heteroskedasticity-consistent ~White! standard errors are in parentheses.
Panel A: Stock Returns Panel B: Dln~D0P!
T * 2 4to T *
T * 2 1to T *
T * T * 2 4to T *
T * 2 1to T *
T *
Liberalize 0.030* 0.050* 0.065* 0.017 20.008 20.003~0.018! ~0.028! ~0.039! ~0.032! ~0.051! ~0.076!
RLDC 0.520*** 0.522*** 0.522*** 20.340*** 20.340*** 20.339***~0.058! ~0.058! ~0.059! ~0.118! ~0.111! ~0.116!
RUS 0.283*** 0.280*** 0.281*** 20.451** 20.367* 20.448**~0.091! ~0.091! ~0.094! ~0.200! ~0.204! ~0.197!
REAFE 20.016 20.0150 20.014 20.028 20.0276 20.0281~0.036! ~0.036! ~0.033! ~0.024! ~0.021! ~0.024!
Stabilize 0.003 0.003 0.003 0.002 0.003 0.003~0.010! ~0.010! ~0.010! ~0.008! ~0.008! ~0.008!
Trade 0.021** 0.020** 0.020** 20.037** 20.037** 20.037**~0.009! ~0.009! ~0.009! ~0.016! ~0.017! ~0.017!
Privatize 0.010 0.011 0.011 20.030 20.030 20.030~0.009! ~0.009! ~0.009! ~0.021! ~0.021! ~0.0210
Exchange 20.002 20.002 20.003 0.008 0.008 0.008~0.014! ~0.014! ~0.014! ~0.045! ~0.045! ~0.045!
OR2 0.146 0.146 0.146 0.027 0.027 0.027
No. of obs. 2292 2292 2292 1569 1569 1569
*, **, and *** indicate significant difference at the 10, 5, and 1 percent levels, respectively.
Stock Market Liberalization 551

consistent with the stock return results. As in Tables V and VI, the Trade co-efficient is highly significant in all dividend yield regressions, indicating thata move toward freer trade is seen as improving future growth prospects. Col-umn ~2! of Table AII lists all of the unique dates in columns ~3! through ~5! ofTable II. Column ~5a! of Table AIII presents stock return estimates using thesedates. The coefficient on LiberalizeAll in this case is 0.051.
G. Stock Market Liberalizations Subsequent to the First
Sections III.A through III.F analyze whether revaluations occur in antici-pation of the first stock market liberalization. In order to test whether re-valuations occur in anticipation of subsequent stock market liberalizations,a second set of regressions is run which no longer looks at countries’ firststock market liberalization in isolation. A new variable called Liberalize2 iscreated which takes on the value one during the implementation month ofall the stock market liberalizations listed in Table AI. Again, as in Sec-tion III.F, since the dummy variable is on during the implementation monthonly, the total revaluation effect is the same as the point estimate. The analy-sis begins by estimating
Rit 1 ai 1 g1 Liberalizeit 1 g2 Liberalize2 1 eit , ~5!
and proceeds to augment specification ~5! with the identical set of right-hand side variables used as controls in Sections III.B through III.D.
The results are reported in Table AIV in the Appendix. Regression ~1a!indicates that the coefficient on Liberalize2 is 0.030, but it is statisticallyinsignificant. The Liberalize coefficient is now 0.101, and the hypothesisthat the estimated Liberalize and Liberalize2 coefficients are statisticallythe same is rejected at the 5 percent level. On average, subsequent stockmarket liberalizations have less of a valuation effect than the first. Regres-sion ~2a! illustrates that including world stock returns on the right-handside does not change either set of coefficients very much.
Regression ~3a! of Table AIV demonstrates that after including contempo-raneous reforms the Liberalize coefficient is not affected much. Liberalize2continues to be statistically insignificant, and the Trade and Privatize coef-f icients are similar in magnitude to the estimates in Table V. Regres-sion ~4a!, which includes the macroeconomic fundamentals, shows that theLiberalize coefficient has fallen from 0.101 in regression ~1a! to 0.066. Thetrue implementation-month-only revaluation effect of the first stock marketliberalization is about two-thirds of what one is led to believe in the absenceof controls. This corroborates the story that emerged from Table V where thetrue cumulative eight-month revaluation effect also was about two-thirds aslarge as in the absence of controls. The Liberalize2 coefficient has fallenfrom 0.030 in regression ~1a! to 0.022 and is still statistically insignificant.
The statistically insignificant Liberalize2 coefficient lends itself to twopossible interpretations. First, it could be that the revaluation effects of sub-sequent stock market liberalizations are not detectable at the time they oc-cur because they are anticipated at the time of the first stock market
552 The Journal of Finance
liberalization ~Urias ~1994! makes a similar argument in the context of ADRs!.Second, it is possible that once the initial liberalization occurs, new countryfunds ~the majority of subsequent liberalizations! provide minimal diversi-fication benefits because they are spanned by existing funds ~Diwan, Errunza,and Senbet ~1993!!. In other words, it is possible that the first liberalizationeffectively integrates the market.
IV. Alternative Explanations
The central message from Sections III.A to III.F is that a substantial ap-preciation of aggregate share prices occurs both in the months leading up tothe implementation of a country’s initial stock market liberalization as well asin the implementation month itself. On average, in the eight-month windowpreceding its initial stock market liberalization, a country’s aggregate shareprice index experiences a 38 percent increase in real dollar terms. After con-trolling for relevant factors, the revaluation is about 26 percent. About 6.6 per-cent of this revaluation takes place in the actual implementation month. Themacroeoconomic reforms are themselves a significant source of share price re-valuation. In particular, the stock market experiences a total revaluation of2.1 percent per month in each of the eight months leading up to a trade lib-eralization. These results certainly suggest a revaluation of aggregate shareprices in anticipation of future stock market liberalization and trade liberal-ization. Nevertheless, it is not clear that we can infer causation.
Suppose a trade reform occurs before a stock market liberalization. Wemight end up attributing any associated stock market revaluation to thetrade reform and not to the stock market liberalization. However, the re-valuation might really be due to the stock market liberalization, but themarket knows that stock market liberalizations usually follow trade re-forms. In fact, the sequencing literature ~Dornbusch ~1983!, Edwards ~1984!,and McKinnon ~1991!! advocates trade liberalization first, followed by cap-ital account liberalization. Given the inf luence of this literature on the pol-icy reform debate in developing countries during the 1980s, it is more thanplausible that trade liberalizations were seen as a harbinger of future stockmarket liberalizations. Analogously, the possibility remains that when a stockmarket liberalization is implemented, equity prices jump because stock mar-ket liberalization is interpreted as a signal of future macroeconomic reforms.
V. Conclusions
The standard IAPM makes a salient prediction about an emerging countrythat does not allow foreigners to purchase shares in its stock market: Thecountry’s aggregate cost of equity capital will fall when it opens its stockmarket to foreign investors. Equivalently stated, holding expected futurecash f lows constant, we should see an increase in an emerging country’sequity price index when the market learns of an impending future stockmarket liberalization. This paper examines whether the data are consistentwith this theoretical prediction.
Stock Market Liberalization 553
The paper attempts to hold expected future cash f lows constant by aug-menting the standard event study analysis with a set of right-hand-side vari-ables that control for major economic policy changes such as macroeconomicstabilization programs, trade liberalizations, privatizations, and the easing ofexchange controls. The analysis also controls for comovements with foreign stockmarkets and macroeconomic fundamentals. Finally, the paper confronts the po-tential endogeneity problem that arises out of policymakers’ incentive to lib-eralize the stock market in response to a prolonged run-up in equity prices.
Bearing in mind all of the caveats about inferring causality, it is instructiveto do some simple calculations. Suppose that the preliberalization discount rateon equity is 20 percent and that the entire revaluation effect is 26 percent—the size of the response to the first stock market liberalization. Since we areholding expected future cash f lows constant and using logarithmic returns, thisrevaluation means that the cost of equity capital also falls by 26 percent. Thisimplies a fall in the level of the discount rate to about 15 percent. If one usesthe more conservative, implementation-month-only revaluation effect of 6.5 per-cent, the implied level of the postliberalization discount rate is on the order of19 percent. Stulz ~1999a, 1999b! argues that the magnitudes of the fall in thelevel of the discount rate implied by such estimates are small relative to whatwe would expect in a world where ~1! there was no home bias and ~2! liberal-izations were implemented in a fully credible, once-and-for-all fashion.
An important question for future research lies in assessing whether whatseems like a relatively small revaluation effect has any economic signifi-cance. At the macroeconomic level, Henry ~1999a! finds that stock marketliberalizations are consistently followed by a surge in the growth rate ofprivate physical investment. Although this suggests significant economic ef-fects of stock market liberalization, further research is needed. In particu-lar, future research should work to uncover the sector-specific, valuation,cost of capital, and investment effects of stock market liberalization.
The fact that aggregate valuation seems to increase in anticipation of fu-ture trade liberalizations also points to a potentially fruitful line of research.Trade liberalization has heterogeneous effects on exporters and importers;an analysis of firm level data would deepen our understanding of the sector-specific valuation impacts of trade liberalization. More generally, if the goalis to understand emerging financial markets, then the fact that emergingstock markets respond to macroeconomic reforms suggests that there is pos-itive value added to careful documentation and explicit statistical use ofmacroeconomic policy changes.
Appendix
Details of the stock market liberalization dates studied in addition to thosein Table I are provided in the following four tables. Table AI shows that mostcountries’ initial stock market liberalizations did not constitute a completeopening to foreign investors, Table AII provides a listing of all the uniqueliberalization dates in Table II, and Tables AIII and AIV provide details ofregressions of stock market reactions to alternative initial liberalization datesand subsequent liberalization dates, respectively.
554 The Journal of Finance

Tab
leA
I
Su
bse
qu
ent
Sto
ckM
ark
etL
iber
aliz
atio
ns
and
Con
tem
por
aneo
us
Eco
no
mic
Ref
orm
sT*
isth
eda
teof
the
cou
ntr
y’s
stoc
km
arke
tli
bera
liza
tion
inev
ent
tim
e.A
llev
ents
are
take
nfr
omT
he
Eco
nom
ist
Inte
llig
ence
Un
it:
Qu
arte
rly
Eco
nom
icR
epor
ts.A
full
chro
nol
ogy
ofev
ents
ispr
esen
ted
inH
enry
~199
9b!.
Cou
ntr
y,O
pen
ing
Dat
eT
ype
ofO
pen
ing
T*
212
T*
29
T*
26
T*
23
T*
T*
13
Arg
enti
na
Jan
uar
y91
Inve
stab
leIn
dex
jum
ps19
perc
ent
Non
eA
irli
ne
and
ship
priv
atiz
atio
ns
begi
n
Str
uct
ura
lad
just
-m
ent
fun
dsu
n-
froz
en
IMF
agre
emen
t;pr
ivat
izat
ion
sD
omin
goC
aval
loap
poin
ted
fin
ance
min
iste
r
Tar
iff
redu
ctio
ns
Jan
uar
y92
Cou
ntr
yF
un
dN
one
Pri
vati
zati
ons
IMF
stan
dby
loan
Non
eIM
Fap
prov
esec
onom
icpl
anIM
Fag
reem
ent;
Bra
dyde
al
Bra
zil
Oct
ober
88C
oun
try
Fu
nd
Non
eN
one
Non
eIM
Fap
prov
esec
onom
icpr
o-gr
am;
impo
rtba
nli
fted
Cre
dito
rsra
tify
new
loan
agre
e-m
ent
Th
ird
Cru
zado
Pla
n
Apr
il90
Inve
stab
ilit
yIn
dex
jum
ps33
perc
ent
IMF
talk
sop
en;
stoc
km
arke
tsc
anda
l
Tar
iffs
redu
ced
Pri
vati
zati
onpr
oces
sfr
ozen
Non
eC
ollo
rta
kes
offi
ce,
swee
pin
gde
regu
lati
ons
Tar
iffs
redu
ced;
curb
onpr
ofit
rem
itta
nce
rem
oved
Jan
uar
y91
Inve
stab
ilit
yIn
dex
jum
ps34
perc
ent
Non
eN
one
IMF
talk
sop
enD
ereg
ula
tion
mea
sure
san
-n
oun
ced;
debt
rest
ruct
uri
ng
reje
cted
Sec
ond
Col
lor
Pla
nN
one
July
91In
vest
abil
ity
Inde
xju
mps
185
perc
ent;
Non
eN
one
Non
eA
gree
men
ton
paym
ent
ofar
-re
ars
IMF
neg
otia
tion
sbe
gin
;pr
ivat
iza-
tion
s
Non
e
May
92C
oun
try
Fu
nd
Non
eN
one
IMF
appr
oves
an
ewst
and
bylo
an
Neg
otia
tion
sbe
-gi
non
Bra
dyde
al
Bra
dyde
btde
alsi
gned
;of
fici
alch
arge
sof
cor-
rupt
ion
agai
nst
Col
lor
Non
e
con
tin
ued
Stock Market Liberalization 555
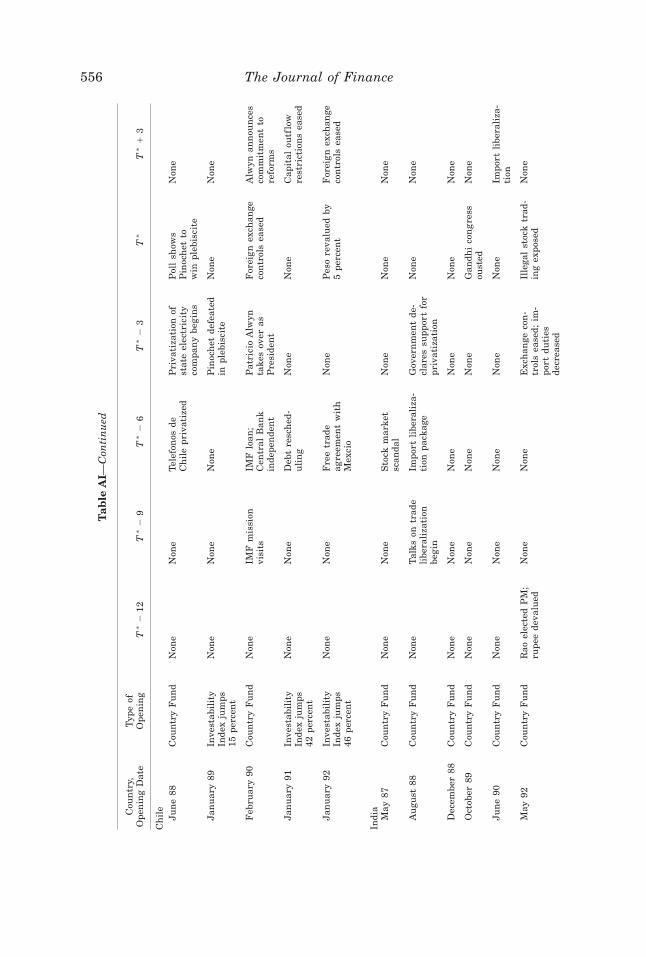
Tab
leA
I—C
onti
nu
ed
Cou
ntr
y,O
pen
ing
Dat
eT
ype
ofO
pen
ing
T*
212
T*
29
T*
26
T*
23
T*
T*
13
Ch
ile
Jun
e88
Cou
ntr
yF
un
dN
one
Non
eTe
lefo
nos
deC
hil
epr
ivat
ized
Pri
vati
zati
onof
stat
eel
ectr
icit
yco
mpa
ny
begi
ns
Pol
lsh
ows
Pin
och
etto
win
pleb
isci
te
Non
e
Jan
uar
y89
Inve
stab
ilit
yIn
dex
jum
ps15
perc
ent
Non
eN
one
Non
eP
inoc
het
defe
ated
inpl
ebis
cite
Non
eN
one
Feb
ruar
y90
Cou
ntr
yF
un
dN
one
IMF
mis
sion
visi
tsIM
Flo
an;
Cen
tral
Ban
kin
depe
nde
nt
Pat
rici
oA
lwyn
take
sov
eras
Pre
side
nt
For
eign
exch
ange
con
trol
sea
sed
Alw
ynan
nou
nce
sco
mm
itm
ent
tore
form
s
Jan
uar
y91
Inve
stab
ilit
yIn
dex
jum
ps42
perc
ent
Non
eN
one
Deb
tre
sch
ed-
uli
ng
Non
eN
one
Cap
ital
outf
low
rest
rict
ion
sea
sed
Jan
uar
y92
Inve
stab
ilit
yIn
dex
jum
ps46
perc
ent
Non
eN
one
Fre
etr
ade
agre
emen
tw
ith
Mex
cio
Non
eP
eso
reva
lued
by5
perc
ent
For
eign
exch
ange
con
trol
sea
sed
Indi
aM
ay87
Cou
ntr
yF
un
dN
one
Non
eS
tock
mar
ket
scan
dal
Non
eN
one
Non
e
Au
gust
88C
oun
try
Fu
nd
Non
eT
alks
ontr
ade
libe
rali
zati
onbe
gin
Impo
rtli
bera
liza
-ti
onpa
ckag
eG
over
nm
ent
de-
clar
essu
ppor
tfo
rpr
ivat
izat
ion
Non
eN
one
Dec
embe
r88
Cou
ntr
yF
un
dN
one
Non
eN
one
Non
eN
one
Non
e
Oct
ober
89C
oun
try
Fu
nd
Non
eN
one
Non
eN
one
Gan
dhi
con
gres
sou
sted
Non
e
Jun
e90
Cou
ntr
yF
un
dN
one
Non
eN
one
Non
eN
one
Impo
rtli
bera
liza
-ti
on
May
92C
oun
try
Fu
nd
Rao
elec
ted
PM
;ru
pee
deva
lued
Non
eN
one
Exc
han
geco
n-
trol
sea
sed;
im-
port
duti
esde
crea
sed
Ille
gal
stoc
ktr
ad-
ing
expo
sed
Non
e
556 The Journal of Finance

Indi
a~c
onti
nu
ed!
May
94C
oun
try
Fu
nd
Gov
ern
men
tfa
ces
no
con
fide
nce
vote
Non
eN
one
Non
eF
orei
gner
sca
nen
ter
tele
com
indu
stry
Non
e
Sep
tem
ber
94C
oun
try
Fu
nd
Non
eN
one
Non
eN
one
Non
eN
one
Kor
eaD
ecem
ber
88G
over
nm
ent
ann
oun
ces
plan
toop
enst
ock
mar
ket
Roh
Tae
Woo
elec
ted
pres
iden
tT
arif
fsre
duce
don
con
sum
erdu
rabl
es
Non
eM
inim
um
wag
ein
crea
sed
by23
perc
ent
Inte
rest
rate
sde
regu
late
dIn
vest
men
tin
fore
ign
real
esta
teal
low
ed
July
90C
oun
try
Fu
nd
Non
eN
one
Non
eN
orth
Kor
eapr
opos
esdi
sarm
amen
t
Dip
lom
atic
rela
-ti
ons
wit
hU
SS
RN
one
Mar
ch91
Cou
ntr
yF
un
dN
one
Non
eN
one
Non
eN
one
Non
eJa
nu
ary
92F
orei
gner
sal
low
edto
hol
du
pto
10pe
r-ce
nt
ofm
arke
t
Non
eN
one
For
eign
firm
sal
low
edto
hol
dre
tail
outl
ets
Lim
iton
fore
ign
ban
ksis
sue
ofcd
sea
sed
Ban
kba
ilou
tof
$680
mil
lion
Nor
thK
orea
agre
esto
mil
itar
yin
spec
tion
Oct
ober
92In
vest
abil
ity
Inde
xju
mps
23pe
rcen
t
Non
eN
one
Non
eP
ensi
onfu
nds
urg
edto
buy
mor
eeq
uit
y
Kim
You
ng
Sam
elec
ted
pres
iden
tN
one
July
93C
oun
try
Fu
nd
Non
eN
one
Gov
ern
orof
Ban
kof
Kor
eais
sack
ed
Fin
anci
alre
form
plan
publ
ish
edF
orei
gner
sca
nbu
yco
nve
rtib
lebo
nds
Rea
ln
ame
fin
an-
cial
syst
emde
cree
Dec
embe
r93
Cou
ntr
yF
un
dN
one
Non
eN
one
Len
din
gra
tes
libe
rali
zed
GA
TT
;ta
riff
re-
duct
ion
agre
e-m
ents
For
eign
ban
ksad
mit
ted
Dec
embe
r94
For
eign
equ
ity
ceil
ing
rais
edto
12pe
rcen
t
Non
eM
anu
fact
uri
ng
firm
sca
nis
sue
un
lim
ited
corp
o-ra
tebo
nds
Kim
IlS
un
gdi
esN
one
Non
eN
one
Mal
aysi
aD
ecem
ber
87C
oun
try
Fu
nd
Non
eN
one
Pos
sibl
ecu
tin
corp
orat
eta
xra
tean
nou
nce
d
90ar
rest
su
nde
rIn
tern
alS
ecu
rity
Act
Non
e$1
bill
ion
resc
ue
plan
for
depo
si-
tors
Apr
il89
Cou
ntr
yF
un
dM
ost
favo
red
nat
ion
trad
epa
ctw
ith
Ch
ina
Non
eA
SE
AN
-Jap
anD
evel
opm
ent
Fu
nd
loan
s
Non
eN
one
Hia
tus
onre
-st
ruct
uri
ng
fore
ign
equ
ity
Apr
il90
Cou
ntr
yF
un
dN
one
Ban
ksal
low
edto
purc
has
est
ock
152
firm
sde
list
from
Sin
gapo
reS
tock
Exc
han
ge
Non
eP
lan
for
elec
tric
-it
ypr
ivat
izat
ion
Non
e
Stock Market Liberalization 557
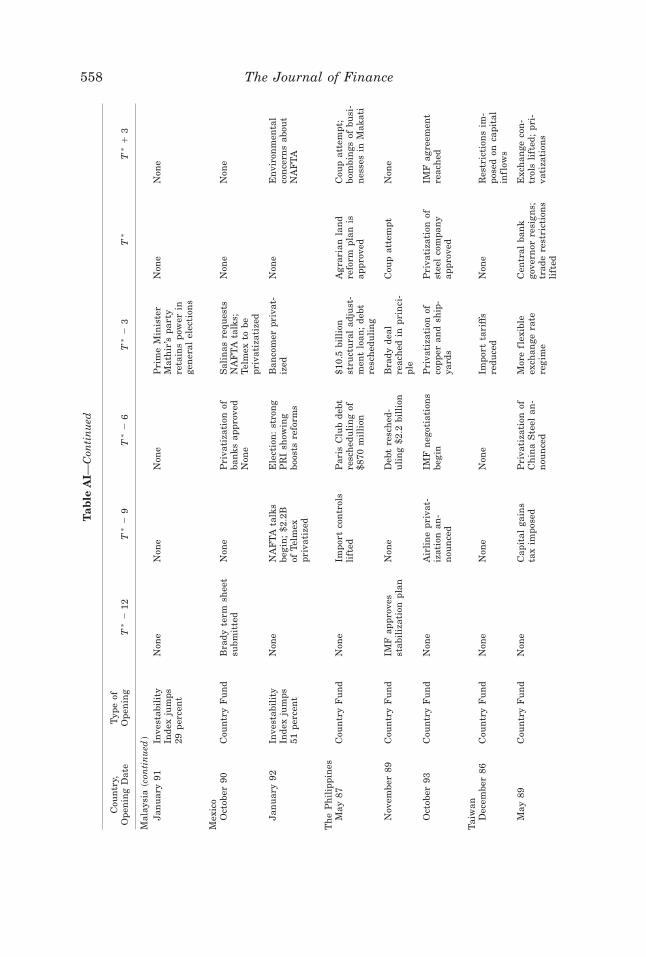
Tab
leA
I—C
onti
nu
ed
Cou
ntr
y,O
pen
ing
Dat
eT
ype
ofO
pen
ing
T*
212
T*
29
T*
26
T*
23
T*
T*
13
Mal
aysi
a~c
onti
nu
ed!
Jan
uar
y91
Inve
stab
ilit
yIn
dex
jum
ps29
perc
ent
Non
eN
one
Non
eP
rim
eM
inis
ter
Mat
hir
’spa
rty
reta
ins
pow
erin
gen
eral
elec
tion
s
Non
eN
one
Mex
ico
Oct
ober
90C
oun
try
Fu
nd
Bra
dyte
rmsh
eet
subm
itte
dN
one
Pri
vati
zati
onof
ban
ksap
prov
edN
one
Sal
inas
requ
ests
NA
FT
Ata
lks;
Telm
exto
bepr
ivat
izat
ized
Non
eN
one
Jan
uar
y92
Inve
stab
ilit
yIn
dex
jum
ps51
perc
ent
Non
eN
AF
TA
talk
sbe
gin
;$2
.2B
ofTe
lmex
priv
atiz
ed
Ele
ctio
n:
stro
ng
PR
Ish
owin
gbo
osts
refo
rms
Ban
com
erpr
ivat
-iz
edN
one
En
viro
nm
enta
lco
nce
rns
abou
tN
AF
TA
Th
eP
hil
ippi
nes
May
87C
oun
try
Fu
nd
Non
eIm
port
con
trol
sli
fted
Par
isC
lub
debt
resc
hed
uli
ng
of$8
70m
illi
on
$10.
5bi
llio
nst
ruct
ura
lad
just
-m
ent
loan
;de
btre
sch
edu
lin
g
Agr
aria
nla
nd
refo
rmpl
anis
appr
oved
Cou
pat
tem
pt;
bom
bin
gsof
busi
-n
esse
sin
Mak
ati
Nov
embe
r89
Cou
ntr
yF
un
dIM
Fap
prov
esst
abil
izat
ion
plan
Non
eD
ebt
resc
hed
-u
lin
g$2
.2bi
llio
nB
rady
deal
reac
hed
inpr
inci
-pl
e
Cou
pat
tem
ptN
one
Oct
ober
93C
oun
try
Fu
nd
Non
eA
irli
ne
priv
at-
izat
ion
an-
nou
nce
d
IMF
neg
otia
tion
sbe
gin
Pri
vati
zati
onof
copp
eran
dsh
ip-
yard
s
Pri
vati
zati
onof
stee
lco
mpa
ny
appr
oved
IMF
agre
emen
tre
ach
ed
Tai
wan
Dec
embe
r86
Cou
ntr
yF
un
dN
one
Non
eN
one
Impo
rtta
riff
sre
duce
dN
one
Res
tric
tion
sim
-po
sed
onca
pita
lin
flow
s
May
89C
oun
try
Fu
nd
Non
eC
apit
alga
ins
tax
impo
sed
Pri
vati
zati
onof
Ch
ina
Ste
elan
-n
oun
ced
Mor
efl
exib
leex
chan
gera
tere
gim
e
Cen
tral
ban
kgo
vern
orre
sign
s;tr
ade
rest
rict
ion
sli
fted
Exc
han
geco
n-
trol
sli
fted
;pr
i-va
tiza
tion
s
558 The Journal of Finance
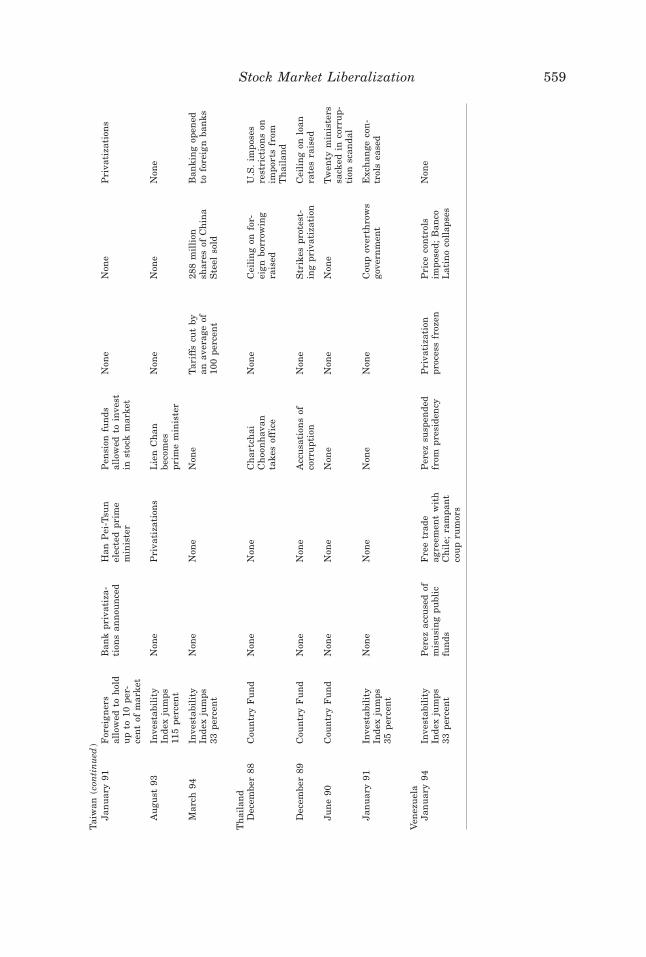
Tai
wan
~con
tin
ued
!Ja
nu
ary
91F
orei
gner
sal
low
edto
hol
du
pto
10pe
r-ce
nt
ofm
arke
t
Ban
kpr
ivat
iza-
tion
san
nou
nce
dH
anP
ei-T
sun
elec
ted
prim
em
inis
ter
Pen
sion
fun
dsal
low
edto
inve
stin
stoc
km
arke
t
Non
eN
one
Pri
vati
zati
ons
Au
gust
93In
vest
abil
ity
Inde
xju
mps
115
perc
ent
Non
eP
riva
tiza
tion
sL
ien
Ch
anbe
com
espr
ime
min
iste
r
Non
eN
one
Non
e
Mar
ch94
Inve
stab
ilit
yIn
dex
jum
ps33
perc
ent
Non
eN
one
Non
eT
arif
fscu
tby
anav
erag
eof
100
perc
ent
288
mil
lion
shar
esof
Ch
ina
Ste
elso
ld
Ban
kin
gop
ened
tofo
reig
nba
nks
Th
aila
nd
Dec
embe
r88
Cou
ntr
yF
un
dN
one
Non
eC
har
tch
aiC
hoo
nh
avan
take
sof
fice
Non
eC
eili
ng
onfo
r-ei
gnbo
rrow
ing
rais
ed
U.S
.im
pose
sre
stri
ctio
ns
onim
port
sfr
omT
hai
lan
d
Dec
embe
r89
Cou
ntr
yF
un
dN
one
Non
eA
ccu
sati
ons
ofco
rru
ptio
nN
one
Str
ikes
prot
est-
ing
priv
atiz
atio
nC
eili
ng
onlo
anra
tes
rais
ed
Jun
e90
Cou
ntr
yF
un
dN
one
Non
eN
one
Non
eN
one
Twen
tym
inis
ters
sack
edin
corr
up-
tion
scan
dal
Jan
uar
y91
Inve
stab
ilit
yIn
dex
jum
ps35
perc
ent
Non
eN
one
Non
eN
one
Cou
pov
erth
row
sgo
vern
men
tE
xch
ange
con
-tr
ols
ease
d
Ven
ezu
ela
Jan
uar
y94
Inve
stab
ilit
yIn
dex
jum
ps33
perc
ent
Per
ezac
cuse
dof
mis
usi
ng
publ
icfu
nds
Fre
etr
ade
agre
emen
tw
ith
Ch
ile;
ram
pan
tco
up
rum
ors
Per
ezsu
spen
ded
from
pres
iden
cyP
riva
tiza
tion
proc
ess
froz
enP
rice
con
trol
sim
pose
d;B
anco
Lat
ino
coll
apse
s
Non
e
Stock Market Liberalization 559
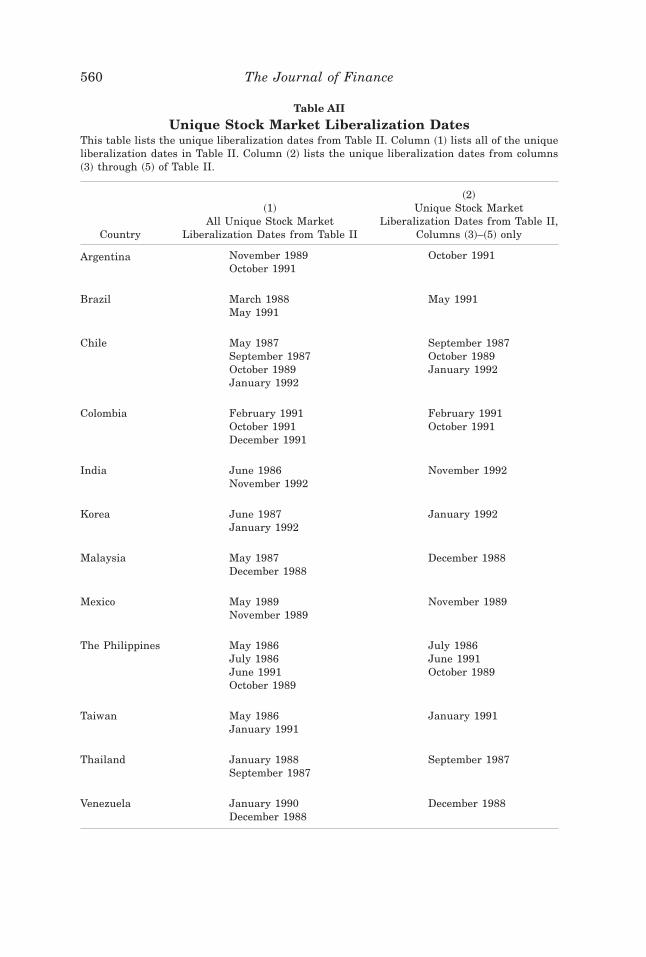
Table AII
Unique Stock Market Liberalization DatesThis table lists the unique liberalization dates from Table II. Column ~1! lists all of the uniqueliberalization dates in Table II. Column ~2! lists the unique liberalization dates from columns~3! through ~5! of Table II.
Country
~1!All Unique Stock Market
Liberalization Dates from Table II
~2!Unique Stock Market
Liberalization Dates from Table II,Columns ~3!–~5! only
Argentina November 1989October 1991
October 1991
Brazil March 1988May 1991
May 1991
Chile May 1987September 1987October 1989January 1992
September 1987October 1989January 1992
Colombia February 1991October 1991December 1991
February 1991October 1991
India June 1986November 1992
November 1992
Korea June 1987January 1992
January 1992
Malaysia May 1987December 1988
December 1988
Mexico May 1989November 1989
November 1989
The Philippines May 1986July 1986June 1991October 1989
July 1986June 1991October 1989
Taiwan May 1986January 1991
January 1991
Thailand January 1988September 1987
September 1987
Venezuela January 1990December 1988
December 1988
560 The Journal of Finance

Tab
leA
III
Sto
ckM
ark
etR
eact
ion
sto
Fir
stS
tock
Mar
ket
Lib
eral
izat
ion
,Alt
ern
ati
ve
Ev
ent
Da
tes
Th
ere
gres
sion
sar
epe
rfor
med
usi
ng
mon
thly
stoc
km
arke
tda
tafr
omD
ecem
ber
1976
toD
ecem
ber
1994
for
Arg
enti
na,
Bra
zil,
Ch
ile,
Indi
a,K
orea
,M
exic
o,an
dT
hai
lan
d.F
orth
eot
her
cou
ntr
ies
the
data
are
mon
thly
from
Dec
embe
r19
84to
Dec
embe
r19
94.
Th
edi
vide
nd
yiel
dda
taar
eal
som
onth
lyan
dco
ver
the
peri
odfr
omD
ecem
ber
1984
toD
ecem
ber
1994
.L
iber
aliz
eis
adu
mm
yth
atta
kes
onth
eva
lue
one
duri
ng
the
impl
emen
tati
onm
onth
ofth
efi
rst
stoc
km
arke
tli
bera
liza
tion
.R
LD
C,
RU
S,
and
RE
AF
Ear
eth
edi
vide
nd-
incl
usi
vem
onth
lyre
turn
onth
eIF
CG
loba
lIn
dex,
the
S&
P50
0,an
dth
eM
orga
nS
tan
ley
Cap
ital
Inde
xfo
rE
uro
pe,A
sia,
and
the
Far
Eas
t,re
spec
tive
ly.
Sta
bili
ze,
Tra
de,
Pri
vati
ze,
and
Exc
han
gear
edu
mm
yva
riab
les
for
the
even
tw
indo
ws
ofm
acro
econ
omic
stab
iliz
atio
n,
trad
eop
enin
g,pr
ivat
izat
ion
,an
dex
chan
geco
ntr
ols
resp
ecti
vely
.E
ach
ofth
eev
ent
win
dow
sfo
rth
ese
vari
able
sbe
gin
sse
ven
mon
ths
prio
rto
the
impl
emen
tati
onof
the
refo
rman
den
dsin
the
impl
emen
tati
onm
onth
.Aco
nst
ant
plu
s11
cou
ntr
ydu
mm
ies
wer
eal
soes
tim
ated
but
not
repo
rted
.H
eter
oske
dast
icit
y-co
nsi
sten
t~W
hit
e!st
an-
dard
erro
rsar
ein
pare
nth
eses
.
Pan
elA
:S
tock
Ret
urn
sP
anel
B:
Dln
~D0P
!
~1a!
~2a!
~3a!
~4a!
~5a!
~1b!
~2b!
~3b!
~4b!
~5b!
Lib
eral
ize
0.07
2***
0.05
7**
0.05
6**
0.05
2**
0.05
1*2
0.05
1*2
0.04
12
0.04
12
0.03
42
0.04
0~0
.024
!~0
.025
!~0
.024
!~0
.024
!~0
.027
!~0
.029
!~0
.030
!~0
.030
!~0
.035
!~0
.041
!
RL
DC
0.51
2***
0.50
7***
0.51
6***
0.51
9***
20.
343*
**2
0.33
4***
20.
334*
**2
0.33
5***
~0.0
63!
~0.0
62!
~0.0
59!
~0.1
43!
~0.1
03!
~0.1
03!
~0.1
04!
~0.1
16!
RU
S0.
266*
**0.
272*
**0.
293*
**0.
293*
**2
0.36
3***
20.
372*
**2
0.45
2***
20.
453*
*~0
.100
!~0
.100
!~0
.094
!~0
.108
!~0
.140
!~0
.140
!~0
.156
!~0
.205
!
RE
AF
E2
0.00
42
0.00
22
0.01
42
0.01
52
0.04
52
0.04
72
0.02
92
0.02
9~0
.036
!~0
.036
!~0
.033
!~0
.042
!~0
.054
!~0
.055
!~0
.056
!~0
.024
!
Sta
bili
ze0.
004
0.00
30.
003
20.
003
0.00
30.
003
~0.0
13!
~0.0
11!
~0.0
05!
~0.0
24!
~0.0
23!
~0.0
08!
Trad
e0.
025*
**0.
021*
**0.
021*
**2
0.03
9**
20.
037*
*2
0.03
7**
~0.0
08!
~0.0
08!
~0.0
05!
~0.0
16!
~0.0
17!
~0.0
16!
Pri
vati
ze0.
017*
0.01
10.
011
20.
030*
20.
030
20.
030
~0.0
10!
~0.0
08!
~0.0
01!
~0.0
18!
~0.0
17!
~0.0
22!
Exc
han
ge2
0.00
72
0.00
32
0.00
30.
008
0.00
80.
008
~0.0
15!
~0.0
14!
~0.0
16!
~0.0
37!
~0.0
37!
~0.0
46!
O R2
0.00
10.
066
0.07
00.
147
0.14
50.
000
0.01
00.
010
0.03
00.
030
No.
ofob
s.22
9222
9222
9222
9222
9215
6915
6915
6915
6915
69
*,**
,an
d**
*in
dica
tesi
gnif
ican
ceat
the
10,
5,an
d1
perc
ent
leve
ls,
resp
ecti
vely
.
Stock Market Liberalization 561
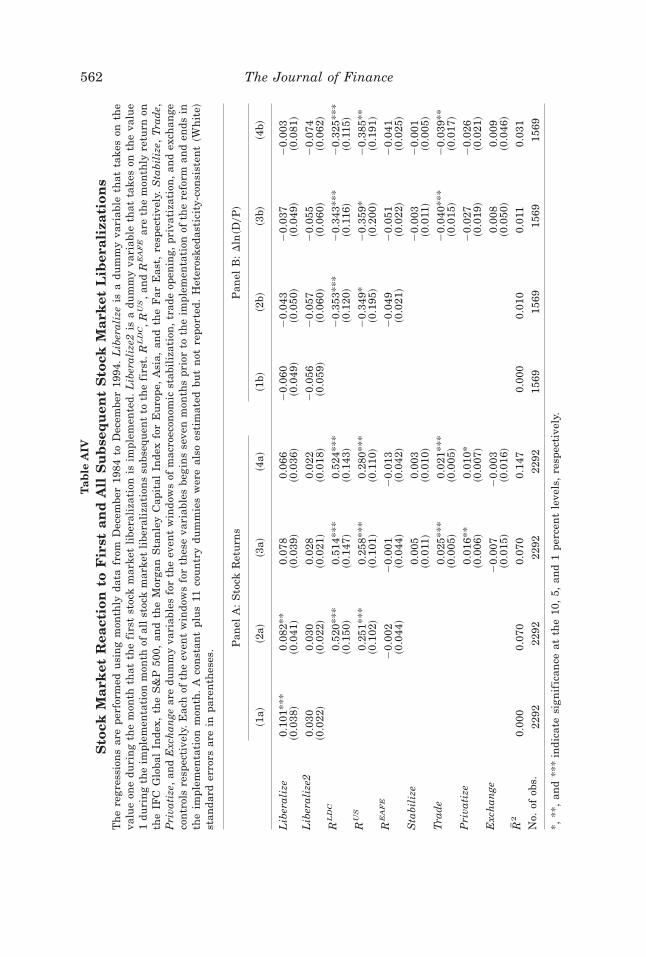
Tab
leA
IV
Sto
ckM
ark
etR
eact
ion
toF
irst
and
All
Su
bse
qu
ent
Sto
ckM
ark
etL
iber
ali
zati
on
sT
he
regr
essi
ons
are
perf
orm
edu
sin
gm
onth
lyda
tafr
omD
ecem
ber
1984
toD
ecem
ber
1994
.L
iber
aliz
eis
adu
mm
yva
riab
leth
atta
kes
onth
eva
lue
one
duri
ng
the
mon
thth
atth
efi
rst
stoc
km
arke
tli
bera
liza
tion
isim
plem
ente
d.L
iber
aliz
e2is
adu
mm
yva
riab
leth
atta
kes
onth
eva
lue
1du
rin
gth
eim
plem
enta
tion
mon
thof
all
stoc
km
arke
tli
bera
liza
tion
ssu
bseq
uen
tto
the
firs
t.R
LD
C,R
US
,an
dR
EA
FE
are
the
mon
thly
retu
rnon
the
IFC
Glo
bal
Inde
x,th
eS
&P
500,
and
the
Mor
gan
Sta
nle
yC
apit
alIn
dex
for
Eu
rope
,A
sia,
and
the
Far
Eas
t,re
spec
tive
ly.
Sta
bili
ze,
Tra
de,
Pri
vati
ze,
and
Exc
han
gear
edu
mm
yva
riab
les
for
the
even
tw
indo
ws
ofm
acro
econ
omic
stab
iliz
atio
n,
trad
eop
enin
g,pr
ivat
izat
ion
,an
dex
chan
geco
ntr
ols
resp
ecti
vely
.E
ach
ofth
eev
ent
win
dow
sfo
rth
ese
vari
able
sbe
gin
sse
ven
mon
ths
prio
rto
the
impl
emen
tati
onof
the
refo
rman
den
dsin
the
impl
emen
tati
onm
onth
.A
con
stan
tpl
us
11co
un
try
dum
mie
sw
ere
also
esti
mat
edbu
tn
otre
port
ed.
Het
eros
keda
stic
ity-
con
sist
ent
~Wh
ite!
stan
dard
erro
rsar
ein
pare
nth
eses
. Pan
elA
:S
tock
Ret
urn
sP
anel
B:
Dln
~D0P
!
~1a!
~2a!
~3a!
~4a!
~1b!
~2b!
~3b!
~4b!
Lib
eral
ize
0.10
1***
0.08
2**
0.07
80.
066
20.
060
20.
043
20.
037
20.
003
~0.0
38!
~0.0
41!
~0.0
39!
~0.0
36!
~0.0
49!
~0.0
50!
~0.0
49!
~0.0
81!
Lib
eral
ize2
0.03
00.
030
0.02
80.
022
20.
056
20.
057
20.
055
20.
074
~0.0
22!
~0.0
22!
~0.0
21!
~0.0
18!
~0.0
59!
~0.0
60!
~0.0
60!
~0.0
62!
RL
DC
0.52
0***
0.51
4***
0.52
4***
20.
353*
**2
0.34
3***
20.
325*
**~0
.150
!~0
.147
!~0
.143
!~0
.120
!~0
.116
!~0
.115
!R
US
0.25
1***
0.25
8***
0.28
0***
20.
349*
20.
359*
20.
385*
*~0
.102
!~0
.101
!~0
.110
!~0
.195
!~0
.200
!~0
.191
!R
EA
FE
20.
002
20.
001
20.
013
20.
049
20.
051
20.
041
~0.0
44!
~0.0
44!
~0.0
42!
~0.0
21!
~0.0
22!
~0.0
25!
Sta
bili
ze0.
005
0.00
32
0.00
32
0.00
1~0
.011
!~0
.010
!~0
.011
!~0
.005
!Tr
ade
0.02
5***
0.02
1***
20.
040*
**2
0.03
9**
~0.0
05!
~0.0
05!
~0.0
15!
~0.0
17!
Pri
vati
ze0.
016*
*0.
010*
20.
027
20.
026
~0.0
06!
~0.0
07!
~0.0
19!
~0.0
21!
Exc
han
ge2
0.00
72
0.00
30.
008
0.00
9~0
.015
!~0
.016
!~0
.050
!~0
.046
!O R2
0.00
00.
070
0.07
00.
147
0.00
00.
010
0.01
10.
031
No.
ofob
s.22
9222
9222
9222
9215
6915
6915
6915
69
*,**
,an
d**
*in
dica
tesi
gnif
ican
ceat
the
10,
5,an
d1
perc
ent
leve
ls,
resp
ecti
vely
.
562 The Journal of Finance
REFERENCES
Alexander, Gordon, Cheol Eun, and Sundaram Janakiramanan, 1987, Asset pricing and duallisting on foreign capital markets: A note, Journal of Finance 42, 151–158.
Basu, Parantap, and Matthew Morey, 1998, Trade liberalization and the behavior of emergingstock market prices, Working paper, Fordham Institute for Research in Economics.
Bekaert, Geert, 1995, Market integration and investment barriers in emerging equity markets,World Bank Economic Review 9, 75–107.
Bekaert, Geert, and Campbell R. Harvey, 1995, Time-varying world market integration, Jour-nal of Finance 50, 403–444.
Bekaert, Geert, and Campbell R. Harvey, 2000, Foreign speculators and emerging equity mar-kets, Journal of Finance 55, 565–613.
Binder, John, 1998, The event study methodology since 1969, Review of Quantitative Financeand Accounting, forthcoming.
Boubakri, Narjess, and Jean-Claude Cosset, 1998, The financial and operating performanceof newly privatized firms: Evidence from developing countries, Journal of Finance 53, 1081–1111.
Buckberg, Elaine, 1995, Emerging stock markets and international asset pricing, World BankEconomic Review 9, 51–74.
Diwan, Ishac, Vihang Errunza, and Lemma Senbet, 1993, Empirical perspectives on nationalindex funds, Working paper, World Bank, Washington, D.C.
Dornbusch, Rudiger, 1983, Panel discussion on the southern cone, International Monetary FundStaff Papers 30, 164–184.
Edwards, Sebastian, 1984. The order of liberalization of the external sector in developing coun-tries, Princeton Essays in International Finance, 156.
Errunza, Vihang, and Etienne Losq, 1985, International asset pricing under mild segmentation:Theory and test, Journal of Finance 40, 105–124.
Errunza, Vihang, and Etienne Losq, 1989, Capital f low controls, international asset pricing,and investors welfare: A multi-country framework, Journal of Finance 44, 1025–1037.
Errunza, Vihang, Etienne Losq, and Prasad Padmanabhan, 1992, Tests of integration, mildsegmentation, and segmentation hypotheses, Journal of Banking and Finance 16, 949–972.
Errunza, Vihang, and Darius P. Miller, 1998, Market segmentation and the cost of capital ininternational equity markets, Working paper, McGill University and Texas A&M University.
Eun, Cheol, and Sundaram Janakiramanan, 1986, A model of international asset pricing witha constraint on foreign equity ownership, Journal of Finance 41, 897–914.
Fama, Eugene F., 1981, Stock returns, real activity, inf lation, and money, American EconomicReview 71, 545–565.
Foerster, Stephen R., and G. Andrew Karolyi, 1999, The effects of market segmentation andinvestor recognition on asset prices: Evidence from foreign stocks listing in the UnitedStates, Journal of Finance 54, 981–1013.
Henry, Peter Blair, 1999a, Do stock market liberalizations cause investment booms? Journal ofFinancial Economics, forthcoming.
Henry, Peter Blair, 1999b, Appendix of major policy changes in selected developing countries,mimeo, Stanford University Graduate School of Business.
Kim, E. Han, and Vijay Singal, 2000, Stock market openings: Experience of emerging econo-mies, Journal of Business 73, 25–66.
Levine, Ross, and Sara Zervos, 1994, Capital control liberalization and stock market develop-ment: Data annex of country policy changes, World Bank, Washington, D.C.
Loughran, Timothy, and Jay Ritter, 1995, The new issues puzzle, Journal of Finance 50, 23–51.McKinlay, A. Craig, 1997, Event studies in economics and finance, Journal of Economic Liter-
ature 35, 13–39.McKinnon, Ronald I., 1991, The Order of Economic Liberalization ~Johns Hopkins University
Press, Baltimore!.Ozler, Sule, 1989, On the relationship between reschedulings and bank value, American Eco-
nomic Review 12, 1117–1131.
Stock Market Liberalization 563

Park, Keith, and Antoine W. Van Agtmael, 1993, The World’s Emerging Stock Markets: Struc-ture, Development, Regulations and Opportunities ~Probus Publishing Company, Chicago!.
Price, Margaret M., 1994, Emerging Stock Markets ~McGraw Hill, Inc., New York!.Ritter, Jay, 1991, The long-run performance of initial public offerings, Journal of Finance 46,
3–27.Sachs, Jeffrey, and Andrew Warner, 1995, Economic reform and the process of global integra-
tion, Brookings Papers on Economic Activity 1, 1–113.Stapleton, Richard, and Marti Subrahmanyam, 1977, Market imperfections, capital market
equilibrium, and corporate finance, Journal of Finance 32, 307–319.Stulz, René M., 1999a, International portfolio f lows and security markets, Working paper, Dice
Center for Financial Economics, The Ohio State University.Stulz, René M., 1999b, Globalization and the cost of equity capital, Working paper, The New
York Stock Exchange.Summers, Lawrence H., 1994, A changing course toward privatization; in Ahmed Galal and
Mary Shirley, eds.: Does Privatization Deliver? ~The World Bank, Washington, D.C.!.Tesar, Linda L., and Ingrid M. Werner, 1998, The internationalization of securities markets
since the 1987 crash; in Robert E. Litan and Anthony M. Santomero, eds.: Brookings-Wharton Papers on Financial Services ~Brookings Institution Press, Washington!.
Urias, Michael, 1994, The impact of security cross-listing on the cost of capital in emergingmarkets, Unpublished dissertation, Stanford University.
564 The Journal of Finance