staying the course - building a better working world - ey - …€¦ · staying the course it was...
TRANSCRIPT

Biotechnology Report 2017
Staying the courseBeyond borders
Biotechnology executives and investors know the drill: take advantage of robust financing, but prepare for its inevitable decline. As we review in our 31st annual Beyond borders, in 2016, biotechnology companies continued to invest in tomorrow’s treatments even as capital markets in the US and EU dried up, valuations suffered and payers commanded ever more decision-making power. There were geopolitical complexities, too: Brexit; the Trump presidency; ongoing uncertainty about US health care reform.
As we argue in this report, the long development cycles of biotech provide a measure of insulation from policy and regulatory uncertainty — or at least an impetus to stay the course, which is our chosen theme for this year’s Beyond borders.
In the current climate, even smaller biotechs must be willing to engage to shape the policies that will impact the industry in the long run. They must also understand when staying the course requires the adoption of emerging technologies or business-model innovations.
That’s because new challenges to the traditional biotech model have emerged alongside more familiar ones. In 2016, we saw capital flows begin to shift, as funds from Asia generally, and China specifically, were deployed globally. Given the current uncertainty in the capital markets, this new wellspring of capital is a disruptive force, giving US- and EU-based biotechs more strategic options — if they can tap it.
Meanwhile, R&D productivity remains an ongoing concern. Artificial intelligence and the accompanying analytics are now so advanced that these tools promise to improve the traditional drug target selection and R&D process. However, how biotechs, especially smaller ones, optimally access these capabilities remains an important question.
Indeed, the unrelenting pace of technological change and biotech’s shift from a clinical science supported by data to a data-driven science
supported by clinicians adds additional complexity to biotech business models. As technology companies continue to implement digital innovations that potentially disrupt health care, there is a risk that biopharma incumbents have less control of the data that are so important in demonstrating product value. We already know that commercial biotechs face drug pricing pressures, even as structural barriers prevent the wider adoption of value-based reimbursement models. Data-based partnerships with digital companies could be crucial to accelerating the shift from fee for service to fee for value. Again, how to craft these partnerships, and with whom, are nontrivial strategic questions.
EY’s global Life Sciences teams stand ready to assist the biotech community in finding the right opportunities while simultaneously navigating the complexities of the current era. In this year’s report we review not only 2016’s performance metrics, but their implications for 2017, sharing perspectives from innovative thinkers.
Please visit the EY Life Sciences digital home, Vital Signs (ey.com/VitalSigns), and our Twitter feed (@EY_LifeSciences) to access our latest content and provide feedback.
Pamela Spence EY Global Life Sciences Industry Leader
Glen T. Giovannetti EY Global Biotechnology Leader
When uncertainty is the only certainty, should biotechs adapt or stay the course?
Contents04 The year in review
10 Perspectives
10 Amid uncertainty, stay the course
12 To accelerate the shift from volume to value, it’s time to embrace Value Labs
14 Embracing digital disruption
16 Pharma-digital DNA and why the term “digital health” will soon be obsoleteLisa Suennen, GE Ventures
18 Improving the ROI of R&D: an imperative for biopharma
22 Augmenting R&D with artificial intelligenceJackie Hunter, BenevolentBio
24 Exploiting optionality
26 Streaming drug development — at scaleMatthew Gline, Roivant Sciences, Inc.
28 Shrinking the gap between life-span and health-span
30 Financial performance
48 Financing
74 Putting China’s capital to work in the WestDebra Yu, MD, China Renaissance
76 Japan: leading the way in regenerative medicineYuzo Toda, Fujifilm Corporation
78 Dealmaking
95 Appendix
95 Acknowledgments
96 Data exhibit
98 Biotechnology contacts at EY member firmsPamela Spence EY Global Life Sciences Industry Leader

The year in review
Beyond borders 2017
Beyond borders Biotechnology report 20174
Beyond borders 2017
Staying the courseIt was supposed to be a bad year for biotech. For this sector, the simplest of truisms has always held: what goes up must eventually come down. Markets peaked in 2015 and declined in 2016; payer pressure and US election year rhetoric weighed on the sector; drug approvals fell sharply; and biotech companies faced a dwindling supply of public market capital to fund R&D in key US and European markets.
Moreover, in 2016 the biotech industry in the US and Europe faced — and continues to face — unprecedented strategic and policy uncertainty. It must reckon with a maturing biotech ecosystem in Asia, particularly in China, where financing and dealmaking ambitions have clearly gone global. And it will need to leverage and incorporate emerging digital technologies into R&D or be supplanted by those that do.
But despite these challenges and the peculiar gravitational pull that always follows years of success, biotech largely stayed the course in 2016 and was able to deliver historically strong results across a number of key metrics.
In 2016, overall financing was down, but the early-stage venture ecosystem remained healthy. In fact, biotech enjoyed its third-best financing year ever, despite a drop in proceeds from initial public offerings and follow-on rounds. Dealmaking remained active in 2016 as acquirers took advantage of biotech valuations coming back to Earth. The industry’s largest players remain on the hunt for pipeline-augmenting assets and
commercial growth opportunities. There are still plenty of biotech targets that can boost future prospects, and 2017 has started off strong thanks in large part to Johnson & Johnson’s US$30 billion acquisition of Swiss bellwether Actelion.
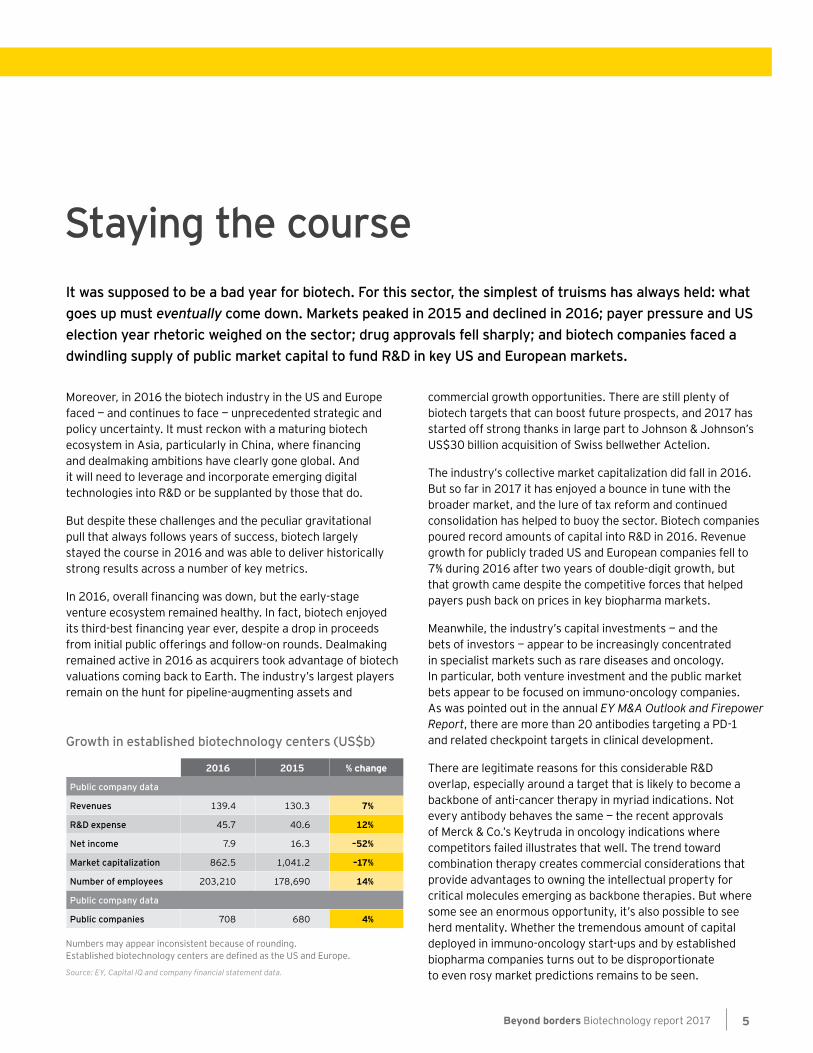
The industry’s collective market capitalization did fall in 2016. But so far in 2017 it has enjoyed a bounce in tune with the broader market, and the lure of tax reform and continued consolidation has helped to buoy the sector. Biotech companies poured record amounts of capital into R&D in 2016. Revenue growth for publicly traded US and European companies fell to 7% during 2016 after two years of double-digit growth, but that growth came despite the competitive forces that helped payers push back on prices in key biopharma markets.
Meanwhile, the industry’s capital investments — and the bets of investors — appear to be increasingly concentrated in specialist markets such as rare diseases and oncology. In particular, both venture investment and the public market bets appear to be focused on immuno-oncology companies. As was pointed out in the annual EY M&A Outlook and Firepower Report, there are more than 20 antibodies targeting a PD-1 and related checkpoint targets in clinical development.
There are legitimate reasons for this considerable R&D overlap, especially around a target that is likely to become a backbone of anti-cancer therapy in myriad indications. Not every antibody behaves the same — the recent approvals of Merck & Co.’s Keytruda in oncology indications where competitors failed illustrates that well. The trend toward combination therapy creates commercial considerations that provide advantages to owning the intellectual property for critical molecules emerging as backbone therapies. But where some see an enormous opportunity, it’s also possible to see herd mentality. Whether the tremendous amount of capital deployed in immuno-oncology start-ups and by established biopharma companies turns out to be disproportionate to even rosy market predictions remains to be seen.
Numbers may appear inconsistent because of rounding. Established biotechnology centers are defined as the US and Europe.
Source: EY, Capital IQ and company financial statement data.
Growth in established biotechnology centers (US$b)
2016 2015 % change
Public company data
Revenues 139.4 130.3 7%
R&D expense 45.7 40.6 12%
Net income 7.9 16.3 –52%
Market capitalization 862.5 1,041.2 –17%
Number of employees 203,210 178,690 14%
Public company data
Public companies 708 680 4%
Beyond borders Biotechnology report 2017 5
Regulatory speed bumps
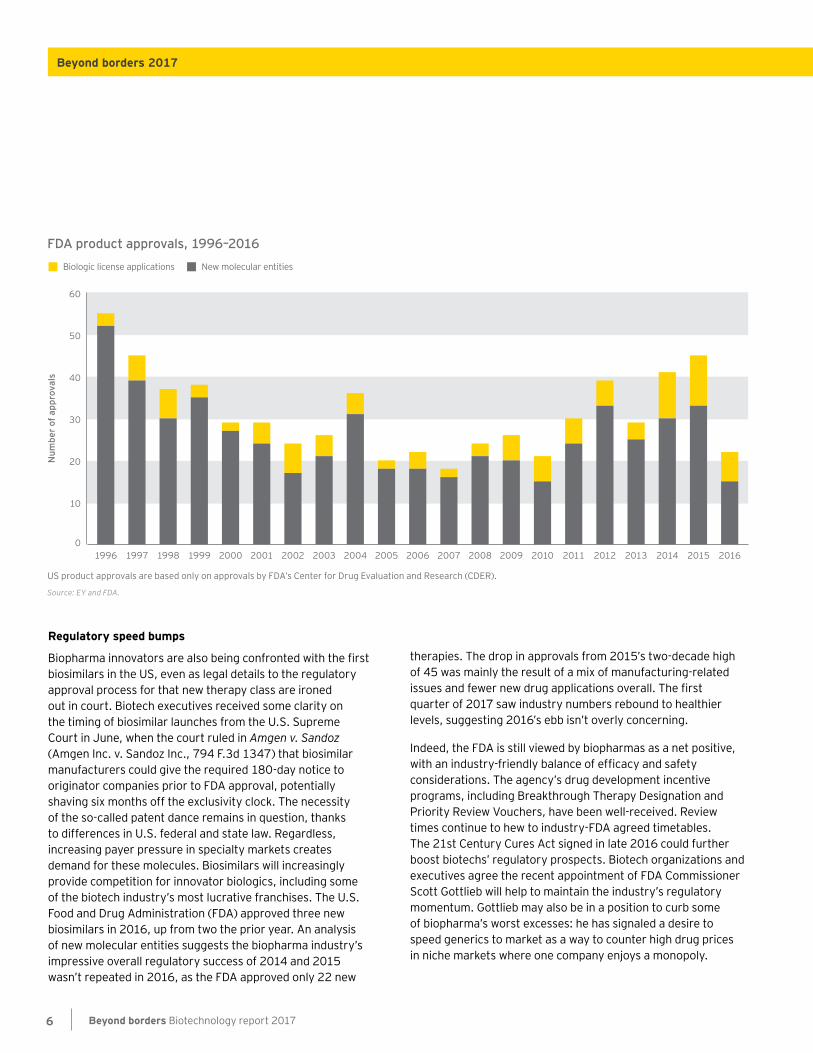
Biopharma innovators are also being confronted with the first biosimilars in the US, even as legal details to the regulatory approval process for that new therapy class are ironed out in court. Biotech executives received some clarity on the timing of biosimilar launches from the U.S. Supreme Court in June, when the court ruled in Amgen v. Sandoz (Amgen Inc. v. Sandoz Inc., 794 F.3d 1347) that biosimilar manufacturers could give the required 180-day notice to originator companies prior to FDA approval, potentially shaving six months off the exclusivity clock. The necessity of the so-called patent dance remains in question, thanks to differences in U.S. federal and state law. Regardless, increasing payer pressure in specialty markets creates demand for these molecules. Biosimilars will increasingly provide competition for innovator biologics, including some of the biotech industry’s most lucrative franchises. The U.S. Food and Drug Administration (FDA) approved three new biosimilars in 2016, up from two the prior year. An analysis of new molecular entities suggests the biopharma industry’s impressive overall regulatory success of 2014 and 2015 wasn’t repeated in 2016, as the FDA approved only 22 new
therapies. The drop in approvals from 2015’s two-decade high of 45 was mainly the result of a mix of manufacturing-related issues and fewer new drug applications overall. The first quarter of 2017 saw industry numbers rebound to healthier levels, suggesting 2016’s ebb isn’t overly concerning.
Indeed, the FDA is still viewed by biopharmas as a net positive, with an industry-friendly balance of efficacy and safety considerations. The agency’s drug development incentive programs, including Breakthrough Therapy Designation and Priority Review Vouchers, have been well-received. Review times continue to hew to industry-FDA agreed timetables. The 21st Century Cures Act signed in late 2016 could further boost biotechs’ regulatory prospects. Biotech organizations and executives agree the recent appointment of FDA Commissioner Scott Gottlieb will help to maintain the industry’s regulatory momentum. Gottlieb may also be in a position to curb some of biopharma’s worst excesses: he has signaled a desire to speed generics to market as a way to counter high drug prices in niche markets where one company enjoys a monopoly.
FDA product approvals, 1996–2016
US product approvals are based only on approvals by FDA’s Center for Drug Evaluation and Research (CDER).
Source: EY and FDA.
Num
ber o
f app
rova
ls 40
20
30
10
0
50
60
Biologic license applications New molecular entities
200620001999199819971996 20082001 20092002 20102003 20112004 20122005 20132007 2014 2015 2016
Beyond borders Biotechnology report 20176
Beyond borders 2017
Uncertainty, certainly
In Europe, the ramifications of the UK’s departure from the European Union remain amorphous. Moving the European Medicines Agency out of London to somewhere in, well, Europe, is only the bricks-and-mortar embodiment of what could result in regulatory disarray.
Brexit is merely one aspect of what many in biotech see as unprecedented policy and regulatory uncertainty in 2017. The possible repeal of the Patient Protection and Affordable Care Act in the US and the possible impacts of tax reform also hang over the future prospects of biotechnology companies. Support by the Trump Administration for key institutions relied on by the biotech industry, such as the National Institutes of Health, is wavering. Hiring freezes and funding cuts at key federal agencies could raise issues for implementing the 21st Century Cures Act.
These uncertainties shouldn’t steer the scientific agendas at early-stage biotechs with long discovery and development cycles. Long-term value is created in spite of the vicissitudes of financial markets, whether early financing rounds are raised at rock-bottom or peak prices. That said, the policy arena could drive more financing volatility in the short term, impacting both fundraising and dealmaking strategies.
Meanwhile, for companies with marketed therapies, competitive as well as political forces will reinforce downward pressure on drug prices and the need to demonstrate drug value. The shift to value-based pricing models has been challenging to implement given current reimbursement practices, subjective definitions of product value and varying degrees of infrastructure readiness. For further insights on this topic, please read “To accelerate the shift from volume to value, it’s time to embrace Value Labs” on page 12.
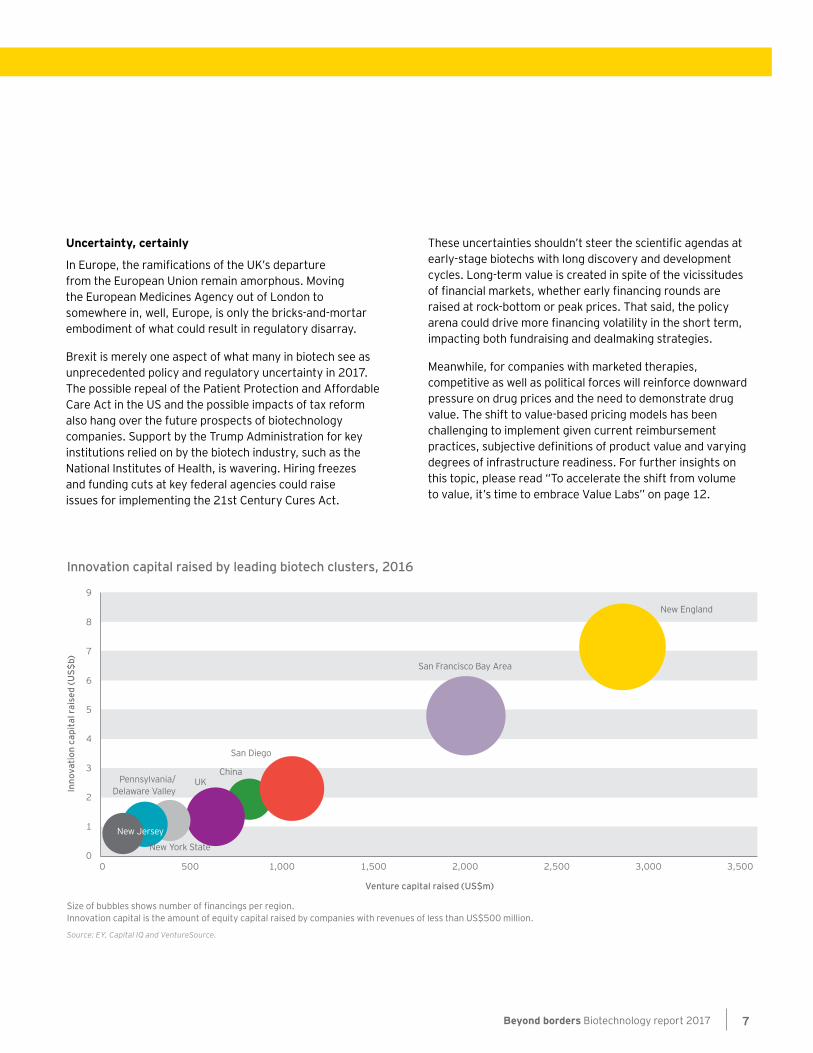
Innovation capital raised by leading biotech clusters, 2016
Size of bubbles shows number of financings per region. Innovation capital is the amount of equity capital raised by companies with revenues of less than US$500 million.
Source: EY, Capital IQ and VentureSource.
Inno
vatio
n ca
pita
l rai
sed
(US$
b)
8
9
2
1
0
6
5
4
3
7
0 500 1,000 1,500 2,000 2,500 3,000 3,500
Venture capital raised (US$m)
New England
San Francisco Bay Area
San Diego
ChinaUKPennsylvania/
Delaware Valley
New York State
New Jersey
Beyond borders Biotechnology report 2017 7
High drug prices in the US have allowed companies to avoid reckoning with inefficient R&D operations. Boosting R&D efficiency, partly by embracing emerging technologies including digital and artificial intelligence, and partly through use of creative business models, will be necessary for biotechs to simultaneously increase return-on-investment and the affordability of drugs.
Looking ahead through 2017 and into 2018, the growth of the biotech industry is increasingly global. The emerging venture ecosystem in China comprising strategic as well as financial investors is quickly funding a new generation of home-grown biotech competitors. These and other forms of competition — from digital technologies to newly unearthed biological pathways or technologies, including cell therapy and gene editing that promise next-wave innovation, to the impact of biosimilars — will further drive biopharma dealmaking. The promise of M&A will eventually boost investors’ outlook on the sector and willingness to finance a new burst of drug discovery and development, even as biotechs adapt to new regulatory and policy realities.
Biotech’s peculiar gravity works both ways. What goes down must go back up, too.
Boosting R&D efficiency, partly by embracing emerging technologies including digital and artificial intelligence, and partly through use of creative business models, will be necessary for biotechs to simultaneously increase return-on-investment and the affordability of drugs.
Questions for biotech companies to consider• How will you achieve success
amid unprecedented strategic and policy uncertainty?
• As health care moves from treatment to prevention, how will you remain relevant?
• How will you accelerate the shift from volume to value?
• How will artificial intelligence and advanced analytics improve your R&D and commercial outcomes?
Beyond borders Biotechnology report 20178
Beyond borders 2017
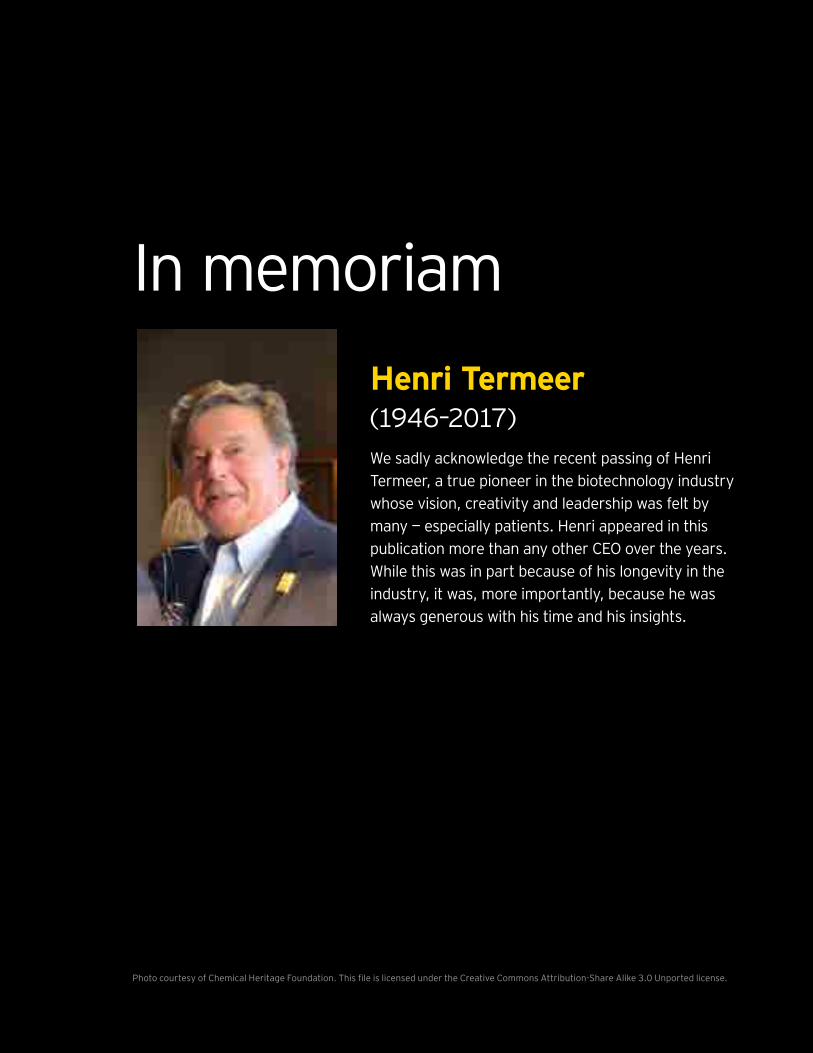
In memoriam
Photo courtesy of Chemical Heritage Foundation. This file is licensed under the Creative Commons Attribution-Share Alike 3.0 Unported license.
We sadly acknowledge the recent passing of Henri Termeer, a true pioneer in the biotechnology industry whose vision, creativity and leadership was felt by many — especially patients. Henri appeared in this publication more than any other CEO over the years. While this was in part because of his longevity in the industry, it was, more importantly, because he was always generous with his time and his insights.
Henri Termeer (1946–2017)

Amid uncertainty, stay the courseThe possible repeal of health care reform in the US, the departure of the UK from the European Union, the tug of war between payers and drugmakers around drug prices, and the possible impacts of tax reform all hang over the future prospects of biotechnology companies. What’s more, thus far in 2017, key institutions relied on by the biotech industry have been threatened by reduced funding and hiring freezes.
EY perspective
The Trump Administration’s proposed budget called for drastic cutbacks in federal funding for scientific research. In addition, individuals once rumored to be on a short list to run the agency even called into question aspects of the FDA’s core mission to evaluate the safety and efficacy of drugs. The agency has been affected by executive orders around federal hiring and the repeal of regulations.
“I think that uncertainty in Washington seems to be the norm in my 27 years here,” noted John Milligan, Gilead Sciences CEO, during his company’s early-May earnings call. Gilead has “learned to filter that out and focus on the things that are right for the company.”
This year’s user fee negotiations between the drug industry and the US regulator come at an unpredictable time, to say the least.
“I can’t think of a period that’s been characterized by so much uncertainty as the past six to nine months,” said Alan Mendelson, partner and co-chair of the life sciences industry group at Latham & Watkins. Of course, it’s no surprise that drug pricing was a campaign issue in 2016 — it’s a populist message embraced by voices on both sides of the political spectrum, including both presidential candidates.
“And it’s not that biotech industry executives don’t recognize that there are real and important issues here, but the reaction in the markets to political rhetoric tends to have a pretty devastating impact on the market caps of public companies, and can even affect financing trends in the private sector,” Mendelson says. “Financial markets react to political uncertainty. The uncertainty is a factor that comes up in every board meeting I attend.” Biotech companies dependent on the capital markets are belt-tightening, which is jostling deal dynamics and portfolio priorities.
10 Beyond borders Biotechnology report 2017

But that same uncertainty shouldn’t drive the industry, or any particular company, from its chosen course. Biotech development cycles are very long. No matter the circumstances, successful biotech companies tend to be the ones that stick to their convictions and stay nimble. They continue to focus on long-term value creation, even as financial markets come and go, but remain flexible enough to access the investor cash when it is available, even if at prices well below the peak of a year or two ago.
“I think that uncertainty in Washington seems to be the norm in my 27 years here,” noted John Milligan, Gilead Sciences CEO, during his company’s early-May earnings call. Gilead has “learned to filter that out and focus on the things that are right for the company. There may be tax reform, there may be repatriation, but you can’t count on it, and you can’t wait for it either,” he said.
Instead, companies of all sizes can be poised to take advantage of potential opportunities. “We are closely monitoring the evolving political landscape and uncertainty coming out of Washington and are keenly aware that tax reform may open up additional avenues of capital deployment to deliver value to our shareholders,” said Ian Read, Chairman and CEO of Pfizer, on the company’s own earnings call in May.
Mendelson points to another phenomenon: biotech companies recognizing they need to engage with policy issues that affect them. “I’ve seen some significant differences in
the degree to which smaller companies are recognizing that they need to spend time on policy issues in Washington and at the state level, and hiring government affairs people earlier than they might have before,” he says.
That shift resembles biotechs’ increasing interactions with payers earlier in the drug development cycle, one that theoretically and eventually ought to bring the two groups closer to a common vision of value. On pricing, companies should decide whether they will be proactive leaders in payer discussions or use risk-based arrangements only as a defensive, fallback position. In the meantime, biotech’s breakthroughs will continue. Technology platforms such as gene editing, cell therapy and next-generation sequencing will continue to mature.
In the depths of the financial crisis that began in 2008, it was difficult for even seasoned biotech CEOs to see the light at the end of the tunnel, much less the mountain of growth and value that awaited biotech over the past several years. Yet since 2013 the biotech industry has enjoyed unprecedented and sustained growth and increased productivity.
On pricing, companies should decide whether they will be proactive leaders in payer discussions or use risk-based arrangements only as a defensive, fall-back position.
Beyond borders Biotechnology report 2017 11
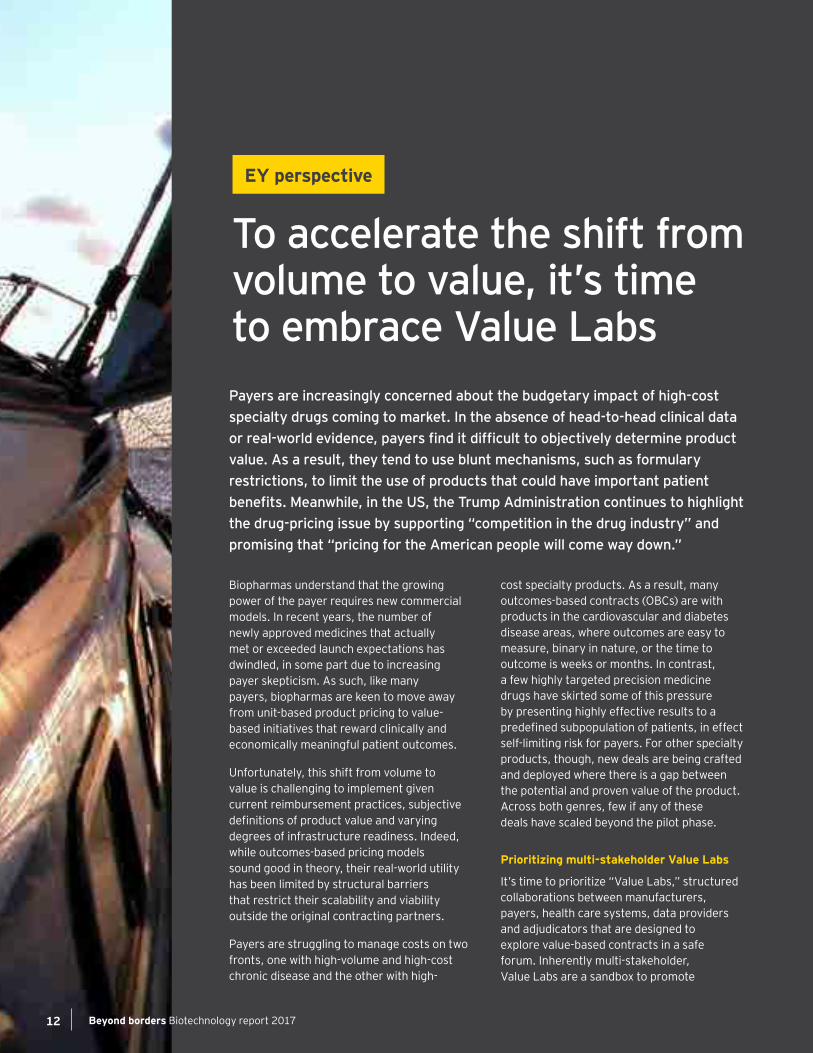
To accelerate the shift from volume to value, it’s time to embrace Value LabsPayers are increasingly concerned about the budgetary impact of high-cost specialty drugs coming to market. In the absence of head-to-head clinical data or real-world evidence, payers find it difficult to objectively determine product value. As a result, they tend to use blunt mechanisms, such as formulary restrictions, to limit the use of products that could have important patient benefits. Meanwhile, in the US, the Trump Administration continues to highlight the drug-pricing issue by supporting “competition in the drug industry” and promising that “pricing for the American people will come way down.”
EY perspective
Biopharmas understand that the growing power of the payer requires new commercial models. In recent years, the number of newly approved medicines that actually met or exceeded launch expectations has dwindled, in some part due to increasing payer skepticism. As such, like many payers, biopharmas are keen to move away from unit-based product pricing to value-based initiatives that reward clinically and economically meaningful patient outcomes.
Unfortunately, this shift from volume to value is challenging to implement given current reimbursement practices, subjective definitions of product value and varying degrees of infrastructure readiness. Indeed, while outcomes-based pricing models sound good in theory, their real-world utility has been limited by structural barriers that restrict their scalability and viability outside the original contracting partners.
Payers are struggling to manage costs on two fronts, one with high-volume and high-cost chronic disease and the other with high-
cost specialty products. As a result, many outcomes-based contracts (OBCs) are with products in the cardiovascular and diabetes disease areas, where outcomes are easy to measure, binary in nature, or the time to outcome is weeks or months. In contrast, a few highly targeted precision medicine drugs have skirted some of this pressure by presenting highly effective results to a predefined subpopulation of patients, in effect self-limiting risk for payers. For other specialty products, though, new deals are being crafted and deployed where there is a gap between the potential and proven value of the product. Across both genres, few if any of these deals have scaled beyond the pilot phase.
Prioritizing multi-stakeholder Value Labs
It’s time to prioritize “Value Labs,” structured collaborations between manufacturers, payers, health care systems, data providers and adjudicators that are designed to explore value-based contracts in a safe forum. Inherently multi-stakeholder, Value Labs are a sandbox to promote
Beyond borders Biotechnology report 201712
Value Labs are a sandbox to promote experimentation while mitigating known pain points that have limited the uptake of OBCs.
experimentation while mitigating known pain points that have limited the uptake of OBCs. These known pain points include:
• Value-centric clinical and economic study design
• Innovative contracting structures
• Data capture, integration and analysis infrastructure
• Development of administrative protocols
Depending on the therapeutic area and the stakeholders involved, each Value Lab will be different. Because they provide an opportunity for participants to work together to address and operationalize core challenges, these labs increase transparency, which further promotes trust and drives collaboration between stakeholders.
We’re already seeing ad hoc experiments promote the Value Lab concept in spirit, if not in name. In May 2017, the Duke-Margolis Center for Health Policy announced the creation of a consortium to overcome legal and regulatory hurdles associated with value-based payments for drugs and devices. The consortium, which includes patient advocacy groups, insurers, biopharma companies and policy experts, will also tackle “operational challenges such as fragmented and difficult-to-track patient outcome data.” Meanwhile, the National Health Council, an advocacy organization for patients with chronic diseases, has created a framework for health care cost reductions that includes value-based pricing strategies.
At a time when outcomes-based contracts and innovative value demonstration projects are in their infancy and their learnings are not being widely disseminated to inform future programs, Value Labs provide a forum for rapidly moving OBCs from “concept to pilot” and “pilot to scale.” This will result in successful programs being deployed more broadly in the marketplace. As participating stakeholders apply learnings from prior experiments, the development of new OBCs will be more efficient. There is no need to reinvent standard processes such as systems that share data or adjudicate outcomes.
The growing costs and payer expectations to put more limitations on access to treatments for novel areas such as pain, oncology and inflammatory disease increase the urgency for wider adoption of OBCs. By working together in a transparent cooperative model, biopharmas and payers can use Value Labs to research, evaluate and deliver value to the health care system writ large. That’s good for payers and biopharmas. Most importantly, it’s good for patients, who often find themselves caught between parties that are reacting to rational but misaligned commercial incentives.
This perspective has been adapted by EY Advisory Principal Susan Garfield from a longer article that is currently being prepared for publication in VIVO magazine. Susan would like to thank Roger Longman, CEO of Real Endpoints, and Michael Sherman, Chief Medical Officer of Harvard Pilgrim Health Care, for their contributions.
Beyond borders Biotechnology report 2017 13
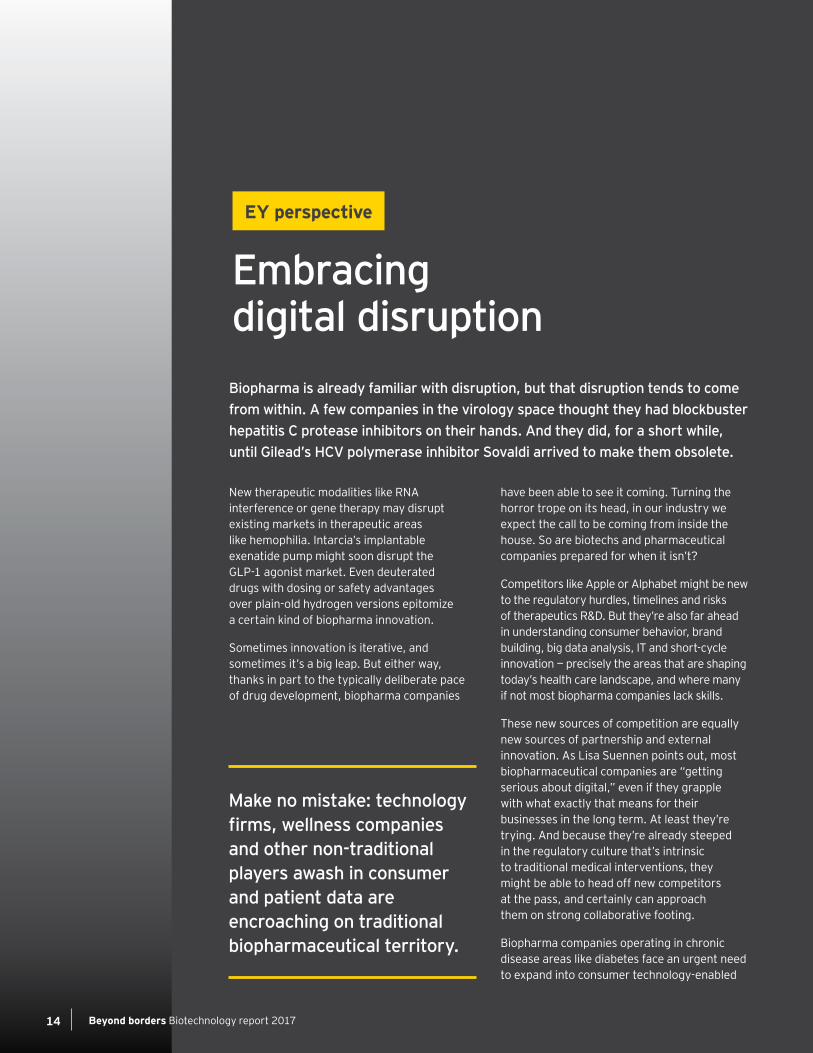
Embracing digital disruption
EY perspective
Biopharma is already familiar with disruption, but that disruption tends to come from within. A few companies in the virology space thought they had blockbuster hepatitis C protease inhibitors on their hands. And they did, for a short while, until Gilead’s HCV polymerase inhibitor Sovaldi arrived to make them obsolete.
New therapeutic modalities like RNA interference or gene therapy may disrupt existing markets in therapeutic areas like hemophilia. Intarcia’s implantable exenatide pump might soon disrupt the GLP-1 agonist market. Even deuterated drugs with dosing or safety advantages over plain-old hydrogen versions epitomize a certain kind of biopharma innovation.
Sometimes innovation is iterative, and sometimes it’s a big leap. But either way, thanks in part to the typically deliberate pace of drug development, biopharma companies
have been able to see it coming. Turning the horror trope on its head, in our industry we expect the call to be coming from inside the house. So are biotechs and pharmaceutical companies prepared for when it isn’t?
Competitors like Apple or Alphabet might be new to the regulatory hurdles, timelines and risks of therapeutics R&D. But they’re also far ahead in understanding consumer behavior, brand building, big data analysis, IT and short-cycle innovation — precisely the areas that are shaping today’s health care landscape, and where many if not most biopharma companies lack skills.
These new sources of competition are equally new sources of partnership and external innovation. As Lisa Suennen points out, most biopharmaceutical companies are “getting serious about digital,” even if they grapple with what exactly that means for their businesses in the long term. At least they’re trying. And because they’re already steeped in the regulatory culture that’s intrinsic to traditional medical interventions, they might be able to head off new competitors at the pass, and certainly can approach them on strong collaborative footing.
Biopharma companies operating in chronic disease areas like diabetes face an urgent need to expand into consumer technology-enabled
Make no mistake: technology firms, wellness companies and other non-traditional players awash in consumer and patient data are encroaching on traditional biopharmaceutical territory.
Beyond borders Biotechnology report 201714

solutions and services. Certain chronic conditions have faced a dwindling number of truly novel treatment options, and challenges such as adherence and disease management remain stubborn. Differentiation here depends on patient-centric use of artificial intelligence and other data-driven tools and tracking devices to drive more appropriate, targeted medication use and to encourage related behavioral changes.
Sanofi’s diabetes joint venture with Verily Life Sciences and Novo Nordisk’s partnership with IBM Watson Health are emblematic of this new generation of digital dealmaking. Deals like these are just a start. EY’s Digital Deal Economy study revealed that 70% of life sciences companies plan to use M&A to build digital capabilities over the next two to three years.
But make no mistake: technology firms, wellness companies and other non-traditional players awash in consumer and patient data are encroaching on traditional biopharmaceutical territory. It’s not hard to imagine a near future where a digital tool can improve patient outcomes as well — or almost as well — as a traditional drug therapy. Convincing regulators, physicians, payers and patients to adopt such a digital therapeutic instead of or prior to drug therapy is no idle threat to certain biopharma business models — especially when that intervention comes at a much lower price, and certainly without the threat of unwanted side effects or drug-drug interactions.
Beyond borders Biotechnology report 2017 15
EY: Are life sciences companies adapting their business models and partnership strategies fast enough to exploit digital technologies?
Suennen: Biopharma is relatively new to the digital party. Yet all the major pharmaceutical firms are now getting serious about digital, including at a very senior level. There has been a huge uptick in interest over the last year or two, driven by cost pressures and the urgent need for product differentiation. The current focus is largely on how to incorporate new digital technologies into clinical trials, and to gather real world evidence. There is also work on consumer-facing digital technologies to augment drugs’ value. With the exception of diabetes — where tens of thousands of users already benefit from integrated glucose monitors, insulin delivery systems and engagement apps — this product-focused side is still at an earlier stage.
Digital health and technology companies have also evolved. They used to try to avoid going anywhere near regulators such as the U.S. Food and Drug Administration (FDA). Now they understand they won’t get anywhere without having these agencies on their side. They realize they need to act like health care companies in order to play in the highly regulated health system. The cultural divide is narrowing, which makes partnerships easier.
Is pharma moving fast enough? Don’t forget that all this [technology] is really new. We weren’t having any of these discussions even five years ago; most technologies have been around just a few years, if that. Now we’re talking about
applying them in the context of human health and lives. So perhaps biopharma is not that late to the party after all.
EY: How clear is the business case for biopharmas adopting new technologies?
Suennen: It’s pretty clear. Digital technologies are about limiting the impact of price reductions, maintaining formulary positioning and generating competitive differentiation. Digital tools aren’t a way to increase profits, in my view. Some pharmas don’t yet understand that: they are still asking themselves, “How can we make money from digital tools?” That’s the wrong question.
But many pharma firms still lack the basic data infrastructure to properly exploit digital tools; they often don’t have their own data scientists, nor people who know how to sell software. They mostly rely on partners for those skills. Pharma will have to expand their skill sets and become deeply familiar with the world of software, data and service to cross the divide.
EY: How do these dynamics influence GE Ventures’ investment choices across digital health?
Suennen: Companies we invest in have to demonstrate two things. The first is revenues: we’re not a seed-stage fund. We’re taking risk less around the idea (there are plenty of other investors doing that) than around the scaling up of that idea. Our return time frames are five to six years. The second thing our investment companies in this area must demonstrate is that they combine the DNA of both pharma and digital technology groups.
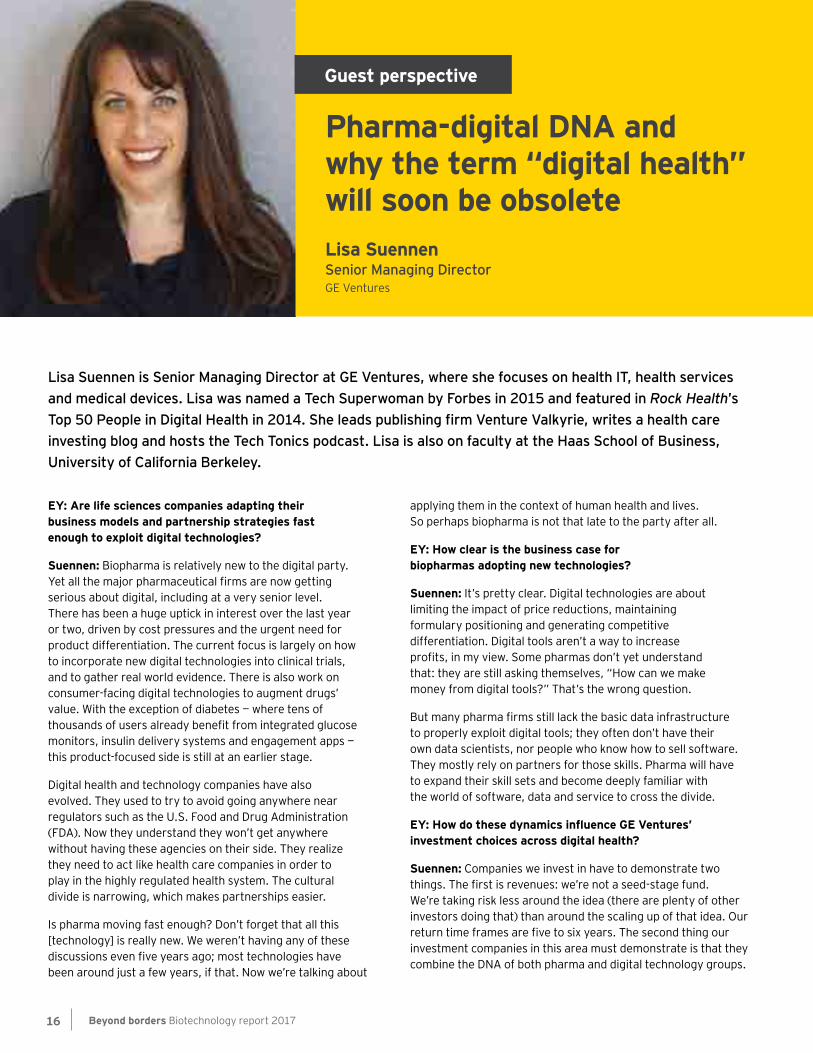
Lisa Suennen is Senior Managing Director at GE Ventures, where she focuses on health IT, health services and medical devices. Lisa was named a Tech Superwoman by Forbes in 2015 and featured in Rock Health’s Top 50 People in Digital Health in 2014. She leads publishing firm Venture Valkyrie, writes a health care investing blog and hosts the Tech Tonics podcast. Lisa is also on faculty at the Haas School of Business, University of California Berkeley.
Guest perspective
Lisa SuennenSenior Managing DirectorGE Ventures
Pharma-digital DNA and why the term “digital health” will soon be obsolete
Beyond borders Biotechnology report 201716
EY: What does that pharma-digital DNA combination look like?
Suennen: You have to hear their [management’s] words to know that they get it. They have to properly understand how pharmaceutical firms would think and act, and what concerns they would have over legal, regulatory and data privacy issues, for example. All this is far in excess of what start-ups usually think about. Health technology start-ups also need to understand the clinical impact of their product and show that they have taken the time and money to validate it in a legitimate way.
Many start-ups until recently haven’t done clinical studies [of their technology] and didn’t see why they had to. They haven’t been living in the same world as pharma. Yet they must if they want to partner with pharma.
A great example of a group effectively bridging the pharma-digital divide is GE portfolio company Evidation Health. San Mateo, California-based Evidation helps pharmaceutical firms leverage digitally captured data sets as part of clinical trials and outcomes data collection. It has a “captive population” of over 1.5 million willing to share digital data in the context of trials and registries. The approach will be core to enabling value-based pricing; generating evidence for digital intervention; and developing new, reliable and validated digital biomarkers.
New York, New York-based HealthReveal offers a cloud-based solution that analyzes massive amounts of data from at-risk patients and turns this data into actionable recommendations for physicians. There are very few companies actually making data usable, rather than only generating, aggregating and analyzing it. Most digital data goes not to pharma companies, but to physicians, so making it relevant and meaningful to them is vital. HealthReveal’s solution can be used to identify in near real time the particular patients that may be susceptible to adverse events, and/or to spot treatment
omissions or medical errors, based on analyzing libraries of clinical guidelines from major medical centers. It could also be applied to studying particular drugs to determine their post-market impact on patients. But whatever the application, what it gives back to the doctor is very specific: “Patient X has this and might have that. You should consider this diagnostic/treatment/alteration in your action plan.”
It’s a bit like the credit cards we all carry around in our wallets: there is someone monitoring these all the time, tracking your purchasing patterns, and if something unusual happens, they call you. This is the same idea, except it’s about your health, not your credit cards.
EY: What is the single biggest disruptive trend challenging the life sciences sector?
Suennen: Money, and the reduction thereof. Changing the money flows in health care is the sector’s single biggest disruptive force; everyone has to follow the money. When there is less of it, they have to find new ways to do business, or lose market share.
EY: What kinds of digital health opportunities is GE Ventures currently looking for?
Suennen: We are interested in companies that improve patient and provider experience, improve outcomes, and improve the financial and operations management of health care and life sciences organizations. Within those categories, we are looking at health IT, IT-enabled services, life science tools and noninvasive medical devices. “Digital health” is rapidly becoming a non-category. Technology is a key part of health care as it is of any other industry. We don’t call banking “digital banking,” and we won’t long call this intersection of technology with health “digital health.”
“Digital technologies are about limiting the impact of price reductions, maintaining formulary positioning and generating competitive differentiation. Digital tools aren’t a way to increase profits, in my view.”
Beyond borders Biotechnology report 2017 17
Improving the ROI of R&D: an imperative for biopharmaCurrent biopharma R&D costs are unsustainable. Aggressive pricing pressure and a decline in the number of blockbuster drugs continue to challenge revenue growth, yet the total costs of successfully developing a drug have remained stubbornly stable. Depending on whose numbers you believe, it can be anything from approximately US$1 billion to US$2.5 billion or more per product. The result: an ongoing decline in the return on investment (ROI) of biopharma R&D.
EY perspective
Drug prices will continue to be squeezed as payers’ budgets are stretched to handle aging populations with a growing incidence of chronic diseases. Specialist and orphan drugs, traditionally protected from pricing pushback, are also beginning to face payer pushback. The implication: unless pharma can start to reduce R&D costs — and time — ROI will eventually fall to levels that threaten the sector’s viability.
Larger pharmas are particularly affected by poor R&D productivity. Many have started to take measures to improve their R&D ROI, with some focusing on those therapy areas with the greatest revenue potential — such as oncology — and where they have a realistic chance of market leadership. While logical, these measures don’t attack the underlying inefficiency. In addition, the development of more narrowly focused medicines, while good for patients, will continue to draw payer scrutiny, and they are unlikely to achieve the peak sales of earlier generations of blockbusters.
As a result, the industry must more aggressively address its R&D cost structure and improve development efficiency and
effectiveness. A host of technologies, data and analytics tools offer opportunities to address some of the ROI challenge by driving greater efficiency across the entire R&D value chain, from early discovery through to regulatory submission and commercialization.
These tools — coupled with pharma’s need — are creating an entirely new biotech subsector built around the intelligent use and analysis of data.
Discovery
An emerging cluster of firms are using artificial intelligence (AI) — powerful computers that identify links and patterns across vast quantities of data — to generate viable drug targets and leads more rapidly than conventional means. Some AI groups, such as BERG Health, have ambitions to upturn the entire R&D process, shunning the standard hypothesis generation and testing method in favor of a biology-led approach. Others, such as London-based BenevolentAI, are using machine learning to repurpose or resurrect existing assets in which significant investment has already been made. (Please see “Augmenting R&D with artificial intelligence” by Jackie Hunter on page 22.)
Beyond borders Biotechnology report 201718
AI is unlikely to radically transform R&D productivity; biology’s complexity remains overwhelming for even the most intelligent system. But AI and computer processing will streamline components of drug discovery, such as allowing rapid screening of huge numbers of molecules. The robotization of many lab processes is also reducing resource costs. Cloud-based, secure data-sharing platforms are facilitating greater research collaboration across disparate geographies. For example, Seven Bridges offers a cloud-based bioinformatics analysis platform that allows biopharma firms to securely store and analyze their own data, on demand, alongside publicly available genomic datasets.
The implication: unless pharma can start to reduce R&D costs — and time — ROI will eventually fall to levels that threaten the sector’s viability.
Development
Clinical trials account for the largest portion of R&D costs. New digital tools and data-driven processes are available to make them more efficient, too.
At the same time, personalized medicine, supported by advances in genome sequencing, diagnostics and biomarker identification, appears to be helping reduce failure rates and time-to-approval. Identifying patients most likely to respond to a particular drug allows trials to be smaller, potentially reaching significance faster. Data suggests that drugs developed with predictive biomarkers (to help select likely responders) are three times more likely to be approved than those without.
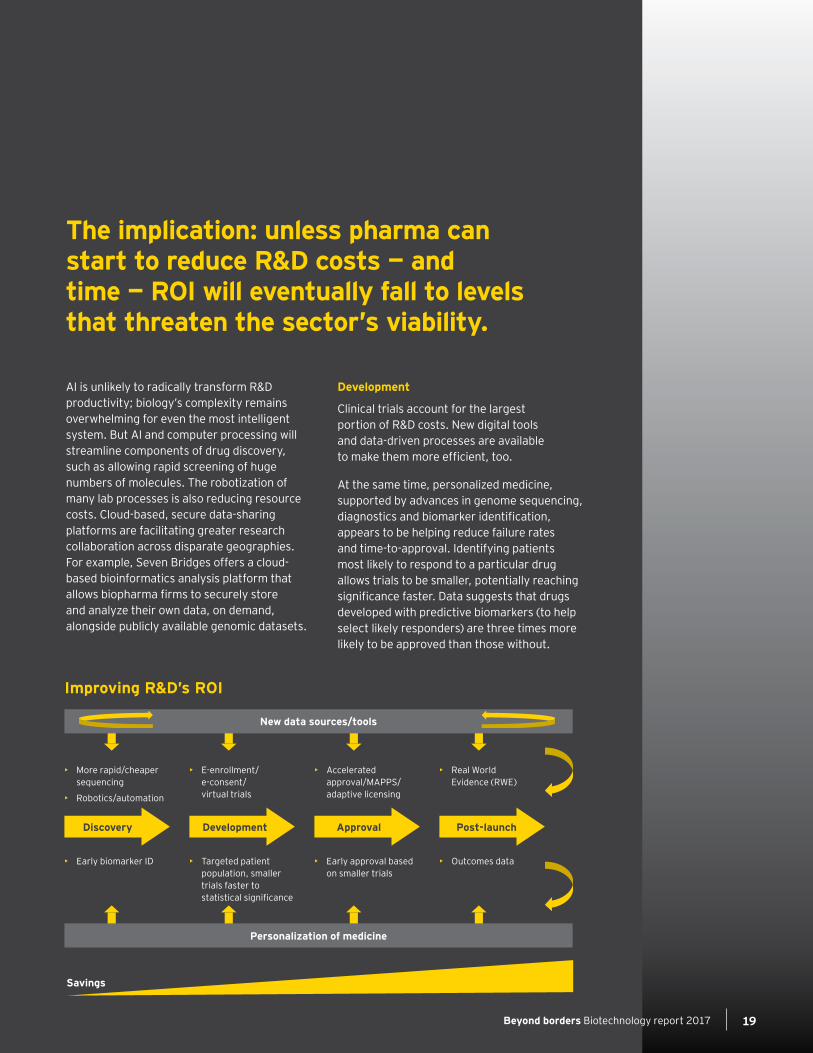
Improving R&D’s ROI
• More rapid/cheaper sequencing
• Robotics/automation
• Early biomarker ID • Targeted patient population, smaller trials faster to statistical significance
• Early approval based on smaller trials
• Outcomes data
• E-enrollment/ e-consent/virtual trials
• Accelerated approval/MAPPS/adaptive licensing
• Real World Evidence (RWE)
Discovery Development Approval Post-launch
Personalization of medicine
Savings
New data sources/tools
Beyond borders Biotechnology report 2017 19
Alongside increasingly sophisticated, cloud-based analytics solutions from established CROs such as Medidata and QuintilesIMS, numerous biotechs are engaged in making personalized medicine a reality. Some, like Flatiron Health, are taking an end-to-end approach spanning the R&D to care delivery chain. California-based Syapse’s precision medicine platform allows clinical and genomic data integration, decision support and care coordination. And GRAIL is developing early-stage cancer detection kits.
Driving trial efficacy
For now, personalized medicine is mostly confined to oncology. But plenty of other, TA-agnostic efforts are underway to expedite clinical trials. Predictive analytics group QuantumBlack is mining historical performance data at Novartis from across 30,000 sites to help predict trial enrollment speeds, quality and cost, thereby allowing more intelligent site-selection strategies.
Trial data is being digitized as well, and connected patients are accelerating trial recruitment. Mobile technology and telemedicine are helping create “site-less” trials that patients can access from wherever they live. For example, California-based Science 37 announced in March 2017 a partnership with Sanofi to establish virtual trials via remote patient enrollment, monitoring and reporting, using iPhones. Virtual trials allow more patients to participate, regardless of geographic constraints. Mobile technology can also be used to improve retention rates, such as by using smartphone reminders to take study medication.
Rapid, electronic trial-related data capture allows sponsors to preempt emerging issues or delays. Clinical Ink’s e-source platform uses tablets for all key aspects of trials, including e-consent, site documentation, drug scanning and supply. (Scanning and consent are both major issues for trial compliance.) Otsuka Pharmaceutical Co. Ltd. is working with
Clinical Ink and aims to start all new late-stage trials on a paperless platform, estimating that it can shave 20% off costs as a result.
As trials go digital and virtual, technologies such as blockchain offer the future promise of highly secure, accurate data storage and transfer across a network of distributed users.
Regulatory
Regulators’ acceptance and adoption of new trial data forms and formats remain a risk for the first-mover biopharma. But in general, regulators are seeking to accelerate and streamline drug R&D to enable faster patient access to novel treatments. US President Trump is calling for expedited FDA drug reviews beyond existing programs such as Accelerated Approval.
Post-approval
Data and data-driven technologies are blurring the boundaries between what were traditionally seen as discrete, sequential steps in drug development and commercialization. R&D is now more circular, or has the potential to be, as varieties of “real world” data (behavioral, physiologic and in some cases molecular) can now be analyzed and fed back to inform R&D and, increasingly, support pricing. Reflecting this, companies such as Komodo Health offer a suite of analytics-based services spanning clinical operations, medical affairs, IT and commercial. Many young companies, in addition to Syapse, are attempting to match health records with genomic and other molecular data to build a fuller, deeper and better-understood picture of the causal chain and symptoms of disease.
For many of these VC-backed groups, the revenue model remains unclear. But their investors include technology VCs and enterprise analytics firms — a far wider pool than those supporting traditional drug development.
Beyond borders Biotechnology report 201720

Beyond borders Biotechnology report 2017 21
EY: What impact could artificial intelligence and related machine learning tools have on the speed and cost of drug R&D?
Hunter: Artificial intelligence has the potential to impact the whole drug discovery and development process. As an industry, we’re still losing 50% of compounds in Phase II and Phase III trials for lack of efficacy. That isn’t sustainable; it tells us we’re picking the wrong targets. A further quarter of failures in Phase II or III are for strategic or commercial reasons. That also tells us industry is not always making the right decisions about what compounds to prioritize.
Both aspects — the science and the strategy — could be improved by better mining the information and evidence that’s out there. AI allows us to access and analyze huge swathes of data — far more than human minds could manage in a lifetime. That may include molecular data and study findings (both positive and negative) related to compound efficacy, but also a host of commercially relevant reimbursement and outcomes data that can inform strategic decision-making.
Our deep-learning platform could lead to a fourfold increase in R&D success rates up to and including target validation. We already have some evidence for that: in less than a year, we have generated 36 new hypotheses and validated 24 of them in vitro. Traditional biopharma R&D would typically only manage about five in that time frame with the same personnel. We’re also using our deep-learning supercomputer to generate chemistry models in less than a week, rather than a couple of months.
It remains to be seen whether this acceleration translates to clinical proof of concept and beyond. But it’s exciting.
EY: How does BenevolentBio’s AI platform work, and what kinds of insights does it generate?
Hunter: The system ingests all kinds of scientific information — public, private, structured, unstructured — and annotates it with specialist biomedical dictionaries. Then we apply natural language processing and other algorithms to build a knowledge graph, showing the complex pattern of interactions between various molecular entities and diseases. This allows us to generate new potential associations or rule out existing hypotheses. Negative associations are sometimes even more valuable than positive ones, in terms of decisions to discontinue a particular approach.
The platform, a Judgement Augmented Cognition System, is trying to help us do more with what we know and to make better-informed inferences. It’s not replacing the scientist or clinician, but rather enhancing and accelerating their hypothesis generation by helping extract relevant information from the vast mountains of data available.
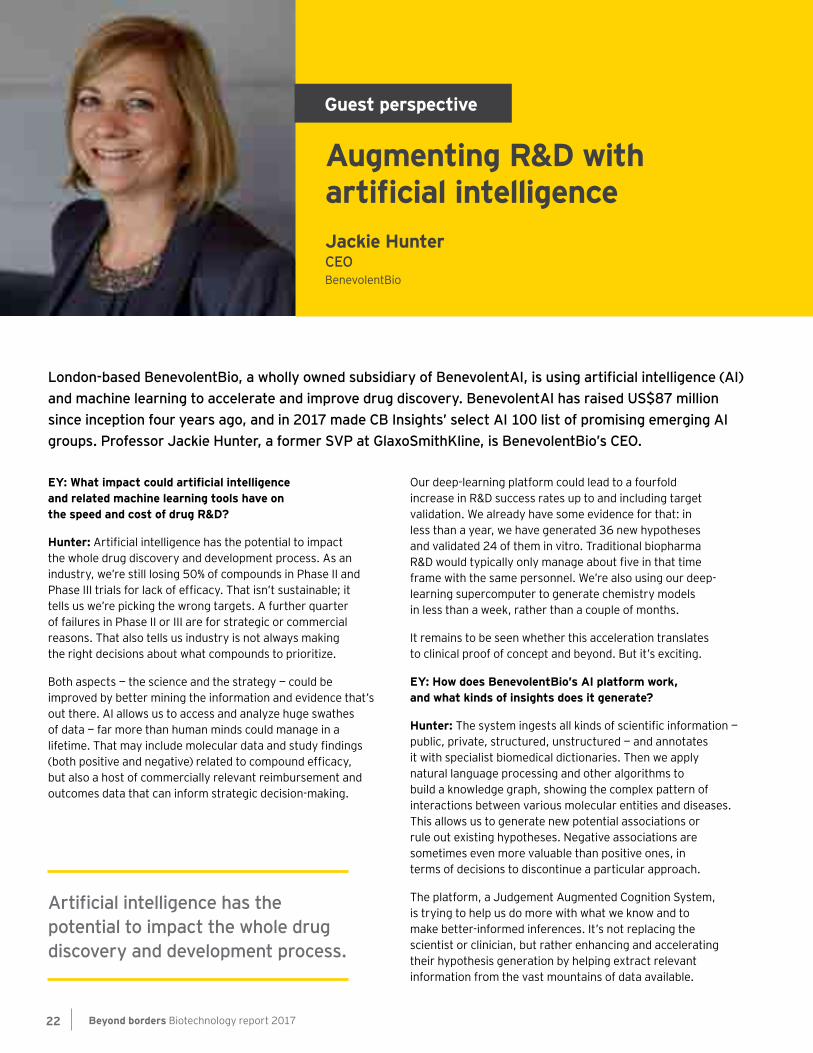
London-based BenevolentBio, a wholly owned subsidiary of BenevolentAI, is using artificial intelligence (AI) and machine learning to accelerate and improve drug discovery. BenevolentAI has raised US$87 million since inception four years ago, and in 2017 made CB Insights’ select AI 100 list of promising emerging AI groups. Professor Jackie Hunter, a former SVP at GlaxoSmithKline, is BenevolentBio’s CEO.
Guest perspective
Jackie HunterCEOBenevolentBio
Augmenting R&D with artificial intelligence
Artificial intelligence has the potential to impact the whole drug discovery and development process.
Beyond borders Biotechnology report 201722
We still need to test new potential associations in vivo, but the hope is that these have a greater chance of success and can thus dramatically speed up drug discovery.
The idea is to generate fewer, better molecules whose properties we’ll be better able to predict, as well as better targets.
EY: That sounds like something most of big pharma would be interested in. Are you offering a drug discovery service?
Hunter: No. Unlike many AI companies working in the biopharma space, we’re not a service provider. We’re building our own pipeline. In November 2016 we licensed from Janssen a series of novel, clinical trial-ready small molecule candidates, along with a wealth of clinical and biological data. We’re using our platform to seek novel indications for these. The first will move into Phase IIb trials this year. Janssen has no buyback rights to these molecules, but they’ll get royalties and certain milestone payments if we move into Phase III.
In April 2017, we signed a two-year drug discovery collaboration with MRC Technology, a medical research charity. It will undertake complex chemistry on some of our AI-generated disease targets, and may also run promising molecules it has identified through our AI technology to validate.
Previously, we licensed to a US pharmaceutical firm some targets and chemical scaffolds, generated using our platform, for use in Alzheimer’s disease.
EY: Investors have been piling into the broader AI space. What is your perception of the degree of investor and pharma interest in, and understanding of, AI as applied to drug R&D?
Hunter: AI is beginning to become more mainstream. We and other AI companies have raised significant venture capital. BERG Health [AI-backed drug R&D] is supported by Silicon Valley property billionaire Carl Berg. As for big pharma: most of them are dipping their toes into AI somewhere along the R&D value chain, whether in drug
discovery, real-world outcomes, or to better understand their customers. We are talking to a number of pharma companies about potential licensing deals around non-core assets.
EY: What is the biggest challenge you face in your quest to streamline and enhance drug R&D?
Hunter: The challenges are cultural and social, not just technological. Biologists must be open to the value that machine learning and data crunching can bring to their endeavor, and to asking new kinds of questions that may have previously been intractable. Data scientists need to talk to the biologists and chemists to better understand how their tools will be used.
Big pharma needs to embed a more data-driven approach across all departments, not just within biostatistics or IT, to really benefit from what computing power and data analytics can bring to drug R&D.
“Big pharma needs to embed a more data-driven approach across all departments, not just within biostatistics or IT, to really benefit from what computing power and data analytics can bring to drug R&D.”
Beyond borders Biotechnology report 2017 23

Exploiting optionalityThe late May 2017 acquisition of True North Therapeutics by the Biogen hemophilia spin-off Bioverativ for US$400 million up front and a potential US$425 million in future milestones is the latest endorsement of forward-thinking corporate structures that allow companies to create value around individual pipeline assets.
EY perspective
True North spun out of iPierian, a biotech that originally focused on using induced pluripotent stem cells to build models of disease, in 2013. At the time, iPierian’s management had successfully made the transition to drug developer: one lead asset, IPN007, an anti-tau antibody to treat Alzheimer’s disease, was about to enter clinical development. A second antibody against a target in the
No matter the model, as most biotech companies eventually exit via an M&A transaction with a larger player, biotech leaders must make strategic choices to maximize value.
classical complement pathway showed promise in rare hematologic, renal and neurological diseases. Concurrent with a US$30 million venture round, the company split into two: iPierian retained the tau asset, and TNT009, the complement pathway inhibitor, formed the basis of the spin-off, True North.
iPierian was sold to Bristol-Myers Squibb Co. in April 2014 in a deal worth US$175 million up front and potentially US$550 million in milestone payments, plus eventual royalties. True North plugged away at TNT009, receiving the FDA’s breakthrough designation for the antibody for treatment of cold agglutinin disease, a rare hematological disorder, just prior to the Bioverativ deal. It’s easy to imagine a buyer with interest in one product candidate but not the other balking at ascribing what iPierian’s and True North’s management team (each was led by CEO Nancy Stagliano) would have considered fair value for both products.
The range of biotech business model options is large. The fully integrated pharmaceutical/biopharmaceutical company approach has given way to the more prevalent model of “selective integration,” including some
Beyond borders Biotechnology report 201724
The increasing availability of private capital from a variety of strategic and traditional sources may make these kinds of structures more common.
that have relied on in-licensing assets to create a pipeline, such as Roivant Sciences. Still others believe that company building is inherently inefficient and that the focus should be on assembling the right combination of skills around each particular asset, much as talent is assembled and disbanded in the movie industry.
No matter the model, as most biotech companies eventually exit via an M&A transaction with a larger player, biotech leaders must make strategic choices to maximize value. Platform-centric companies in particular must consider how best to realize value on the underlying technology and the earlier stage pipeline, even when investors and potential acquirers may focus on only a single lead asset. Management teams need to have a view of the sum-of-the-parts valuation of their companies and think through deal structures that will fully reflect the biotech’s total value.
While some have tried to accomplish this goal in the face of a deal proposal (Johnson & Johnson’s acquisition of Actelion provides a recent, albeit complex, example), management teams like True North’s are thinking proactively about creating optionality. So, too, are others like Nimbus Therapeutics, Rhythm Holdings, Moderna Therapeutics, FORMA Therapeutics and Adimab. These biotechs have developed pipelines (or in the case of Adimab, cash flow) by managing their operations through limited liability “pass-through entities” that allow for the sale of specific assets in a tax-efficient manner.
In April 2016, for example, Nimbus sold its Phase 1 Nonalcoholic Steatohepatitis (NASH) asset to Gilead for US$400 million up front and US$400 million in potential milestone payments. Rhythm sold Actavis an option to acquire its gastro-intestinal-focused subsidiary, keeping intact a separate metabolic disease program. Traditionally structured companies may also pursue deals designed to better value earlier stage assets. After a successful launch of an initial product by a partner, in 2013 the biotech Theravance went as far as to divide itself in two: a royalty entity and a (pre-commercial) R&D entity that continues to invest in the pipeline, partially funded by a percentage of the overall partner royalty. In addition to providing a return of capital for investors, this transaction allowed Theravance to continue to invest in its early-stage assets without facing investor pressure for short-term profitability.
The increasing availability of private capital from a variety of strategic and traditional sources may make these kinds of structures more common, as an IPO might not be necessary for promising platform companies that can generate these kinds of exit opportunities. Meanwhile, these structures should have positive downstream effects that go beyond the efficient valuation of next-in-line assets or the underlying technologies that create them: fewer assets that are stalled or shelved within entities that didn’t really want them in the first place.
Beyond borders Biotechnology report 2017 25
EY: Why is Roivant structured as it is, sitting atop a series of therapy-area-focused biotechs, some of which have gone public in their own right?
Gline: Roivant is not a holding company. It’s a full operating biopharmaceutical company, sitting as the hub within a hub-and-spoke setup. The structure is designed to allow us to fulfill our mission of reducing the time, cost and risk of delivering drugs to market. We find promising programs within pharma that have been discontinued for strategic reasons and give them the best shot at being developed in a capital-efficient way.
We do this by building self-sustaining, individual biotech companies around these new potential medicines, with experienced leadership teams that are fully supported by Roivant, with clinical research, pharmacology, central services, business development, human resources and funding. This enables them to focus on the task at hand: getting safe and effective medicines to patients as rapidly as possible.
The hub-and-spoke structure gives us the flexibility to process, in parallel, assets in many different therapeutic areas. Pharmaceutical firms want to remain focused on distinct areas. We don’t have that luxury. Someone might get out of respiratory diseases today or cardiovascular conditions tomorrow, leaving drug candidates behind that might never reach patients without Roivant stepping in to provide further resources for development, approval and commercialization. We need to be able to seize those opportunities wherever they arise.
This scalability is what differentiates us from others who have successfully resurrected de-prioritized assets on a one-off basis.
EY: Is the model also about providing investors with highly focused, often single-asset-centric opportunities that they won’t find in a more conventional biopharma firm?
Gline: The structure does create a differentiated opportunity for certain investors to bet on a particular program or set of programs. This investor angle is only part of our story, though. (Three of our subsidiaries are private, so in any case we’re not always enabling that differentiated opportunity.) A big reason for
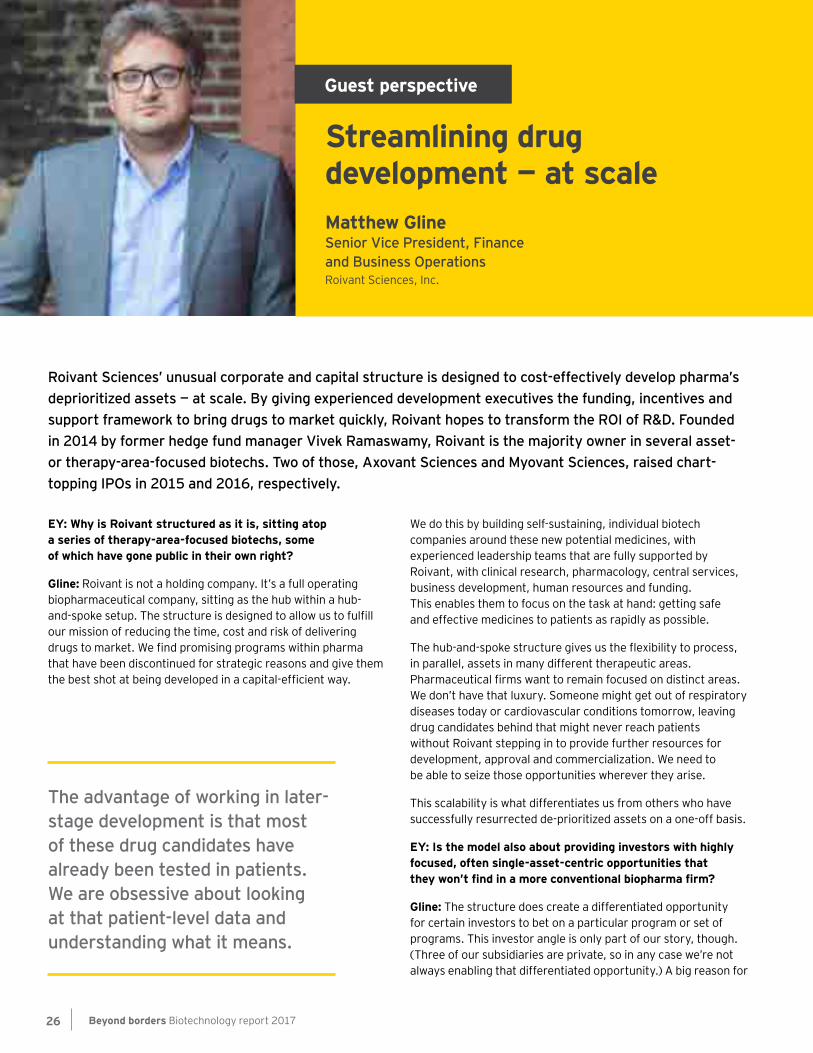
Roivant Sciences’ unusual corporate and capital structure is designed to cost-effectively develop pharma’s deprioritized assets — at scale. By giving experienced development executives the funding, incentives and support framework to bring drugs to market quickly, Roivant hopes to transform the ROI of R&D. Founded in 2014 by former hedge fund manager Vivek Ramaswamy, Roivant is the majority owner in several asset- or therapy-area-focused biotechs. Two of those, Axovant Sciences and Myovant Sciences, raised chart-topping IPOs in 2015 and 2016, respectively.
The advantage of working in later-stage development is that most of these drug candidates have already been tested in patients. We are obsessive about looking at that patient-level data and understanding what it means.
Guest perspective
Matthew GlineSenior Vice President, Finance and Business OperationsRoivant Sciences, Inc.
Streamlining drug development — at scale
Beyond borders Biotechnology report 201726
the success of Axovant’s and Myovant’s IPOs was the compelling programs, but it was also the quality of the development teams. We bring in people with a proven development track record who are unlikely to join a random small biotech company as division head. For example, Lynn Seely, recently appointed President and CEO of Myovant, was CMO at Medivation for over a decade, where she led the development of prostate cancer drug Xtandi. David Hung, CEO of Axovant, was the former CEO of Medivation. Mark Altmeyer, Chief Commercial Officer at Axovant, led the launch of Abilify, among the top-selling central nervous system drugs in history, and ran Otsuka’s US business.
EY: How do you determine which of pharma’s de-prioritized assets are worth developing?
Gline: We are very focused on data. The advantage of working in later-stage development is that most of these drug candidates have already been tested in patients. We are obsessive about looking at that patient-level data and understanding what it means. We map out data not just around a program we’re considering, but around all the investigational drugs being developed with the same mechanism or in the same indication — how they work, what for and who is sponsoring.
By nature, we’re going after things that others are walking away from. We’re contrarian. By voraciously consuming data, we can see what side of the ship everyone is running from and go there. One focus of our business development team is figuring out what the latest untrendy areas might be.
EY: Pharmaceutical firms are reluctant to part with shelved assets. How do you persuade them to do so, at as low a price as possible?
Gline: Our first deals were hard-fought, but we see ourselves as providing a solution to our partners. We’re giving their assets the best shot at being developed in a capital-efficient way. They get royalties and milestone payments — we work hard to construct “win-win” arrangements for our pharma partners in each transaction.
We have also shown that we can get things done fast. Less than a year after licensing-in our Alzheimer’s candidate from GlaxoSmithKline in December 2014, Axovant had raised US$362 million in a June 2015 IPO and had initiated a Phase III trial. Others saw that execution, and we have seen increasing inbound interest in partnership from biopharmaceutical firms as a result.
We look forward to building even more successful partnerships in the coming years.
“By voraciously consuming data, we can see what side of the ship everyone is running from and go there. One focus of our business development team is figuring out what the latest untrendy areas might be.”
Beyond borders Biotechnology report 2017 27
Shrinking the gap between life-span and health-span
EY perspective
Today individuals around the globe are living longer, but not necessarily better. The increase in noncommunicable diseases such as Alzheimer’s disease, heart disease, diabetes and osteoarthritis means that, for many, growing old is too often seen as a period of diminishment, not opportunity.
New genetic and digital technologies are converging to create solutions and services that narrow the gap between health-span, the period individuals live disease free, and life-span so that individuals can live better for longer. The ultimate goal is to move treatment upstream to the pre-disease state, where conditions should be cheaper and easier to remedy and lifelong wellness is prioritized.
Using data in new combinations
A range of technologies is needed to move toward this goal of lifelong wellness. Consider the genetic and scientific advances that underpin the emerging field of precision medicine (i.e., getting the right drug to the right patient at the right time). With the ability to sequence a person’s entire genome poised to cost less than $100, it will soon be reasonable to map the genetic blueprints of large numbers of individuals. This will uncover rare signals that, when linked to observable characteristics, identify new markers for disease risk.
Ongoing efforts to understand the human genome will be further enhanced by combining genetic data with a range of other data types, including:
• Traditional clinical laboratory results
• Multi-omics level analysis
• Real-time data generated by wearables and other mobile technologies
• Behavioral data gleaned from social media sites (e.g., Facebook and Twitter) and advocacy organizations (e.g., PatientsLikeMe)
The integration of this data coupled with a greater scientific understanding of the aging process will enable precision medicine’s boundaries to expand. The end result will be the creation of preventive and predictive precision health services for complex diseases such as mild cognitive impairment, a precursor to Alzheimer’s disease.
Indeed, by capturing biological, clinical and behavioral outputs, the approach could refine how physicians educate individuals about both disease risk and illness so that behavioral prompts are delivered not just to the right patient at the right time but in the right way to achieve maximal health.
A number of companies are already using this data-driven approach for research purposes or to create concierge wellness services. Johnson & Johnson has established an accelerator to intercept disease in a number of therapeutic areas, including type 1 diabetes, perinatal depression and oropharyngeal cancer. Google’s Verily Life Sciences group has launched a
Beyond borders Biotechnology report 201728
The ultimate goal is to move treatment upstream to the pre-disease state, where conditions should be cheaper and easier to remedy and lifelong wellness is prioritized.
10,000-person “Baseline” study to better define health based on genomic, molecular and imaging big data signals. Arivale and Human Longevity, meanwhile, both integrate genetic, laboratory and other data to develop comprehensive wellness plans for clients.
Shifting business models
As the demarcation between disease management and prevention blurs, the definition of disease will broaden to include susceptibility based on the relationship between biological markers and the development of full-blown symptoms. That shifting definition will necessitate changes to biopharma business models.
Biopharmaceutical companies currently invest billions in preclinical R&D to develop expensive products designed to treat the body when disease manifests or, in a small number of cases, to treat a single or small number of risk factors (e.g., statins and heart disease). But as wellness care and disease interception become the norm, there will be less need for such products, exacerbating pricing and utilization pressures that already limit revenue growth.
That’s not to say pharmaceuticals won’t be needed — lifestyle interventions, even if delivered at the right time and via the right format, won’t be sufficient to maintain optimal health. But the types of products and the data demonstrating their value will shift when disease interception and prevention become more mainstream. Companies will need to develop medicines that deliver smaller interventions safely and affordably.
As such, biopharma companies might want to consider how they extend to other therapeutic areas the model that resulted in the creation of bisphosphonates and statins. Both of those drugs treat early signs of more serious and costly conditions based on reliable surrogate markers.
Reimbursement models will also need to shift as the focus moves from managing diseases as they occur to prediction and preemption. The current fee-for-service model of health care delivery incentivizes disease management rather prevention. To accelerate the shift to precision health, reimbursement models that reward prevention and the coordination of complex care are a must. So, too, are affordable personalized wellness services that can be deployed on a population level. Going forward, payers and employers should partner with the companies developing these customized services to develop lower cost options.
It’s likely that biotechs will need to partner to develop end-to-end wellness-based services. First movers could have a significant advantage, tapping into a positive feedback loop that improves wellness for current seniors and their caregivers while creating both new and increased revenue opportunities. Those dividends will allow biotechs to move beyond seizing the upsides of aging to realizing actual benefits.
To read more of EY’s aging-focused thought leadership, visit Engaged Aging. An additional perspective by Yuzo Toda on regenerative medicine, “Japan: leading the way in regenerative medicine” appears on page 76.
Beyond borders Biotechnology report 2017 29

Beyond borders Biotechnology report 201730
Financial performance
Financial performanceR&D boost, mixed financial performance in 2016• Biotech companies posted mixed financial
performance metrics in 2016. Revenue growth slowed and net income dropped sharply as payer contracting and competition took a larger bite out of a handful of successful products.
• Growth in R&D expenses outpaced revenue growth for the second straight year, and companies returned less cash to shareholders in the form of buybacks and dividends.
• The industry’s aggregate market cap fell nearly one-fifth compared to 2015 as concerns around drug price sustainability were magnified in an election year in the US.
Beyond borders Biotechnology report 2017 31
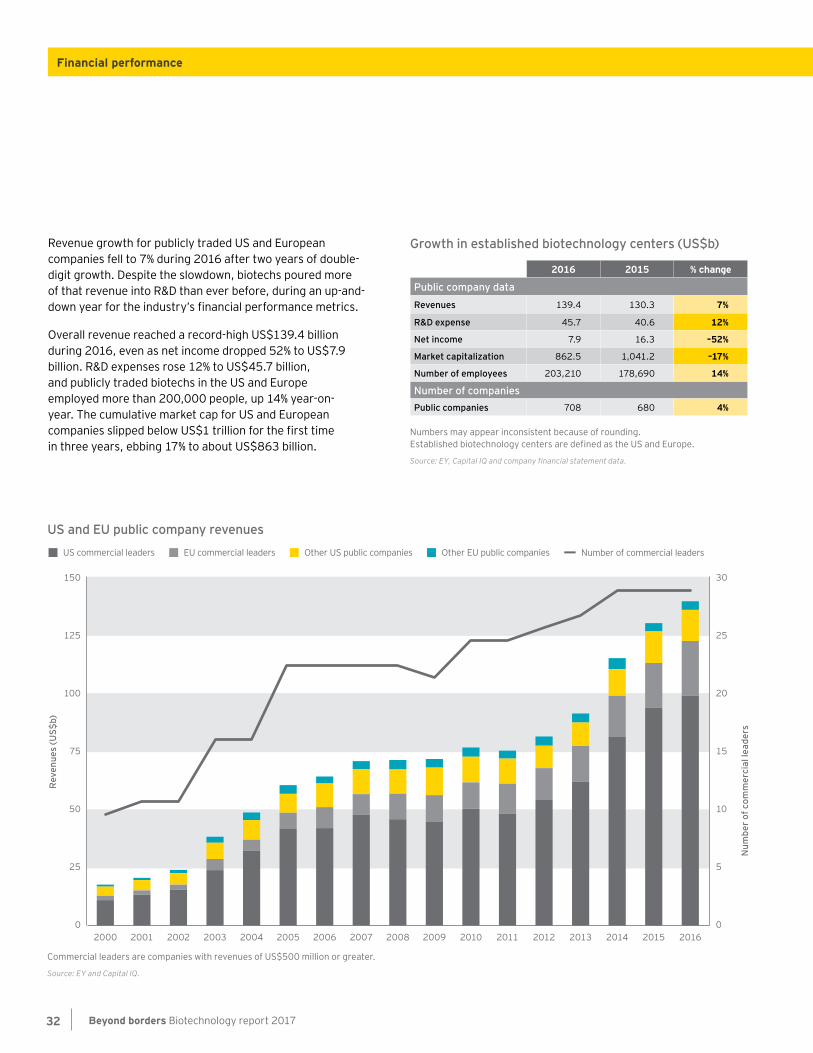
Revenue growth for publicly traded US and European companies fell to 7% during 2016 after two years of double-digit growth. Despite the slowdown, biotechs poured more of that revenue into R&D than ever before, during an up-and-down year for the industry’s financial performance metrics.
Overall revenue reached a record-high US$139.4 billion during 2016, even as net income dropped 52% to US$7.9 billion. R&D expenses rose 12% to US$45.7 billion, and publicly traded biotechs in the US and Europe employed more than 200,000 people, up 14% year-on-year. The cumulative market cap for US and European companies slipped below US$1 trillion for the first time in three years, ebbing 17% to about US$863 billion.
Growth in established biotechnology centers (US$b)
2016 2015 % change
Public company data
Revenues 139.4 130.3 7%
R&D expense 45.7 40.6 12%
Net income 7.9 16.3 –52%
Market capitalization 862.5 1,041.2 –17%
Number of employees 203,210 178,690 14%
Number of companiesPublic companies 708 680 4%
Numbers may appear inconsistent because of rounding. Established biotechnology centers are defined as the US and Europe.
Source: EY, Capital IQ and company financial statement data.
US and EU public company revenues
Commercial leaders are companies with revenues of US$500 million or greater.
Source: EY and Capital IQ.
Rev
enue
s (U
S$b)
Num
ber o
f com
mer
cial
lead
ers
30
25
20
15
10
5
0
100
50
75
25
0
125
150
Number of commercial leadersOther US public companiesUS commercial leaders Other EU public companiesEU commercial leaders
20062000 20082001 20092002 20102003 20112004 20122005 20132007 2014 2015 2016
Beyond borders Biotechnology report 201732
Financial performance
The biotechnology industry’s decline in market capitalization during 2016 comes with a silver lining: it could have been worse. Heading into the November 2016 US election, the biotech industry’s collective market cap had been battered by sharp rhetoric around drug prices. A November/December boost — thanks in part to the expectation of corporate tax reform and a possible surge in M&A following a Republican sweep — raised the sector’s performance considerably.
Even so, the year-on-year aggregate market cap decline of 17% was the worst in several years. In the US alone, 29 companies, including 12 commercial leaders, each lost more than US$1 billion in market cap during 2016. Gilead’s US$51.5 billion market cap loss in 2016 made up nearly one-third of the US$169 billion lost by those 29 companies during the year. For comparison, the top 29 market cap gainers in the US added only an aggregate US$25.7 billion in market cap during 2016. TESARO alone tacked on nearly US$5.1 billion in market cap during 2016, as it raised more than US$800 million across three follow-on offerings and submitted for FDA priority review its niraparib PARP inhibitor.
Revenues from commercial leaders (those biotechs generating at least US$500 million in revenue) increased 8% to US$122.4 billion in 2016, representing 88% of all biotech revenue. Since 2011, the amount of revenue generated by commercial leaders has doubled from US$61 billion; in that same span, the number of commercial leaders in the US and Europe has grown from 23 to 27. Revenue for non-commercial leaders dropped 0.5% to US$17.1 billion as four companies (Acorda Therapeutics, AMAG Pharmaceuticals and Opko Health in the US, as well as Swedish Orphan Biovitrum [Sobi] in Europe) ascended to commercial leader status.
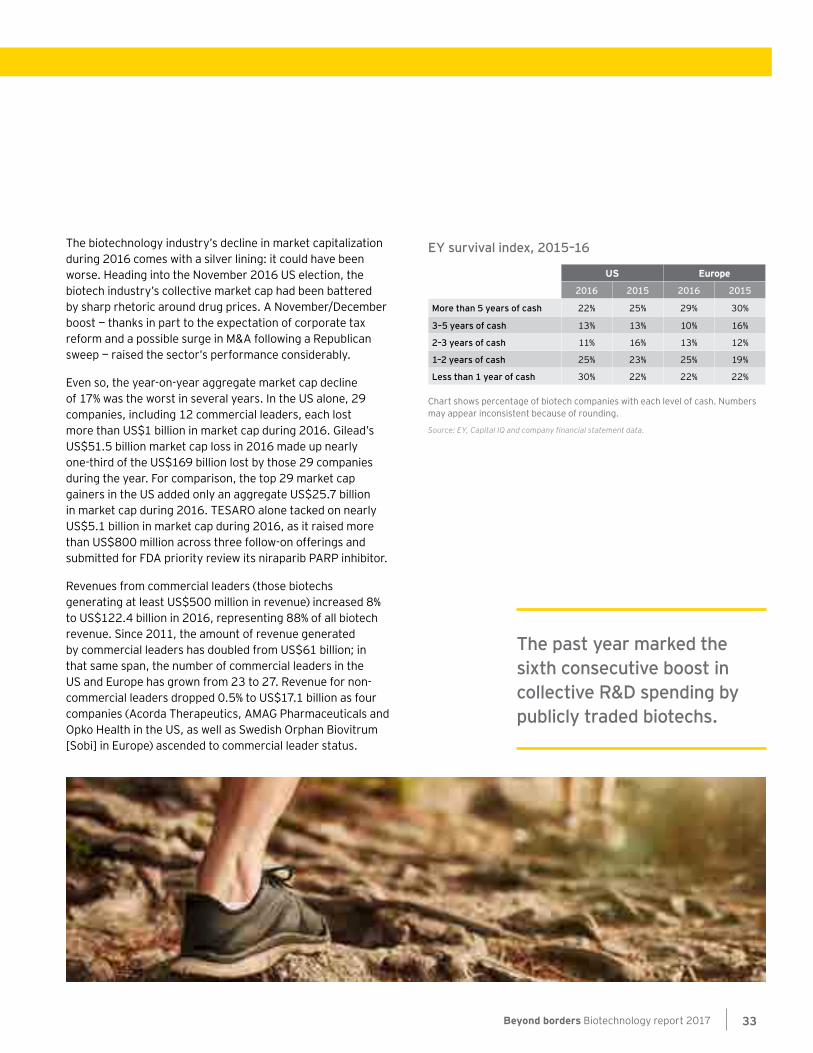
EY survival index, 2015–16
US Europe
2016 2015 2016 2015
More than 5 years of cash 22% 25% 29% 30%
3–5 years of cash 13% 13% 10% 16%
2–3 years of cash 11% 16% 13% 12%
1–2 years of cash 25% 23% 25% 19%
Less than 1 year of cash 30% 22% 22% 22%
Chart shows percentage of biotech companies with each level of cash. Numbers may appear inconsistent because of rounding.
Source: EY, Capital IQ and company financial statement data.
The past year marked the sixth consecutive boost in collective R&D spending by publicly traded biotechs.
Beyond borders Biotechnology report 2017 33
Three commercial leaders were lost to M&A in 2016: oncology-focused Medivation was acquired by Pfizer, diagnostic company Cepheid was acquired by Danaher, and Sweden’s Meda specialty pharma was acquired by Mylan.
As cash raised in follow-on offerings fell sharply in 2016 and R&D spending ramped up, publicly traded biotechs saw their cash reserves drop during the year. US biotechs in particular sat atop a thinner cash cushion, with 30% ending the year with less than a year’s worth of cash based on current burn rates. More than half of US biotechs, 55%, held less than two years of cash. European biotechs fared slightly better, but still 47% of publicly traded companies there held less than two years of cash.
Dwindling cash reserves might nudge more companies into M&A or partnership discussions during 2017 as the hunt for non-dilutive financing heats up.
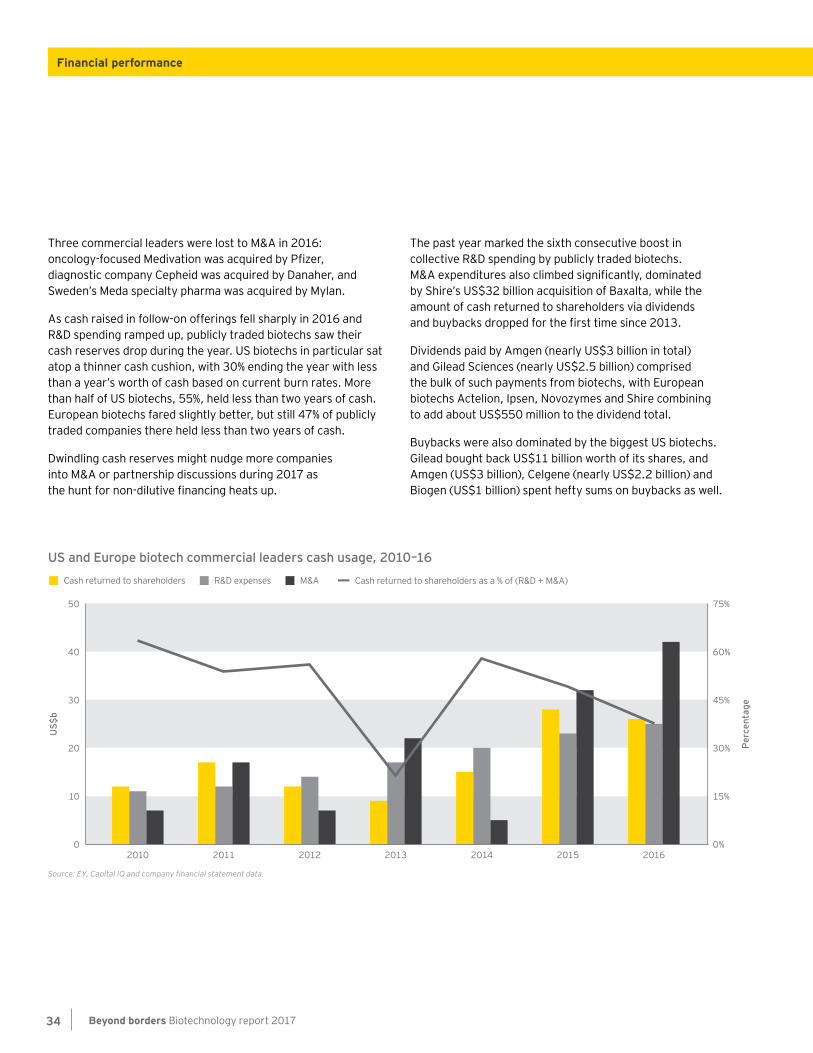
The past year marked the sixth consecutive boost in collective R&D spending by publicly traded biotechs. M&A expenditures also climbed significantly, dominated by Shire’s US$32 billion acquisition of Baxalta, while the amount of cash returned to shareholders via dividends and buybacks dropped for the first time since 2013.
Dividends paid by Amgen (nearly US$3 billion in total) and Gilead Sciences (nearly US$2.5 billion) comprised the bulk of such payments from biotechs, with European biotechs Actelion, Ipsen, Novozymes and Shire combining to add about US$550 million to the dividend total.
Buybacks were also dominated by the biggest US biotechs. Gilead bought back US$11 billion worth of its shares, and Amgen (US$3 billion), Celgene (nearly US$2.2 billion) and Biogen (US$1 billion) spent hefty sums on buybacks as well.
Source: EY, Capital IQ and company financial statement data.
US and Europe biotech commercial leaders cash usage, 2010–16
US$
b
Perc
enta
ge
75%
60%
45%
30%
15%
0%
40
30
20
10
0
50
Cash returned to shareholders as a % of (R&D + M&A)Cash returned to shareholders R&D expenses M&A
2010 2011 2012 2013 2014 2015 2016
Beyond borders Biotechnology report 201734
Financial performance

Beyond borders Biotechnology report 2017 35
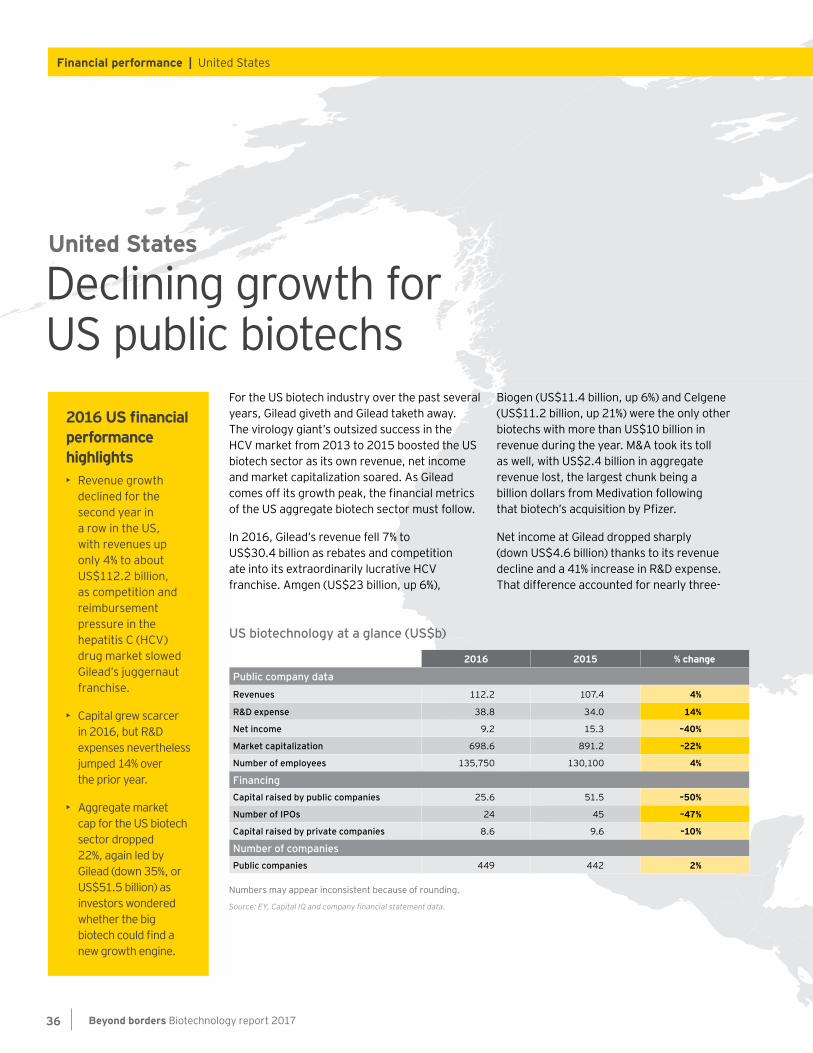
For the US biotech industry over the past several years, Gilead giveth and Gilead taketh away. The virology giant’s outsized success in the HCV market from 2013 to 2015 boosted the US biotech sector as its own revenue, net income and market capitalization soared. As Gilead comes off its growth peak, the financial metrics of the US aggregate biotech sector must follow.
In 2016, Gilead’s revenue fell 7% to US$30.4 billion as rebates and competition ate into its extraordinarily lucrative HCV franchise. Amgen (US$23 billion, up 6%),
Biogen (US$11.4 billion, up 6%) and Celgene (US$11.2 billion, up 21%) were the only other biotechs with more than US$10 billion in revenue during the year. M&A took its toll as well, with US$2.4 billion in aggregate revenue lost, the largest chunk being a billion dollars from Medivation following that biotech’s acquisition by Pfizer.
Net income at Gilead dropped sharply (down US$4.6 billion) thanks to its revenue decline and a 41% increase in R&D expense. That difference accounted for nearly three-
Declining growth for US public biotechs
United States
2016 US financial performance highlights• Revenue growth
declined for the second year in a row in the US, with revenues up only 4% to about US$112.2 billion, as competition and reimbursement pressure in the hepatitis C (HCV) drug market slowed Gilead’s juggernaut franchise.
• Capital grew scarcer in 2016, but R&D expenses nevertheless jumped 14% over the prior year.
• Aggregate market cap for the US biotech sector dropped 22%, again led by Gilead (down 35%, or US$51.5 billion) as investors wondered whether the big biotech could find a new growth engine.
US biotechnology at a glance (US$b)
2016 2015 % change
Public company data
Revenues 112.2 107.4 4%
R&D expense 38.8 34.0 14%
Net income 9.2 15.3 –40%
Market capitalization 698.6 891.2 –22%
Number of employees 135,750 130,100 4%
FinancingCapital raised by public companies 25.6 51.5 –50%
Number of IPOs 24 45 –47%
Capital raised by private companies 8.6 9.6 –10%
Number of companiesPublic companies 449 442 2%
Numbers may appear inconsistent because of rounding.
Source: EY, Capital IQ and company financial statement data.
Beyond borders Biotechnology report 201736
Financial performance | United States
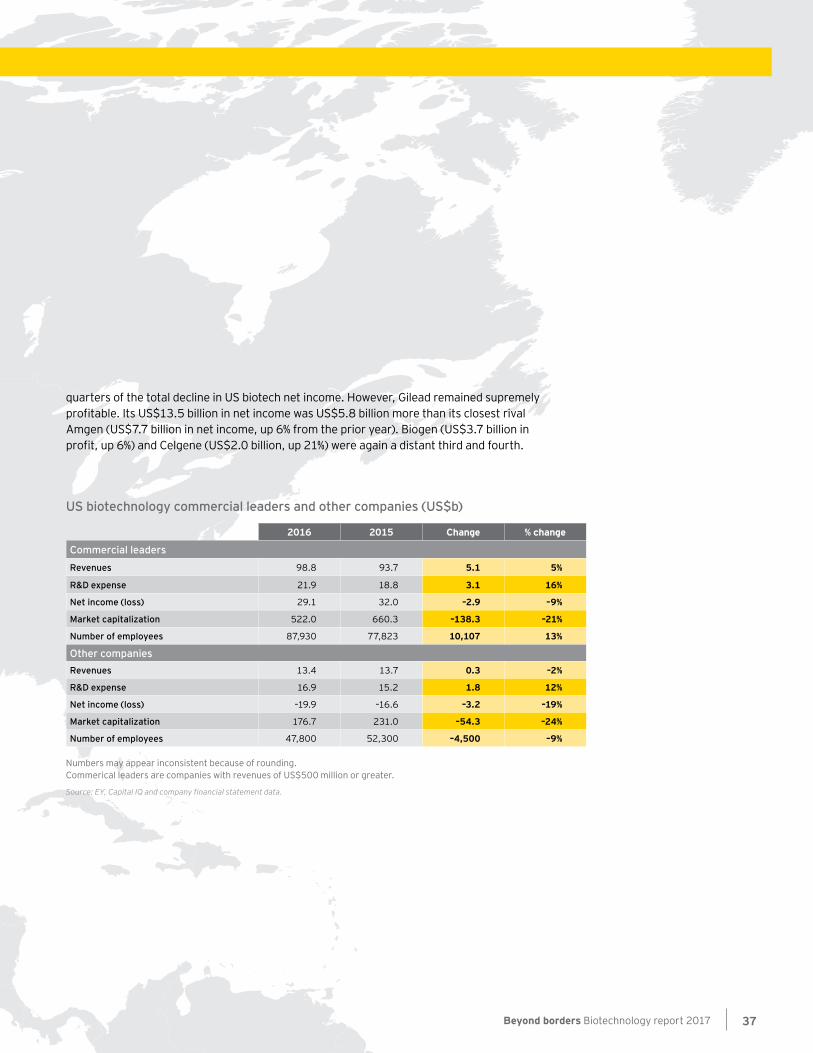
quarters of the total decline in US biotech net income. However, Gilead remained supremely profitable. Its US$13.5 billion in net income was US$5.8 billion more than its closest rival Amgen (US$7.7 billion in net income, up 6% from the prior year). Biogen (US$3.7 billion in profit, up 6%) and Celgene (US$2.0 billion, up 21%) were again a distant third and fourth.
US biotechnology commercial leaders and other companies (US$b)
2016 2015 Change % change
Commercial leaders
Revenues 98.8 93.7 5.1 5%
R&D expense 21.9 18.8 3.1 16%
Net income (loss) 29.1 32.0 –2.9 –9%
Market capitalization 522.0 660.3 –138.3 –21%
Number of employees 87,930 77,823 10,107 13%
Other companiesRevenues 13.4 13.7 0.3 –2%
R&D expense 16.9 15.2 1.8 12%
Net income (loss) –19.9 –16.6 –3.2 –19%
Market capitalization 176.7 231.0 –54.3 –24%
Number of employees 47,800 52,300 –4,500 –9%
Numbers may appear inconsistent because of rounding. Commerical leaders are companies with revenues of US$500 million or greater.
Source: EY, Capital IQ and company financial statement data.
Beyond borders Biotechnology report 2017 37
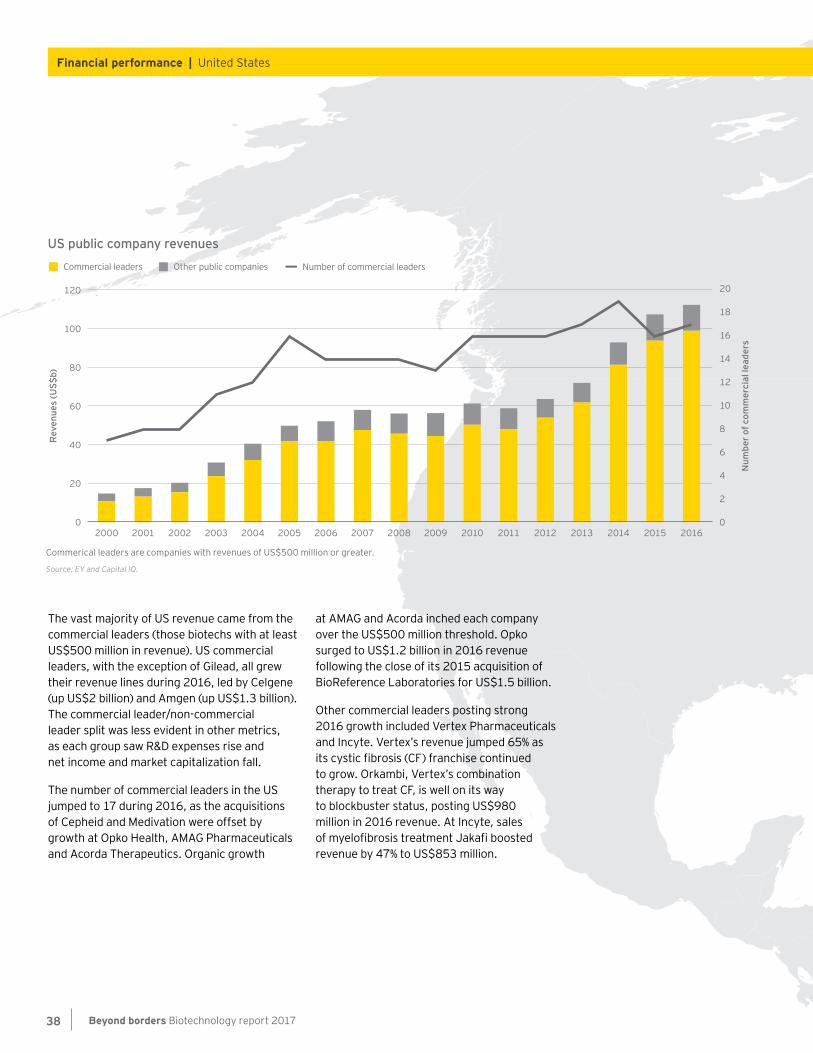
The vast majority of US revenue came from the commercial leaders (those biotechs with at least US$500 million in revenue). US commercial leaders, with the exception of Gilead, all grew their revenue lines during 2016, led by Celgene (up US$2 billion) and Amgen (up US$1.3 billion). The commercial leader/non-commercial leader split was less evident in other metrics, as each group saw R&D expenses rise and net income and market capitalization fall.
The number of commercial leaders in the US jumped to 17 during 2016, as the acquisitions of Cepheid and Medivation were offset by growth at Opko Health, AMAG Pharmaceuticals and Acorda Therapeutics. Organic growth
at AMAG and Acorda inched each company over the US$500 million threshold. Opko surged to US$1.2 billion in 2016 revenue following the close of its 2015 acquisition of BioReference Laboratories for US$1.5 billion.
Other commercial leaders posting strong 2016 growth included Vertex Pharmaceuticals and Incyte. Vertex’s revenue jumped 65% as its cystic fibrosis (CF) franchise continued to grow. Orkambi, Vertex’s combination therapy to treat CF, is well on its way to blockbuster status, posting US$980 million in 2016 revenue. At Incyte, sales of myelofibrosis treatment Jakafi boosted revenue by 47% to US$853 million.
Commerical leaders are companies with revenues of US$500 million or greater.
Source: EY and Capital IQ.
US public company revenues
Rev
enue
s (U
S$b)
Num
ber o
f com
mer
cial
lead
ers
20
18
16
14
12
10
8
6
4
2
0
120
60
40
0
20
80
100
Number of commercial leadersCommercial leaders Other public companies
20062000 20082001 20092002 20102003 20112004 20122005 20132007 2014 2015 2016
Beyond borders Biotechnology report 201738
Financial performance | United States
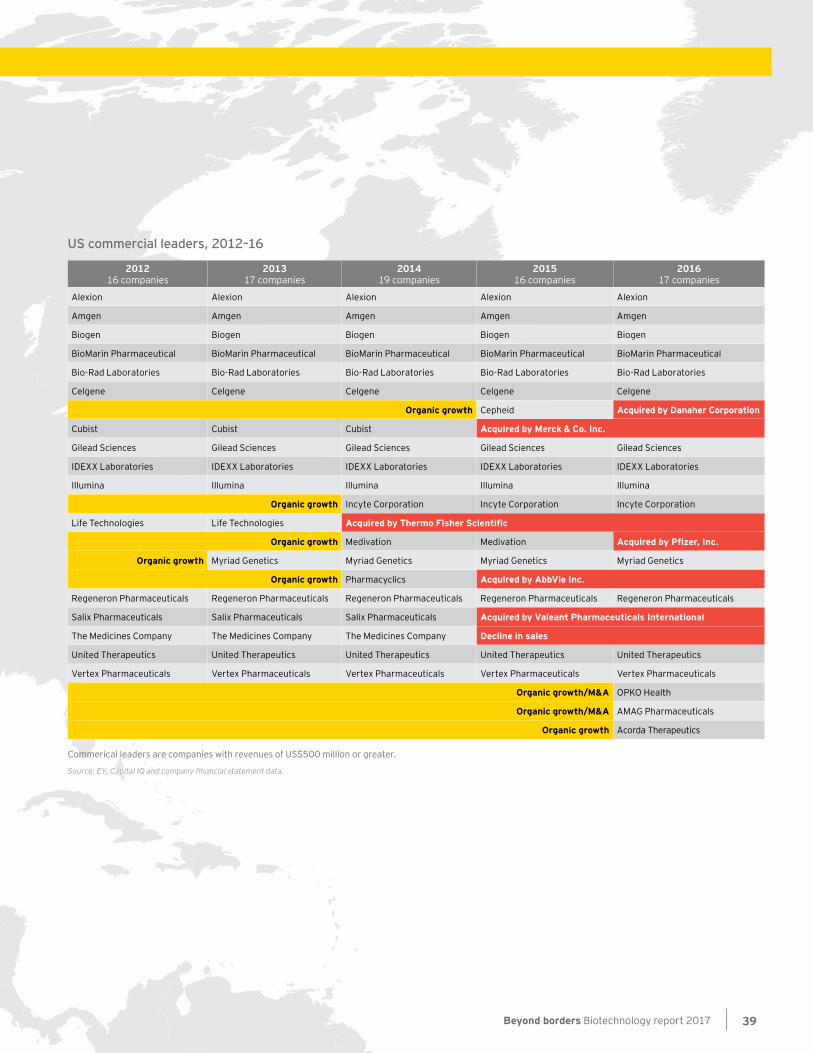
2012 16 companies
2013 17 companies
2014 19 companies
2015 16 companies
2016 17 companies
Alexion Alexion Alexion Alexion Alexion
Amgen Amgen Amgen Amgen Amgen
Biogen Biogen Biogen Biogen Biogen
BioMarin Pharmaceutical BioMarin Pharmaceutical BioMarin Pharmaceutical BioMarin Pharmaceutical BioMarin Pharmaceutical
Bio-Rad Laboratories Bio-Rad Laboratories Bio-Rad Laboratories Bio-Rad Laboratories Bio-Rad Laboratories
Celgene Celgene Celgene Celgene Celgene
Organic growth Cepheid Acquired by Danaher Corporation
Cubist Cubist Cubist Acquired by Merck & Co. Inc.
Gilead Sciences Gilead Sciences Gilead Sciences Gilead Sciences Gilead Sciences
IDEXX Laboratories IDEXX Laboratories IDEXX Laboratories IDEXX Laboratories IDEXX Laboratories
Illumina Illumina Illumina Illumina Illumina
Organic growth Incyte Corporation Incyte Corporation Incyte Corporation
Life Technologies Life Technologies Acquired by Thermo Fisher Scientific
Organic growth Medivation Medivation Acquired by Pfizer, Inc.
Organic growth Myriad Genetics Myriad Genetics Myriad Genetics Myriad Genetics
Organic growth Pharmacyclics Acquired by AbbVie Inc.
Regeneron Pharmaceuticals Regeneron Pharmaceuticals Regeneron Pharmaceuticals Regeneron Pharmaceuticals Regeneron Pharmaceuticals
Salix Pharmaceuticals Salix Pharmaceuticals Salix Pharmaceuticals Acquired by Valeant Pharmaceuticals International
The Medicines Company The Medicines Company The Medicines Company Decline in sales
United Therapeutics United Therapeutics United Therapeutics United Therapeutics United Therapeutics
Vertex Pharmaceuticals Vertex Pharmaceuticals Vertex Pharmaceuticals Vertex Pharmaceuticals Vertex Pharmaceuticals
Organic growth/M&A OPKO Health
Organic growth/M&A AMAG Pharmaceuticals
Organic growth Acorda Therapeutics
US commercial leaders, 2012–16
Commerical leaders are companies with revenues of US$500 million or greater.
Source: EY, Capital IQ and company financial statement data.
Beyond borders Biotechnology report 2017 39
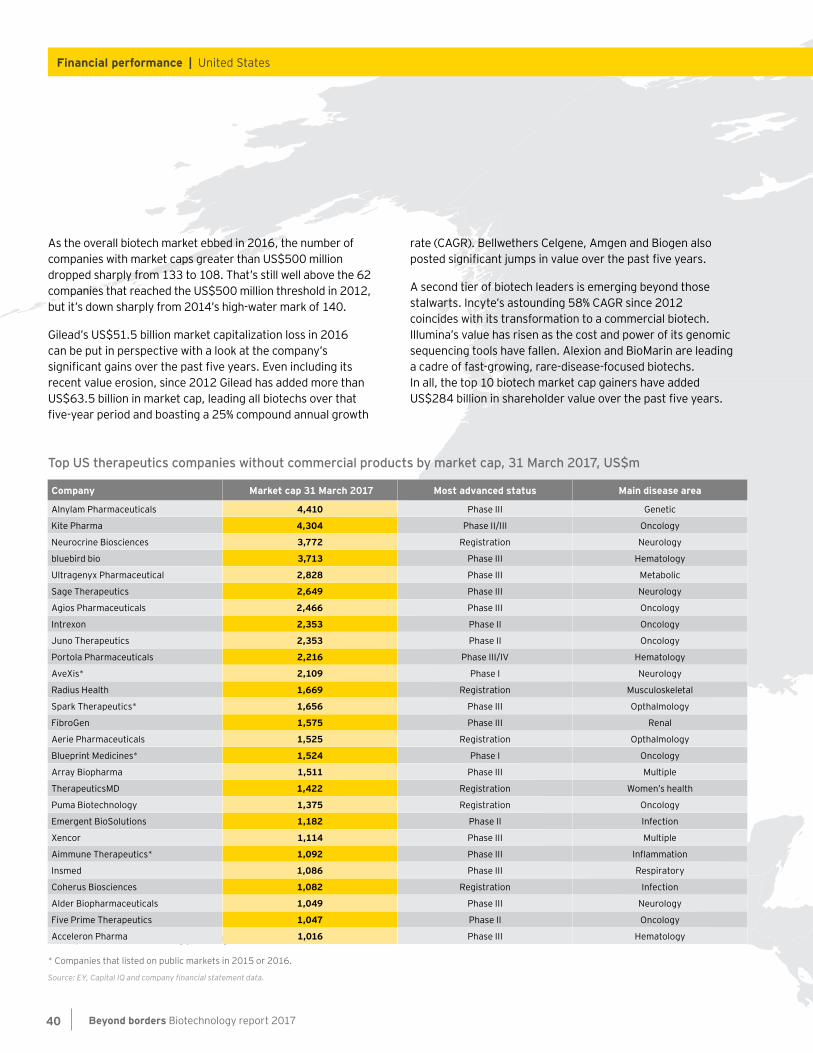
As the overall biotech market ebbed in 2016, the number of companies with market caps greater than US$500 million dropped sharply from 133 to 108. That’s still well above the 62 companies that reached the US$500 million threshold in 2012, but it’s down sharply from 2014’s high-water mark of 140.
Gilead’s US$51.5 billion market capitalization loss in 2016 can be put in perspective with a look at the company’s significant gains over the past five years. Even including its recent value erosion, since 2012 Gilead has added more than US$63.5 billion in market cap, leading all biotechs over that five-year period and boasting a 25% compound annual growth
rate (CAGR). Bellwethers Celgene, Amgen and Biogen also posted significant jumps in value over the past five years.
A second tier of biotech leaders is emerging beyond those stalwarts. Incyte’s astounding 58% CAGR since 2012 coincides with its transformation to a commercial biotech. Illumina’s value has risen as the cost and power of its genomic sequencing tools have fallen. Alexion and BioMarin are leading a cadre of fast-growing, rare-disease-focused biotechs. In all, the top 10 biotech market cap gainers have added US$284 billion in shareholder value over the past five years.
Top US therapeutics companies without commercial products by market cap, 31 March 2017, US$m
European biotechnology at a glance, (US$b)
Company Market cap 31 March 2017 Most advanced status Main disease area
Alnylam Pharmaceuticals 4,410 Phase III Genetic
Kite Pharma 4,304 Phase II/III Oncology
Neurocrine Biosciences 3,772 Registration Neurology
bluebird bio 3,713 Phase III Hematology
Ultragenyx Pharmaceutical 2,828 Phase III Metabolic
Sage Therapeutics 2,649 Phase III Neurology
Agios Pharmaceuticals 2,466 Phase III Oncology
Intrexon 2,353 Phase II Oncology
Juno Therapeutics 2,353 Phase II Oncology
Portola Pharmaceuticals 2,216 Phase III/IV Hematology
AveXis* 2,109 Phase I Neurology
Radius Health 1,669 Registration Musculoskeletal
Spark Therapeutics* 1,656 Phase III Opthalmology
FibroGen 1,575 Phase III Renal
Aerie Pharmaceuticals 1,525 Registration Opthalmology
Blueprint Medicines* 1,524 Phase I Oncology
Array Biopharma 1,511 Phase III Multiple
TherapeuticsMD 1,422 Registration Women’s health
Puma Biotechnology 1,375 Registration Oncology
Emergent BioSolutions 1,182 Phase II Infection
Xencor 1,114 Phase III Multiple
Aimmune Therapeutics* 1,092 Phase III Inflammation
Insmed 1,086 Phase III Respiratory
Coherus Biosciences 1,082 Registration Infection
Alder Biopharmaceuticals 1,049 Phase III Neurology
Five Prime Therapeutics 1,047 Phase II Oncology
Acceleron Pharma 1,016 Phase III Hematology
* Companies that listed on public markets in 2015 or 2016.
Source: EY, Capital IQ and company financial statement data.
Beyond borders Biotechnology report 201740
Financial performance | United States
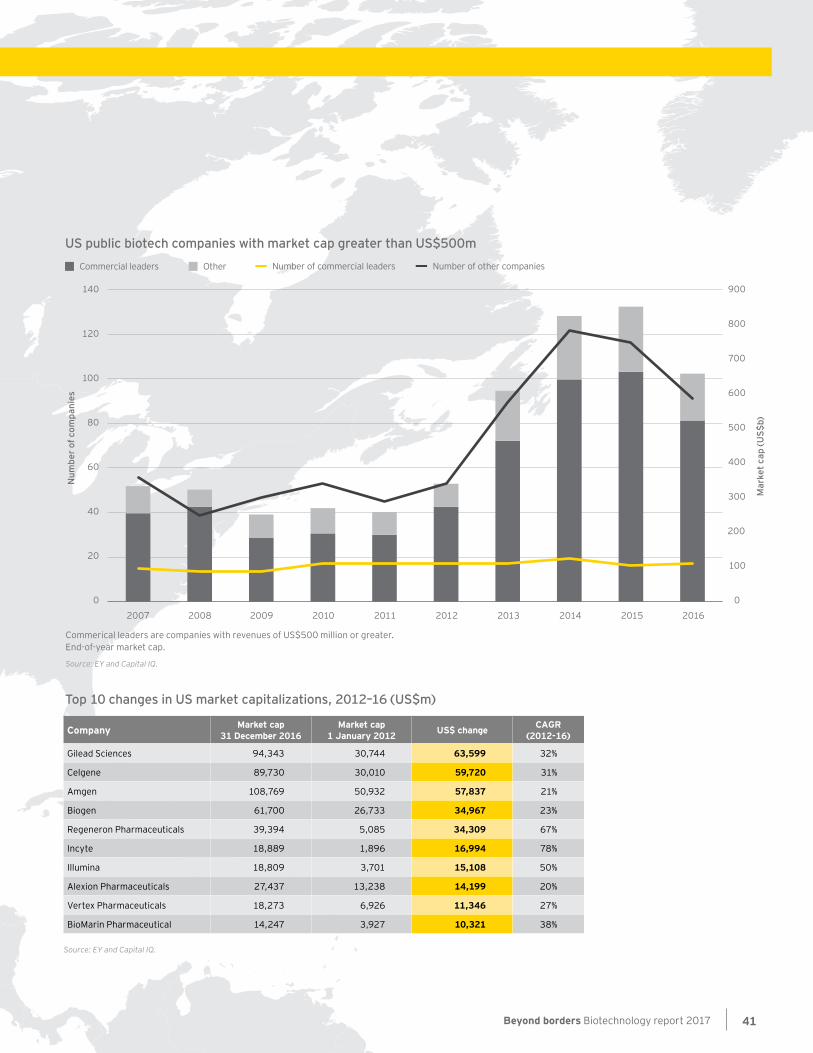
Top 10 changes in US market capitalizations, 2012–16 (US$m)
Company Market cap 31 December 2016
Market cap 1 January 2012 US$ change CAGR
(2012-16)
Gilead Sciences 94,343 30,744 63,599 32%
Celgene 89,730 30,010 59,720 31%
Amgen 108,769 50,932 57,837 21%
Biogen 61,700 26,733 34,967 23%
Regeneron Pharmaceuticals 39,394 5,085 34,309 67%
Incyte 18,889 1,896 16,994 78%
Illumina 18,809 3,701 15,108 50%
Alexion Pharmaceuticals 27,437 13,238 14,199 20%
Vertex Pharmaceuticals 18,273 6,926 11,346 27%
BioMarin Pharmaceutical 14,247 3,927 10,321 38%
Source: EY and Capital IQ.
US public biotech companies with market cap greater than US$500mNumber of commercial leadersCommercial leaders Other
Num
ber o
f com
pani
es
100
80
40
60
20
0
120
140
Commerical leaders are companies with revenues of US$500 million or greater. End-of-year market cap.
Source: EY and Capital IQ.
Mar
ket c
ap (U
S$b)
0
700
600
400
500
300
800
900
200
100
Number of other companies
2008 2009 2010 2011 2012 20132007 2014 2015 2016
Beyond borders Biotechnology report 2017 41
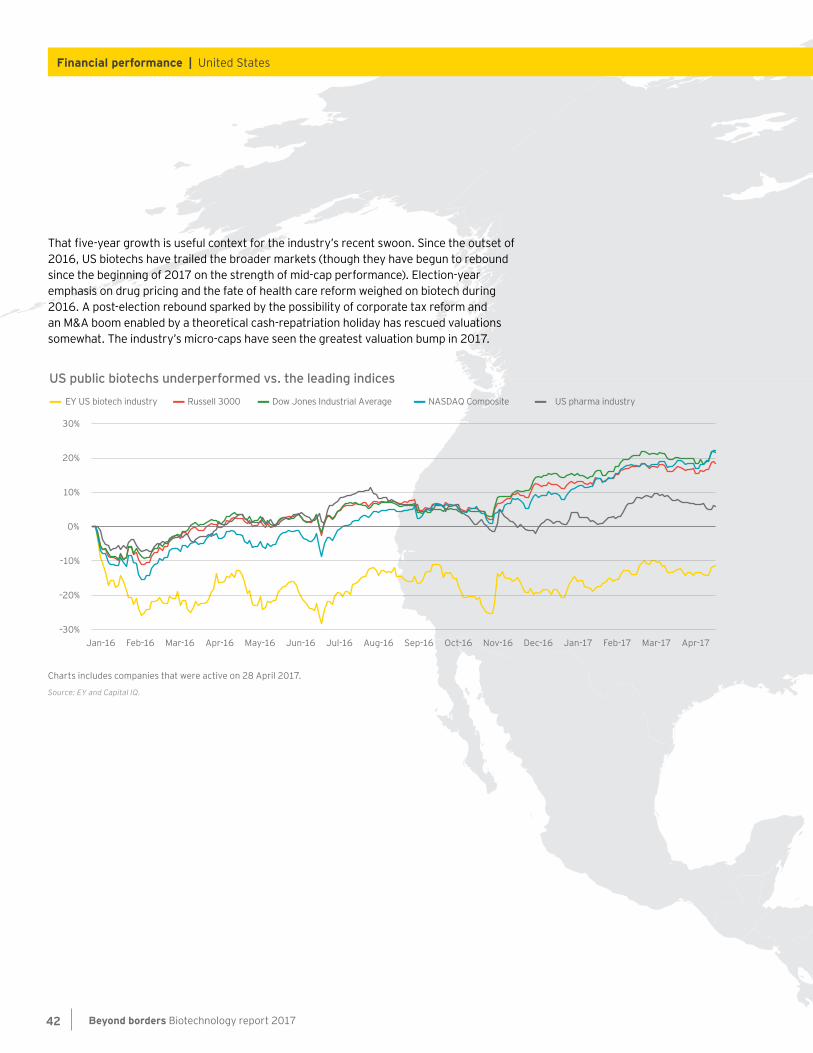
That five-year growth is useful context for the industry’s recent swoon. Since the outset of 2016, US biotechs have trailed the broader markets (though they have begun to rebound since the beginning of 2017 on the strength of mid-cap performance). Election-year emphasis on drug pricing and the fate of health care reform weighed on biotech during 2016. A post-election rebound sparked by the possibility of corporate tax reform and an M&A boom enabled by a theoretical cash-repatriation holiday has rescued valuations somewhat. The industry’s micro-caps have seen the greatest valuation bump in 2017.
US public biotechs underperformed vs. the leading indices
–30%
–20%
–10%
0%
30%
20%
10%
EY US biotech industry Russell 3000 Dow Jones Industrial Average NASDAQ Composite US pharma industry
Jan-16 Feb-17Feb-16 Mar-17Mar-16 Apr-17Apr-16 May-16 Jun-16 Jul-16 Aug-16 Sep-16 Oct-16 Nov-16 Dec-16 Jan-17
Charts includes companies that were active on 28 April 2017.
Source: EY and Capital IQ.
Beyond borders Biotechnology report 201742
Financial performance | United States

Beyond borders Biotechnology report 2017 43
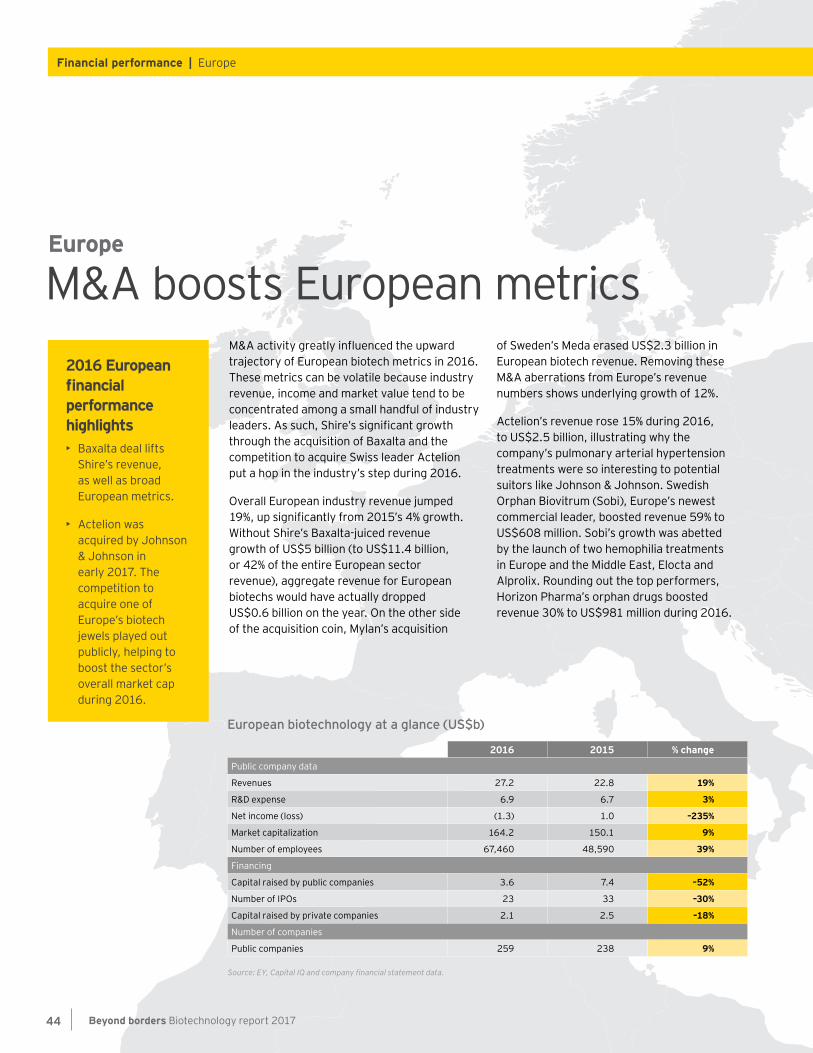
M&A activity greatly influenced the upward trajectory of European biotech metrics in 2016. These metrics can be volatile because industry revenue, income and market value tend to be concentrated among a small handful of industry leaders. As such, Shire’s significant growth through the acquisition of Baxalta and the competition to acquire Swiss leader Actelion put a hop in the industry’s step during 2016.
Overall European industry revenue jumped 19%, up significantly from 2015’s 4% growth. Without Shire’s Baxalta-juiced revenue growth of US$5 billion (to US$11.4 billion, or 42% of the entire European sector revenue), aggregate revenue for European biotechs would have actually dropped US$0.6 billion on the year. On the other side of the acquisition coin, Mylan’s acquisition
of Sweden’s Meda erased US$2.3 billion in European biotech revenue. Removing these M&A aberrations from Europe’s revenue numbers shows underlying growth of 12%.
Actelion’s revenue rose 15% during 2016, to US$2.5 billion, illustrating why the company’s pulmonary arterial hypertension treatments were so interesting to potential suitors like Johnson & Johnson. Swedish Orphan Biovitrum (Sobi), Europe’s newest commercial leader, boosted revenue 59% to US$608 million. Sobi’s growth was abetted by the launch of two hemophilia treatments in Europe and the Middle East, Elocta and Alprolix. Rounding out the top performers, Horizon Pharma’s orphan drugs boosted revenue 30% to US$981 million during 2016.
M&A boosts European metricsEurope
2016 European financial performance highlights• Baxalta deal lifts
Shire’s revenue, as well as broad European metrics.
• Actelion was acquired by Johnson & Johnson in early 2017. The competition to acquire one of Europe’s biotech jewels played out publicly, helping to boost the sector’s overall market cap during 2016.
European biotechnology at a glance (US$b)
2016 2015 % changePublic company data
Revenues 27.2 22.8 19%
R&D expense 6.9 6.7 3%
Net income (loss) (1.3) 1.0 –235%
Market capitalization 164.2 150.1 9%
Number of employees 67,460 48,590 39%
Financing
Capital raised by public companies 3.6 7.4 –52%
Number of IPOs 23 33 –30%
Capital raised by private companies 2.1 2.5 –18%
Number of companies
Public companies 259 238 9%
Source: EY, Capital IQ and company financial statement data.
Beyond borders Biotechnology report 201744
Financial performance | Europe
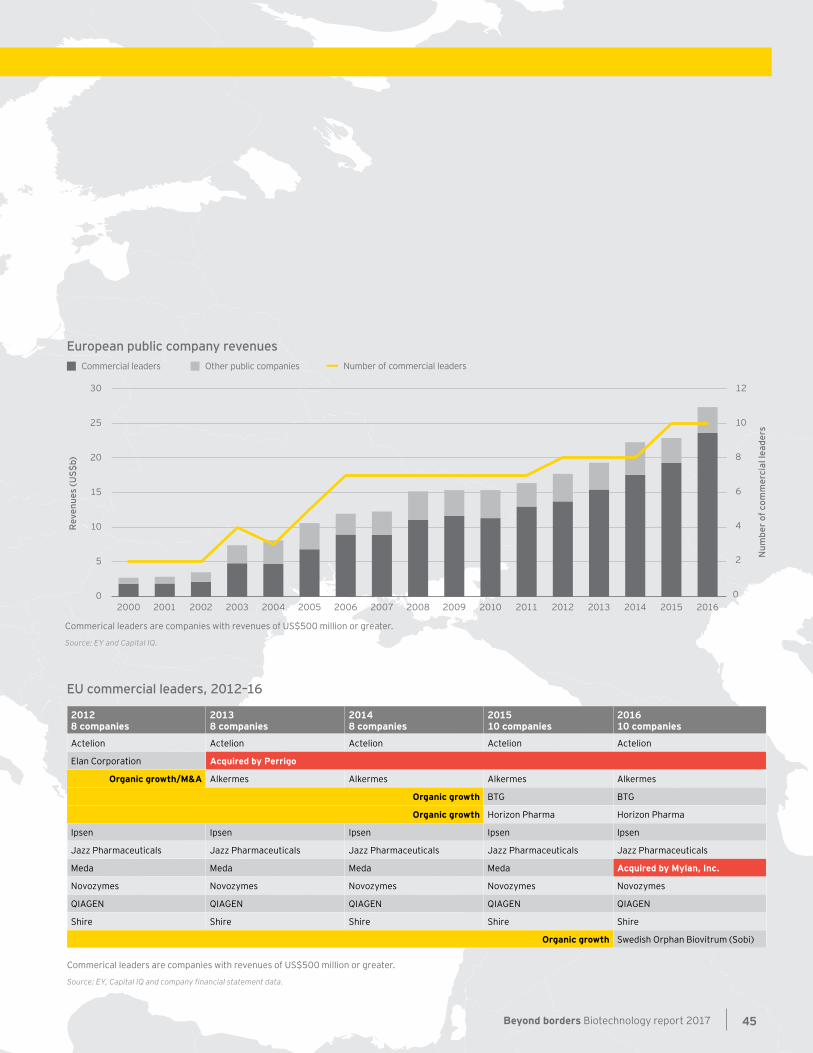
European public company revenuesNumber of commercial leadersCommercial leaders Other public companies
Rev
enue
s (U
S$b)
10 4
15 6
20 8
25 10
30 12
5 2
0 0
Num
ber o
f com
mer
cial
lead
ers
Commerical leaders are companies with revenues of US$500 million or greater.
Source: EY and Capital IQ.
20062000 20082001 20092002 20102003 20112004 20122005 20132007 2014 2015 2016
2012 8 companies
2013 8 companies
2014 8 companies
2015 10 companies
2016 10 companies
Actelion Actelion Actelion Actelion Actelion
Elan Corporation Acquired by Perrigo
Organic growth/M&A Alkermes Alkermes Alkermes Alkermes
Organic growth BTG BTG
Organic growth Horizon Pharma Horizon Pharma
Ipsen Ipsen Ipsen Ipsen Ipsen
Jazz Pharmaceuticals Jazz Pharmaceuticals Jazz Pharmaceuticals Jazz Pharmaceuticals Jazz Pharmaceuticals
Meda Meda Meda Meda Acquired by Mylan, Inc.
Novozymes Novozymes Novozymes Novozymes Novozymes
QIAGEN QIAGEN QIAGEN QIAGEN QIAGEN
Shire Shire Shire Shire Shire
Organic growth Swedish Orphan Biovitrum (Sobi)
EU commercial leaders, 2012–16
Commerical leaders are companies with revenues of US$500 million or greater.
Source: EY, Capital IQ and company financial statement data.
Beyond borders Biotechnology report 2017 45
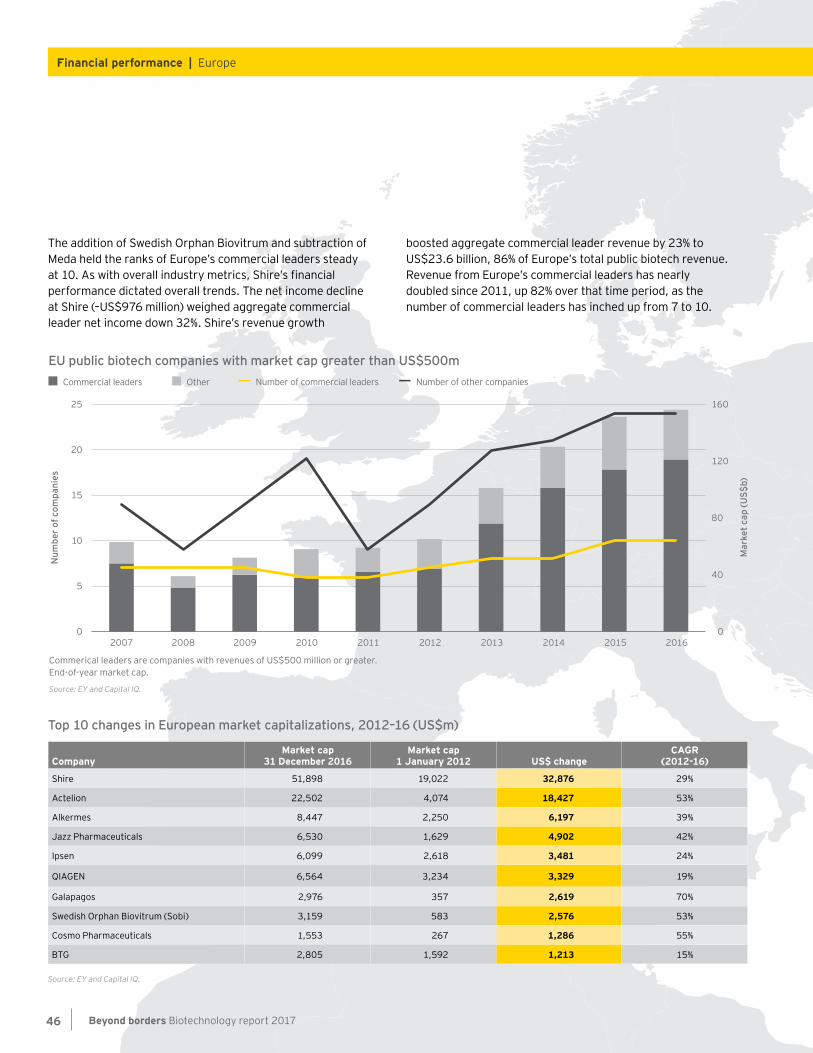
The addition of Swedish Orphan Biovitrum and subtraction of Meda held the ranks of Europe’s commercial leaders steady at 10. As with overall industry metrics, Shire’s financial performance dictated overall trends. The net income decline at Shire (–US$976 million) weighed aggregate commercial leader net income down 32%. Shire’s revenue growth
boosted aggregate commercial leader revenue by 23% to US$23.6 billion, 86% of Europe’s total public biotech revenue. Revenue from Europe’s commercial leaders has nearly doubled since 2011, up 82% over that time period, as the number of commercial leaders has inched up from 7 to 10.
Top 10 changes in European market capitalizations, 2012–16 (US$m)
CompanyMarket cap
31 December 2016Market cap
1 January 2012 US$ changeCAGR
(2012-16)
Shire 51,898 19,022 32,876 29%
Actelion 22,502 4,074 18,427 53%
Alkermes 8,447 2,250 6,197 39%
Jazz Pharmaceuticals 6,530 1,629 4,902 42%
Ipsen 6,099 2,618 3,481 24%
QIAGEN 6,564 3,234 3,329 19%
Galapagos 2,976 357 2,619 70%
Swedish Orphan Biovitrum (Sobi) 3,159 583 2,576 53%
Cosmo Pharmaceuticals 1,553 267 1,286 55%
BTG 2,805 1,592 1,213 15%
Source: EY and Capital IQ.
EU public biotech companies with market cap greater than US$500mNumber of commercial leadersCommercial leaders Other
Num
ber o
f com
pani
es
15
10
5
0
20
25
Commerical leaders are companies with revenues of US$500 million or greater. End-of-year market cap.
Source: EY and Capital IQ.
Mar
ket c
ap (U
S$b)
0
80
40
120
160
Number of other companies
2008 2009 2010 2011 2012 20132007 2014 2015 2016
Beyond borders Biotechnology report 201746
Financial performance | Europe
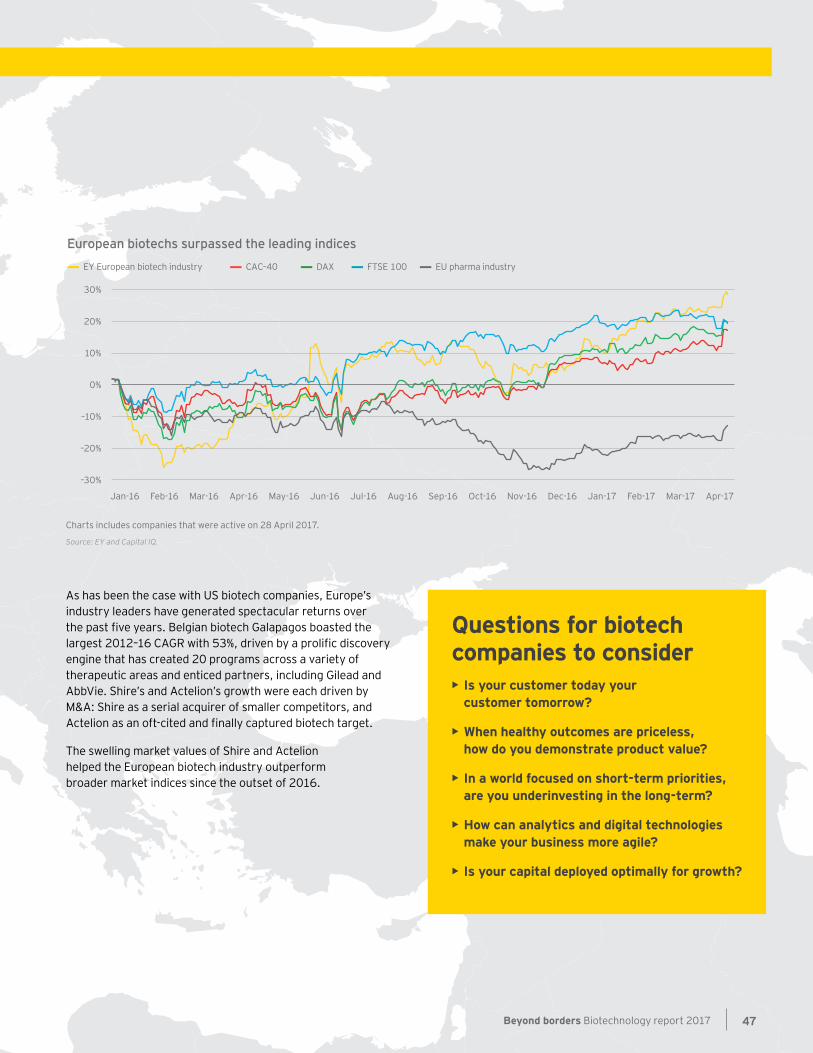
As has been the case with US biotech companies, Europe’s industry leaders have generated spectacular returns over the past five years. Belgian biotech Galapagos boasted the largest 2012–16 CAGR with 53%, driven by a prolific discovery engine that has created 20 programs across a variety of therapeutic areas and enticed partners, including Gilead and AbbVie. Shire’s and Actelion’s growth were each driven by M&A: Shire as a serial acquirer of smaller competitors, and Actelion as an oft-cited and finally captured biotech target.
The swelling market values of Shire and Actelion helped the European biotech industry outperform broader market indices since the outset of 2016.
European biotechs surpassed the leading indices
EY European biotech industry FTSE 100 EU pharma industryCAC–40 DAX
Jan-16 Feb-17Feb-16 Mar-17Mar-16 Apr-17Apr-16 May-16 Jun-16 Jul-16 Aug-16 Sep-16 Oct-16 Nov-16 Dec-16 Jan-17
Charts includes companies that were active on 28 April 2017.
Source: EY and Capital IQ.
–30%
–20%
–10%
0%
10%
20%
30%
Questions for biotech companies to consider• Is your customer today your
customer tomorrow?
• When healthy outcomes are priceless, how do you demonstrate product value?
• In a world focused on short-term priorities, are you underinvesting in the long-term?
• How can analytics and digital technologies make your business more agile?
• Is your capital deployed optimally for growth?
Beyond borders Biotechnology report 2017 47

Beyond borders Biotechnology report 201748
Financing
FinancingInvestors downshift in 2016• The biotech industry suffered its first
financing decline since 2012, but it still raised its third highest annual total ever.
• Although IPO and follow-on rounds are off significantly, venture capital financing remains strong and should continue to offer an enticing pipeline of biotech companies for public market investors.
• Strategic investors played an increasingly important role in supporting the industry’s early-stage ecosystem. This support has continued into 2017 and is a fixed and growing element of biotech financing.
• Unsurprisingly, US biotechs garnered the lion’s share of total capital in 2016, with New England and San Francisco Bay Area companies outperforming their peers.
Beyond borders Biotechnology report 2017 49
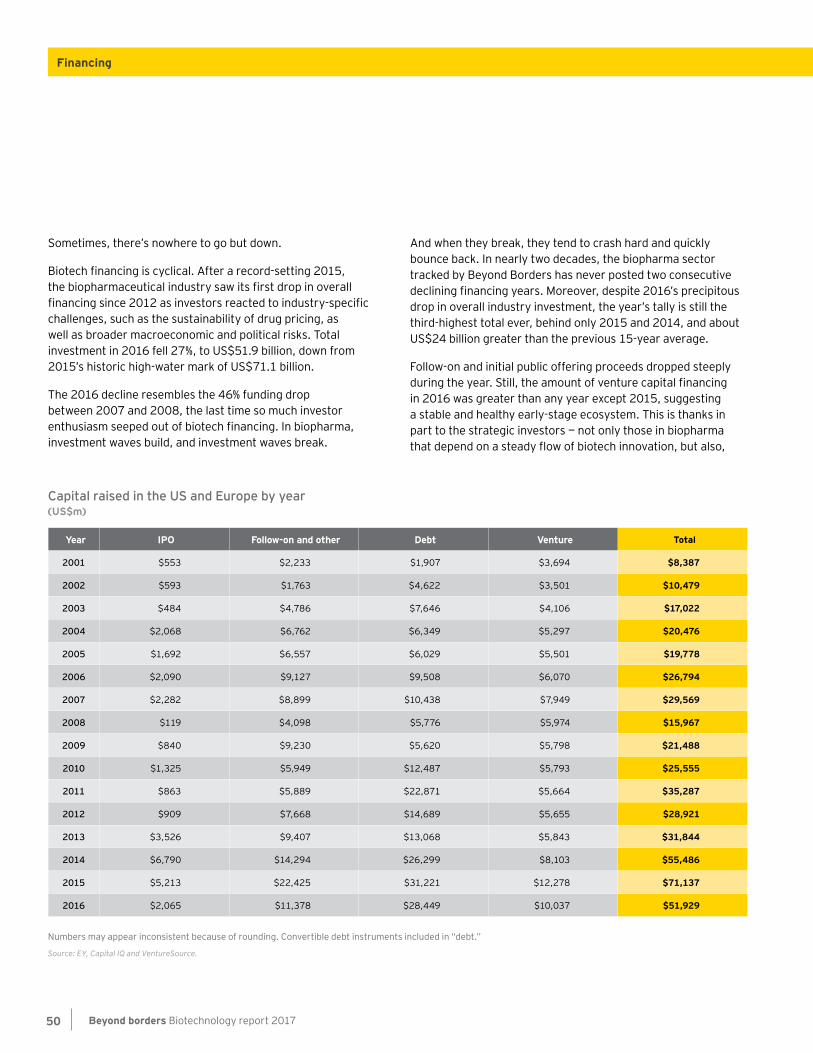
Sometimes, there’s nowhere to go but down.
Biotech financing is cyclical. After a record-setting 2015, the biopharmaceutical industry saw its first drop in overall financing since 2012 as investors reacted to industry-specific challenges, such as the sustainability of drug pricing, as well as broader macroeconomic and political risks. Total investment in 2016 fell 27%, to US$51.9 billion, down from 2015’s historic high-water mark of US$71.1 billion.
The 2016 decline resembles the 46% funding drop between 2007 and 2008, the last time so much investor enthusiasm seeped out of biotech financing. In biopharma, investment waves build, and investment waves break.
And when they break, they tend to crash hard and quickly bounce back. In nearly two decades, the biopharma sector tracked by Beyond Borders has never posted two consecutive declining financing years. Moreover, despite 2016’s precipitous drop in overall industry investment, the year’s tally is still the third-highest total ever, behind only 2015 and 2014, and about US$24 billion greater than the previous 15-year average.
Follow-on and initial public offering proceeds dropped steeply during the year. Still, the amount of venture capital financing in 2016 was greater than any year except 2015, suggesting a stable and healthy early-stage ecosystem. This is thanks in part to the strategic investors — not only those in biopharma that depend on a steady flow of biotech innovation, but also,
Capital raised in the US and Europe by year(US$m)
Year IPO Follow-on and other Debt Venture Total
2001 $553 $2,233 $1,907 $3,694 $8,387
2002 $593 $1,763 $4,622 $3,501 $10,479
2003 $484 $4,786 $7,646 $4,106 $17,022
2004 $2,068 $6,762 $6,349 $5,297 $20,476
2005 $1,692 $6,557 $6,029 $5,501 $19,778
2006 $2,090 $9,127 $9,508 $6,070 $26,794
2007 $2,282 $8,899 $10,438 $7,949 $29,569
2008 $119 $4,098 $5,776 $5,974 $15,967
2009 $840 $9,230 $5,620 $5,798 $21,488
2010 $1,325 $5,949 $12,487 $5,793 $25,555
2011 $863 $5,889 $22,871 $5,664 $35,287
2012 $909 $7,668 $14,689 $5,655 $28,921
2013 $3,526 $9,407 $13,068 $5,843 $31,844
2014 $6,790 $14,294 $26,299 $8,103 $55,486
2015 $5,213 $22,425 $31,221 $12,278 $71,137
2016 $2,065 $11,378 $28,449 $10,037 $51,929
Numbers may appear inconsistent because of rounding. Convertible debt instruments included in “debt.”
Source: EY, Capital IQ and VentureSource.
Beyond borders Biotechnology report 201750
Financing
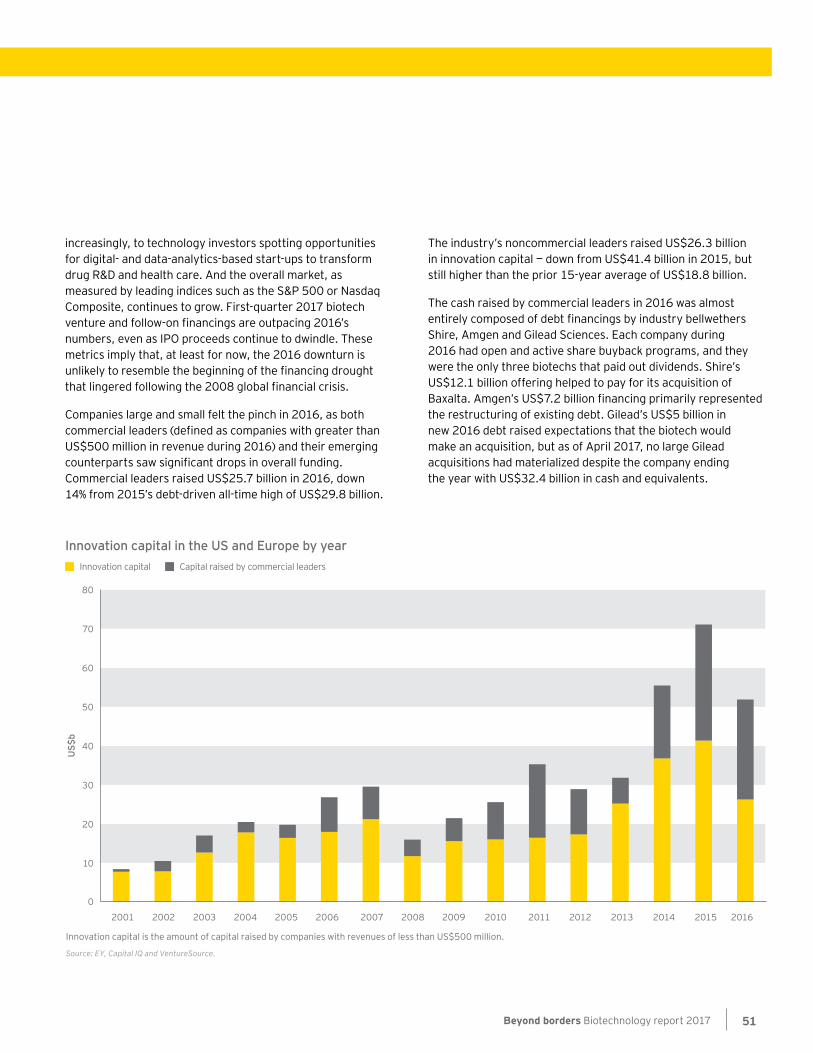
increasingly, to technology investors spotting opportunities for digital- and data-analytics-based start-ups to transform drug R&D and health care. And the overall market, as measured by leading indices such as the S&P 500 or Nasdaq Composite, continues to grow. First-quarter 2017 biotech venture and follow-on financings are outpacing 2016’s numbers, even as IPO proceeds continue to dwindle. These metrics imply that, at least for now, the 2016 downturn is unlikely to resemble the beginning of the financing drought that lingered following the 2008 global financial crisis.
Companies large and small felt the pinch in 2016, as both commercial leaders (defined as companies with greater than US$500 million in revenue during 2016) and their emerging counterparts saw significant drops in overall funding. Commercial leaders raised US$25.7 billion in 2016, down 14% from 2015’s debt-driven all-time high of US$29.8 billion.
Innovation capital in the US and Europe by year
Innovation capital is the amount of capital raised by companies with revenues of less than US$500 million.
Source: EY, Capital IQ and VentureSource.
US$
b
50
70
60
80
40
10
0
20
30
Capital raised by commercial leadersInnovation capital
2001 2002 2003 2004 2005 2006 2007 2008 2009 2010 2011 2012 2013 2014 2015 2016
The industry’s noncommercial leaders raised US$26.3 billion in innovation capital — down from US$41.4 billion in 2015, but still higher than the prior 15-year average of US$18.8 billion.
The cash raised by commercial leaders in 2016 was almost entirely composed of debt financings by industry bellwethers Shire, Amgen and Gilead Sciences. Each company during 2016 had open and active share buyback programs, and they were the only three biotechs that paid out dividends. Shire’s US$12.1 billion offering helped to pay for its acquisition of Baxalta. Amgen’s US$7.2 billion financing primarily represented the restructuring of existing debt. Gilead’s US$5 billion in new 2016 debt raised expectations that the biotech would make an acquisition, but as of April 2017, no large Gilead acquisitions had materialized despite the company ending the year with US$32.4 billion in cash and equivalents.
Beyond borders Biotechnology report 2017 51
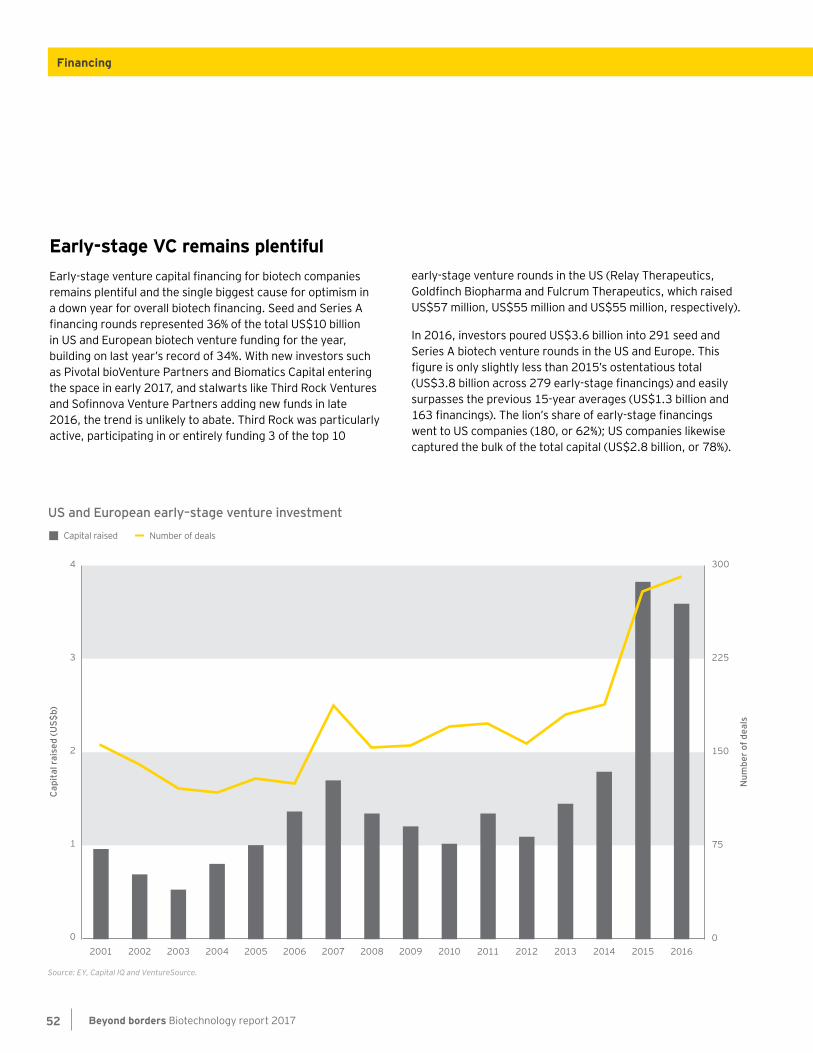
US and European early–stage venture investment
Source: EY, Capital IQ and VentureSource.
Cap
ital
rai
sed
(US$
b)
Num
ber o
f dea
ls
300
225
150
75
0
4
1
0
2
3
Number of dealsCapital raised
2001 2002 2003 2004 2005 2006 2007 2008 2009 2010 2011 2012 2013 2014 2015 2016
Early-stage VC remains plentifulEarly-stage venture capital financing for biotech companies remains plentiful and the single biggest cause for optimism in a down year for overall biotech financing. Seed and Series A financing rounds represented 36% of the total US$10 billion in US and European biotech venture funding for the year, building on last year’s record of 34%. With new investors such as Pivotal bioVenture Partners and Biomatics Capital entering the space in early 2017, and stalwarts like Third Rock Ventures and Sofinnova Venture Partners adding new funds in late 2016, the trend is unlikely to abate. Third Rock was particularly active, participating in or entirely funding 3 of the top 10
early-stage venture rounds in the US (Relay Therapeutics, Goldfinch Biopharma and Fulcrum Therapeutics, which raised US$57 million, US$55 million and US$55 million, respectively).
In 2016, investors poured US$3.6 billion into 291 seed and Series A biotech venture rounds in the US and Europe. This figure is only slightly less than 2015’s ostentatious total (US$3.8 billion across 279 early-stage financings) and easily surpasses the previous 15-year averages (US$1.3 billion and 163 financings). The lion’s share of early-stage financings went to US companies (180, or 62%); US companies likewise captured the bulk of the total capital (US$2.8 billion, or 78%).
Beyond borders Biotechnology report 201752
Financing
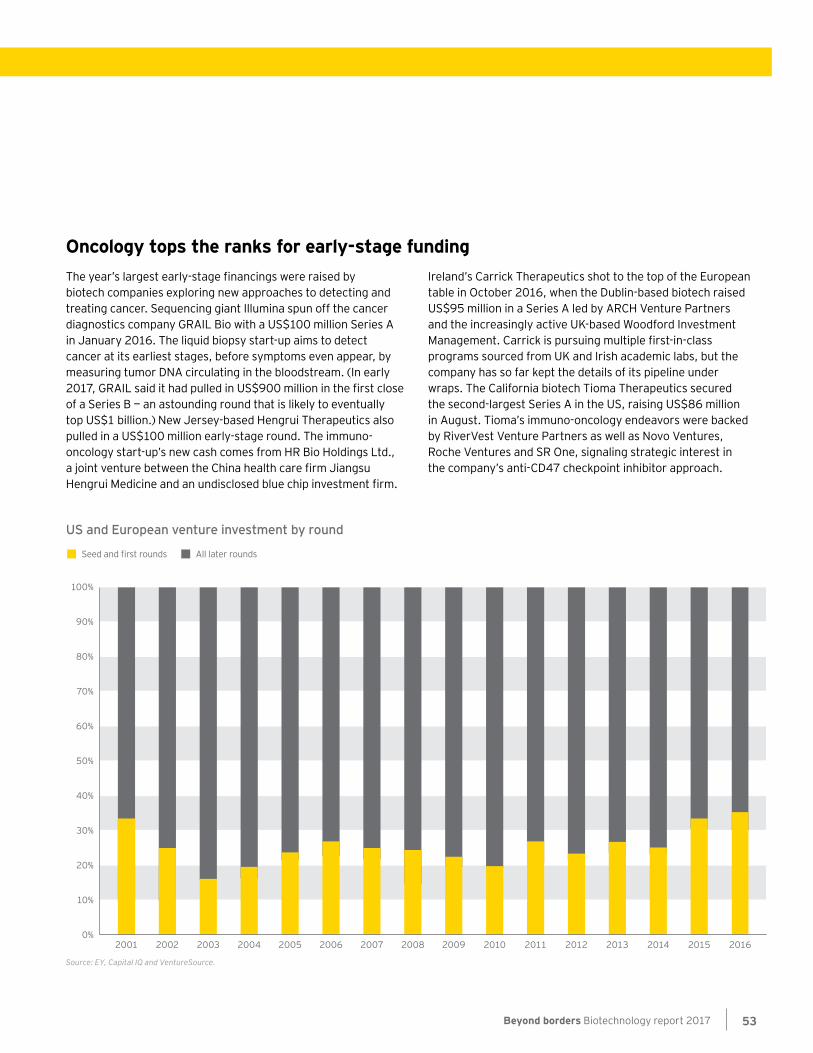
US and European venture investment by round
Source: EY, Capital IQ and VentureSource.
50%
80%
70%
60%
100%
90%
40%
10%
0%
20%
30%
All later roundsSeed and first rounds
2001 2002 2003 2004 2005 2006 2007 2008 2009 2010 2011 2012 2013 2014 2015 2016
Oncology tops the ranks for early-stage fundingThe year’s largest early-stage financings were raised by biotech companies exploring new approaches to detecting and treating cancer. Sequencing giant Illumina spun off the cancer diagnostics company GRAIL Bio with a US$100 million Series A in January 2016. The liquid biopsy start-up aims to detect cancer at its earliest stages, before symptoms even appear, by measuring tumor DNA circulating in the bloodstream. (In early 2017, GRAIL said it had pulled in US$900 million in the first close of a Series B — an astounding round that is likely to eventually top US$1 billion.) New Jersey-based Hengrui Therapeutics also pulled in a US$100 million early-stage round. The immuno-oncology start-up’s new cash comes from HR Bio Holdings Ltd., a joint venture between the China health care firm Jiangsu Hengrui Medicine and an undisclosed blue chip investment firm.
Ireland’s Carrick Therapeutics shot to the top of the European table in October 2016, when the Dublin-based biotech raised US$95 million in a Series A led by ARCH Venture Partners and the increasingly active UK-based Woodford Investment Management. Carrick is pursuing multiple first-in-class programs sourced from UK and Irish academic labs, but the company has so far kept the details of its pipeline under wraps. The California biotech Tioma Therapeutics secured the second-largest Series A in the US, raising US$86 million in August. Tioma’s immuno-oncology endeavors were backed by RiverVest Venture Partners as well as Novo Ventures, Roche Ventures and SR One, signaling strategic interest in the company’s anti-CD47 checkpoint inhibitor approach.
Beyond borders Biotechnology report 2017 53
Corporate VCs pitch into almost half of all biotech venture rounds Interest and support from corporate venture capitalists have been typical of the venture capital investment surge over the past several years. But in 2016, that interest reached new heights, with corporate venture capitalists participating in nearly half of all venture rounds for biotechs in the US and Europe. During the year, strategic investors participated in more than 48% of all biotech venture rounds worth more than US$5 million, up from 36% in 2015 and 34% in 2014. So far in 2017, that trend continues. Most impressively, in March 2017, GRAIL said it had raised US$900 million in the first close of its Series B financing, with an expected second close that would take the total to more than US$1 billion. That extraordinary round — already the largest-ever venture round for a life sciences company — was co-led by Johnson & Johnson Innovation and included additional strategic investors Bristol-Myers Squibb, Celgene, McKesson Ventures, Varian Medical Systems, Merck & Co. and, notably, Amazon and the Chinese Internet conglomerate Tencent Holdings. The size of GRAIL’s Series B is more typical of the technology sector and reflects the ongoing blurring of tech-biotech boundaries, the growing digitization of biotech more broadly, and the way life sciences “unicorns” may increasingly mimic their counterparts in tech (see sidebar to left).
Examining only seed and Series A venture rounds, strategic investors participated in 5 of the top 10 US financings by dollar amount (and 11 of the top 20). Venture arms of Pfizer and Eli Lilly participated in the January 2016 US$67 million Series A for immuno-oncology specialist NextCure. Celgene joined an investor syndicate funding a second immuno-oncology company, Oncorus, which raised US$57 million in July. Roche and Novartis invested in the January 2016 US$73 million Series A for protein degradation platform company C4 Therapeutics. Novartis helped stake the cell therapy play Adicet Bio with a US$51 million Series A in January 2016. Jazz Pharmaceuticals led a US$49 million first round of financing for fledgling specialty pharma Arrivo in May 2016. And Pfizer took a 22% stake in the gene therapy play Bamboo Therapeutics as part of that biotech’s February 2016 US$49.5 Series A. (Underscoring the strategic nature of these financings, only six months later, Pfizer acquired the rest of Bamboo in a deal worth US$150 million up front, in addition to US$495 million in potential milestone payments.)
If you dust off 1997’s edition of Beyond Borders, you’ll see that 20 years ago there were 317 publicly traded biotech companies in the US. Today there are — give or take a few — about 460. This growth in the number of publicly traded biotech companies comes despite significant biotech M&A activity over the same period and bucks a trend in the broader market. Over that same 20-year period, the number of public companies across the entire US economy has decreased by more than 37%, or more than 3,000 companies.
This discrepancy illustrates two sides of the same coin. Initial public offerings are essential for funding high-cost and often lengthy drug discovery and development — both in terms of clinical candidates themselves and the technology platforms that often underpin those molecules — and only the rare biotech has access to enough private capital to avoid the public markets for long. Biotech risk is one that begs to be syndicated, eventually, and often rather sooner than later.
This is in marked contrast to the technology sector, where privately funded companies are more likely to reach “unicorn” status (privately held companies with valuations greater than US$1 billion). Private companies can avoid dealing with the often-short-term outlook of public investors, and they can avoid the perceived competitive disadvantages associated with required public disclosures and other regulatory requirements. These are luxuries most biotechs can’t afford, even with a healthy biotech venture capital ecosystem that is increasingly infused with strategic capital from pharmaceutical company investors. While the liquid biopsy company GRAIL and the messenger RNA platform and therapeutics company Moderna are blazing a trail in terms of capital raised and private valuation, for now they remain among the exceptions that prove the rule.
But two elements may point to a near-term future marked by an increasing number of better capitalized private biotechs. First, IPO volume and valuations of newly public biotechs correlate with general investors’ interest in biotech, which has ebbed significantly since its peak in 2014. Second, an influx of strategic technology investors, coincident with the biopharma sector’s increasing use of big data strategies to detect and combat disease, could help fund a small herd of GRAIL-like biotech and diagnostics unicorns.
The “techification” of biotech may move beyond leveraging computing power and massive datasets to attack biology problems. It could reshape how the industry’s leading companies are funded as well.
Where are the biotech unicorns?
Beyond borders Biotechnology report 201754
Financing
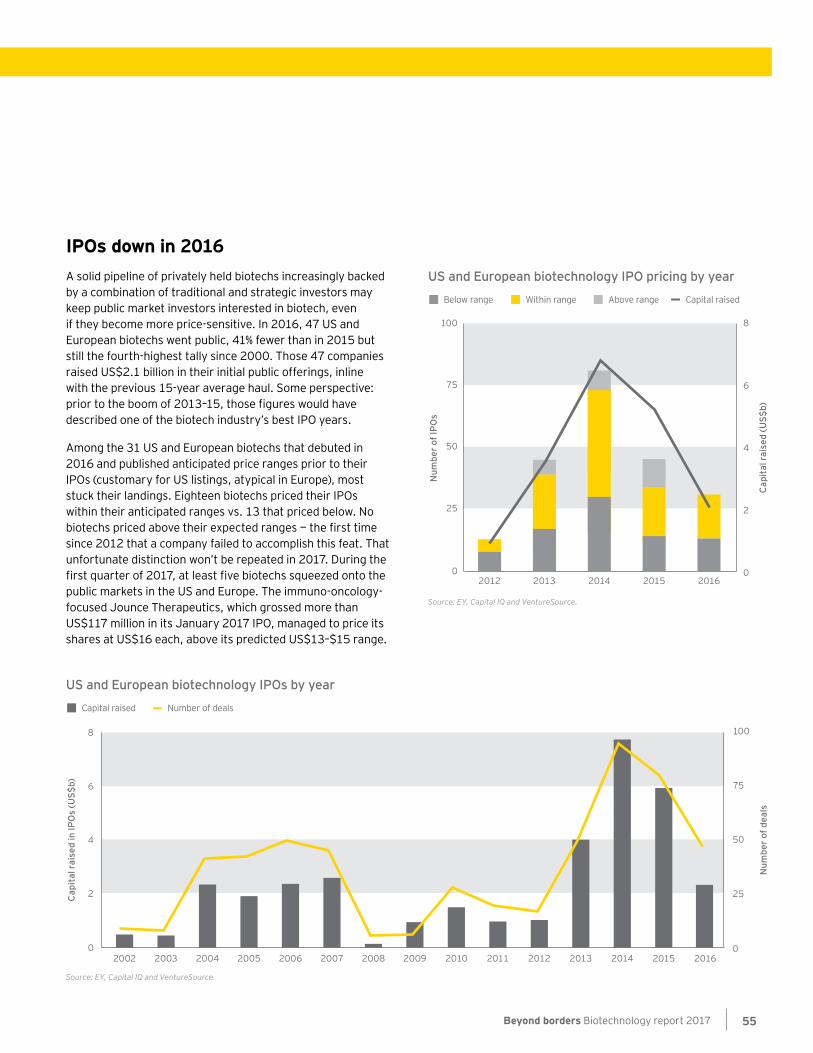
Source: EY, Capital IQ and VentureSource.
Cap
ital
rai
sed
in IP
Os
(US$
b)
Num
ber o
f dea
ls
100
75
50
25
0
8
0
2
4
6
Number of dealsCapital raised
2002 2003 2004 2005 2006 2007 2008 2009 2010 2011 2012 2013 2014 2015 2016
US and European biotechnology IPOs by year
US and European biotechnology IPO pricing by year
Capital raisedBelow range Within range Above range
Source: EY, Capital IQ and VentureSource.
50
100
75
0
25
2012 2014 2016
Num
ber o
f IP
Os
Cap
ital
rai
sed
(US$
b)
8
6
2
4
20130
2015
IPOs down in 2016A solid pipeline of privately held biotechs increasingly backed by a combination of traditional and strategic investors may keep public market investors interested in biotech, even if they become more price-sensitive. In 2016, 47 US and European biotechs went public, 41% fewer than in 2015 but still the fourth-highest tally since 2000. Those 47 companies raised US$2.1 billion in their initial public offerings, inline with the previous 15-year average haul. Some perspective: prior to the boom of 2013–15, those figures would have described one of the biotech industry’s best IPO years.
Among the 31 US and European biotechs that debuted in 2016 and published anticipated price ranges prior to their IPOs (customary for US listings, atypical in Europe), most stuck their landings. Eighteen biotechs priced their IPOs within their anticipated ranges vs. 13 that priced below. No biotechs priced above their expected ranges — the first time since 2012 that a company failed to accomplish this feat. That unfortunate distinction won’t be repeated in 2017. During the first quarter of 2017, at least five biotechs squeezed onto the public markets in the US and Europe. The immuno-oncology-focused Jounce Therapeutics, which grossed more than US$117 million in its January 2017 IPO, managed to price its shares at US$16 each, above its predicted US$13–$15 range.
Beyond borders Biotechnology report 2017 55
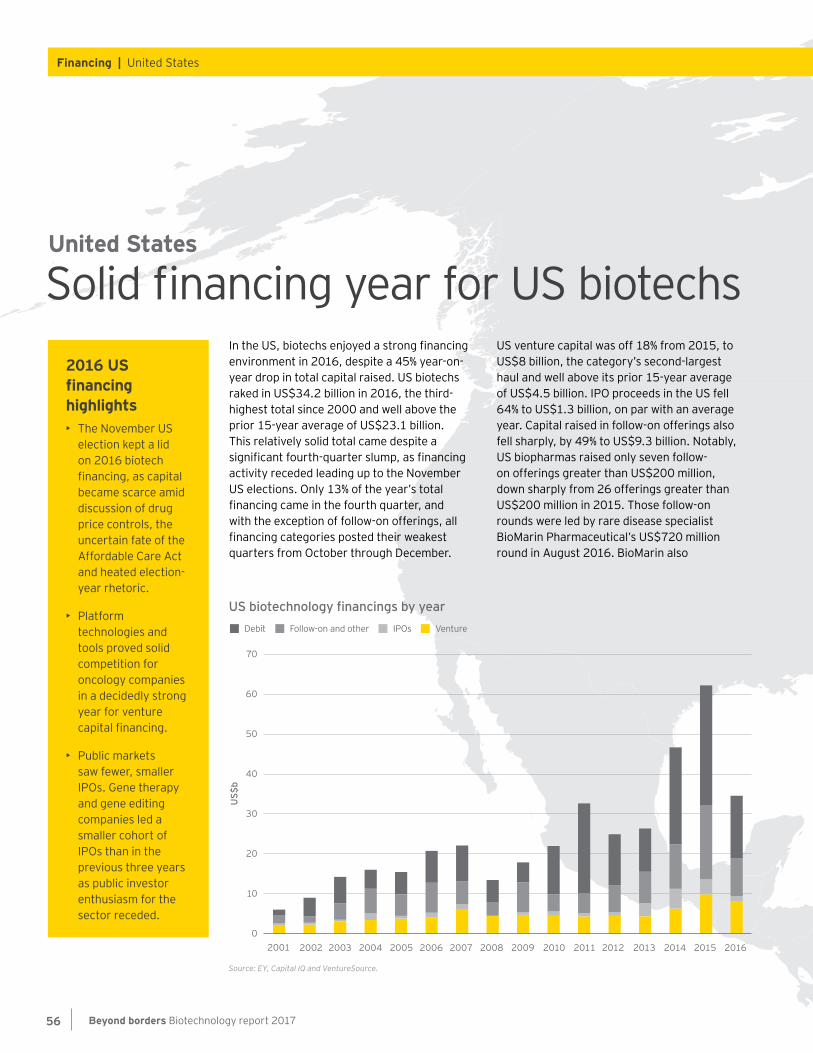
US biotechnology financings by year
Source: EY, Capital IQ and VentureSource.
US$
b
50
60
70
40
10
0
20
30
Follow-on and other IPOs VentureDebit
2001 20032002 2004 2005 2006 2007 2008 2009 2010 2011 2012 2013 2014 2015 2016
In the US, biotechs enjoyed a strong financing environment in 2016, despite a 45% year-on-year drop in total capital raised. US biotechs raked in US$34.2 billion in 2016, the third-highest total since 2000 and well above the prior 15-year average of US$23.1 billion. This relatively solid total came despite a significant fourth-quarter slump, as financing activity receded leading up to the November US elections. Only 13% of the year’s total financing came in the fourth quarter, and with the exception of follow-on offerings, all financing categories posted their weakest quarters from October through December.
US venture capital was off 18% from 2015, to US$8 billion, the category’s second-largest haul and well above its prior 15-year average of US$4.5 billion. IPO proceeds in the US fell 64% to US$1.3 billion, on par with an average year. Capital raised in follow-on offerings also fell sharply, by 49% to US$9.3 billion. Notably, US biopharmas raised only seven follow-on offerings greater than US$200 million, down sharply from 26 offerings greater than US$200 million in 2015. Those follow-on rounds were led by rare disease specialist BioMarin Pharmaceutical’s US$720 million round in August 2016. BioMarin also
Solid financing year for US biotechsUnited States
2016 US financing highlights• The November US
election kept a lid on 2016 biotech financing, as capital became scarce amid discussion of drug price controls, the uncertain fate of the Affordable Care Act and heated election-year rhetoric.
• Platform technologies and tools proved solid competition for oncology companies in a decidedly strong year for venture capital financing.
• Public markets saw fewer, smaller IPOs. Gene therapy and gene editing companies led a smaller cohort of IPOs than in the previous three years as public investor enthusiasm for the sector receded.
Beyond borders Biotechnology report 201756
Financing | United States
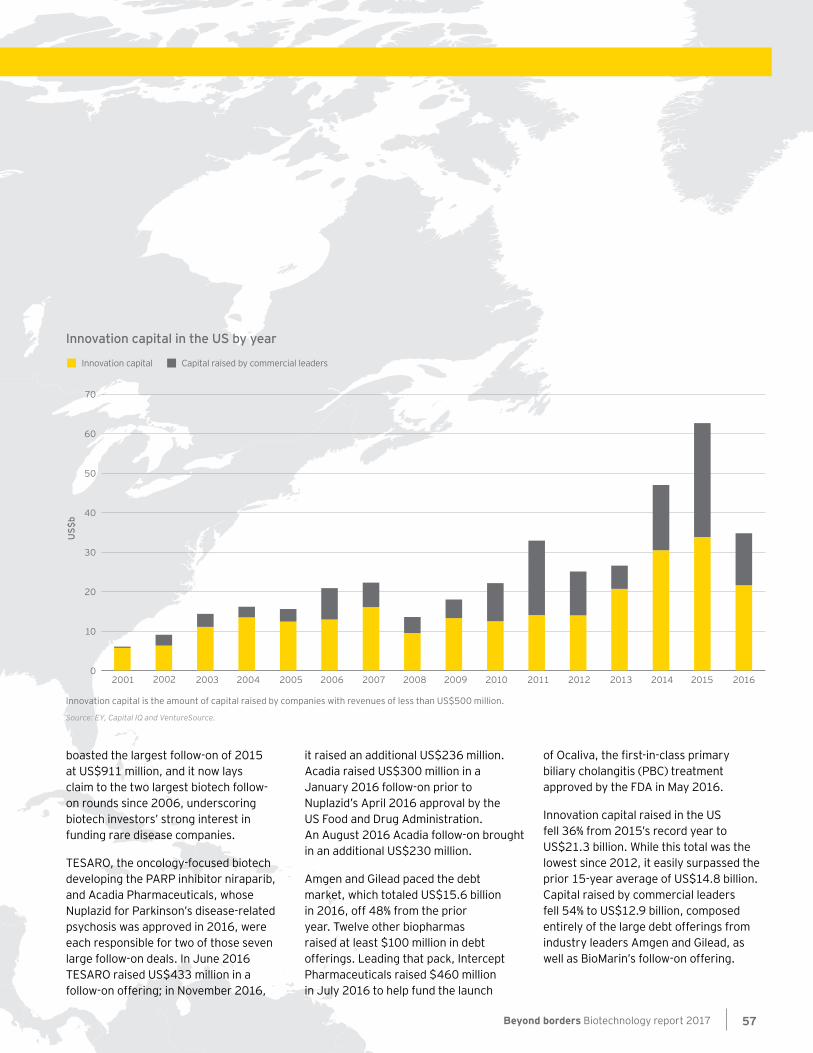
Innovation capital in the US by year
Innovation capital is the amount of capital raised by companies with revenues of less than US$500 million.
Source: EY, Capital IQ and VentureSource.
US$
b
50
60
70
40
10
0
20
30
Capital raised by commercial leadersInnovation capital
2001 2002 2003 2004 2005 2006 2007 2008 2009 2010 2011 2012 2013 2014 2015 2016
boasted the largest follow-on of 2015 at US$911 million, and it now lays claim to the two largest biotech follow-on rounds since 2006, underscoring biotech investors’ strong interest in funding rare disease companies.
TESARO, the oncology-focused biotech developing the PARP inhibitor niraparib, and Acadia Pharmaceuticals, whose Nuplazid for Parkinson’s disease-related psychosis was approved in 2016, were each responsible for two of those seven large follow-on deals. In June 2016 TESARO raised US$433 million in a follow-on offering; in November 2016,
it raised an additional US$236 million. Acadia raised US$300 million in a January 2016 follow-on prior to Nuplazid’s April 2016 approval by the US Food and Drug Administration. An August 2016 Acadia follow-on brought in an additional US$230 million.
Amgen and Gilead paced the debt market, which totaled US$15.6 billion in 2016, off 48% from the prior year. Twelve other biopharmas raised at least $100 million in debt offerings. Leading that pack, Intercept Pharmaceuticals raised $460 million in July 2016 to help fund the launch
of Ocaliva, the first-in-class primary biliary cholangitis (PBC) treatment approved by the FDA in May 2016.
Innovation capital raised in the US fell 36% from 2015’s record year to US$21.3 billion. While this total was the lowest since 2012, it easily surpassed the prior 15-year average of US$14.8 billion. Capital raised by commercial leaders fell 54% to US$12.9 billion, composed entirely of the large debt offerings from industry leaders Amgen and Gilead, as well as BioMarin’s follow-on offering.
Beyond borders Biotechnology report 2017 57
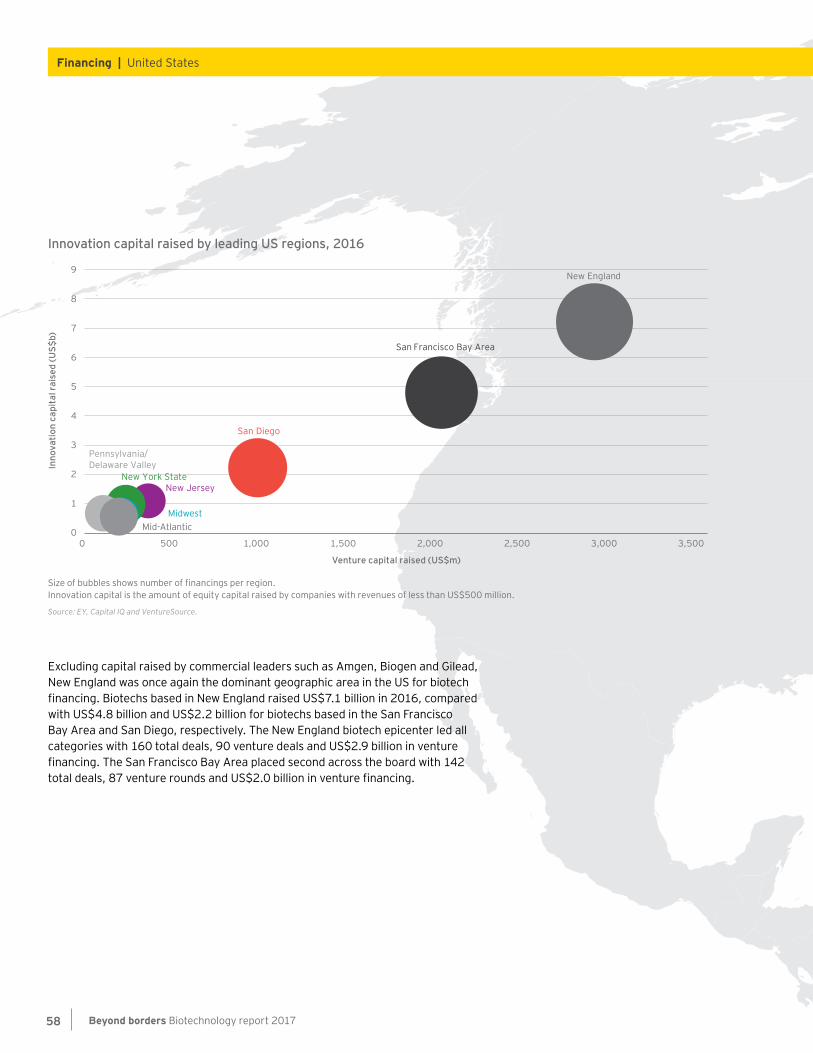
Innovation capital raised by leading US regions, 2016
Size of bubbles shows number of financings per region. Innovation capital is the amount of equity capital raised by companies with revenues of less than US$500 million.
Source: EY, Capital IQ and VentureSource.
Inno
vatio
n ca
pita
l rai
sed
(US$
b)
8
9
2
1
0
6
5
4
3
7
0 500 1,000 1,500 2,000 2,500 3,000 3,500
Venture capital raised (US$m)
New England
San Francisco Bay Area
San Diego
New JerseyNew York State
Pennsylvania/Delaware Valley
MidwestMid-Atlantic
Excluding capital raised by commercial leaders such as Amgen, Biogen and Gilead, New England was once again the dominant geographic area in the US for biotech financing. Biotechs based in New England raised US$7.1 billion in 2016, compared with US$4.8 billion and US$2.2 billion for biotechs based in the San Francisco Bay Area and San Diego, respectively. The New England biotech epicenter led all categories with 160 total deals, 90 venture deals and US$2.9 billion in venture financing. The San Francisco Bay Area placed second across the board with 142 total deals, 87 venture rounds and US$2.0 billion in venture financing.
Beyond borders Biotechnology report 201758
Financing | United States
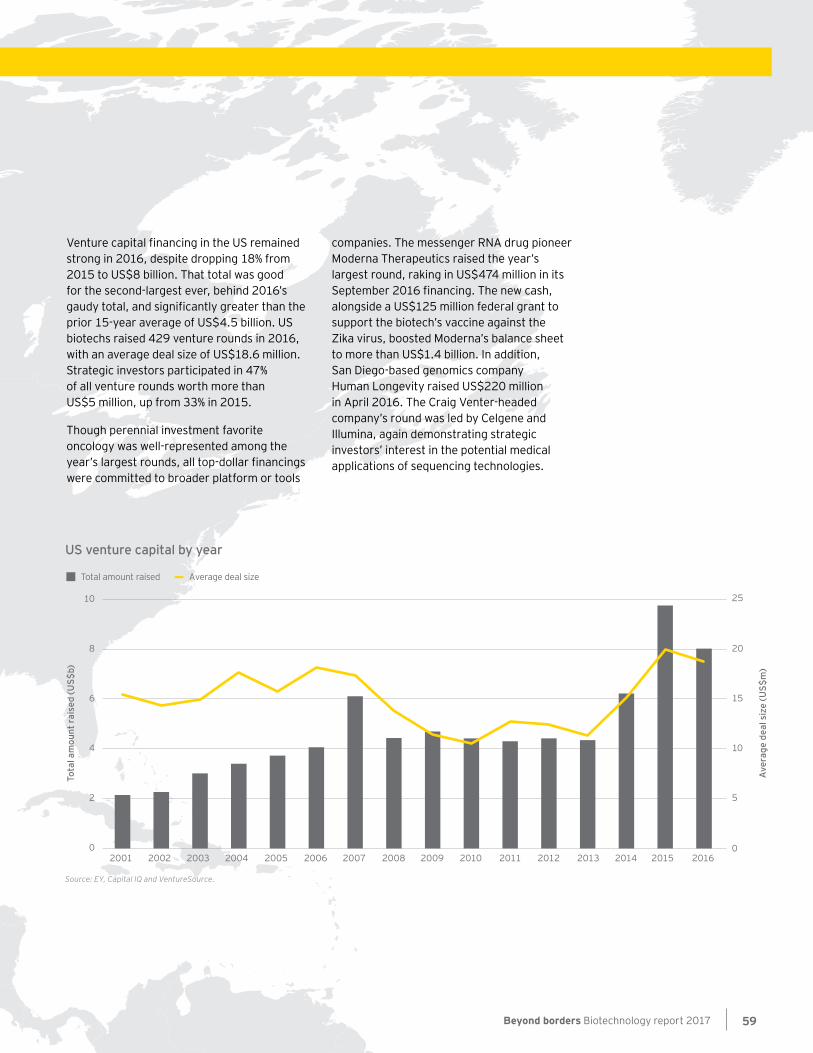
US venture capital by year
Source: EY, Capital IQ and VentureSource.
Tota
l am
ount
rai
sed
(US$
b)
Ave
rage
dea
l siz
e (U
S$m
)
25
20
15
10
5
00
4
2
6
8
10
Average deal sizeTotal amount raised
2001 2002 2003 2004 2005 2006 2007 2008 2009 2010 2011 2012 2013 2014 2015 2016
Venture capital financing in the US remained strong in 2016, despite dropping 18% from 2015 to US$8 billion. That total was good for the second-largest ever, behind 2016’s gaudy total, and significantly greater than the prior 15-year average of US$4.5 billion. US biotechs raised 429 venture rounds in 2016, with an average deal size of US$18.6 million. Strategic investors participated in 47% of all venture rounds worth more than US$5 million, up from 33% in 2015.
Though perennial investment favorite oncology was well-represented among the year’s largest rounds, all top-dollar financings were committed to broader platform or tools
companies. The messenger RNA drug pioneer Moderna Therapeutics raised the year’s largest round, raking in US$474 million in its September 2016 financing. The new cash, alongside a US$125 million federal grant to support the biotech’s vaccine against the Zika virus, boosted Moderna’s balance sheet to more than US$1.4 billion. In addition, San Diego-based genomics company Human Longevity raised US$220 million in April 2016. The Craig Venter-headed company’s round was led by Celgene and Illumina, again demonstrating strategic investors’ interest in the potential medical applications of sequencing technologies.
Beyond borders Biotechnology report 2017 59
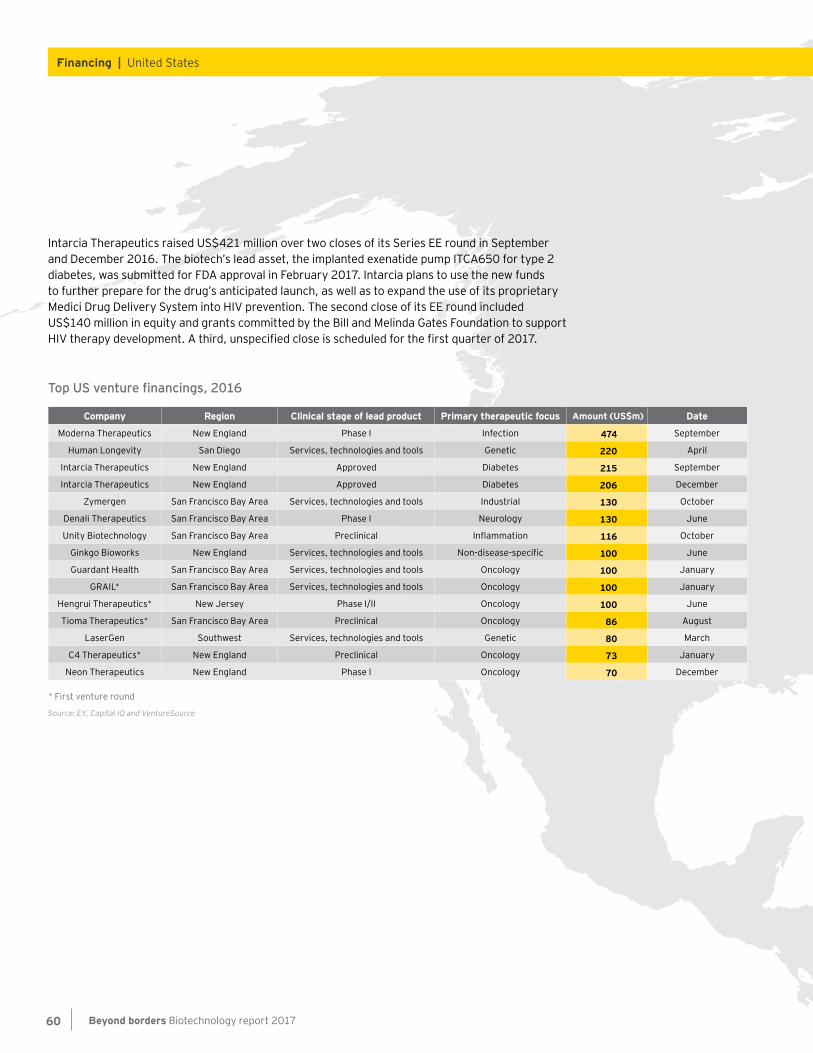
Intarcia Therapeutics raised US$421 million over two closes of its Series EE round in September and December 2016. The biotech’s lead asset, the implanted exenatide pump ITCA650 for type 2 diabetes, was submitted for FDA approval in February 2017. Intarcia plans to use the new funds to further prepare for the drug’s anticipated launch, as well as to expand the use of its proprietary Medici Drug Delivery System into HIV prevention. The second close of its EE round included US$140 million in equity and grants committed by the Bill and Melinda Gates Foundation to support HIV therapy development. A third, unspecified close is scheduled for the first quarter of 2017.
Top US venture financings, 2016
Company Region Clinical stage of lead product Primary therapeutic focus Amount (US$m) Date
Moderna Therapeutics New England Phase I Infection 474 September
Human Longevity San Diego Services, technologies and tools Genetic 220 April
Intarcia Therapeutics New England Approved Diabetes 215 September
Intarcia Therapeutics New England Approved Diabetes 206 December
Zymergen San Francisco Bay Area Services, technologies and tools Industrial 130 October
Denali Therapeutics San Francisco Bay Area Phase I Neurology 130 June
Unity Biotechnology San Francisco Bay Area Preclinical Inflammation 116 October
Ginkgo Bioworks New England Services, technologies and tools Non-disease-specific 100 June
Guardant Health San Francisco Bay Area Services, technologies and tools Oncology 100 January
GRAIL* San Francisco Bay Area Services, technologies and tools Oncology 100 January
Hengrui Therapeutics* New Jersey Phase I/II Oncology 100 June
Tioma Therapeutics* San Francisco Bay Area Preclinical Oncology 86 August
LaserGen Southwest Services, technologies and tools Genetic 80 March
C4 Therapeutics* New England Preclinical Oncology 73 January
Neon Therapeutics New England Phase I Oncology 70 December
* First venture round
Source: EY, Capital IQ and VentureSource
Beyond borders Biotechnology report 201760
Financing | United States
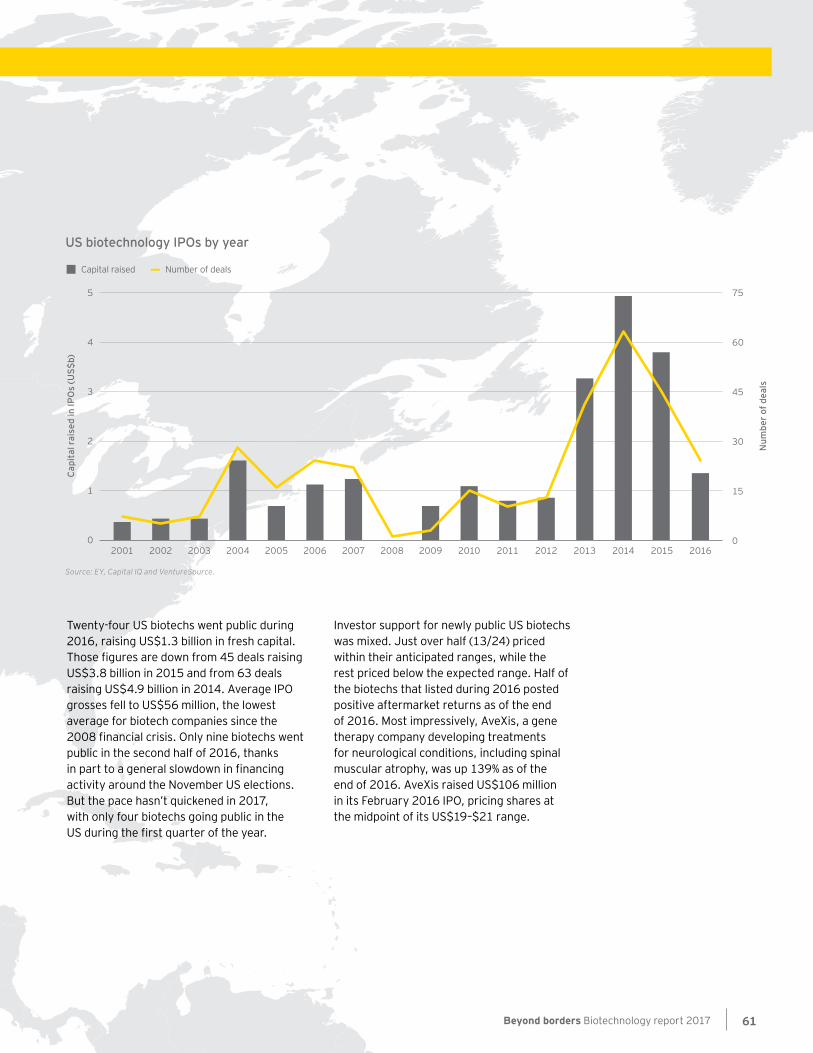
Source: EY, Capital IQ and VentureSource.
Cap
ital
rai
sed
in IP
Os
(US$
b)
Num
ber o
f dea
ls
75
60
45
15
30
0
5
0
1
2
3
4
Number of dealsCapital raised
2001 2002 2003 2004 2005 2006 2007 2008 2009 2010 2011 2012 2013 2014 2015 2016
US biotechnology IPOs by year
Twenty-four US biotechs went public during 2016, raising US$1.3 billion in fresh capital. Those figures are down from 45 deals raising US$3.8 billion in 2015 and from 63 deals raising US$4.9 billion in 2014. Average IPO grosses fell to US$56 million, the lowest average for biotech companies since the 2008 financial crisis. Only nine biotechs went public in the second half of 2016, thanks in part to a general slowdown in financing activity around the November US elections. But the pace hasn’t quickened in 2017, with only four biotechs going public in the US during the first quarter of the year.
Investor support for newly public US biotechs was mixed. Just over half (13/24) priced within their anticipated ranges, while the rest priced below the expected range. Half of the biotechs that listed during 2016 posted positive aftermarket returns as of the end of 2016. Most impressively, AveXis, a gene therapy company developing treatments for neurological conditions, including spinal muscular atrophy, was up 139% as of the end of 2016. AveXis raised US$106 million in its February 2016 IPO, pricing shares at the midpoint of its US$19–$21 range.
Beyond borders Biotechnology report 2017 61
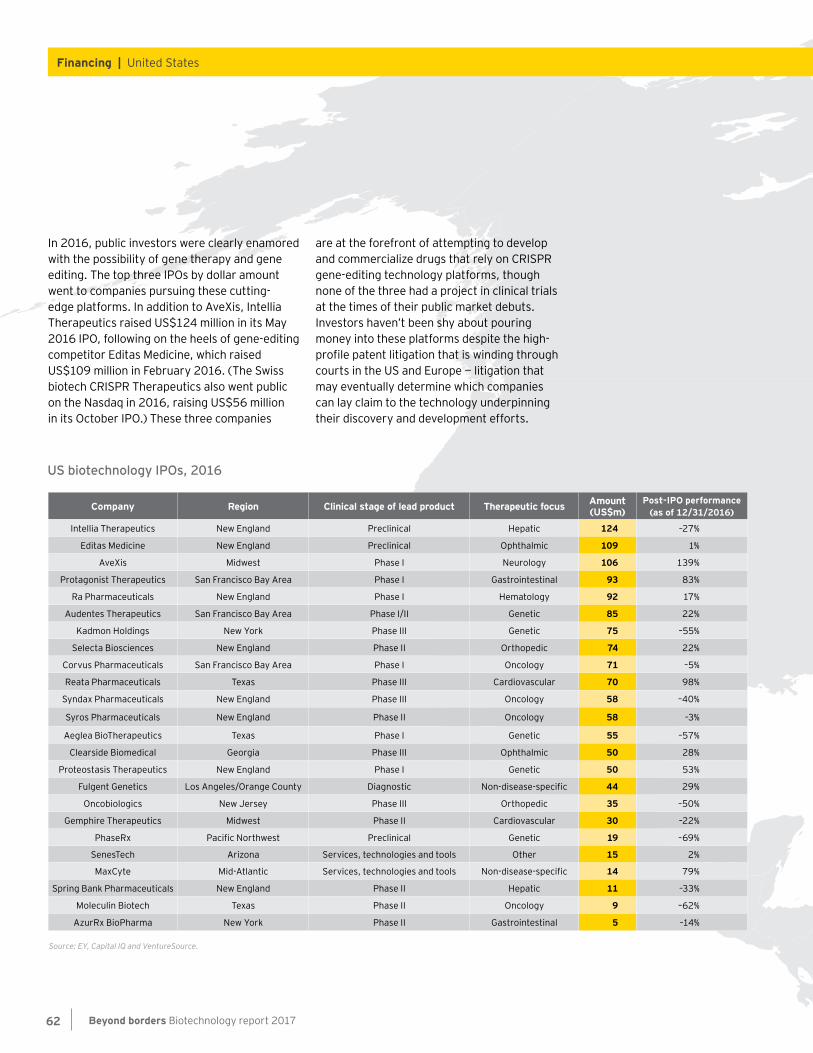
US biotechnology IPOs, 2016
Company Region Clinical stage of lead product Therapeutic focus Amount (US$m)
Post-IPO performance (as of 12/31/2016)
Intellia Therapeutics New England Preclinical Hepatic 124 –27%
Editas Medicine New England Preclinical Ophthalmic 109 1%
AveXis Midwest Phase I Neurology 106 139%
Protagonist Therapeutics San Francisco Bay Area Phase I Gastrointestinal 93 83%
Ra Pharmaceuticals New England Phase I Hematology 92 17%
Audentes Therapeutics San Francisco Bay Area Phase I/II Genetic 85 22%
Kadmon Holdings New York Phase III Genetic 75 –55%
Selecta Biosciences New England Phase II Orthopedic 74 22%
Corvus Pharmaceuticals San Francisco Bay Area Phase I Oncology 71 –5%
Reata Pharmaceuticals Texas Phase III Cardiovascular 70 98%
Syndax Pharmaceuticals New England Phase III Oncology 58 –40%
Syros Pharmaceuticals New England Phase II Oncology 58 –3%
Aeglea BioTherapeutics Texas Phase I Genetic 55 –57%
Clearside Biomedical Georgia Phase III Ophthalmic 50 28%
Proteostasis Therapeutics New England Phase I Genetic 50 53%
Fulgent Genetics Los Angeles/Orange County Diagnostic Non-disease-specific 44 29%
Oncobiologics New Jersey Phase III Orthopedic 35 –50%
Gemphire Therapeutics Midwest Phase II Cardiovascular 30 –22%
PhaseRx Pacific Northwest Preclinical Genetic 19 –69%
SenesTech Arizona Services, technologies and tools Other 15 2%
MaxCyte Mid-Atlantic Services, technologies and tools Non-disease-specific 14 79%
Spring Bank Pharmaceuticals New England Phase II Hepatic 11 –33%
Moleculin Biotech Texas Phase II Oncology 9 –62%
AzurRx BioPharma New York Phase II Gastrointestinal 5 –14%
Source: EY, Capital IQ and VentureSource.
In 2016, public investors were clearly enamored with the possibility of gene therapy and gene editing. The top three IPOs by dollar amount went to companies pursuing these cutting-edge platforms. In addition to AveXis, Intellia Therapeutics raised US$124 million in its May 2016 IPO, following on the heels of gene-editing competitor Editas Medicine, which raised US$109 million in February 2016. (The Swiss biotech CRISPR Therapeutics also went public on the Nasdaq in 2016, raising US$56 million in its October IPO.) These three companies
are at the forefront of attempting to develop and commercialize drugs that rely on CRISPR gene-editing technology platforms, though none of the three had a project in clinical trials at the times of their public market debuts. Investors haven’t been shy about pouring money into these platforms despite the high-profile patent litigation that is winding through courts in the US and Europe — litigation that may eventually determine which companies can lay claim to the technology underpinning their discovery and development efforts.
Beyond borders Biotechnology report 201762
Financing | United States
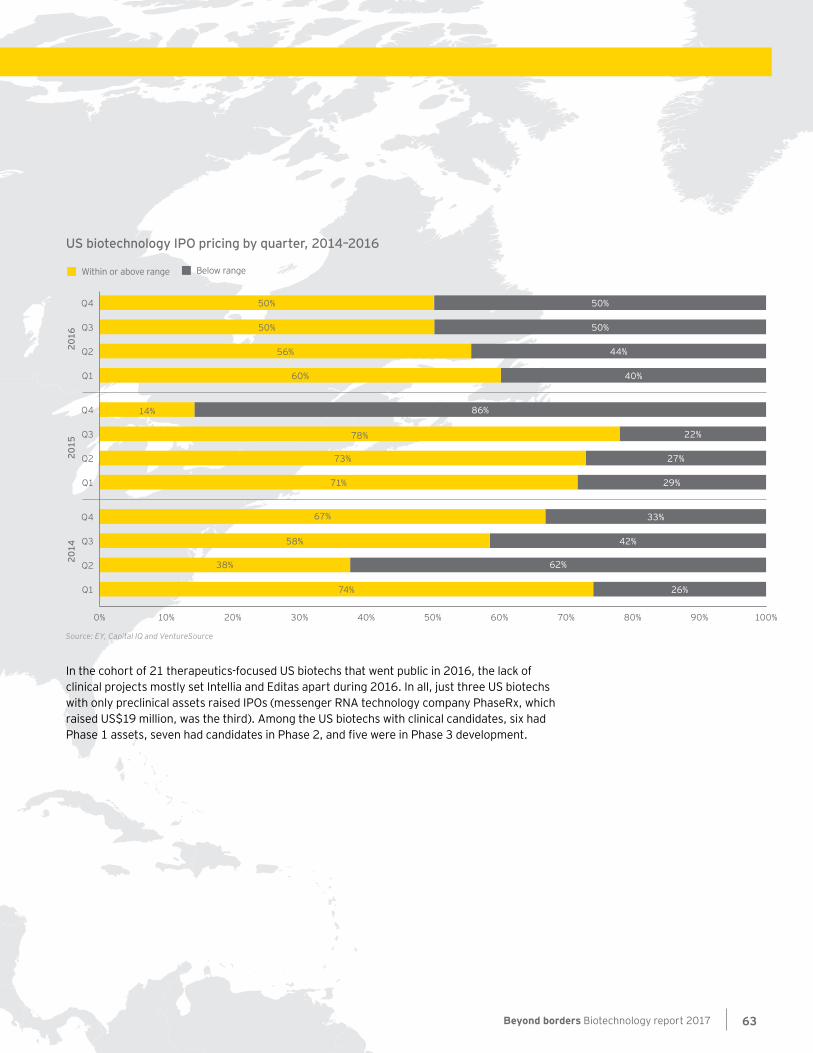
US biotechnology IPO pricing by quarter, 2014–2016
Within or above range Below range
Source: EY, Capital IQ and VentureSource
2016
2015
2014
Q1
Q2
Q3
Q4
Q4
Q3
Q2
Q1
0% 10%
Q4
Q2
Q1
Q3
20% 30% 40% 50% 60% 70% 80% 90% 100%
74% 26%
38% 62%
58% 42%
67% 33%
71% 29%
73% 27%
78% 22%
14% 86%
60% 40%
56% 44%
50% 50%
50% 50%
In the cohort of 21 therapeutics-focused US biotechs that went public in 2016, the lack of clinical projects mostly set Intellia and Editas apart during 2016. In all, just three US biotechs with only preclinical assets raised IPOs (messenger RNA technology company PhaseRx, which raised US$19 million, was the third). Among the US biotechs with clinical candidates, six had Phase 1 assets, seven had candidates in Phase 2, and five were in Phase 3 development.
Beyond borders Biotechnology report 2017 63
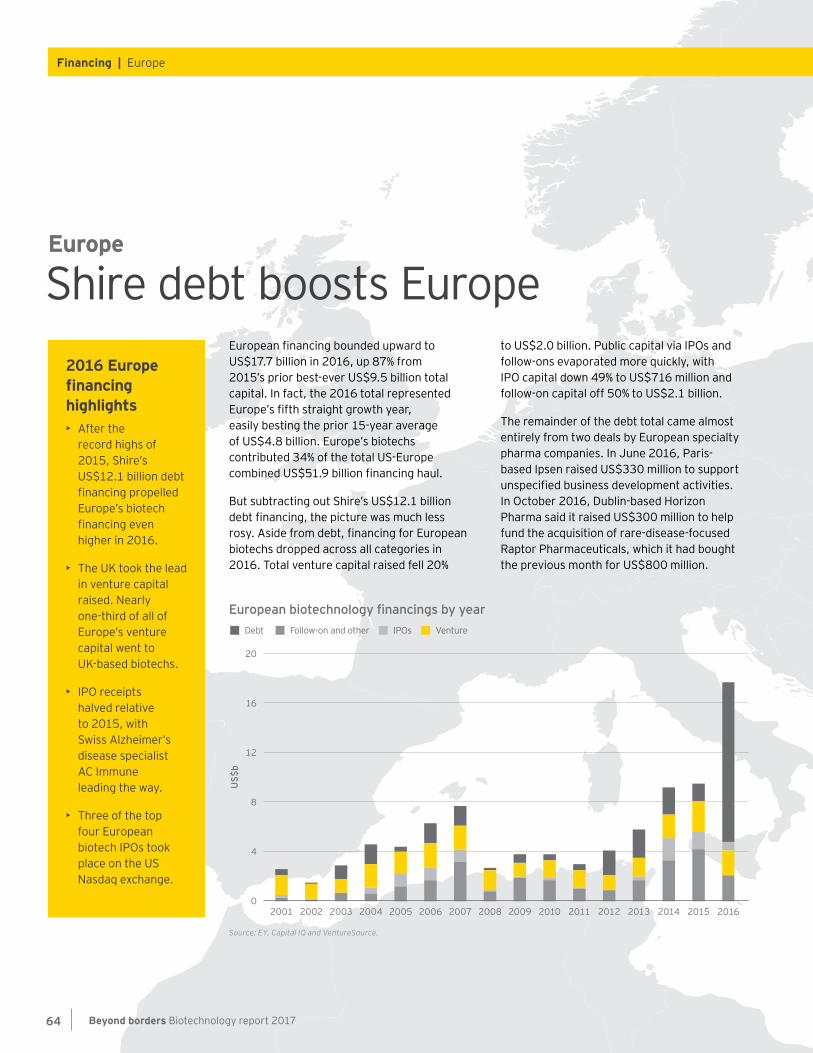
European financing bounded upward to US$17.7 billion in 2016, up 87% from 2015’s prior best-ever US$9.5 billion total capital. In fact, the 2016 total represented Europe’s fifth straight growth year, easily besting the prior 15-year average of US$4.8 billion. Europe’s biotechs contributed 34% of the total US-Europe combined US$51.9 billion financing haul.
But subtracting out Shire’s US$12.1 billion debt financing, the picture was much less rosy. Aside from debt, financing for European biotechs dropped across all categories in 2016. Total venture capital raised fell 20%
to US$2.0 billion. Public capital via IPOs and follow-ons evaporated more quickly, with IPO capital down 49% to US$716 million and follow-on capital off 50% to US$2.1 billion.
The remainder of the debt total came almost entirely from two deals by European specialty pharma companies. In June 2016, Paris-based Ipsen raised US$330 million to support unspecified business development activities. In October 2016, Dublin-based Horizon Pharma said it raised US$300 million to help fund the acquisition of rare-disease-focused Raptor Pharmaceuticals, which it had bought the previous month for US$800 million.
Shire debt boosts EuropeEurope
2016 Europe financing highlights• After the
record highs of 2015, Shire’s US$12.1 billion debt financing propelled Europe’s biotech financing even higher in 2016.
• The UK took the lead in venture capital raised. Nearly one-third of all of Europe’s venture capital went to UK-based biotechs.
• IPO receipts halved relative to 2015, with Swiss Alzheimer’s disease specialist AC Immune leading the way.
• Three of the top four European biotech IPOs took place on the US Nasdaq exchange.
European biotechnology financings by year
Source: EY, Capital IQ and VentureSource.
US$
b
16
20
12
0
4
8
Follow-on and other IPOs VentureDebt
2001 20032002 2004 2005 2006 2007 2008 2009 2010 2011 2012 2013 2014 2015 2016
Beyond borders Biotechnology report 201764
Financing | Europe
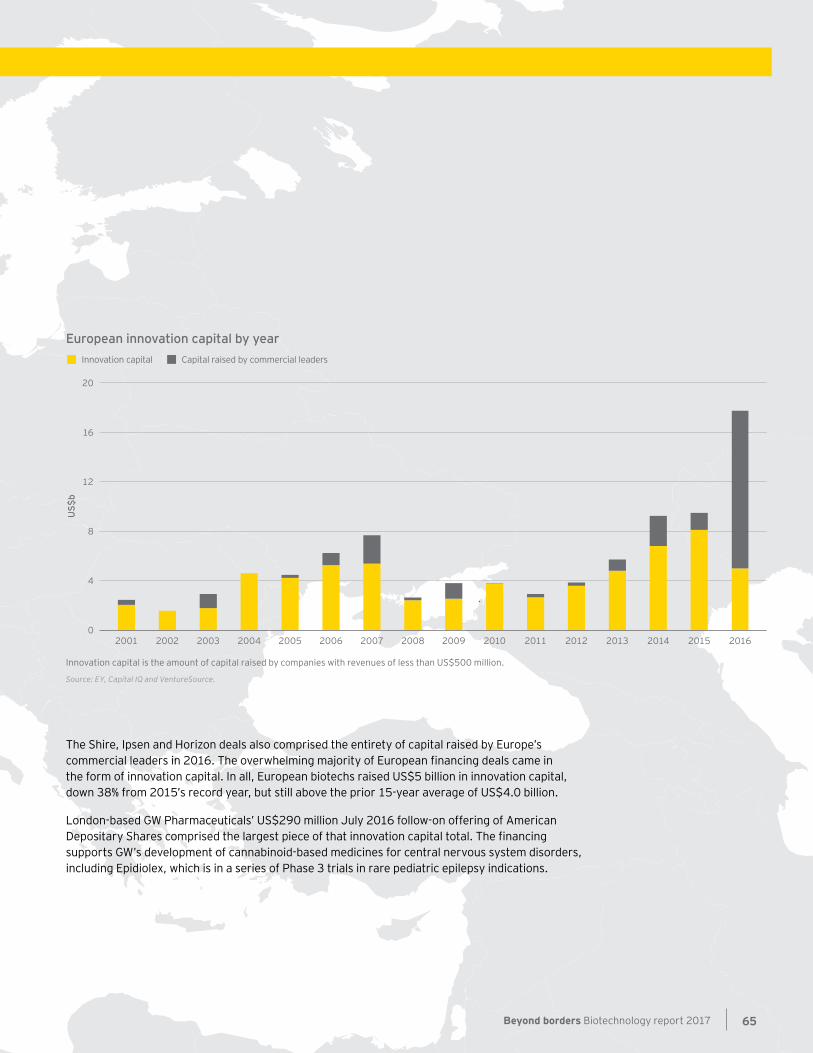
European innovation capital by year
Innovation capital is the amount of capital raised by companies with revenues of less than US$500 million.
Source: EY, Capital IQ and VentureSource.
US$
b
12
16
20
8
0
4
Capital raised by commercial leadersInnovation capital
2001 2002 2003 2004 2005 2006 2007 2008 2009 2010 2011 2012 2013 2014 2015 2016
The Shire, Ipsen and Horizon deals also comprised the entirety of capital raised by Europe’s commercial leaders in 2016. The overwhelming majority of European financing deals came in the form of innovation capital. In all, European biotechs raised US$5 billion in innovation capital, down 38% from 2015’s record year, but still above the prior 15-year average of US$4.0 billion.
London-based GW Pharmaceuticals’ US$290 million July 2016 follow-on offering of American Depositary Shares comprised the largest piece of that innovation capital total. The financing supports GW’s development of cannabinoid-based medicines for central nervous system disorders, including Epidiolex, which is in a series of Phase 3 trials in rare pediatric epilepsy indications.
Beyond borders Biotechnology report 2017 65
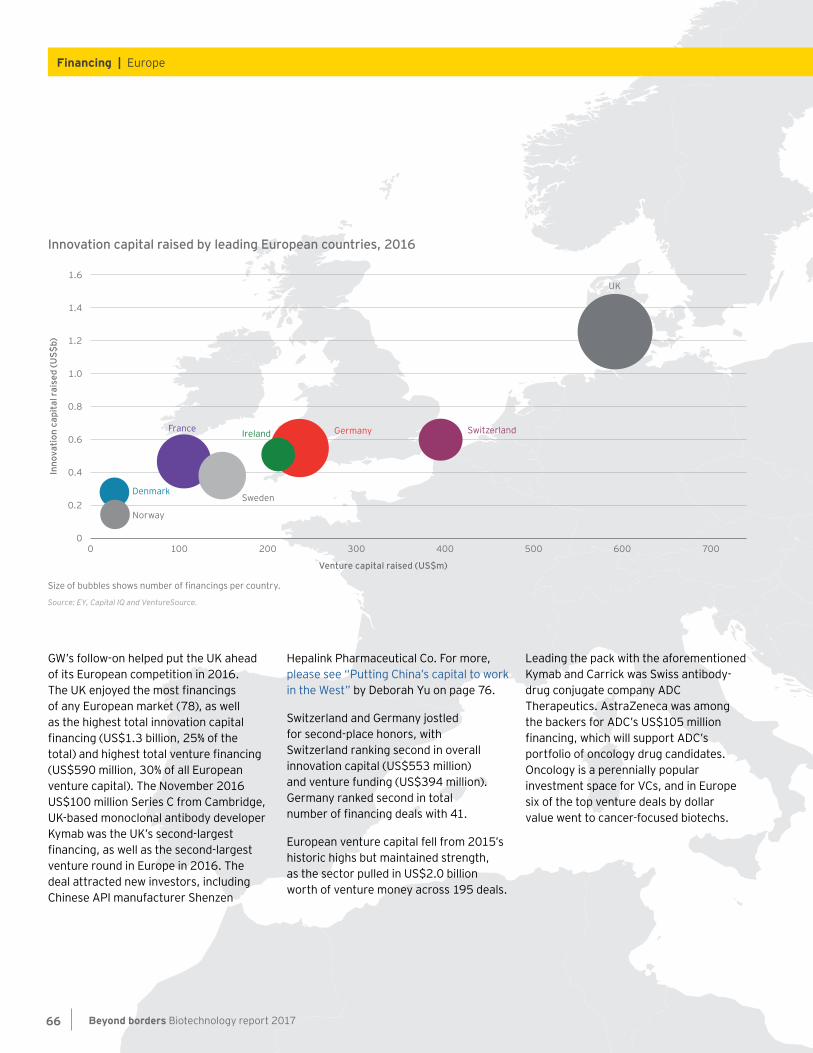
Innovation capital raised by leading European countries, 2016
Size of bubbles shows number of financings per country.
Source: EY, Capital IQ and VentureSource.
Inno
vatio
n ca
pita
l rai
sed
(US$
b) 1.2
1.4
1.6
0.2Norway
DenmarkSweden
IrelandFrance Germany Switzerland
UK
0
0.8
0.6
0.4
1.0
0 100 200 300 400 500 600 700
Venture capital raised (US$m)
GW’s follow-on helped put the UK ahead of its European competition in 2016. The UK enjoyed the most financings of any European market (78), as well as the highest total innovation capital financing (US$1.3 billion, 25% of the total) and highest total venture financing (US$590 million, 30% of all European venture capital). The November 2016 US$100 million Series C from Cambridge, UK-based monoclonal antibody developer Kymab was the UK’s second-largest financing, as well as the second-largest venture round in Europe in 2016. The deal attracted new investors, including Chinese API manufacturer Shenzen
Hepalink Pharmaceutical Co. For more, please see “Putting China’s capital to work in the West” by Deborah Yu on page 76.
Switzerland and Germany jostled for second-place honors, with Switzerland ranking second in overall innovation capital (US$553 million) and venture funding (US$394 million). Germany ranked second in total number of financing deals with 41.
European venture capital fell from 2015’s historic highs but maintained strength, as the sector pulled in US$2.0 billion worth of venture money across 195 deals.
Leading the pack with the aforementioned Kymab and Carrick was Swiss antibody-drug conjugate company ADC Therapeutics. AstraZeneca was among the backers for ADC’s US$105 million financing, which will support ADC’s portfolio of oncology drug candidates. Oncology is a perennially popular investment space for VCs, and in Europe six of the top venture deals by dollar value went to cancer-focused biotechs.
Beyond borders Biotechnology report 201766
Financing | Europe
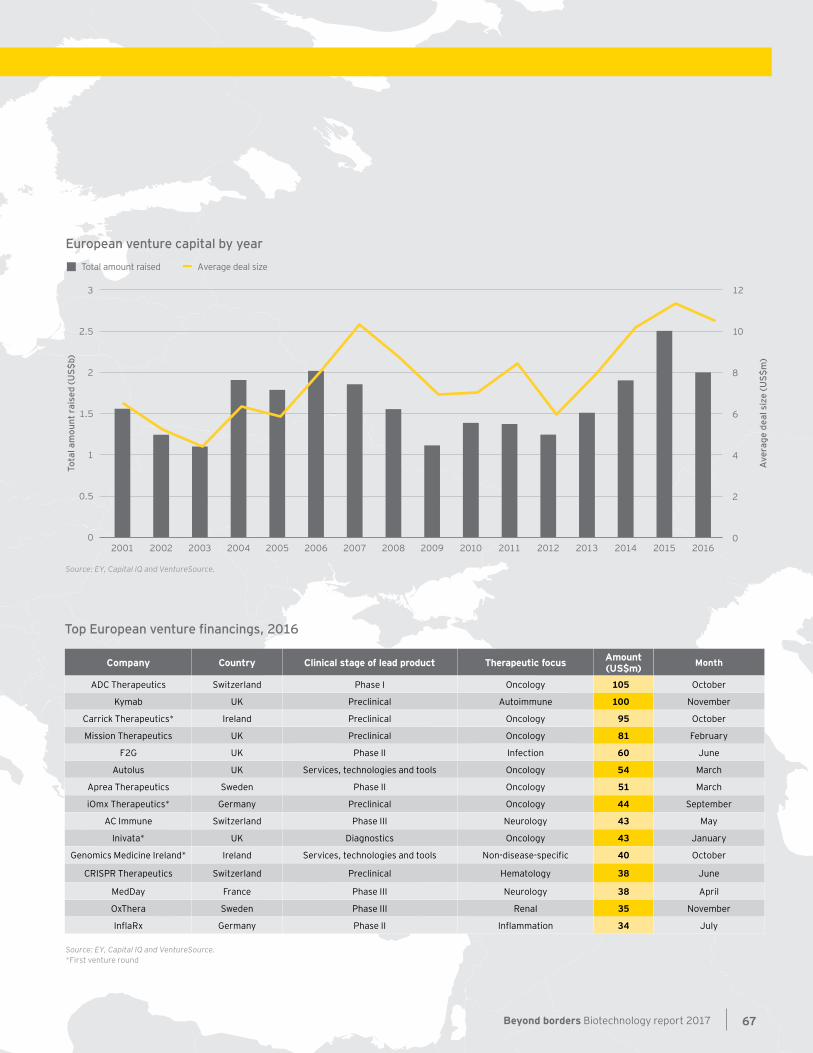
European venture capital by year
Source: EY, Capital IQ and VentureSource.
Tota
l am
ount
rai
sed
(US$
b)
Ave
rage
dea
l siz
e (U
S$m
)
12
10
8
6
4
0
2
2.5
3
0.5
0
1.5
2
1
Average deal sizeTotal amount raised
2001 2002 2003 2004 2005 2006 2007 2008 2009 2010 2011 2012 2013 2014 2015 2016
Top European venture financings, 2016
Company Country Clinical stage of lead product Therapeutic focus Amount (US$m) Month
ADC Therapeutics Switzerland Phase I Oncology 105 October
Kymab UK Preclinical Autoimmune 100 November
Carrick Therapeutics* Ireland Preclinical Oncology 95 October
Mission Therapeutics UK Preclinical Oncology 81 February
F2G UK Phase II Infection 60 June
Autolus UK Services, technologies and tools Oncology 54 March
Aprea Therapeutics Sweden Phase II Oncology 51 March
iOmx Therapeutics* Germany Preclinical Oncology 44 September
AC Immune Switzerland Phase III Neurology 43 May
Inivata* UK Diagnostics Oncology 43 January
Genomics Medicine Ireland* Ireland Services, technologies and tools Non-disease-specific 40 October
CRISPR Therapeutics Switzerland Preclinical Hematology 38 June
MedDay France Phase III Neurology 38 April
OxThera Sweden Phase III Renal 35 November
InflaRx Germany Phase II Inflammation 34 July
Source: EY, Capital IQ and VentureSource.*First venture round
Beyond borders Biotechnology report 2017 67
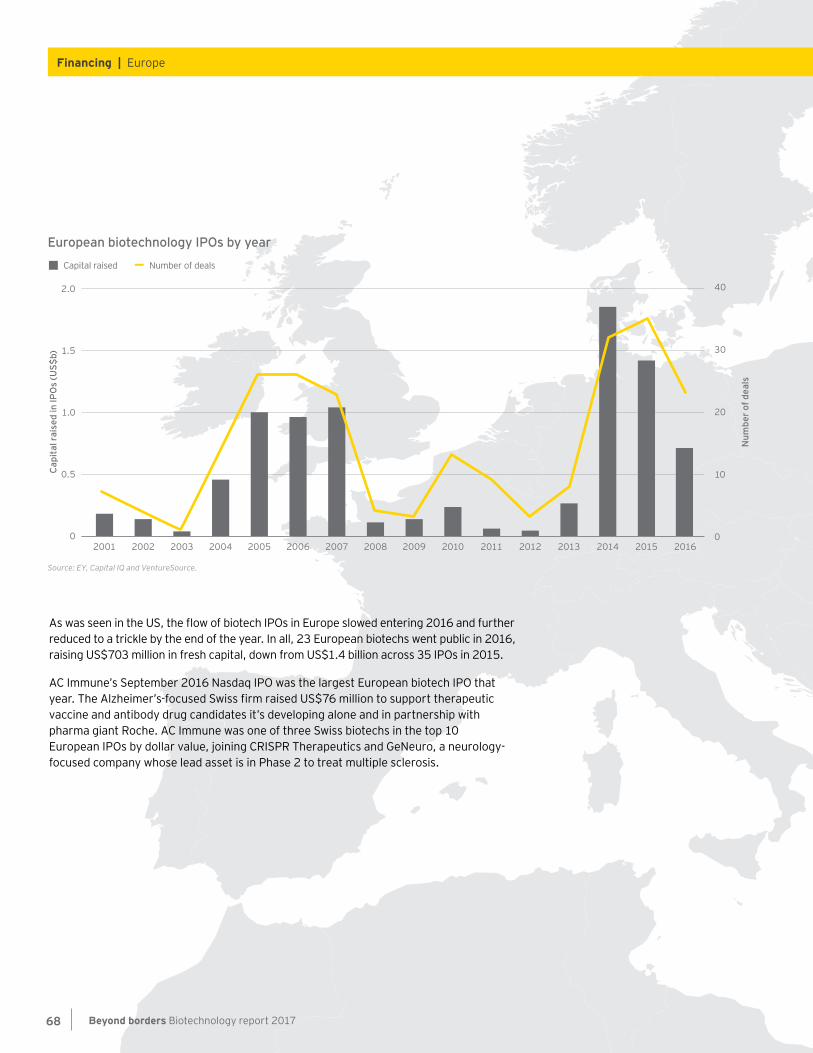
European biotechnology IPOs by year
2016
Source: EY, Capital IQ and VentureSource.
Cap
ital
rai
sed
in IP
Os
(US$
b)
Num
ber o
f dea
ls
40
30
20
10
0
1.5
2.0
0
0.5
1.0
Number of dealsCapital raised
2001 2002 2003 2004 2005 2006 2007 2008 2009 2010 2011 2012 2013 2014 2015
As was seen in the US, the flow of biotech IPOs in Europe slowed entering 2016 and further reduced to a trickle by the end of the year. In all, 23 European biotechs went public in 2016, raising US$703 million in fresh capital, down from US$1.4 billion across 35 IPOs in 2015.
AC Immune’s September 2016 Nasdaq IPO was the largest European biotech IPO that year. The Alzheimer’s-focused Swiss firm raised US$76 million to support therapeutic vaccine and antibody drug candidates it’s developing alone and in partnership with pharma giant Roche. AC Immune was one of three Swiss biotechs in the top 10 European IPOs by dollar value, joining CRISPR Therapeutics and GeNeuro, a neurology-focused company whose lead asset is in Phase 2 to treat multiple sclerosis.
Beyond borders Biotechnology report 201768
Financing | Europe
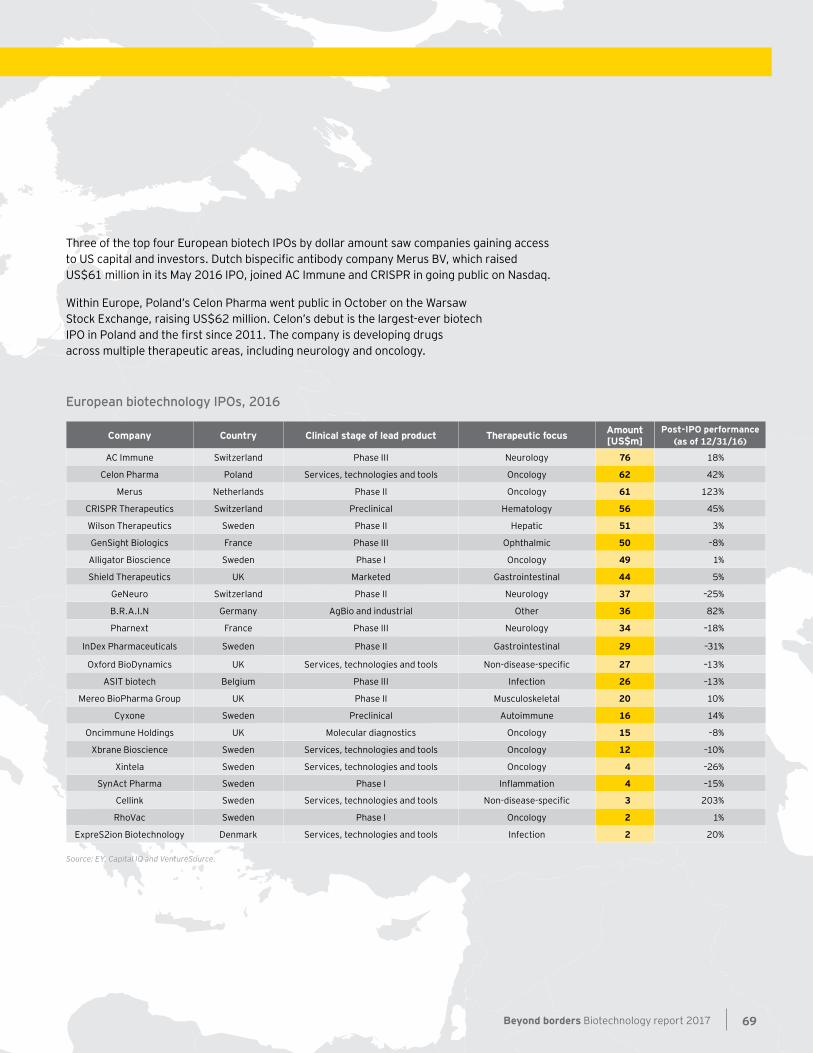
Three of the top four European biotech IPOs by dollar amount saw companies gaining access to US capital and investors. Dutch bispecific antibody company Merus BV, which raised US$61 million in its May 2016 IPO, joined AC Immune and CRISPR in going public on Nasdaq.
Within Europe, Poland’s Celon Pharma went public in October on the Warsaw Stock Exchange, raising US$62 million. Celon’s debut is the largest-ever biotech IPO in Poland and the first since 2011. The company is developing drugs across multiple therapeutic areas, including neurology and oncology.
European biotechnology IPOs, 2016
Company Country Clinical stage of lead product Therapeutic focus Amount [US$m]
Post-IPO performance (as of 12/31/16)
AC Immune Switzerland Phase III Neurology 76 18%
Celon Pharma Poland Services, technologies and tools Oncology 62 42%
Merus Netherlands Phase II Oncology 61 123%
CRISPR Therapeutics Switzerland Preclinical Hematology 56 45%
Wilson Therapeutics Sweden Phase II Hepatic 51 3%
GenSight Biologics France Phase III Ophthalmic 50 –8%
Alligator Bioscience Sweden Phase I Oncology 49 1%
Shield Therapeutics UK Marketed Gastrointestinal 44 5%
GeNeuro Switzerland Phase II Neurology 37 –25%
B.R.A.I.N Germany AgBio and industrial Other 36 82%
Pharnext France Phase III Neurology 34 –18%
InDex Pharmaceuticals Sweden Phase II Gastrointestinal 29 –31%
Oxford BioDynamics UK Services, technologies and tools Non-disease-specific 27 –13%
ASIT biotech Belgium Phase III Infection 26 –13%
Mereo BioPharma Group UK Phase II Musculoskeletal 20 10%
Cyxone Sweden Preclinical Autoimmune 16 14%
Oncimmune Holdings UK Molecular diagnostics Oncology 15 –8%
Xbrane Bioscience Sweden Services, technologies and tools Oncology 12 –10%
Xintela Sweden Services, technologies and tools Oncology 4 –26%
SynAct Pharma Sweden Phase I Inflammation 4 –15%
Cellink Sweden Services, technologies and tools Non-disease-specific 3 203%
RhoVac Sweden Phase I Oncology 2 1%
ExpreS2ion Biotechnology Denmark Services, technologies and tools Infection 2 20%
Source: EY, Capital IQ and VentureSource.
Beyond borders Biotechnology report 2017 69
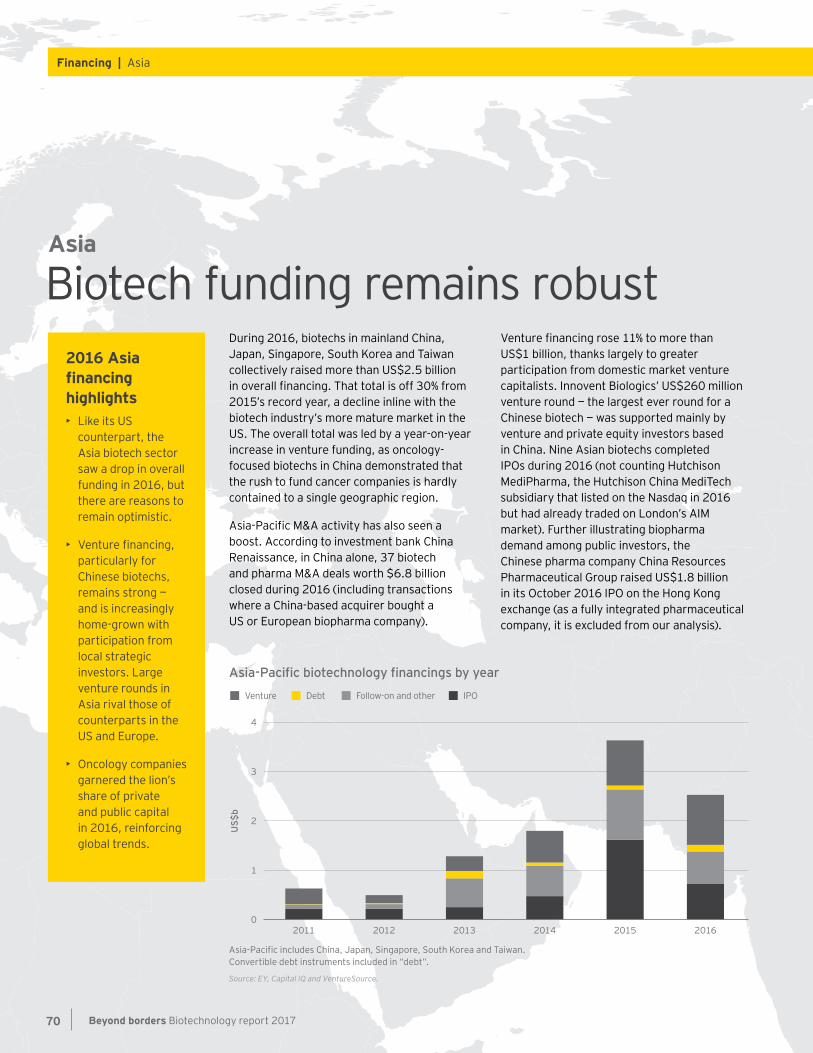
During 2016, biotechs in mainland China, Japan, Singapore, South Korea and Taiwan collectively raised more than US$2.5 billion in overall financing. That total is off 30% from 2015’s record year, a decline inline with the biotech industry’s more mature market in the US. The overall total was led by a year-on-year increase in venture funding, as oncology-focused biotechs in China demonstrated that the rush to fund cancer companies is hardly contained to a single geographic region.
Asia-Pacific M&A activity has also seen a boost. According to investment bank China Renaissance, in China alone, 37 biotech and pharma M&A deals worth $6.8 billion closed during 2016 (including transactions where a China-based acquirer bought a US or European biopharma company).
Venture financing rose 11% to more than US$1 billion, thanks largely to greater participation from domestic market venture capitalists. Innovent Biologics’ US$260 million venture round — the largest ever round for a Chinese biotech — was supported mainly by venture and private equity investors based in China. Nine Asian biotechs completed IPOs during 2016 (not counting Hutchison MediPharma, the Hutchison China MediTech subsidiary that listed on the Nasdaq in 2016 but had already traded on London’s AIM market). Further illustrating biopharma demand among public investors, the Chinese pharma company China Resources Pharmaceutical Group raised US$1.8 billion in its October 2016 IPO on the Hong Kong exchange (as a fully integrated pharmaceutical company, it is excluded from our analysis).
Biotech funding remains robustAsia
2016 Asia financing highlights• Like its US
counterpart, the Asia biotech sector saw a drop in overall funding in 2016, but there are reasons to remain optimistic.
• Venture financing, particularly for Chinese biotechs, remains strong — and is increasingly home-grown with participation from local strategic investors. Large venture rounds in Asia rival those of counterparts in the US and Europe.
• Oncology companies garnered the lion’s share of private and public capital in 2016, reinforcing global trends.
Asia-Pacific biotechnology financings by year
Asia-Pacific includes China, Japan, Singapore, South Korea and Taiwan. Convertible debt instruments included in “debt”.
Source: EY, Capital IQ and VentureSource.
US$
b
3
4
0
1
2
Venture Debt Follow-on and other IPO
201620152014201320122011
Beyond borders Biotechnology report 201770
Financing | Asia
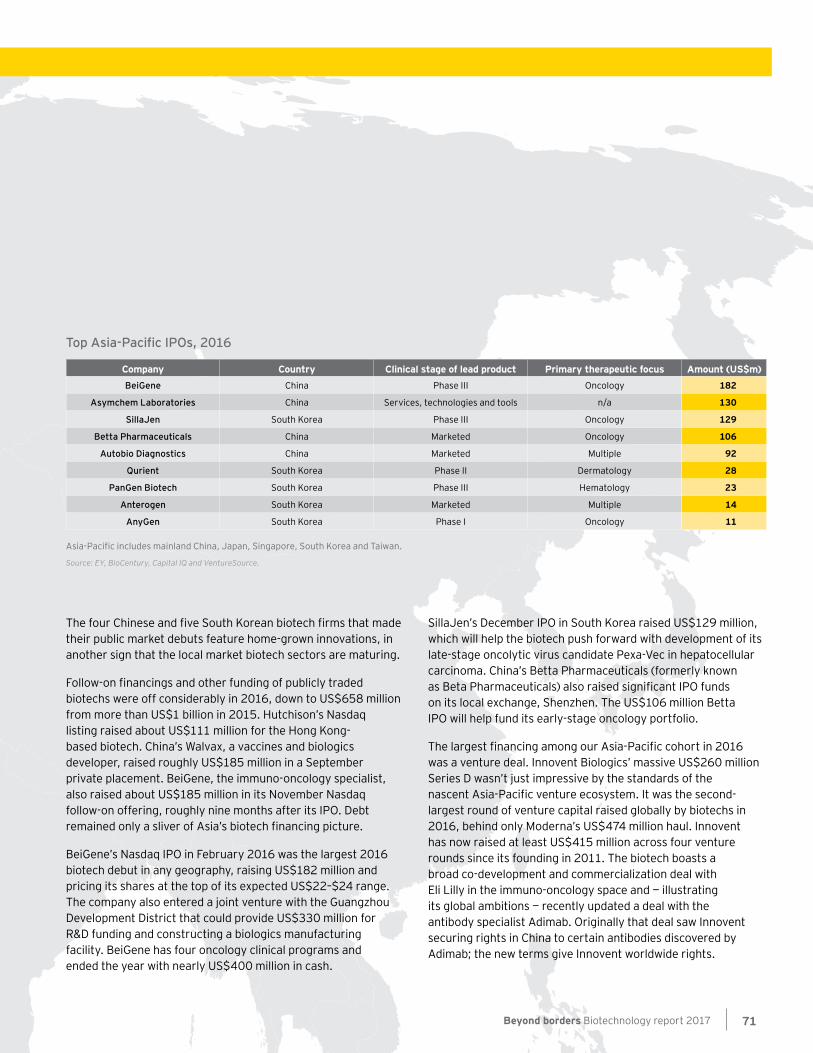
The four Chinese and five South Korean biotech firms that made their public market debuts feature home-grown innovations, in another sign that the local market biotech sectors are maturing.
Follow-on financings and other funding of publicly traded biotechs were off considerably in 2016, down to US$658 million from more than US$1 billion in 2015. Hutchison’s Nasdaq listing raised about US$111 million for the Hong Kong-based biotech. China’s Walvax, a vaccines and biologics developer, raised roughly US$185 million in a September private placement. BeiGene, the immuno-oncology specialist, also raised about US$185 million in its November Nasdaq follow-on offering, roughly nine months after its IPO. Debt remained only a sliver of Asia’s biotech financing picture.
BeiGene’s Nasdaq IPO in February 2016 was the largest 2016 biotech debut in any geography, raising US$182 million and pricing its shares at the top of its expected US$22–$24 range. The company also entered a joint venture with the Guangzhou Development District that could provide US$330 million for R&D funding and constructing a biologics manufacturing facility. BeiGene has four oncology clinical programs and ended the year with nearly US$400 million in cash.
SillaJen’s December IPO in South Korea raised US$129 million, which will help the biotech push forward with development of its late-stage oncolytic virus candidate Pexa-Vec in hepatocellular carcinoma. China’s Betta Pharmaceuticals (formerly known as Beta Pharmaceuticals) also raised significant IPO funds on its local exchange, Shenzhen. The US$106 million Betta IPO will help fund its early-stage oncology portfolio.
The largest financing among our Asia-Pacific cohort in 2016 was a venture deal. Innovent Biologics’ massive US$260 million Series D wasn’t just impressive by the standards of the nascent Asia-Pacific venture ecosystem. It was the second-largest round of venture capital raised globally by biotechs in 2016, behind only Moderna’s US$474 million haul. Innovent has now raised at least US$415 million across four venture rounds since its founding in 2011. The biotech boasts a broad co-development and commercialization deal with Eli Lilly in the immuno-oncology space and — illustrating its global ambitions — recently updated a deal with the antibody specialist Adimab. Originally that deal saw Innovent securing rights in China to certain antibodies discovered by Adimab; the new terms give Innovent worldwide rights.
Asia-Pacific includes mainland China, Japan, Singapore, South Korea and Taiwan.
Source: EY, BioCentury, Capital IQ and VentureSource.
Top Asia-Pacific IPOs, 2016
Company Country Clinical stage of lead product Primary therapeutic focus Amount (US$m)BeiGene China Phase III Oncology 182
Asymchem Laboratories China Services, technologies and tools n/a 130
SillaJen South Korea Phase III Oncology 129
Betta Pharmaceuticals China Marketed Oncology 106
Autobio Diagnostics China Marketed Multiple 92
Qurient South Korea Phase II Dermatology 28
PanGen Biotech South Korea Phase III Hematology 23
Anterogen South Korea Marketed Multiple 14
AnyGen South Korea Phase I Oncology 11
Beyond borders Biotechnology report 2017 71
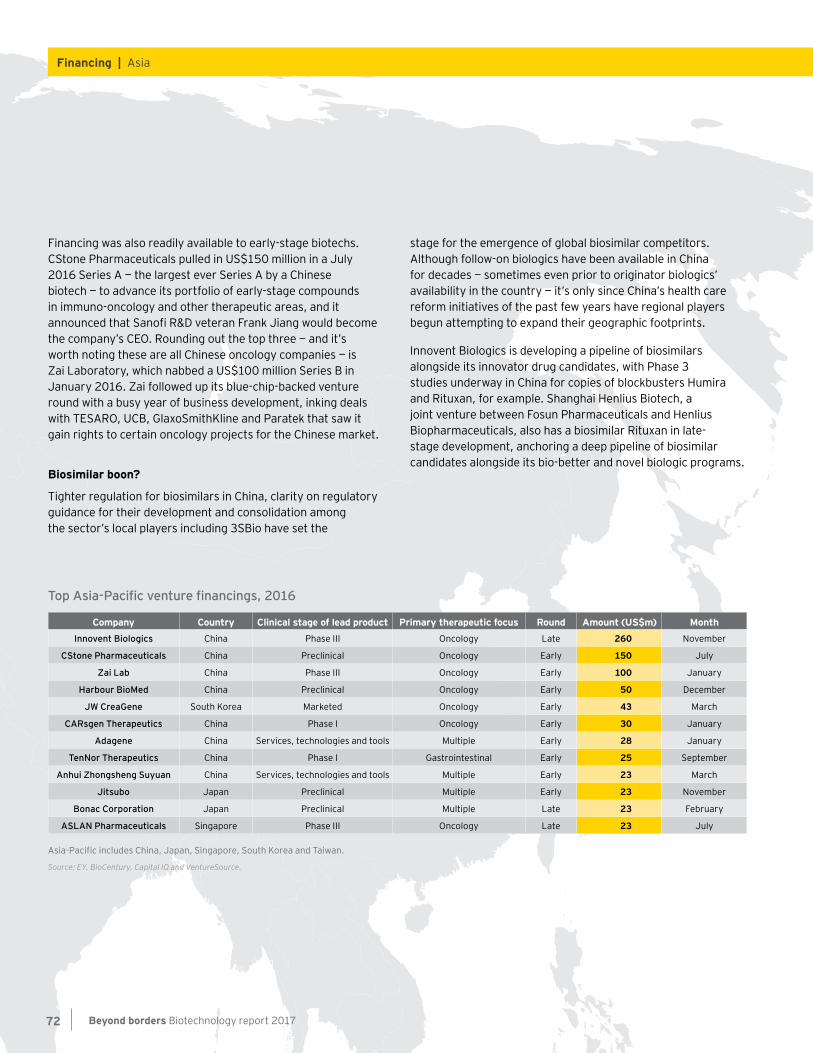
Financing was also readily available to early-stage biotechs. CStone Pharmaceuticals pulled in US$150 million in a July 2016 Series A — the largest ever Series A by a Chinese biotech — to advance its portfolio of early-stage compounds in immuno-oncology and other therapeutic areas, and it announced that Sanofi R&D veteran Frank Jiang would become the company’s CEO. Rounding out the top three — and it’s worth noting these are all Chinese oncology companies — is Zai Laboratory, which nabbed a US$100 million Series B in January 2016. Zai followed up its blue-chip-backed venture round with a busy year of business development, inking deals with TESARO, UCB, GlaxoSmithKline and Paratek that saw it gain rights to certain oncology projects for the Chinese market.
Biosimilar boon?
Tighter regulation for biosimilars in China, clarity on regulatory guidance for their development and consolidation among the sector’s local players including 3SBio have set the
stage for the emergence of global biosimilar competitors. Although follow-on biologics have been available in China for decades — sometimes even prior to originator biologics’ availability in the country — it’s only since China’s health care reform initiatives of the past few years have regional players begun attempting to expand their geographic footprints.
Innovent Biologics is developing a pipeline of biosimilars alongside its innovator drug candidates, with Phase 3 studies underway in China for copies of blockbusters Humira and Rituxan, for example. Shanghai Henlius Biotech, a joint venture between Fosun Pharmaceuticals and Henlius Biopharmaceuticals, also has a biosimilar Rituxan in late-stage development, anchoring a deep pipeline of biosimilar candidates alongside its bio-better and novel biologic programs.
Asia-Pacific includes China, Japan, Singapore, South Korea and Taiwan.
Source: EY, BioCentury, Capital IQ and VentureSource.
Top Asia-Pacific venture financings, 2016
Company Country Clinical stage of lead product Primary therapeutic focus Round Amount (US$m) MonthInnovent Biologics China Phase III Oncology Late 260 November
CStone Pharmaceuticals China Preclinical Oncology Early 150 July
Zai Lab China Phase III Oncology Early 100 January
Harbour BioMed China Preclinical Oncology Early 50 December
JW CreaGene South Korea Marketed Oncology Early 43 March
CARsgen Therapeutics China Phase I Oncology Early 30 January
Adagene China Services, technologies and tools Multiple Early 28 January
TenNor Therapeutics China Phase I Gastrointestinal Early 25 September
Anhui Zhongsheng Suyuan China Services, technologies and tools Multiple Early 23 March
Jitsubo Japan Preclinical Multiple Early 23 November
Bonac Corporation Japan Preclinical Multiple Late 23 February
ASLAN Pharmaceuticals Singapore Phase III Oncology Late 23 July
Beyond borders Biotechnology report 201772
Financing | Asia
Questions for biotech companies to consider• What investments should you prioritize to
reach the next value inflection point?
• Have you de-risked your financing strategy by securing multiple pools of capital?
• How will you tap into new sources of funding?
• How can early-stage biotechs compete when commercial leaders have more capital?
Beyond borders Biotechnology report 2017 73
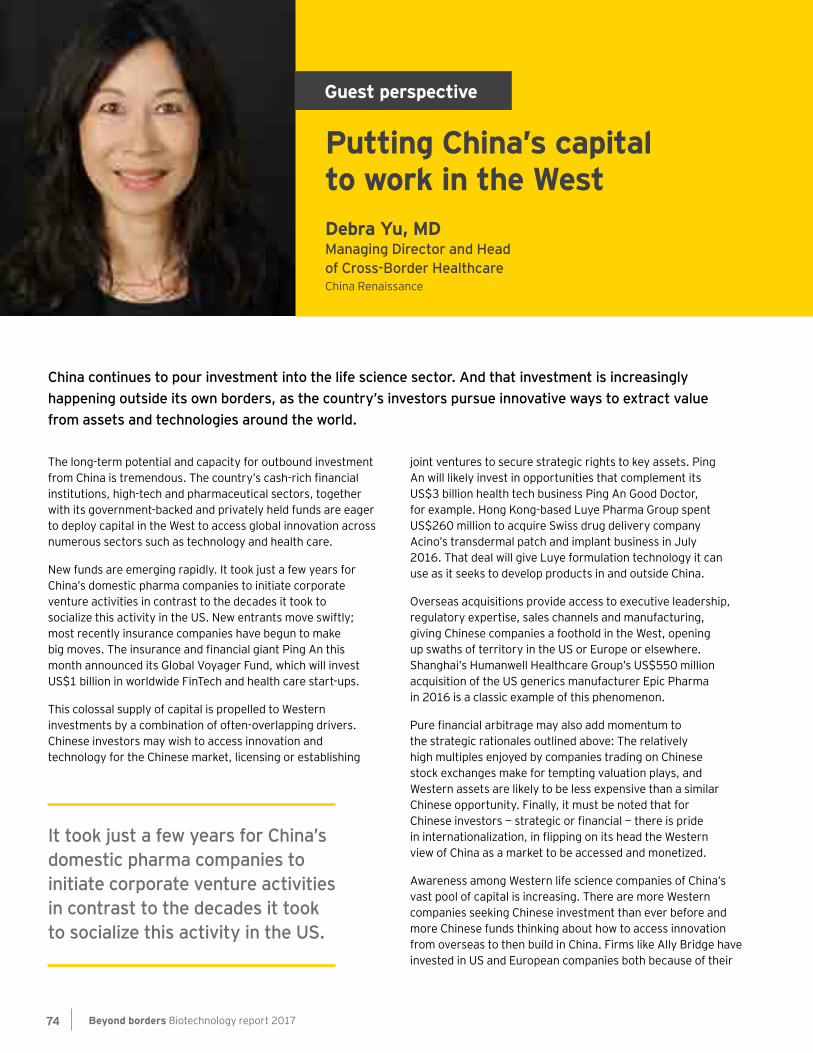
The long-term potential and capacity for outbound investment from China is tremendous. The country’s cash-rich financial institutions, high-tech and pharmaceutical sectors, together with its government-backed and privately held funds are eager to deploy capital in the West to access global innovation across numerous sectors such as technology and health care.
New funds are emerging rapidly. It took just a few years for China’s domestic pharma companies to initiate corporate venture activities in contrast to the decades it took to socialize this activity in the US. New entrants move swiftly; most recently insurance companies have begun to make big moves. The insurance and financial giant Ping An this month announced its Global Voyager Fund, which will invest US$1 billion in worldwide FinTech and health care start-ups.
This colossal supply of capital is propelled to Western investments by a combination of often-overlapping drivers. Chinese investors may wish to access innovation and technology for the Chinese market, licensing or establishing
joint ventures to secure strategic rights to key assets. Ping An will likely invest in opportunities that complement its US$3 billion health tech business Ping An Good Doctor, for example. Hong Kong-based Luye Pharma Group spent US$260 million to acquire Swiss drug delivery company Acino’s transdermal patch and implant business in July 2016. That deal will give Luye formulation technology it can use as it seeks to develop products in and outside China.
Overseas acquisitions provide access to executive leadership, regulatory expertise, sales channels and manufacturing, giving Chinese companies a foothold in the West, opening up swaths of territory in the US or Europe or elsewhere. Shanghai’s Humanwell Healthcare Group’s US$550 million acquisition of the US generics manufacturer Epic Pharma in 2016 is a classic example of this phenomenon.
Pure financial arbitrage may also add momentum to the strategic rationales outlined above: The relatively high multiples enjoyed by companies trading on Chinese stock exchanges make for tempting valuation plays, and Western assets are likely to be less expensive than a similar Chinese opportunity. Finally, it must be noted that for Chinese investors — strategic or financial — there is pride in internationalization, in flipping on its head the Western view of China as a market to be accessed and monetized.
Awareness among Western life science companies of China’s vast pool of capital is increasing. There are more Western companies seeking Chinese investment than ever before and more Chinese funds thinking about how to access innovation from overseas to then build in China. Firms like Ally Bridge have invested in US and European companies both because of their
China continues to pour investment into the life science sector. And that investment is increasingly happening outside its own borders, as the country’s investors pursue innovative ways to extract value from assets and technologies around the world.
Guest perspective
Debra Yu, MDManaging Director and Head of Cross-Border HealthcareChina Renaissance
Putting China’s capital to work in the West
It took just a few years for China’s domestic pharma companies to initiate corporate venture activities in contrast to the decades it took to socialize this activity in the US.
Beyond borders Biotechnology report 201774
inherent value and the potentially move into the Chinese market. Qiming Venture Partners and Frontline BioVentures have also raised funds dedicated to investing in the West.
Western biotechs may seek out China for the wrong reasons: China is not a new source of “dumb money.” Still others understand that their products or technologies may be applicable to the Chinese market and see the benefit of having Chinese investors at the table as they attempt to navigate the market.
The periodicity of change in China is astounding: it took only two years to transform the country’s telecom infrastructure, wiring 1.4 billion people in the process. For a Chinese buyer, intellectual property in China has gone from a nice-to-have to absolutely essential in the eight years I have been doing cross- border deals. Complacency toward China’s opportunities and growth from investors and companies in established health care ecosystems in well-heeled global markets is strategically misguided. As China ramps up deployment of capital overseas in the life sciences sector in general and biotech in particular, it is quickly becoming a prominent and durable source of capital, and may leapfrog less innovative Western markets in the process.
Debra Yu, MD, is Managing Director and Head of Cross-border Healthcare at China Renaissance, a leading new economy investment bank that maintains offices in Beijing, Shanghai, Hong Kong and New York, where she advises Western companies considering how to access China, Chinese companies that are fundraising, and both sets of companies on cross-border M&A. She has more than 25 years’ experience in life sciences venture capital, business development, mergers and acquisitions, strategic and cross border transactions.
For Chinese investors — strategic or financial — there is pride in internationalization, in flipping on its head the Western view of China as a market to be accessed and monetized.
Beyond borders Biotechnology report 2017 75
Japan’s large and growing elderly population, plus its long-term outlook, has led to regenerative medicine becoming a key part of government strategy. The field is about not just revolutionary treatment modalities, gene- and cell-based therapies (including the burgeoning cancer immunotherapy field). It’s also about using human living cells — iPSCs in particular — as tools for broader drug development, for instance in drug screening, where previously only animal cells could be used. Regenerative medicine and cell therapy techniques will be game changers with regard to both therapies and drug development. Demographic and economic realities across the world demand such game changers.
A collaborative approach among academia, government and industry is central to Japan’s regenerative medicine eco-system. The Forum for Regenerative Medicine (FIRM) embodies this approach, bringing together more than 200 members, including industry, nonprofits, academic institutes and
clinics to encourage and accelerate the development of regenerative medicines. Its mission: to create treatments of value to society, but also to be globally competitive. Industry has a crucial role to play in turning regenerative medicine research into solutions for patients. Systematic collection and use of medical data is also key, along with cutting-edge technological strength and sustainable costs.
In 2014, Japan introduced two laws to create a robust, yet accommodating regulatory framework for regenerative medicine. One covers safety in research, clinical trials and medical practice involving cell and gene therapies, the other provides a conditional approval pathway for such medicines, similar to the European Medicines Agency’s adaptive licensing program.
As of 2017, Japan had approved two regenerative medicine treatments under the new laws. One is JCR Pharmaceuticals Co. Ltd.’s Temcell for steroid refractory graft-vs-host disease, an allogeneic stem cell therapy based on mesenchymal stem cells, whose technology came from Osiris Therapeutics Inc. and partner Mesoblast Ltd. (An equivalent product, Prochymal, is approved in Canada and New Zealand). The second is HeartSheet, an autologous skeletal myoblast therapy for heart failure due to IHD, manufactured by Terumo Corp.
Plenty of challenges remain, not least around production, distribution, quality assurance and international standards for regenerative medicines. They can only be resolved through close stakeholder collaboration — collaboration that FIRM is committed to building and strengthening.
In March 2017, Japanese scientists carried out the world’s first eye transplant using donor stem cells. The procedure involved transplanting retina cells created from donor induced pluripotent stem cells (iPSC). It marked an important milestone in the country’s already-thriving regenerative medicine sector. By using a stockpile of iPSCs rather than relying on the patient’s own cells, the team significantly cut the cost of the operation and the time required to prepare the patient, taking it closer to becoming a more viable option for those suffering from age-related AMD.
Guest perspective
Yuzo TodaChairman of the Forum for Innovative Regenerative Medicine and VP and Chief Technical Officer Fujifilm Corporation
Japan: leading the way in regenerative medicine
A collaborative approach among academia, government and industry is central to Japan’s regenerative medicine eco-system.
Beyond borders Biotechnology report 201776

Beyond borders Biotechnology report 2017 77

Biotech financing
Beyond borders Biotechnology report 201778
Dealmaking
DealmakingDealmaking remains active, though not as lucrative, for biotechs• Five biopharma megadeals, each valued at greater
than US$5 billion, comprised three-quarters of all M&A value in 2016, driving another strong dealmaking year for the biopharma industry.
• Alliance and M&A volume each fell slightly from 2015, and guaranteed money in alliances dropped substantially, reflecting the tightening capital environment and declining biotech valuations that characterize a buyer’s market.
• Expectations of an improved regulatory and tax environment have boosted hopes of a banner dealmaking year heading into 2017. Johnson & Johnson’s $30 billion takeover of Swiss biotech Actelion and Takeda’s US$5.2 billion buyout of Ariad started the year with a bang.
Beyond borders Biotechnology report 2017 79
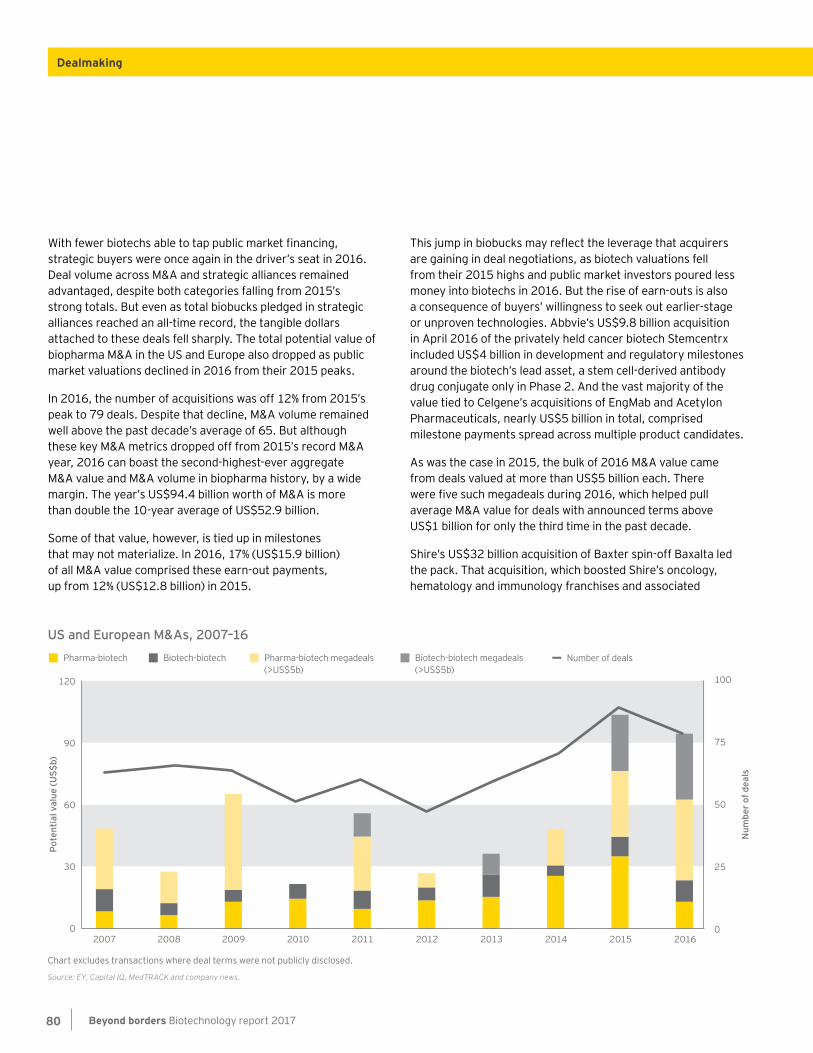
With fewer biotechs able to tap public market financing, strategic buyers were once again in the driver’s seat in 2016. Deal volume across M&A and strategic alliances remained advantaged, despite both categories falling from 2015’s strong totals. But even as total biobucks pledged in strategic alliances reached an all-time record, the tangible dollars attached to these deals fell sharply. The total potential value of biopharma M&A in the US and Europe also dropped as public market valuations declined in 2016 from their 2015 peaks.
In 2016, the number of acquisitions was off 12% from 2015’s peak to 79 deals. Despite that decline, M&A volume remained well above the past decade’s average of 65. But although these key M&A metrics dropped off from 2015’s record M&A year, 2016 can boast the second-highest-ever aggregate M&A value and M&A volume in biopharma history, by a wide margin. The year’s US$94.4 billion worth of M&A is more than double the 10-year average of US$52.9 billion.
Some of that value, however, is tied up in milestones that may not materialize. In 2016, 17% (US$15.9 billion) of all M&A value comprised these earn-out payments, up from 12% (US$12.8 billion) in 2015.
This jump in biobucks may reflect the leverage that acquirers are gaining in deal negotiations, as biotech valuations fell from their 2015 highs and public market investors poured less money into biotechs in 2016. But the rise of earn-outs is also a consequence of buyers’ willingness to seek out earlier-stage or unproven technologies. Abbvie’s US$9.8 billion acquisition in April 2016 of the privately held cancer biotech Stemcentrx included US$4 billion in development and regulatory milestones around the biotech’s lead asset, a stem cell-derived antibody drug conjugate only in Phase 2. And the vast majority of the value tied to Celgene’s acquisitions of EngMab and Acetylon Pharmaceuticals, nearly US$5 billion in total, comprised milestone payments spread across multiple product candidates.
As was the case in 2015, the bulk of 2016 M&A value came from deals valued at more than US$5 billion each. There were five such megadeals during 2016, which helped pull average M&A value for deals with announced terms above US$1 billion for only the third time in the past decade.
Shire’s US$32 billion acquisition of Baxter spin-off Baxalta led the pack. That acquisition, which boosted Shire’s oncology, hematology and immunology franchises and associated
Chart excludes transactions where deal terms were not publicly disclosed.
Source: EY, Capital IQ, MedTRACK and company news.
US and European M&As, 2007–16
Pote
ntia
l val
ue (U
S$b)
Num
ber o
f dea
ls
100
75
50
25
0
120
30
0
60
90
Number of dealsPharma-biotech Biotech-biotech Pharma-biotech megadeals (>US$5b)
Biotech-biotech megadeals (>US$5b)
2007 2008 2009 2010 2011 2012 2013 2014 2015 2016
Beyond borders Biotechnology report 201780
Dealmaking
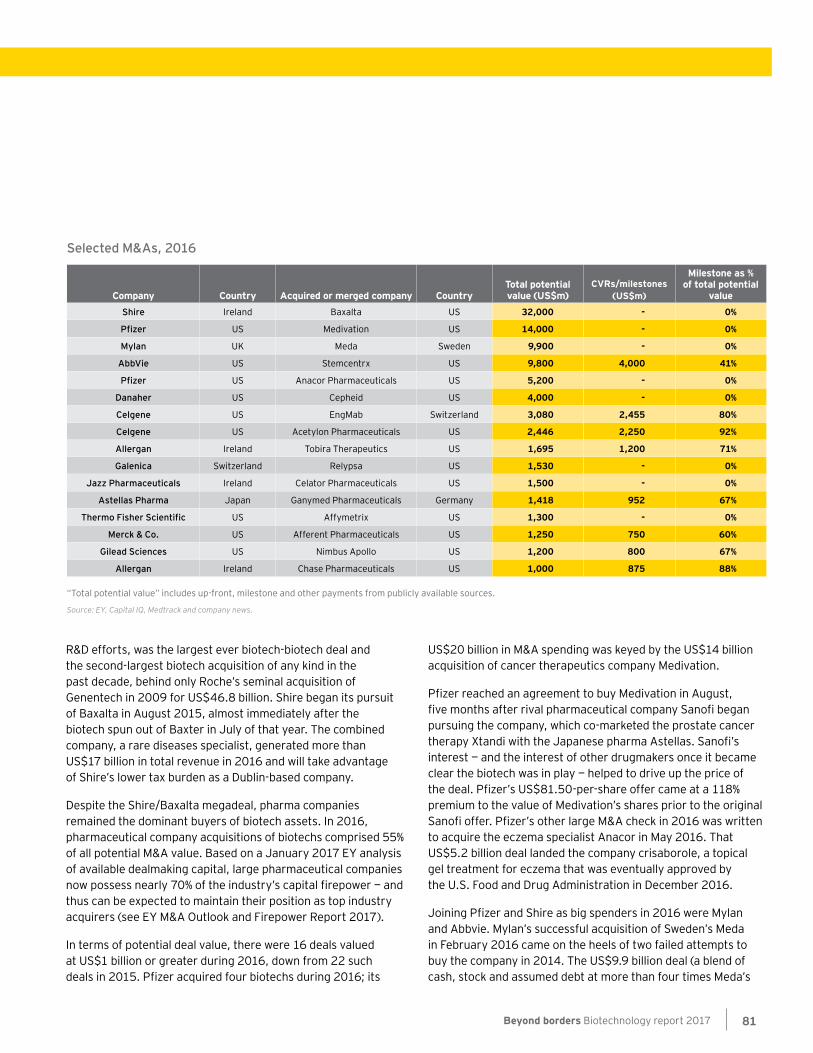
R&D efforts, was the largest ever biotech-biotech deal and the second-largest biotech acquisition of any kind in the past decade, behind only Roche’s seminal acquisition of Genentech in 2009 for US$46.8 billion. Shire began its pursuit of Baxalta in August 2015, almost immediately after the biotech spun out of Baxter in July of that year. The combined company, a rare diseases specialist, generated more than US$17 billion in total revenue in 2016 and will take advantage of Shire’s lower tax burden as a Dublin-based company.
Despite the Shire/Baxalta megadeal, pharma companies remained the dominant buyers of biotech assets. In 2016, pharmaceutical company acquisitions of biotechs comprised 55% of all potential M&A value. Based on a January 2017 EY analysis of available dealmaking capital, large pharmaceutical companies now possess nearly 70% of the industry’s capital firepower — and thus can be expected to maintain their position as top industry acquirers (see EY M&A Outlook and Firepower Report 2017).
In terms of potential deal value, there were 16 deals valued at US$1 billion or greater during 2016, down from 22 such deals in 2015. Pfizer acquired four biotechs during 2016; its
US$20 billion in M&A spending was keyed by the US$14 billion acquisition of cancer therapeutics company Medivation.
Pfizer reached an agreement to buy Medivation in August, five months after rival pharmaceutical company Sanofi began pursuing the company, which co-marketed the prostate cancer therapy Xtandi with the Japanese pharma Astellas. Sanofi’s interest — and the interest of other drugmakers once it became clear the biotech was in play — helped to drive up the price of the deal. Pfizer’s US$81.50-per-share offer came at a 118% premium to the value of Medivation’s shares prior to the original Sanofi offer. Pfizer’s other large M&A check in 2016 was written to acquire the eczema specialist Anacor in May 2016. That US$5.2 billion deal landed the company crisaborole, a topical gel treatment for eczema that was eventually approved by the U.S. Food and Drug Administration in December 2016.
Joining Pfizer and Shire as big spenders in 2016 were Mylan and Abbvie. Mylan’s successful acquisition of Sweden’s Meda in February 2016 came on the heels of two failed attempts to buy the company in 2014. The US$9.9 billion deal (a blend of cash, stock and assumed debt at more than four times Meda’s
Selected M&As, 2016
Company Country Acquired or merged company CountryTotal potential value (US$m)
CVRs/milestones (US$m)
Milestone as % of total potential
valueShire Ireland Baxalta US 32,000 - 0%
Pfizer US Medivation US 14,000 - 0%
Mylan UK Meda Sweden 9,900 - 0%
AbbVie US Stemcentrx US 9,800 4,000 41%
Pfizer US Anacor Pharmaceuticals US 5,200 - 0%
Danaher US Cepheid US 4,000 - 0%
Celgene US EngMab Switzerland 3,080 2,455 80%
Celgene US Acetylon Pharmaceuticals US 2,446 2,250 92%
Allergan Ireland Tobira Therapeutics US 1,695 1,200 71%
Galenica Switzerland Relypsa US 1,530 - 0%
Jazz Pharmaceuticals Ireland Celator Pharmaceuticals US 1,500 - 0%
Astellas Pharma Japan Ganymed Pharmaceuticals Germany 1,418 952 67%
Thermo Fisher Scientific US Affymetrix US 1,300 - 0%
Merck & Co. US Afferent Pharmaceuticals US 1,250 750 60%
Gilead Sciences US Nimbus Apollo US 1,200 800 67%
Allergan Ireland Chase Pharmaceuticals US 1,000 875 88%
“Total potential value” includes up-front, milestone and other payments from publicly available sources.
Source: EY, Capital IQ, Medtrack and company news.
Beyond borders Biotechnology report 2017 81
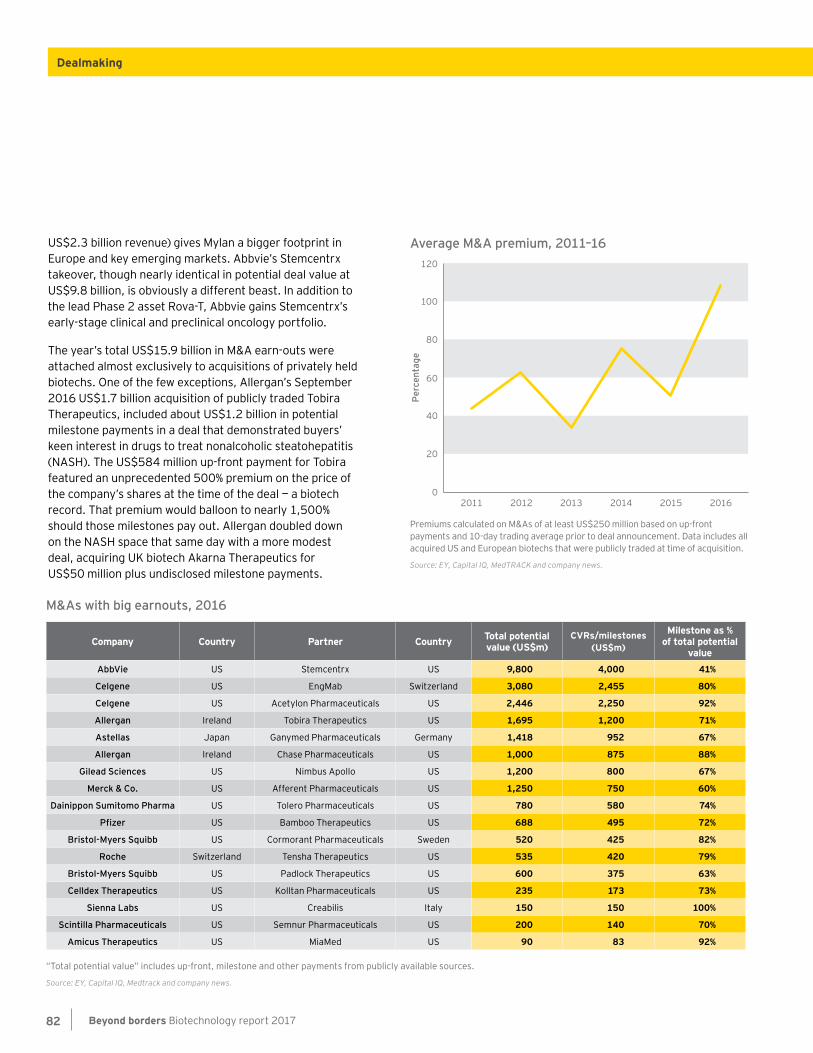
US$2.3 billion revenue) gives Mylan a bigger footprint in Europe and key emerging markets. Abbvie’s Stemcentrx takeover, though nearly identical in potential deal value at US$9.8 billion, is obviously a different beast. In addition to the lead Phase 2 asset Rova-T, Abbvie gains Stemcentrx’s early-stage clinical and preclinical oncology portfolio.
The year’s total US$15.9 billion in M&A earn-outs were attached almost exclusively to acquisitions of privately held biotechs. One of the few exceptions, Allergan’s September 2016 US$1.7 billion acquisition of publicly traded Tobira Therapeutics, included about US$1.2 billion in potential milestone payments in a deal that demonstrated buyers’ keen interest in drugs to treat nonalcoholic steatohepatitis (NASH). The US$584 million up-front payment for Tobira featured an unprecedented 500% premium on the price of the company’s shares at the time of the deal — a biotech record. That premium would balloon to nearly 1,500% should those milestones pay out. Allergan doubled down on the NASH space that same day with a more modest deal, acquiring UK biotech Akarna Therapeutics for US$50 million plus undisclosed milestone payments.
M&As with big earnouts, 2016
Company Country Partner Country Total potential value (US$m)
CVRs/milestones (US$m)
Milestone as % of total potential
valueAbbVie US Stemcentrx US 9,800 4,000 41%
Celgene US EngMab Switzerland 3,080 2,455 80%
Celgene US Acetylon Pharmaceuticals US 2,446 2,250 92%
Allergan Ireland Tobira Therapeutics US 1,695 1,200 71%
Astellas Japan Ganymed Pharmaceuticals Germany 1,418 952 67%
Allergan Ireland Chase Pharmaceuticals US 1,000 875 88%
Gilead Sciences US Nimbus Apollo US 1,200 800 67%
Merck & Co. US Afferent Pharmaceuticals US 1,250 750 60%
Dainippon Sumitomo Pharma US Tolero Pharmaceuticals US 780 580 74%
Pfizer US Bamboo Therapeutics US 688 495 72%
Bristol-Myers Squibb US Cormorant Pharmaceuticals Sweden 520 425 82%
Roche Switzerland Tensha Therapeutics US 535 420 79%
Bristol-Myers Squibb US Padlock Therapeutics US 600 375 63%
Celldex Therapeutics US Kolltan Pharmaceuticals US 235 173 73%
Sienna Labs US Creabilis Italy 150 150 100%
Scintilla Pharmaceuticals US Semnur Pharmaceuticals US 200 140 70%
Amicus Therapeutics US MiaMed US 90 83 92%
“Total potential value” includes up-front, milestone and other payments from publicly available sources.
Source: EY, Capital IQ, Medtrack and company news.
Premiums calculated on M&As of at least US$250 million based on up-front payments and 10-day trading average prior to deal announcement. Data includes all acquired US and European biotechs that were publicly traded at time of acquisition.
Source: EY, Capital IQ, MedTRACK and company news.
Average M&A premium, 2011–16
Perc
enta
ge
120
100
20
0
60
40
80
2011 2012 2013 2014 2015 2016
Beyond borders Biotechnology report 201782
Dealmaking
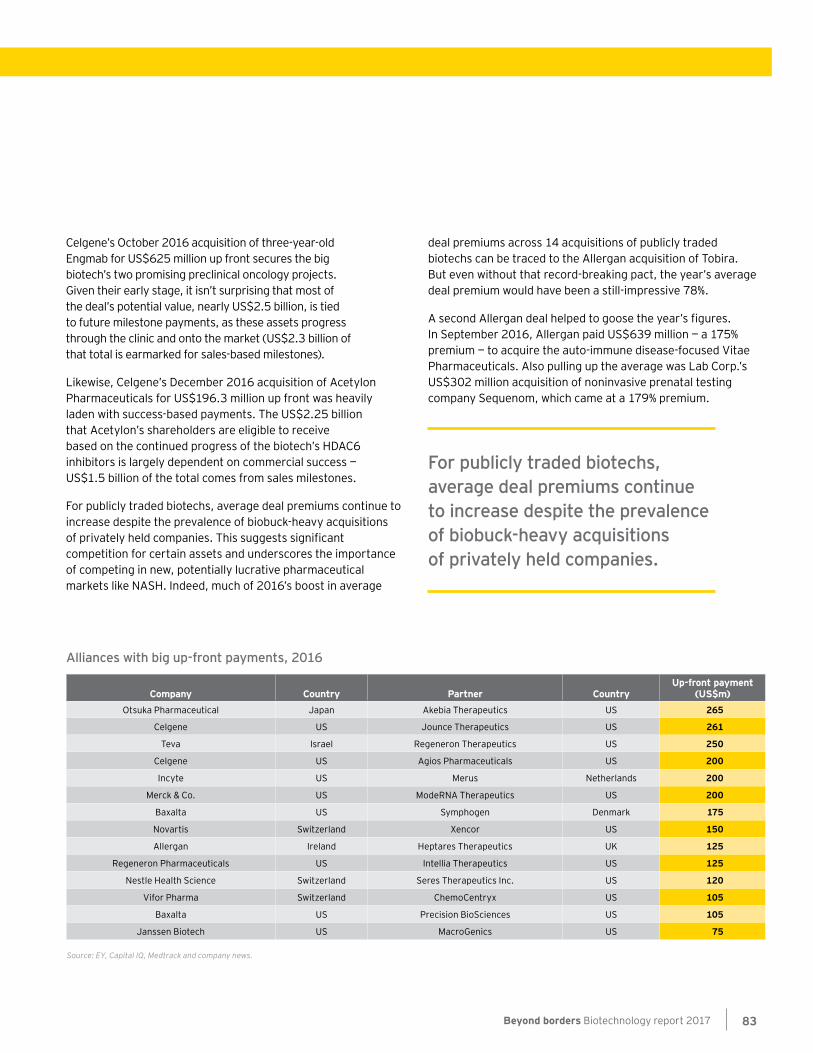
Celgene’s October 2016 acquisition of three-year-old Engmab for US$625 million up front secures the big biotech’s two promising preclinical oncology projects. Given their early stage, it isn’t surprising that most of the deal’s potential value, nearly US$2.5 billion, is tied to future milestone payments, as these assets progress through the clinic and onto the market (US$2.3 billion of that total is earmarked for sales-based milestones).
Likewise, Celgene’s December 2016 acquisition of Acetylon Pharmaceuticals for US$196.3 million up front was heavily laden with success-based payments. The US$2.25 billion that Acetylon’s shareholders are eligible to receive based on the continued progress of the biotech’s HDAC6 inhibitors is largely dependent on commercial success — US$1.5 billion of the total comes from sales milestones.
For publicly traded biotechs, average deal premiums continue to increase despite the prevalence of biobuck-heavy acquisitions of privately held companies. This suggests significant competition for certain assets and underscores the importance of competing in new, potentially lucrative pharmaceutical markets like NASH. Indeed, much of 2016’s boost in average
deal premiums across 14 acquisitions of publicly traded biotechs can be traced to the Allergan acquisition of Tobira. But even without that record-breaking pact, the year’s average deal premium would have been a still-impressive 78%.
A second Allergan deal helped to goose the year’s figures. In September 2016, Allergan paid US$639 million — a 175% premium — to acquire the auto-immune disease-focused Vitae Pharmaceuticals. Also pulling up the average was Lab Corp.’s US$302 million acquisition of noninvasive prenatal testing company Sequenom, which came at a 179% premium.
Alliances with big up-front payments, 2016
Company Country Partner CountryUp-front payment
(US$m)Otsuka Pharmaceutical Japan Akebia Therapeutics US 265
Celgene US Jounce Therapeutics US 261
Teva Israel Regeneron Therapeutics US 250
Celgene US Agios Pharmaceuticals US 200
Incyte US Merus Netherlands 200
Merck & Co. US ModeRNA Therapeutics US 200
Baxalta US Symphogen Denmark 175
Novartis Switzerland Xencor US 150
Allergan Ireland Heptares Therapeutics UK 125
Regeneron Pharmaceuticals US Intellia Therapeutics US 125
Nestle Health Science Switzerland Seres Therapeutics Inc. US 120
Vifor Pharma Switzerland ChemoCentryx US 105
Baxalta US Precision BioSciences US 105
Janssen Biotech US MacroGenics US 75
Source: EY, Capital IQ, Medtrack and company news.
For publicly traded biotechs, average deal premiums continue to increase despite the prevalence of biobuck-heavy acquisitions of privately held companies.
Beyond borders Biotechnology report 2017 83
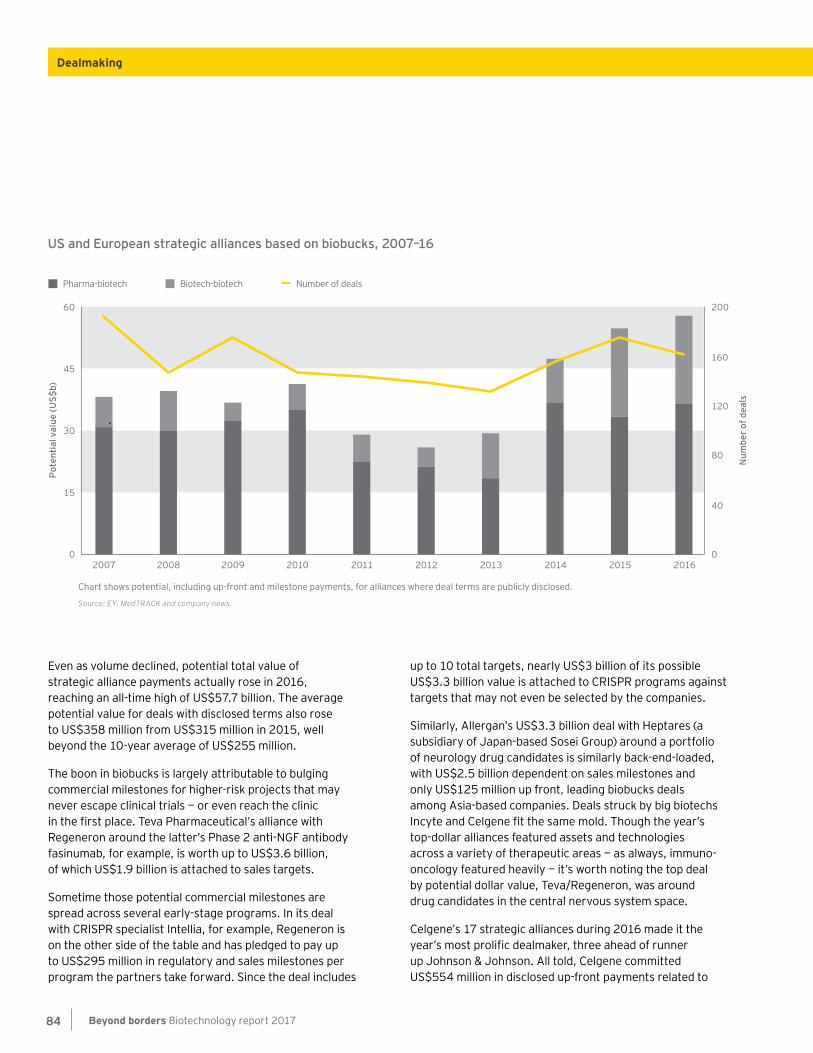
Even as volume declined, potential total value of strategic alliance payments actually rose in 2016, reaching an all-time high of US$57.7 billion. The average potential value for deals with disclosed terms also rose to US$358 million from US$315 million in 2015, well beyond the 10-year average of US$255 million.
The boon in biobucks is largely attributable to bulging commercial milestones for higher-risk projects that may never escape clinical trials — or even reach the clinic in the first place. Teva Pharmaceutical’s alliance with Regeneron around the latter’s Phase 2 anti-NGF antibody fasinumab, for example, is worth up to US$3.6 billion, of which US$1.9 billion is attached to sales targets.
Sometime those potential commercial milestones are spread across several early-stage programs. In its deal with CRISPR specialist Intellia, for example, Regeneron is on the other side of the table and has pledged to pay up to US$295 million in regulatory and sales milestones per program the partners take forward. Since the deal includes
up to 10 total targets, nearly US$3 billion of its possible US$3.3 billion value is attached to CRISPR programs against targets that may not even be selected by the companies.
Similarly, Allergan’s US$3.3 billion deal with Heptares (a subsidiary of Japan-based Sosei Group) around a portfolio of neurology drug candidates is similarly back-end-loaded, with US$2.5 billion dependent on sales milestones and only US$125 million up front, leading biobucks deals among Asia-based companies. Deals struck by big biotechs Incyte and Celgene fit the same mold. Though the year’s top-dollar alliances featured assets and technologies across a variety of therapeutic areas — as always, immuno-oncology featured heavily — it’s worth noting the top deal by potential dollar value, Teva/Regeneron, was around drug candidates in the central nervous system space.
Celgene’s 17 strategic alliances during 2016 made it the year’s most prolific dealmaker, three ahead of runner up Johnson & Johnson. All told, Celgene committed US$554 million in disclosed up-front payments related to
US and European strategic alliances based on biobucks, 2007–16
Chart shows potential, including up-front and milestone payments, for alliances where deal terms are publicly disclosed.
Source: EY, MedTRACK and company news.
Pote
ntia
l val
ue (U
S$b)
Num
ber o
f dea
ls
60 200
0 0
30
80
45
1540
Number of dealsPharma-biotech Biotech-biotech
2007 2008 2009 2010 2011 2012 2013 2014 2015 2016
120
160
Beyond borders Biotechnology report 201784
Dealmaking
these pacts, which could be worth US$4.1 billion in aggregate potential disclosed payments. A July 2016 alliance with immuno-oncology specialist Jounce Therapeutics was by far the big biotech’s largest of the year. Celgene paid Jounce US$261 million up front (US$225 million cash and an equity investment worth US$36 million) for the option to license five Jounce assets, including its lead antibody, the preclinical inducible T-cell costimulator (ICOS) inhibitor JTX-2011. The deal’s total potential value of US$2.56 billion is nearly two-thirds of Celgene’s 2016 biobucks total.
All those biobucks dwarfed alliances’ up-front payments, which fell both on an absolute basis and as a percentage of potential deal value in 2016. Up-fronts as a percentage of total potential deal value fell to roughly 6%, a decade-long low-water mark. It wasn’t just that biobucks outpaced prior years’ totals: only US$3.5 billion was committed in up-front alliance payments in 2016, a steep fall from more than US$6 billion the prior year.
In 2016, only six deals featured up-front payments of US$200 million or more. In 2015, there were 12 such deals. In fact, there were nine deals in 2015 with up-front payments of US$300 million or more — all of which surpassed 2016’s largest up-front of US$265 million, paid to Akebia Therapeutics by the Japanese pharma Otsuka Pharmaceutical.
Otsuka’s 2016-leading down payment secured US co-development and co-marketing rights to Akebia’s Phase 3 vadadustat, an oral hypoxia-inducible factor (HIF) stabilizer for anemia associated with chronic kidney disease. But even the most impressive up-front of 2016 comes with an asterisk: of the US$265 million committed by Otsuka, only US$125 million is a cash payment. The rest is committed research funding for the drug candidate’s two ongoing Phase 3 studies. If vadadustat hits its regulatory and sales goals, the deal could be worth more than US$1 billion to Akebia.
The boon in biobucks is largely attributable to bulging commercial milestones for higher-risk projects that may never escape clinical trials — or even reach the clinic in the first place.
Beyond borders Biotechnology report 2017 85
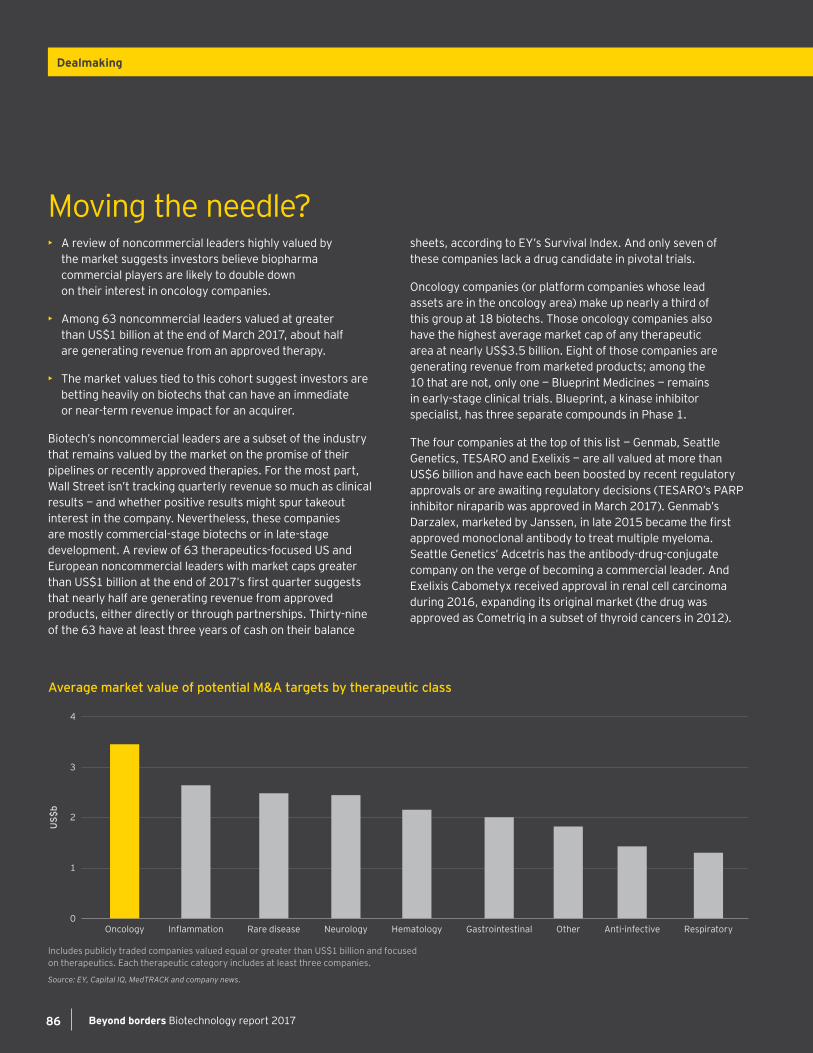
• A review of noncommercial leaders highly valued by the market suggests investors believe biopharma commercial players are likely to double down on their interest in oncology companies.
• Among 63 noncommercial leaders valued at greater than US$1 billion at the end of March 2017, about half are generating revenue from an approved therapy.
• The market values tied to this cohort suggest investors are betting heavily on biotechs that can have an immediate or near-term revenue impact for an acquirer.
Biotech’s noncommercial leaders are a subset of the industry that remains valued by the market on the promise of their pipelines or recently approved therapies. For the most part, Wall Street isn’t tracking quarterly revenue so much as clinical results — and whether positive results might spur takeout interest in the company. Nevertheless, these companies are mostly commercial-stage biotechs or in late-stage development. A review of 63 therapeutics-focused US and European noncommercial leaders with market caps greater than US$1 billion at the end of 2017’s first quarter suggests that nearly half are generating revenue from approved products, either directly or through partnerships. Thirty-nine of the 63 have at least three years of cash on their balance
sheets, according to EY’s Survival Index. And only seven of these companies lack a drug candidate in pivotal trials.
Oncology companies (or platform companies whose lead assets are in the oncology area) make up nearly a third of this group at 18 biotechs. Those oncology companies also have the highest average market cap of any therapeutic area at nearly US$3.5 billion. Eight of those companies are generating revenue from marketed products; among the 10 that are not, only one — Blueprint Medicines — remains in early-stage clinical trials. Blueprint, a kinase inhibitor specialist, has three separate compounds in Phase 1.
The four companies at the top of this list — Genmab, Seattle Genetics, TESARO and Exelixis — are all valued at more than US$6 billion and have each been boosted by recent regulatory approvals or are awaiting regulatory decisions (TESARO’s PARP inhibitor niraparib was approved in March 2017). Genmab’s Darzalex, marketed by Janssen, in late 2015 became the first approved monoclonal antibody to treat multiple myeloma. Seattle Genetics’ Adcetris has the antibody-drug-conjugate company on the verge of becoming a commercial leader. And Exelixis Cabometyx received approval in renal cell carcinoma during 2016, expanding its original market (the drug was approved as Cometriq in a subset of thyroid cancers in 2012).
Moving the needle?
Includes publicly traded companies valued equal or greater than US$1 billion and focused on therapeutics. Each therapeutic category includes at least three companies.
Source: EY, Capital IQ, MedTRACK and company news.
Average market value of potential M&A targets by therapeutic class
US$
b
4
3
0
1
2
Oncology Inflammation Rare disease Neurology Hematology Gastrointestinal Other Anti-infective Respiratory
Beyond borders Biotechnology report 201786
Dealmaking

Beyond borders Biotechnology report 2017 87
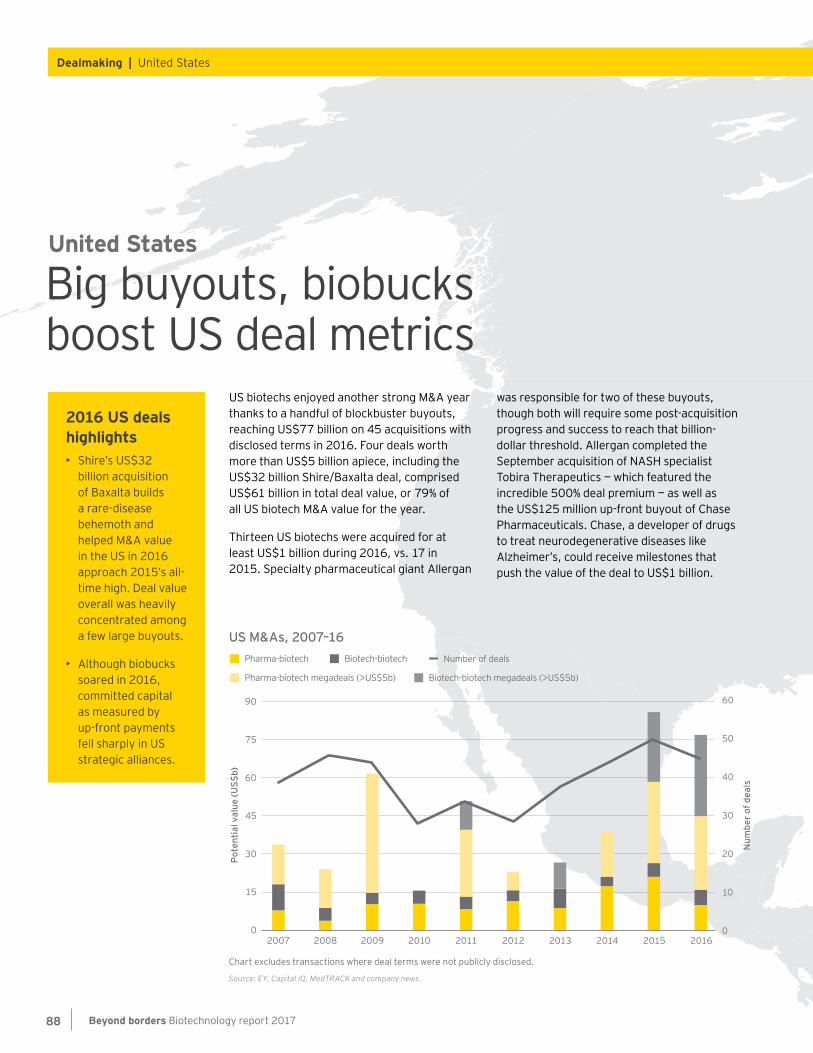
US biotechs enjoyed another strong M&A year thanks to a handful of blockbuster buyouts, reaching US$77 billion on 45 acquisitions with disclosed terms in 2016. Four deals worth more than US$5 billion apiece, including the US$32 billion Shire/Baxalta deal, comprised US$61 billion in total deal value, or 79% of all US biotech M&A value for the year.
Thirteen US biotechs were acquired for at least US$1 billion during 2016, vs. 17 in 2015. Specialty pharmaceutical giant Allergan
was responsible for two of these buyouts, though both will require some post-acquisition progress and success to reach that billion-dollar threshold. Allergan completed the September acquisition of NASH specialist Tobira Therapeutics — which featured the incredible 500% deal premium — as well as the US$125 million up-front buyout of Chase Pharmaceuticals. Chase, a developer of drugs to treat neurodegenerative diseases like Alzheimer’s, could receive milestones that push the value of the deal to US$1 billion.
Big buyouts, biobucks boost US deal metrics
United States
2016 US deals highlights• Shire’s US$32
billion acquisition of Baxalta builds a rare-disease behemoth and helped M&A value in the US in 2016 approach 2015’s all-time high. Deal value overall was heavily concentrated among a few large buyouts.
• Although biobucks soared in 2016, committed capital as measured by up-front payments fell sharply in US strategic alliances.
Chart excludes transactions where deal terms were not publicly disclosed.
Source: EY, Capital IQ, MedTRACK and company news.
US M&As, 2007–16
Pote
ntia
l val
ue (U
S$b)
Num
ber o
f dea
ls
60
50
40
30
20
10
0
90
30
15
0
60
45
75
Number of dealsPharma-biotech Biotech-biotech
Pharma-biotech megadeals (>US$5b) Biotech-biotech megadeals (>US$5b)
2007 2008 2009 2010 2011 2012 2013 2014 2015 2016
Beyond borders Biotechnology report 201788
Dealmaking | United States
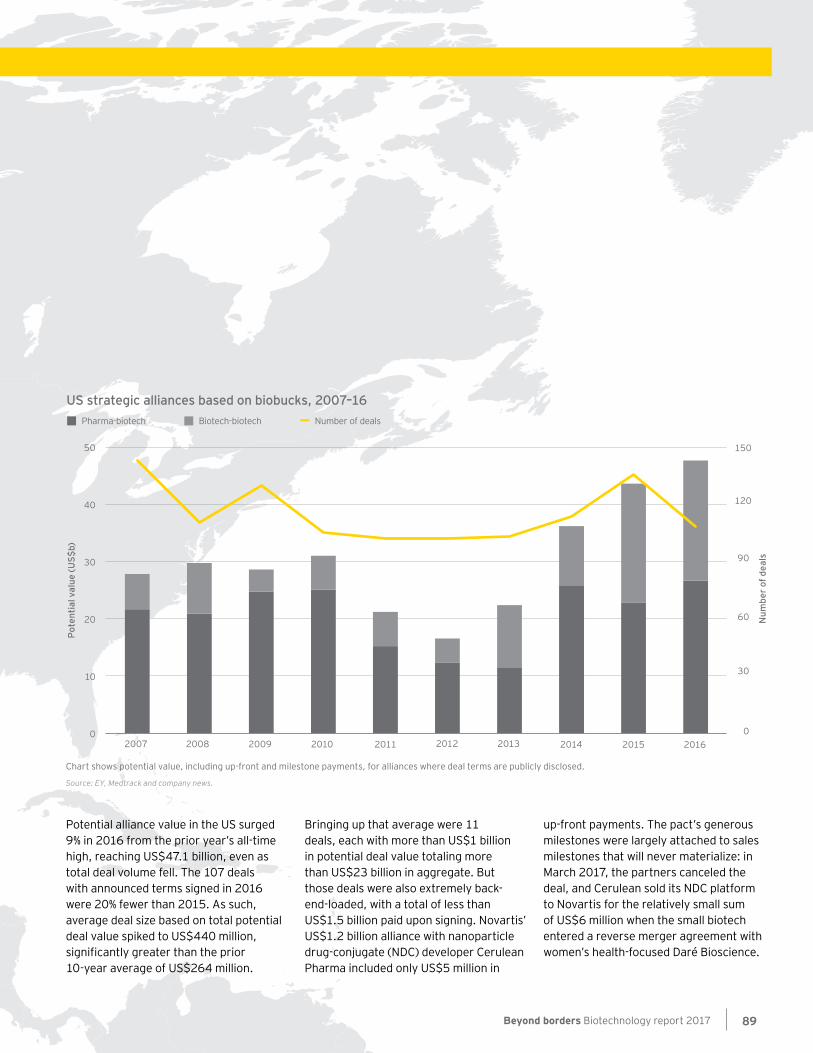
Potential alliance value in the US surged 9% in 2016 from the prior year’s all-time high, reaching US$47.1 billion, even as total deal volume fell. The 107 deals with announced terms signed in 2016 were 20% fewer than 2015. As such, average deal size based on total potential deal value spiked to US$440 million, significantly greater than the prior 10-year average of US$264 million.
Bringing up that average were 11 deals, each with more than US$1 billion in potential deal value totaling more than US$23 billion in aggregate. But those deals were also extremely back-end-loaded, with a total of less than US$1.5 billion paid upon signing. Novartis’ US$1.2 billion alliance with nanoparticle drug-conjugate (NDC) developer Cerulean Pharma included only US$5 million in
up-front payments. The pact’s generous milestones were largely attached to sales milestones that will never materialize: in March 2017, the partners canceled the deal, and Cerulean sold its NDC platform to Novartis for the relatively small sum of US$6 million when the small biotech entered a reverse merger agreement with women’s health-focused Daré Bioscience.
US strategic alliances based on biobucks, 2007–16
Chart shows potential value, including up-front and milestone payments, for alliances where deal terms are publicly disclosed.
Source: EY, Medtrack and company news.
Pote
ntia
l val
ue (U
S$b)
Num
ber o
f dea
ls
50
0
20
40
30
10
Number of dealsPharma-biotech Biotech-biotech
2007 2008 2009 2010 2011 2012 2013 2014 2015 2016
150
0
60
120
90
30
Beyond borders Biotechnology report 2017 89
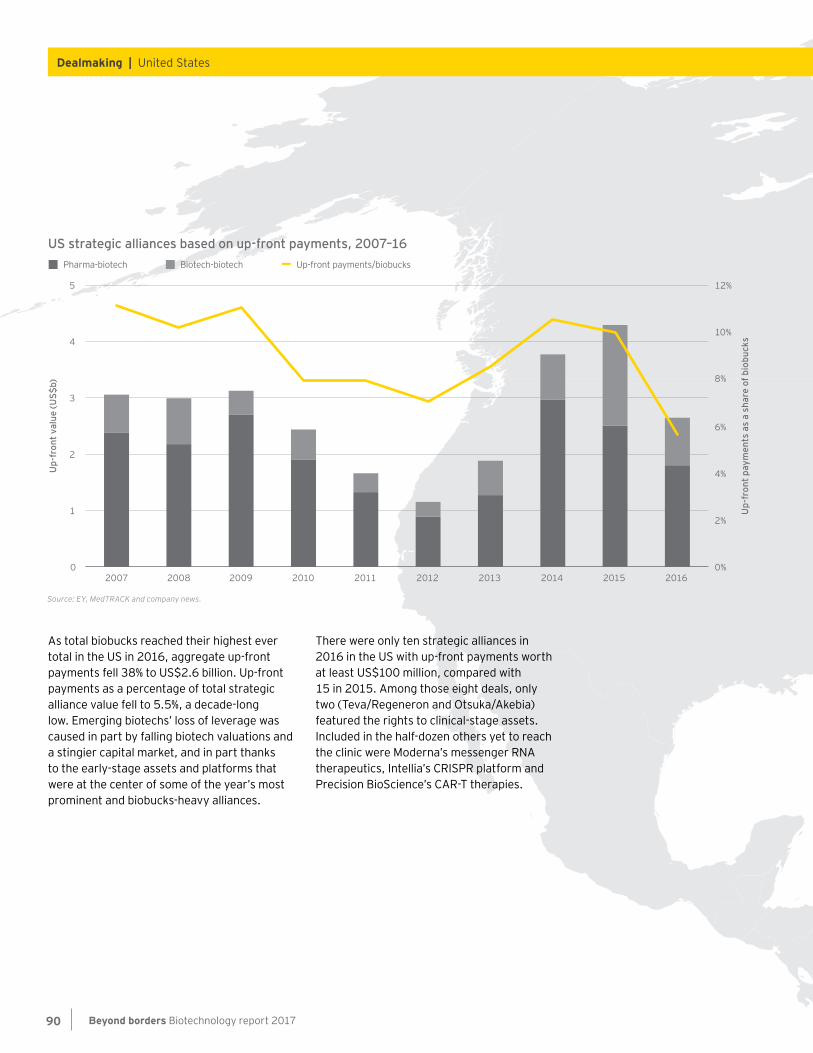
As total biobucks reached their highest ever total in the US in 2016, aggregate up-front payments fell 38% to US$2.6 billion. Up-front payments as a percentage of total strategic alliance value fell to 5.5%, a decade-long low. Emerging biotechs’ loss of leverage was caused in part by falling biotech valuations and a stingier capital market, and in part thanks to the early-stage assets and platforms that were at the center of some of the year’s most prominent and biobucks-heavy alliances.
There were only ten strategic alliances in 2016 in the US with up-front payments worth at least US$100 million, compared with 15 in 2015. Among those eight deals, only two (Teva/Regeneron and Otsuka/Akebia) featured the rights to clinical-stage assets. Included in the half-dozen others yet to reach the clinic were Moderna’s messenger RNA therapeutics, Intellia’s CRISPR platform and Precision BioScience’s CAR-T therapies.
US strategic alliances based on up-front payments, 2007–16
Source: EY, MedTRACK and company news.
Up-
fron
t val
ue (U
S$b)
Up-
fron
t pay
men
ts a
s a
shar
e of
bio
buck
s
5
0
2
3
4
3
1
Up-front payments/biobucksPharma-biotech Biotech-biotech
2007 2008 2009 2010 2011 2012 2013 2014 2015 2016
10%
12%
0%
4%
8%
6%
2%
Beyond borders Biotechnology report 201790
Dealmaking | United States

Beyond borders Biotechnology report 2017 91
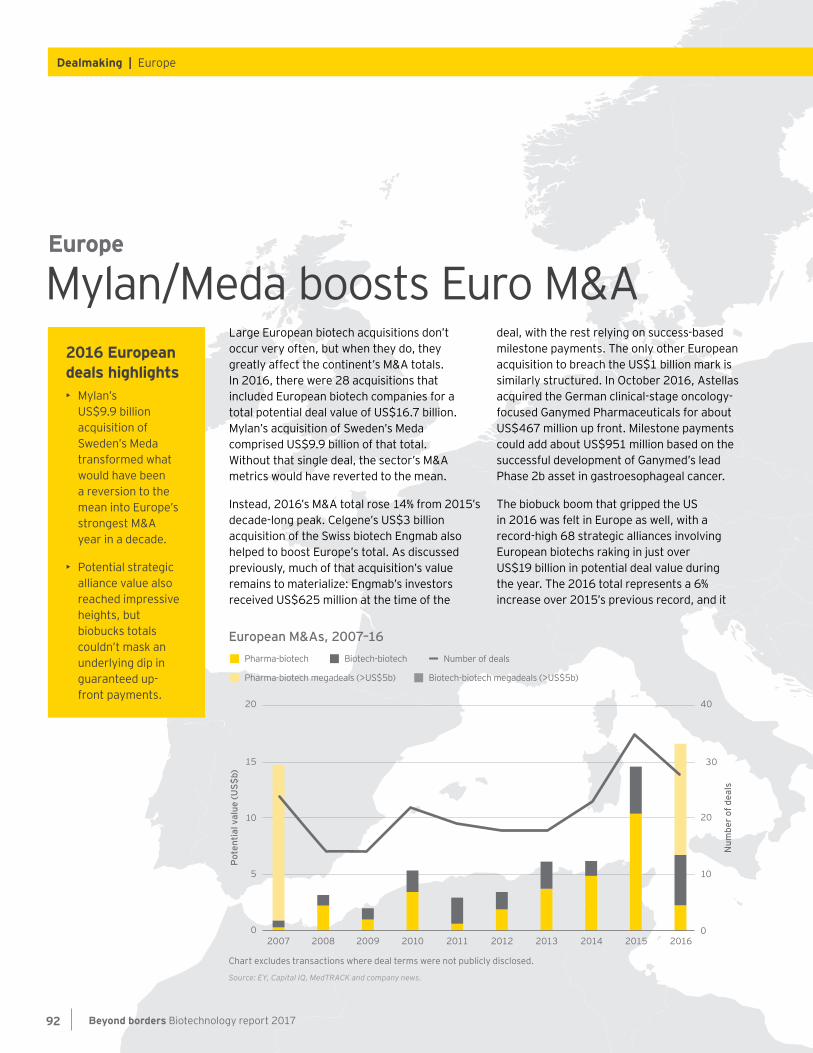
Large European biotech acquisitions don’t occur very often, but when they do, they greatly affect the continent’s M&A totals. In 2016, there were 28 acquisitions that included European biotech companies for a total potential deal value of US$16.7 billion. Mylan’s acquisition of Sweden’s Meda comprised US$9.9 billion of that total. Without that single deal, the sector’s M&A metrics would have reverted to the mean.
Instead, 2016’s M&A total rose 14% from 2015’s decade-long peak. Celgene’s US$3 billion acquisition of the Swiss biotech Engmab also helped to boost Europe’s total. As discussed previously, much of that acquisition’s value remains to materialize: Engmab’s investors received US$625 million at the time of the
deal, with the rest relying on success-based milestone payments. The only other European acquisition to breach the US$1 billion mark is similarly structured. In October 2016, Astellas acquired the German clinical-stage oncology-focused Ganymed Pharmaceuticals for about US$467 million up front. Milestone payments could add about US$951 million based on the successful development of Ganymed’s lead Phase 2b asset in gastroesophageal cancer.
The biobuck boom that gripped the US in 2016 was felt in Europe as well, with a record-high 68 strategic alliances involving European biotechs raking in just over US$19 billion in potential deal value during the year. The 2016 total represents a 6% increase over 2015’s previous record, and it
Mylan/Meda boosts Euro M&AEurope
2016 European deals highlights• Mylan’s
US$9.9 billion acquisition of Sweden’s Meda transformed what would have been a reversion to the mean into Europe’s strongest M&A year in a decade.
• Potential strategic alliance value also reached impressive heights, but biobucks totals couldn’t mask an underlying dip in guaranteed up-front payments.
Chart excludes transactions where deal terms were not publicly disclosed.
Source: EY, Capital IQ, MedTRACK and company news.
European M&As, 2007–16
Pote
ntia
l val
ue (U
S$b)
Num
ber o
f dea
ls
40
30
20
10
0
20
5
0
10
15
2007 2008 2009 2010 2011 2012 2013 2014 2015 2016
Number of dealsPharma-biotech Biotech-biotech
Pharma-biotech megadeals (>US$5b) Biotech-biotech megadeals (>US$5b)
Beyond borders Biotechnology report 201792
Dealmaking | Europe
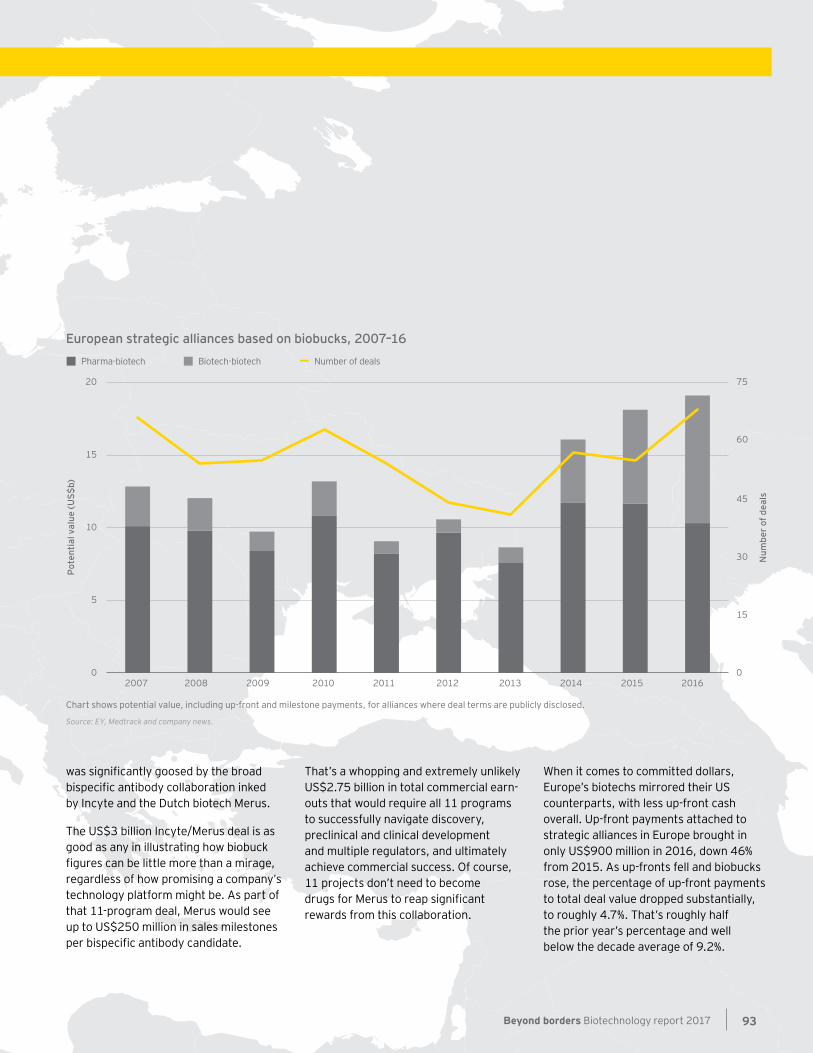
was significantly goosed by the broad bispecific antibody collaboration inked by Incyte and the Dutch biotech Merus.
The US$3 billion Incyte/Merus deal is as good as any in illustrating how biobuck figures can be little more than a mirage, regardless of how promising a company’s technology platform might be. As part of that 11-program deal, Merus would see up to US$250 million in sales milestones per bispecific antibody candidate.
That’s a whopping and extremely unlikely US$2.75 billion in total commercial earn-outs that would require all 11 programs to successfully navigate discovery, preclinical and clinical development and multiple regulators, and ultimately achieve commercial success. Of course, 11 projects don’t need to become drugs for Merus to reap significant rewards from this collaboration.
When it comes to committed dollars, Europe’s biotechs mirrored their US counterparts, with less up-front cash overall. Up-front payments attached to strategic alliances in Europe brought in only US$900 million in 2016, down 46% from 2015. As up-fronts fell and biobucks rose, the percentage of up-front payments to total deal value dropped substantially, to roughly 4.7%. That’s roughly half the prior year’s percentage and well below the decade average of 9.2%.
European strategic alliances based on biobucks, 2007–16
Pote
ntia
l val
ue (U
S$b)
Num
ber o
f dea
ls
20
0
10
15
5
Number of dealsPharma-biotech Biotech-biotech
2007 2008 2009 2010 2011 2012 2013 2014 2015 2016
75
0
30
60
45
15
Chart shows potential value, including up-front and milestone payments, for alliances where deal terms are publicly disclosed.
Source: EY, Medtrack and company news.
Beyond borders Biotechnology report 2017 93
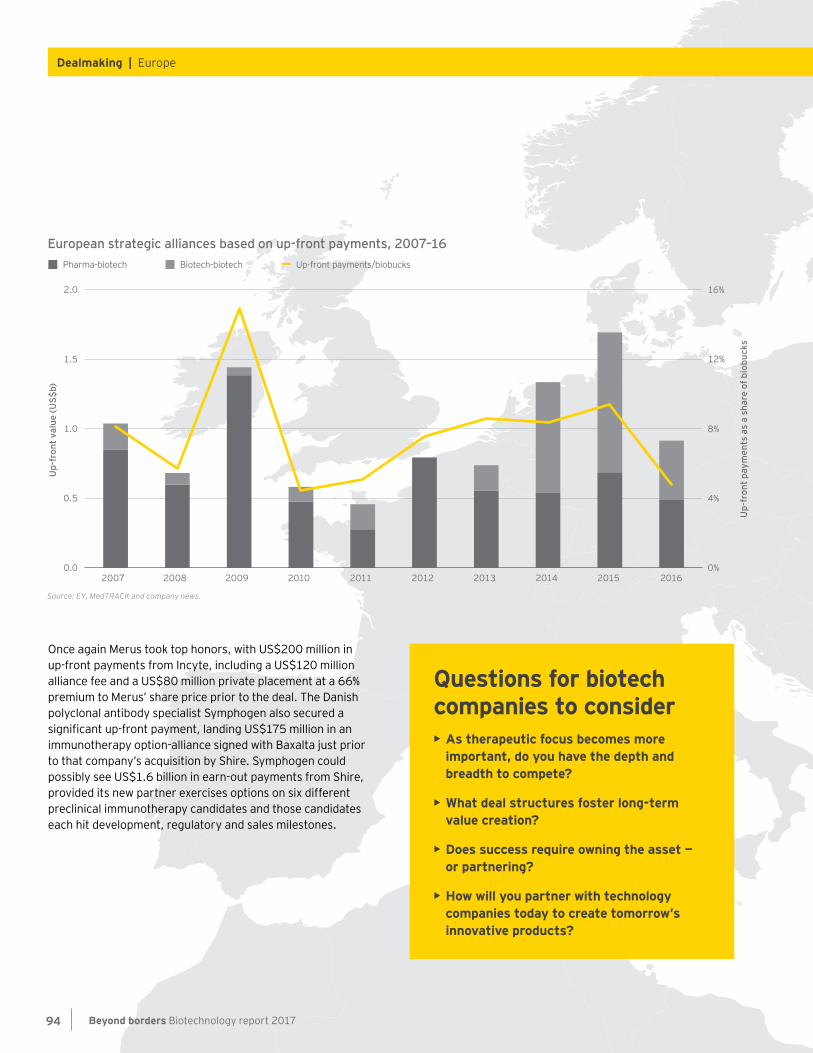
Once again Merus took top honors, with US$200 million in up-front payments from Incyte, including a US$120 million alliance fee and a US$80 million private placement at a 66% premium to Merus’ share price prior to the deal. The Danish polyclonal antibody specialist Symphogen also secured a significant up-front payment, landing US$175 million in an immunotherapy option-alliance signed with Baxalta just prior to that company’s acquisition by Shire. Symphogen could possibly see US$1.6 billion in earn-out payments from Shire, provided its new partner exercises options on six different preclinical immunotherapy candidates and those candidates each hit development, regulatory and sales milestones.
Questions for biotech companies to consider• As therapeutic focus becomes more
important, do you have the depth and breadth to compete?
• What deal structures foster long-term value creation?
• Does success require owning the asset — or partnering?
• How will you partner with technology companies today to create tomorrow’s innovative products?
Source: EY, MedTRACK and company news.
Up-
fron
t val
ue (U
S$b)
Up-
fron
t pay
men
ts a
s a
shar
e of
bio
buck
s
12%
16%
0.0 0%
0.5 4%
1.0
2.0
1.5
8%
Up-front payments/biobucksPharma-biotech Biotech-biotech
2007 2008 2009 2010 2011 2012 2013 2014 2015 2016
European strategic alliances based on up-front payments, 2007–16
Beyond borders Biotechnology report 201794
Dealmaking | Europe
AcknowledgmentsProject leadershipGlen Giovannetti, EY Global Biotechnology Leader, provided strategic vision for this report and brought his years of experience to the analysis of industry trends.
Chris Morrison, Senior Contributing Writer, was the report’s lead author. He assisted with the development of the overall storyline, and wrote the Industry performance and Year in review articles, as well as several EY and guest perspectives.
Melanie Senior, Contributing Writer, helped develop several of the EY and guest perspectives, as well as the overall themes in this year’s report. Ellen Licking, EY Life Sciences Senior Analyst, and Susan Garfield, Advisory Principal, also contributed articles to the report.
Jason Hillenbach was the report’s project manager, with direct responsibility for all data and trend analysis, research and the overall quality of this publication.
We would like to recognize the contributions to the editorial content made by the following individuals: Pamela Spence, Siegfried Bialojan and Jürg Zürcher.
Data analysisTanya Mehra organized all of the research, collection and analysis of the report’s data. She was assisted by Rajni Sadana, Arushi Agrawal and Ritvik Sultania.
Kim Medland, Tanya Mehra, Sue Lavin Jones and Jason Hillenbach conducted fact-checking and quality review of the publication’s numbers.
Editorial assistanceKevin Daniels was the report’s copy editor. Troy Smith was the report’s proofreader. Their patience, hard work and attention to detail were unparalleled. This was the first Beyond borders report in which they have been involved.
DesignMike Fine was the lead designer for this project. This publication would not look the way it does without his creativity.
Public relations and marketingPublic relations and marketing efforts related to the report and its launch were led by Sue Lavin Jones and Laura Powers.
Beyond borders Biotechnology report 2017 95
Data exhibit indexGrowth in established biotechnology centers (US$b) .................................................................................................................... 5
FDA product approvals, 1996–2016 ............................................................................................................................................. 6
Innovation capital raised by leading biotech clusters, 2016 ........................................................................................................... 7
US and EU public company revenues .......................................................................................................................................... 32
Growth in established biotechnology centers (US$b) .................................................................................................................. 32
EY survival index, 2015–16 ........................................................................................................................................................ 33
US and Europe biotech commercial leaders cash usage, 2010–16 ............................................................................................... 34
US biotechnology at a glance (US$b) .......................................................................................................................................... 36
US biotechnology commercial leaders and other companies (US$b) ............................................................................................ 37
US public company revenues ..................................................................................................................................................... 38
US commercial leaders, 2011–16 ............................................................................................................................................... 39
Top US therapeutics companies without commercial products by market cap, 31 March 2017, US$m ........................................... 40
European biotechnology at a glance, (US$b) .............................................................................................................................. 40
US public biotech companies with market cap greater than US$500m..........................................................................................41
Top 10 changes in US market capitalizations, 2012–16 (US$m) ....................................................................................................41
US public biotechs underperformed versus the leading indices.................................................................................................... 42
European biotechnology at a glance (US$b) ............................................................................................................................... 44
European public company revenues ........................................................................................................................................... 45
EU commercial leaders, 2011–16 ............................................................................................................................................... 45
EU public biotech companies with market cap greater than US$500m......................................................................................... 46
Top 10 changes in European market capitalizations, 2012–16 (US$m)......................................................................................... 46
European biotechs surpassed the leading indices ....................................................................................................................... 47
Capital raised in the US and Europe by year ................................................................................................................................ 50
Innovation capital in the US and Europe by year ..........................................................................................................................51
US and European early–stage venture investment ...................................................................................................................... 52
US and European venture investment by round .......................................................................................................................... 53
US and European biotechnology IPOs by year ............................................................................................................................ 55
US and European biotechnology IPO pricing by year ................................................................................................................... 55
US biotechnology financings by year .......................................................................................................................................... 56
Innovation capital in the US by year ........................................................................................................................................... 57
Beyond borders Biotechnology report 201796
Innovation capital raised by leading US regions, 2016 ................................................................................................................ 58
US venture capital by year ......................................................................................................................................................... 59
Top US venture financings, 2016 ............................................................................................................................................... 60
US biotechnology IPOs by year .................................................................................................................................................. 61
US biotechnology IPOs, 2016 .................................................................................................................................................... 62
US biotechnology IPO pricing by quarter, 2014–2016 ................................................................................................................. 63
European biotechnology financings by year ............................................................................................................................... 64
European innovation capital by year .......................................................................................................................................... 65
Innovation capital raised by leading European countries, 2016 ................................................................................................... 66
European venture capital by year ............................................................................................................................................... 67
Top European venture financings, 2016 ..................................................................................................................................... 67
European biotechnology IPOs by year ........................................................................................................................................ 68
European biotechnology IPOs, 2016 .......................................................................................................................................... 69
Asia-Pacific biotechnology financings by year ............................................................................................................................ 70
Top Asia-Pacific IPOs, 2016 ....................................................................................................................................................... 71
Top Asia-Pacific venture financings, 2016 .................................................................................................................................. 72
US and European M&As, 2007–16 .............................................................................................................................................. 80
Selected M&As, 2016 ................................................................................................................................................................ 81
M&As with big earnouts, 2016 ................................................................................................................................................... 82
Average M&A premium, 2011–16 ............................................................................................................................................... 82
Alliances with big up-front payments, 2016 ................................................................................................................................ 83
US and European strategic alliances based on biobucks, 2007–16 ............................................................................................... 84
Average market value of potential M&A targets by therapeutic class ........................................................................................... 86
US M&As, 2007–16 ................................................................................................................................................................... 88
US strategic alliances based on biobucks, 2007–16 ..................................................................................................................... 89
US strategic alliances based on up-front payments, 2007–16 ...................................................................................................... 90
European M&As, 2007–16 ......................................................................................................................................................... 92
European strategic alliances based on biobucks, 2007–16 .......................................................................................................... 93
European strategic alliances based on up-front payments, 2007–16 ............................................................................................ 94
Beyond borders Biotechnology report 2017 97
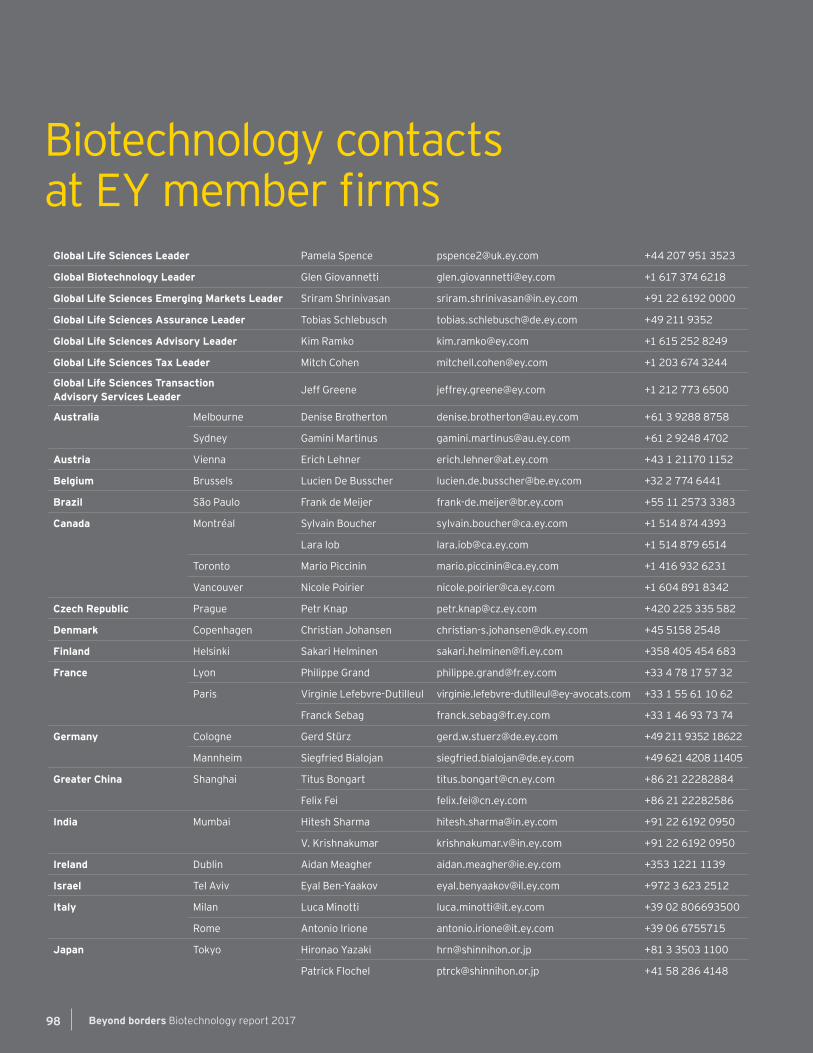
Global Life Sciences Leader Pamela Spence [email protected] +44 207 951 3523
Global Biotechnology Leader Glen Giovannetti [email protected] +1 617 374 6218
Global Life Sciences Emerging Markets Leader Sriram Shrinivasan [email protected] +91 22 6192 0000
Global Life Sciences Assurance Leader Tobias Schlebusch [email protected] +49 211 9352
Global Life Sciences Advisory Leader Kim Ramko [email protected] +1 615 252 8249
Global Life Sciences Tax Leader Mitch Cohen [email protected] +1 203 674 3244
Global Life Sciences Transaction Advisory Services Leader Jeff Greene [email protected] +1 212 773 6500
Australia Melbourne Denise Brotherton [email protected] +61 3 9288 8758
Sydney Gamini Martinus [email protected] +61 2 9248 4702
Austria Vienna Erich Lehner [email protected] +43 1 21170 1152
Belgium Brussels Lucien De Busscher [email protected] +32 2 774 6441
Brazil São Paulo Frank de Meijer [email protected] +55 11 2573 3383
Canada Montréal Sylvain Boucher [email protected] +1 514 874 4393
Lara Iob [email protected] +1 514 879 6514
Toronto Mario Piccinin [email protected] +1 416 932 6231
Vancouver Nicole Poirier [email protected] +1 604 891 8342
Czech Republic Prague Petr Knap [email protected] +420 225 335 582
Denmark Copenhagen Christian Johansen [email protected] +45 5158 2548
Finland Helsinki Sakari Helminen [email protected] +358 405 454 683
France Lyon Philippe Grand [email protected] +33 4 78 17 57 32
Paris Virginie Lefebvre-Dutilleul [email protected] +33 1 55 61 10 62
Franck Sebag [email protected] +33 1 46 93 73 74
Germany Cologne Gerd Stürz [email protected] +49 211 9352 18622
Mannheim Siegfried Bialojan [email protected] +49 621 4208 11405
Greater China Shanghai Titus Bongart [email protected] +86 21 22282884
Felix Fei [email protected] +86 21 22282586
India Mumbai Hitesh Sharma [email protected] +91 22 6192 0950
V. Krishnakumar [email protected] +91 22 6192 0950
Ireland Dublin Aidan Meagher [email protected] +353 1221 1139
Israel Tel Aviv Eyal Ben-Yaakov [email protected] +972 3 623 2512
Italy Milan Luca Minotti [email protected] +39 02 806693500
Rome Antonio Irione [email protected] +39 06 6755715
Japan Tokyo Hironao Yazaki [email protected] +81 3 3503 1100
Patrick Flochel [email protected] +41 58 286 4148
Biotechnology contacts at EY member firms
Beyond borders Biotechnology report 201798
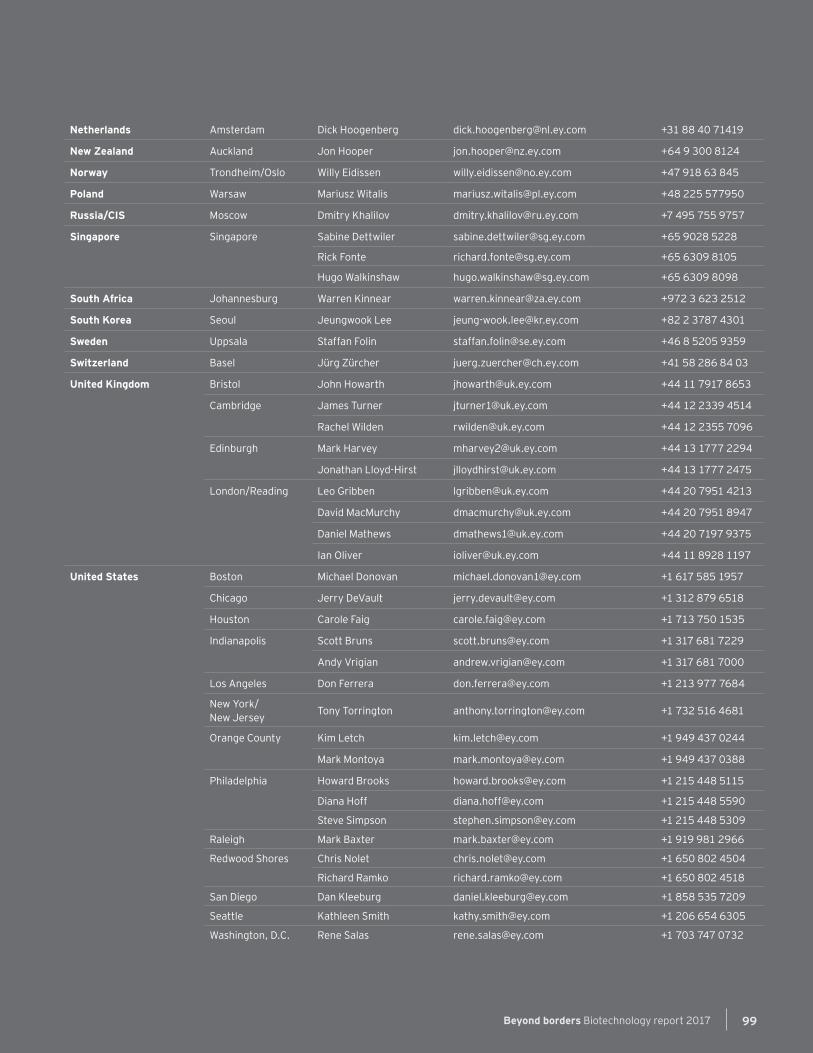
Netherlands Amsterdam Dick Hoogenberg [email protected] +31 88 40 71419
New Zealand Auckland Jon Hooper [email protected] +64 9 300 8124
Norway Trondheim/Oslo Willy Eidissen [email protected] +47 918 63 845
Poland Warsaw Mariusz Witalis [email protected] +48 225 577950
Russia/CIS Moscow Dmitry Khalilov [email protected] +7 495 755 9757
Singapore Singapore Sabine Dettwiler [email protected] +65 9028 5228
Rick Fonte [email protected] +65 6309 8105
Hugo Walkinshaw [email protected] +65 6309 8098
South Africa Johannesburg Warren Kinnear [email protected] +972 3 623 2512
South Korea Seoul Jeungwook Lee [email protected] +82 2 3787 4301
Sweden Uppsala Staffan Folin [email protected] +46 8 5205 9359
Switzerland Basel Jürg Zürcher [email protected] +41 58 286 84 03
United Kingdom Bristol John Howarth [email protected] +44 11 7917 8653
Cambridge James Turner [email protected] +44 12 2339 4514
Rachel Wilden [email protected] +44 12 2355 7096
Edinburgh Mark Harvey [email protected] +44 13 1777 2294
Jonathan Lloyd-Hirst [email protected] +44 13 1777 2475
London/Reading Leo Gribben [email protected] +44 20 7951 4213
David MacMurchy [email protected] +44 20 7951 8947
Daniel Mathews [email protected] +44 20 7197 9375
Ian Oliver [email protected] +44 11 8928 1197
United States Boston Michael Donovan [email protected] +1 617 585 1957
Chicago Jerry DeVault [email protected] +1 312 879 6518
Houston Carole Faig [email protected] +1 713 750 1535
Indianapolis Scott Bruns [email protected] +1 317 681 7229
Andy Vrigian [email protected] +1 317 681 7000
Los Angeles Don Ferrera [email protected] +1 213 977 7684
New York/ New Jersey Tony Torrington [email protected] +1 732 516 4681
Orange County Kim Letch [email protected] +1 949 437 0244
Mark Montoya [email protected] +1 949 437 0388
Philadelphia Howard Brooks [email protected] +1 215 448 5115
Diana Hoff [email protected] +1 215 448 5590
Steve Simpson [email protected] +1 215 448 5309
Raleigh Mark Baxter [email protected] +1 919 981 2966
Redwood Shores Chris Nolet [email protected] +1 650 802 4504
Richard Ramko [email protected] +1 650 802 4518
San Diego Dan Kleeburg [email protected] +1 858 535 7209
Seattle Kathleen Smith [email protected] +1 206 654 6305
Washington, D.C. Rene Salas [email protected] +1 703 747 0732
Beyond borders Biotechnology report 2017 99
EY | Assurance | Tax | Transactions | Advisory
About EY EY is a global leader in assurance, tax, transaction and advisory services. The insights and quality services we deliver help build trust and confidence in the capital markets and in economies the world over. We develop outstanding leaders who team to deliver on our promises to all of our stakeholders. In so doing, we play a critical role in building a better working world for our people, for our clients and for our communities.
EY refers to the global organization, and may refer to one or more, of the member firms of Ernst & Young Global Limited, each of which is a separate legal entity. Ernst & Young Global Limited, a UK company limited by guarantee, does not provide services to clients. For more information about our organization, please visit ey.com.
Ernst & Young LLP is a client-serving member firm of Ernst & Young Global Limited operating in the US.
How EY’s Global Life Sciences Sector can help your business
As populations age and chronic diseases become commonplace, health care will take an ever larger share of GDP. Scientific progress, augmented intelligence and a more empowered patient are driving changes in the delivery of health care to a personalized experience that demands health outcomes as the core metric. This is causing a power shift among traditional stakeholder groups, with new entrants (often not driven by profit) disrupting incumbents. Innovation, productivity and access to patients remain the industry’s biggest challenges. These trends challenge the capital strategy of every link in the life sciences value chain, from R&D and product supply to product launch and patient-centric operating models.
Our Global Life Sciences Sector brings together a worldwide network of 15,000 sector-focused professionals to anticipate trends, identify their implications and help our clients create competitive advantage. We can help you navigate your way forward and achieve sustainable success in the new health-outcomes-driven ecosystem.
©2017 Ernst & Young LLP. All Rights Reserved.
EYG no. 03787-174GBL CSG no. 1703-2208716 ED None
This material has been prepared for general informational purposes only and is not intended to be relied upon as accounting, tax or other professional advice. Please refer to your advisors for specific advice.
The views of the third parties set out in this publication are not necessarily the views of the global EY organization or its member firms. Moreover, they should be seen in the context of the time they were made.
ey.com