stature growth in industrializing argentina: the … international economic history congress,...
TRANSCRIPT

XIV International Economic History Congress, Helsinki 2006Session 50
Stature Growth in Industrializing Argentina:The Buenos Aires Industrial Belt 1916-1950”
Ricardo D. SalvatoreUniversidad Torcuato Di Tella
Introduction
This paper examines de evolution of average heights in the industrial belt of Buenos Airesand the city of La Plata, Argentina, between 1916 and 1950. The main idea is to test certainassertions that constitute a sort of “traditional wisdom” about this period against theevolution of workers’ biological wellbeing, measured by average heights. First, we need toexamine the validity of the proposition that workers’ welfare increased during the Peronistadministration (1946-1955) and that, conversely, their wellbeing was relatively stagnantduring the “infamous decade” (1930-1943). Second, we need to evaluate the economicrational behind internal migrants’ decision to move to the industrial districts. Did they (ortheir children) gain in nutrition and health status by moving from the interior provinces?Thirdly, we need to consider the proposition that the institutional set-up of the Peronistyears helped to reduce social inequalities.
The first section discusses the literature concerning industrialization, urbanization andinternal migrations in Argentina. The Argentine case presents a clear anomaly in the lasttwo dimensions. A process of industrialization directed towards the internal market andsubstitutive of imports emerged in a period of decline of the agrarian export-economy. Therates of urbanization accelerated during this period, largely due to mass migrations from theinterior provinces. Rather than moving toward unoccupied lands in the frontier, migrantsmoved towards the center of the nation, where the chief industrial pole was located. Unlikeother metropolis, the growth of Great Buenos Aires was characterized by theperipheralization of the working class and the central location of the middle classes.Furthermore, Argentina represents a case in which the consolidation of industrial growth inthe 1930s and 1940s, and the concentration of workers it generated, is said to haveproduced the clientele for a political movement, Peronism, characterized by its distributivesocial policies.
The second section presents the data, the regression results, and a brief discussion of theprincipal findings. While these conclusions seem tentative at this moment, the papersuggests: a) that the Buenos Aires industrial belt experienced an important increase in netnutrition during industrialization; b) that internal migrants did not encounter the “urbandissamenities” problem, for they migrated to areas that had undergone reforms in sanitationand public services; c) that the “infamous” thirties made possible a greater improvement innet nutrition than the years of Peronism (particularly with regard to the decline in

2
malnutrition), and d) that social inequality was more persistence that previously assumed.In the final section, three main questions are presented and tentative explanations areprovided.
Industrialization in Argentina
Early students of Argentine industrialization found in the 1880-1930 period an industrialsector characterized by a multitude of small workshops that did not constitute “modernindustry.” (Dorfman 1942). WWI had given local industrialists an ephemeral protection,after which European and US exporters regained their position in the Argentine market.ECLA’s “structuralist” economists argued that the true origins of industry in Argentina andother leading Latin American economies coincided with the world depression of the early1930s. The depression granted effective protection to nascent industries, particularly “lightindustries,” starting up a process of import substitution that extended later to the 1940s and1950s. (ECLA 1950; Felix 1965). Though some authors have challenged the idea of aradical rupture in the 1930s, this view remained hegemonic until quite recently.1 Recentrevisions have pushed back the origins of Argentine industrialization to the 1890s and1900s. J. Schvarzer (1996) finds in the period 1910-1930 a consolidation of the factorysystem but without much technical or social progress. The First World War provided aprotective context which made possible the substitution of imports in the food industry andstrengthened the development of older industries (such as meat-packing and sugar refining).Later, during the 1920s, investments in cotton textiles, metallurgy, and petroleum gave newdynamism to the sector. F. Rocchi (2006) goes even further, arguing that the origins ofArgentine industrialization should be looked in the second half of the 1890s. Centered inBuenos Aires city and chiefly targeting the domestic market, industry developed into “bigbusiness” in the firs decade of the twentieth century.
Rocchi contends that the industrial sector was not only crucial for the development of theinternal market but also a key dynamic force of the Argentine economy during the period1900-1930. Industry grew at 9.6 percent a year during 1903-1913, when the economy as awhole was growing at a rate of 7.7 percent. During the period 1920-1929 the manufacturingsector expanded at 4.3 percent a year, when the economy was growing at a 3.5 percent.(Rocchi 2006:87) Even though the domestic market was limited, large firms were able todevelop, rapidly mechanizing production in such distinct areas as shoe-making, tobacco,metallurgy, woolen textiles, and agricultural implements. Big industry helps to explain—argues Rocchi—why Argentina, unlike other Latin American agrarian export economies,generated a high degree of upward social mobility. For the diversity of its products, for itsinfluence in creating a national market, for its introduction of up-to-date technologies,industrialization was a success story in pre-1930 Argentina.
Industrial growth in the 1930s was rapid and based upon the substitution of imports.Industrial production grew at a rate of 16 percent a year during 1933-35 and at 5.5 percent ayear between 1935 and 1939. The share of industrial production in total consumption rose
1 Javier Villanueva (1972), for instance, showed that there was an important growth of manufacturing in the1920s.

3
from 50 percent in 1925-29 to 63 percent in the years 1930-39. (Barbero and Rocchi 2003:275) The 1930s saw a significant increase in textile manufactures, oil byproducts,metallurgy, and electric appliances and vast expansion of road construction. During theSecond World War, the process of import-substitution continued (to reach 80 percent ofconsumption), while workers’ purchasing power remained unaltered. The first years of thePeronist administration were favorable to industry, which great at 6.3 percent a year (1946-48), but afterwards, growth slowed down, rendering for the whole period 1946-55 thedisappointing rate of 3 percent annually. After 1948, the possibilities of import substitutionin light industries had been exhausted and in the early 1950s restrictions on foreigncurrency began to affect new industrial investments. (Barbero and Rocchi 2003: 277 and279)
The high degree of industrial concentration that had made industry strong before 1930began to falter in the 1930s, when small and middle-sized firms entered massively into themarket. (Goetz 1976) Between 1935 and 1954 the number of branches of industry thatexperienced de-concentration (dispersion) was two to three times the number of branchesthat experienced concentration. With expanding markets and relatively simple technologies,the new branches admitted more firms and this, in turn, generated acute competition.Significantly, the branches that experienced expansion and de-concentration were preciselythose geared to popular consumption: food, beverages, cloths, textiles, electrical appliances,and construction materials.2 Goetz’s finding about industrial de-concentration is consistentwith the proposition that, during the “easy” phase of import-substitution, industries withlow capital intensity and relatively simple technology tend to predominate. Protectionismand expanding internal markets create extra-benefits that attract new firms into thebusiness.
Thus, the industry that emerged in the 1930s and which consolidated in the 1940s was aless concentrated and more competitive industry that catered to the needs of an expandingdomestic market. In a context of an abrupt fall of international migrations, this industrialwas made possible by a massive movement of population from the interior into the capitaland its surroundings. The availability of industrial credit, starting in the mid-1940s,combined with relatively simple technologies, increased the chances that small and middle-sized firms entered the market.3 If not novel, Peronist industrialization is said to be markedby a pro-labor attitude, not seen in previous administrations.4
Internal Migration and Urbanization
2 The Peronist period (1946-54) did nothing but acentúate this tendency towards industrial de-concentration.Some industries even reduced its average size. Peronist industry was more competitive.3 Industrial credit privileged those branches of industry more labor-intensive and with simpler technologies,although secondarily supporting the growth of such dynamic sectors as metallurgy. (Villarruel 1988)4 Soon after assuming as Secretary of Labor and Prevision (end of 1943), Perón granted wage increases tounions, mediated in conflicts between workers and capitalists, and granted subsidies to create union pensionfunds. Later, during his presidency (1946-1955) Perón definitely favored organized labor in grantingconcessions about wages, pensions, and labor rights. (Gerchunoff and Llach 2005: 166-167)

4
Crucial to the process of industrialization were the twin processes of urbanization andinternal migrations. The concentration of population in large cities (rural-urban migrations)together with the massive migration of provincianos to Buenos Aires and its adjacent citiesmade possible a continuous supply of labor for industrial growth, at a time wheninternational migrations ceased to be an important component of demographic growth.Thanks to internal migrations, by 1947 the Great Buenos Aires—a metropolitan areaincluding Buenos Aires and its 18 adjacent cities or boroughs—concentrated 29 percent ofArgentina’s population. Half of the population of the GBA had been born in otherprovinces. (Germani 1955: 57-58) The provinces of the northwest and center contributedmost to these massive migrations involving 25 percent of the country’s population.5
Lattes and Lattes (1969) studied the time trajectory of internal migrations. They found thatthe migrants of the period 1914-1947 flowed towards Buenos Aires but also towardsadjacent (richer) provinces. In the period 1947-1960, by contrast, most provincial migrantsconverged to a single destination: the Great Buenos Aires. The migratory movementbecame almost exclusively centripetal. This meant that more migrants came from distantprovinces and towns than before. And it is likely that in this second period, more migrantstraveled with their families, as the masculinity rates among migrants were much lower thanat the beginning of the century. (Lattes and Lattes 1969: chapters 7 and 8).
Internal migrations began to replace international migrations after 1914. But it was only inthe mid-thirties, in the midst of import-substituting industrialization, when internalmigrations became truly massive. Rough estimates made by Germani provide a measure ofmagnitude for this change. The flow of migrants rose from 8,000 a year in 1914-36 to72,000 a year in 1936-43, to 117,000 a year in 1943-1947.6 (Germani 1954: 75)
Internal migrations contributed to an on-going process of urbanization. Between 1914 and1947, the country’s urban population (>2,000) increased from 53 to 62 percent. Peoplemoved to large cities. Whereas in 1914 only three cities were larger than 100,000inhabitants (Buenos Aires, Córdoba and Rosario), in 1947 other 5 cities were added to thislist (Mar del Plata, Bahía Blanca, Santa Fé, La Plata and Tucumán); and this is notincluding the new urban centers that comprised the Buenos Aires conurbano. 40 percent ofArgentina’s population resided in cities over 100,000 inhabitants by 1947 (Germani1955:68). Thanks to the massive migrations from the interior, the population of GreatBuenos Aires went from 1.9 million in 1914 to 3.4 million in 1936 to 4.6 million in 1947 to5.2 million in 1952. (Germani 1955:74)
The formation of Great Buenos Aires entailed a re-accommodation of social classes in theterritory.7 For the period 1880-1910, J. Scobie documented how the immigrant working-
5 Of the 3.4 milion Argentines who in 1947 were living outside of their province of origin, half resided in theGreat Buenos Aires, other 28 percent in the littoral or Pampa region, and the rest was distributed among otherregions of the country. Germani 1955: 61)6 These estimates have been taken as conclusive. J.C. Torre (2000) affirms, based on these estimates, that theprocess of internal migration took-off in 1936.7 To Germani, the process of urbanization that ensued after 1930 was propelled by industrialization. Internalmigrations were thus part of a general process of modernization that anticipated the formation of a “masssociety” with new modes of political interaction.
5
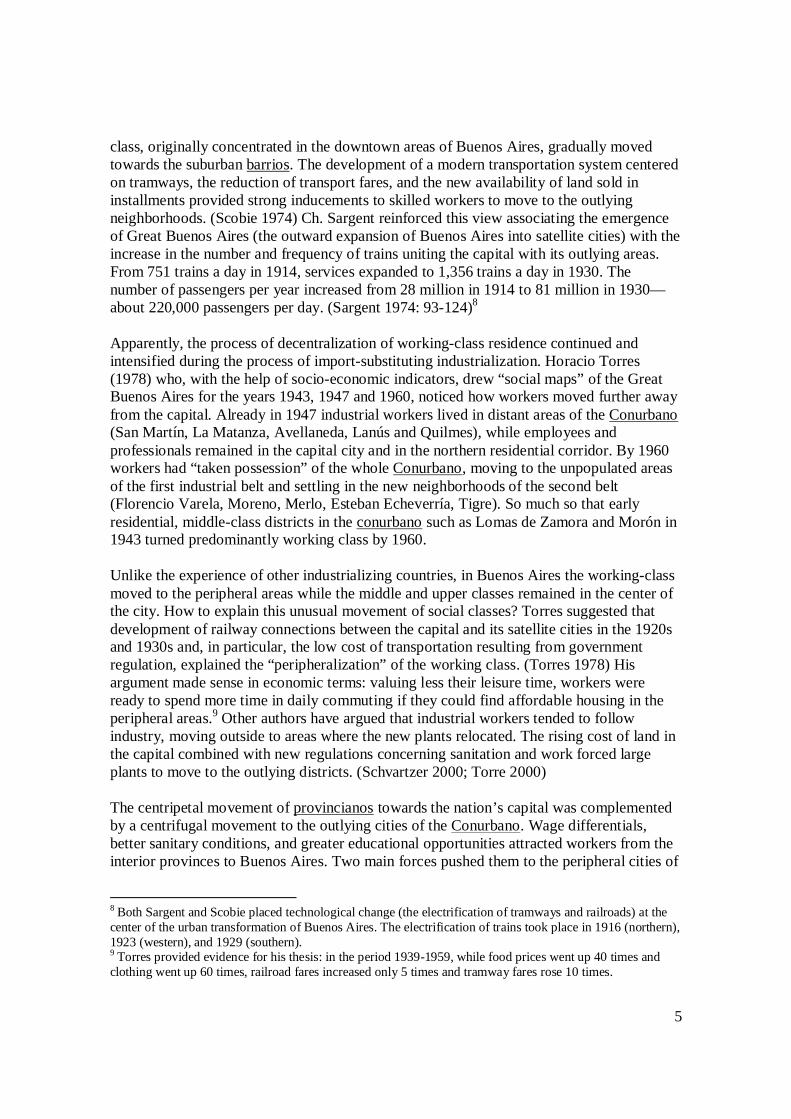
class, originally concentrated in the downtown areas of Buenos Aires, gradually movedtowards the suburban barrios. The development of a modern transportation system centeredon tramways, the reduction of transport fares, and the new availability of land sold ininstallments provided strong inducements to skilled workers to move to the outlyingneighborhoods. (Scobie 1974) Ch. Sargent reinforced this view associating the emergenceof Great Buenos Aires (the outward expansion of Buenos Aires into satellite cities) with theincrease in the number and frequency of trains uniting the capital with its outlying areas.From 751 trains a day in 1914, services expanded to 1,356 trains a day in 1930. Thenumber of passengers per year increased from 28 million in 1914 to 81 million in 1930—about 220,000 passengers per day. (Sargent 1974: 93-124)8
Apparently, the process of decentralization of working-class residence continued andintensified during the process of import-substituting industrialization. Horacio Torres(1978) who, with the help of socio-economic indicators, drew “social maps” of the GreatBuenos Aires for the years 1943, 1947 and 1960, noticed how workers moved further awayfrom the capital. Already in 1947 industrial workers lived in distant areas of the Conurbano(San Martín, La Matanza, Avellaneda, Lanús and Quilmes), while employees andprofessionals remained in the capital city and in the northern residential corridor. By 1960workers had “taken possession” of the whole Conurbano, moving to the unpopulated areasof the first industrial belt and settling in the new neighborhoods of the second belt(Florencio Varela, Moreno, Merlo, Esteban Echeverría, Tigre). So much so that earlyresidential, middle-class districts in the conurbano such as Lomas de Zamora and Morón in1943 turned predominantly working class by 1960.
Unlike the experience of other industrializing countries, in Buenos Aires the working-classmoved to the peripheral areas while the middle and upper classes remained in the center ofthe city. How to explain this unusual movement of social classes? Torres suggested thatdevelopment of railway connections between the capital and its satellite cities in the 1920sand 1930s and, in particular, the low cost of transportation resulting from governmentregulation, explained the “peripheralization” of the working class. (Torres 1978) Hisargument made sense in economic terms: valuing less their leisure time, workers wereready to spend more time in daily commuting if they could find affordable housing in theperipheral areas.9 Other authors have argued that industrial workers tended to followindustry, moving outside to areas where the new plants relocated. The rising cost of land inthe capital combined with new regulations concerning sanitation and work forced largeplants to move to the outlying districts. (Schvartzer 2000; Torre 2000)
The centripetal movement of provincianos towards the nation’s capital was complementedby a centrifugal movement to the outlying cities of the Conurbano. Wage differentials,better sanitary conditions, and greater educational opportunities attracted workers from theinterior provinces to Buenos Aires. Two main forces pushed them to the peripheral cities of
8 Both Sargent and Scobie placed technological change (the electrification of tramways and railroads) at thecenter of the urban transformation of Buenos Aires. The electrification of trains took place in 1916 (northern),1923 (western), and 1929 (southern).9 Torres provided evidence for his thesis: in the period 1939-1959, while food prices went up 40 times andclothing went up 60 times, railroad fares increased only 5 times and tramway fares rose 10 times.
6
the Conurbano: cheap transportation costs and the raising cost of land in the capital. Whilethe decision to move to peripheral cities was economically sound, was it also convenientfrom the perspective of public health? Infant mortality rates suggest that sanitary conditionsin the Conurbano were not as good as in the capital city, but they were significantly betterthan those enjoyed by the interior provinces.10 In this regard, the Argentine case differedalso from US and European counterparts: workers moved to industrial cities that werehealthier than their places of origin. If this was so, there was no “urban-disamenities” costto pay.
Peronist Economic Growth and Social Policies
The change in the nature of migrations (from international to internal) altered the nature ofsociety and politics in Argentina. If international migrations had nurtured an economyfounded on agrarian exports and supported a politics characterized by elite control ofgovernment, the urbanization produced by internal migrations went along with industrialdevelopment, the formation of a middle class, and the emergence of workers into thepolitical arena. This general process was part of the modernization that led to thedevelopment of a “mass democracy.” (Germani 1971) In fact, authors have seen in theorigins of Peronism the political corollary of these social and economic processes:industrialization, urban concentration and mass migrations.11 The “new working-class” thatresulted from the movement of internal migrants to the Buenos Aires industrial belt became“available” to be captured by a new political movement that expressed their unsatisfieddemands for increased consumption, respect, and political participation.12Advocates anddetractors of Germani’s thesis coincide in one point: without industrialization and massmigrations there would not be Peronism.
Economic policies during Peronism showed, besides an anti-export, anti-agrarian bias, amarked preference for promoting industrialization and redistributing income in favor ofwage-earners. Following a preoccupation with under-consumption and stagnation thatdeveloped in the 1930s, Peronism tried to modify the distribution of income in favor ofworkers (Villarruel 1988). The nationalization of banking and the control of foreignexchange facilitated Peron’s policy of financing wage increases with cheap credit. Theexpansion of state activities was a second objective, resulting from the geo-politicalsituation of the postwar era. However effective, Peronist redistribute policies were short-lived: in 1950-52 an economic crisis forced the government to assume a more conservative,stabilization policy. (Gerchunoff 1989).
10 Legislation passed in 1920 and 1924 obliged government to provide water to towns over 3,000 inhabitantsand sewer installation to towns over 8,000. (Sargent 1974:102)
11 For a general introduction to the debates about the nature and origins of Peronism, see Plotkin 1998.
12 Much has been written about the origins of Peronism. Some, following Germani, sustain that the newpolitical movement emerged out of the anomie of a new working-class, unrepresented in the big city. Othershad underscored the working-class support for Peronism or the unionist training of the first Peronistleadership. A summary of the different positions in this debate could be seen in Mora y Araujo and Llorente(1980), specially the articles by Germani, Smith, Kenworthy and Halperin Donghi.

7
Peronist social policies have been characterized as “populist” to the extent that theyentailed an extension of social benefits to workers in exchange for their political supportthrough organized labor.13 The expansion of workers’ benefits during the first two Peronistadministrations is well-known: new labor legislation; old-age pensions; medical coverage;subsidies per child; paid vacations; and compulsory collective bargaining. The dramaticincrease in the rate of unionization increased the bargaining position of workers vis-à-visemployers and permitted the political incorporation of workers to the nation. (Llach andSánchez 1984; James1988: chapter 1) In addition, Peronism developed a parallel system ofwelfare targeted towards the marginal population not incorporated into formal labormarkets or unions. This was the “parallel populism” developed by Eva Perón and herFoundation. (Stawski 2004; Plotkin 2003).
Were these social policies successful? Did they bring about the “social justice” promised byPerón? To P. Ross, the Peronist government failed in its attempt to establish the promiseduniversal and integrated welfare system. Rather than universal, social benefits wereproportional to the salaries earned. Hence, they depended, in amount and coverage, on thestrength of each union. Even though the number of workers enjoying social benefitsincreased substantially, it is not clear that this meant an actual re-distribution of wealth, formost of the new social insurance and pension funds were paid by workers. Cheap creditsfor housing went mostly to public servants. (Ross 1993) On the other hand, Peronistpolicies to control inflation might have benefited working-class families: in particular, thefreezing of urban rents, and the regulation of the price of energy and transportation.
Those who examined schooling during Peronism found that many sons of workers attainedsecondary education during this period. Perón was an open advocate of technical trainingand, consequently, expanded significantly the opportunities for this type of training. At thepinnacle of this new system of technical education was the “Workers University” created in1948. (Dussel and Pineau 1995). For other authors the Peronist administration was quitesuccessful in its re-distributing scarce credit among industrialists, and particularly amongsmall and middle-sized firms (Goetz 1976). This preference for small firms made industrialcapitalism more competitive and enhanced the opportunities for upward social mobility.Hence, it is conceivable that “Peronist welfare” was not so much related to income andworking conditions but to opportunities in education and upward social mobility. It alsoimportant to recall that Peronist rhetoric stressed that in the “New Argentina” the “onlyprivileged” would be children. That is, that the protection of infancy was a state priority.
The memory of a “happy time” for the working-class14 was constructed in relation to a darkpast, the “infamous decade” (1930-1943), presented as a time of capitalist tyranny,exploitation of child labor, voting fraud, and the lack of workers’ rights. (James 1988:25-30) True, Perón presided over the largest increase in the share of wages in the GDP: risingfrom 44-46 percent in the years 1939-44 to 55-58 percent in 1949-55. It is clear that realwages increased during 1946-1949 and 1952-54. (Zuvekas 1966; Gerchunoff 1989). And
13 Historian Daniel James has called this exchange “integration,” to the extent that it entailed thesubordination of the union movement to the state. (James 1988:11-12)14 The graphic images of this “Happy World” created by Peronism among workers are examined in Gené2005.

8
the social benefits attained by organized workers were substantial. But it is also true thathistorians have built a too pessimistic vision of the 1930s that needs to be re-assessed.15 Weneed to know more about the true impact of Peronist welfare policies, in comparison withthe years of the “infamous decade.” In particular, we lack information about the wellbeingof worker’s children and families in the Buenos Aires industrial belt, a location and apopulation that was crucial to the political success of Peronism.
To conduct public health policies Perón selected Ramón Carrillo, an advocate of eugenicpolicies and also a promoter of healthy and balanced diets. A believer in the power of thenew media, Carrillo organized campaigns for better food habits and for greater publicawareness of diseases. He used intensively the radio, the cinema, the press, and other meansof advertising chiefly to disseminate information about diets and public hygiene. Inparticular, he recommended people to complement their traditional diet (based on meat,bread, and pasta) with “protective food,” mainly milk, fruits and vegetables. (Ramacciotti2004) We know now that the government achievements in this terrain were more modestthan the official rhetoric would have us believe.16 Rates of infant mortality, having droppedsubstantially in the 1920s and 1930s, proved more resilient to fall in the Peronist years.Similarly, the gains made in the consumption of calories per capita obscured a moreunequal distribution in distribution of these nutrients.
The Data
The data came from the microfilmed registers of military recruits extant at the GeneralDivision of Recruitment of the Argentine Army. In order to have a representative samplefor each birth cohort between 1916 and 1950, we selected seven of the nineteen districts ofthe Conurbano Bonaerense17 and drew samples containing 700 to 1,200 observations eachfor all even years. For control, we chose the nearby city of La Plata, where both skilledworkers and students concentrated. We also drew a sample of internal migrants residing inthe seven districts of the Conurbano and La Plata.18 The districts were chosen for theirprominence as industrial centers. They all figure among the ten most important partidos inthe 1935 Industrial Census in terms of industrial production and are also among the first tenpartidos of the 1954 Economic Census in terms of workers employed.19 The districts of theConurbano are also areas of high concentration of population: whereas the average density
15 See Salvatore, “Better-off in the Thirties” (forthcoming).16 In a 1949 address Perón sustained that “nobody dies of hunger anymore” and that the rising of wages hadallowed workers’ families to double their consumption of food. (Ministerio de Salud 1951)17 Avellaneda, La Matanza, Lomas de Zamora, Morón, Quilmes, San Martín and Vicente López.18 Our sample for 1950 represents 6.8 percent of all 18-year old males registered in these districts by the 1960Population Census. In relation to the estimated number of 18-year old youngsters in 1947 census, theproportion is well over …. Percent.19 The ranking according to value of industrial production in the 1935 Industrial Census is the following: 1-Avellaneda; 2-La Plata; 3-Quilmes; 4-Bahía Blanca; 5-Campana; 6-Tte. Gral. Uriburo; 7-Lomas de Zamora;8-Olavarría; 9-Morón; 10-San Martín. The first ten districts in terms of industrial employment (number ofworkers employed) in the 1954 Economic Census are: 1-Avellaneda; 2-San Martín; 3-Lanús; 4-Quilmes; 5-LaPlata; 6-La Matanza; 7-Vicente López; 8-Morón; 9-San Isidro; 10-Lomas de Zamora.

9
for the province was 22 inhabitants per km2 in 1960, the seven districts had an averagedensity of 3,598 inhabitants per km2.20
Table 1 provides details about the composition of the sample. Since the law established thatyoungsters had to present themselves to recruitment offices within 3 months of their 18th
birthday, 97 percent of our sample was composed of 18-year-old males who had notreached yet their mature height.21 88 percent of the sample was born in the Buenos Airesindustrial belt and in La Plata, while 12 percent were migrants from other provinces. Anoverwhelming majority of recruits were “stayers” (98 percent), people who were born andmedically checked-up at 18 in the same partido. The small minority who migrated out oftheir district of birth (2 percent) went to Capital Federal or to other districts in theConurbano.22
The sample represents quite well two different social classes. Three occupational categoriesbelonging to the working class (unskilled laborers, skilled workers, and employees)comprise 73 percent of the sample. The other three categories (farmers, students, andmerchants) could be assimilated to the middle or upper classes. They constitute 27 percentof the sample. The predominance of skilled workers among working-class recruits (34percent) reveals the capacity of industrial cities to attract and concentrate a qualifiedworkforce. Argentina’s achievement in secondary education is also apparent in thisoccupational breakdown: 22 percent of the recruits (young men recruited between 1934/35and 1968/69) said they were students or professionals at the time of the medical check-up.
As expected, the vast majority of recruits (88 percent) had been born in urban areas.23 The12 percent classified as “non-urban” were either internal migrants or people born inneighborhoods within the industrial districts that, for some time, remained classified as“villages” or “towns”. The occupational structure reflects this urban condition. Only 1percent of the recruits declared to be “farmers” while the proportion of unskilled laborers(17 percent) was smaller than in other samples taken for the Argentine northwest or thePampa region.24
The sample includes those classified by military physicians as incapable for military service(22 percent). Among them were youngsters with sensorial difficulties, walking disabilities,
20 In Buenos Aires province there were few other partidos with similar high population density in 1960: SanIsidro (3,918 inhab/km2), Lanús (8,342 inhab/km2), and Tres de Febrero (5,725 inhab/km2), all belonging tothe Buenos Aires first industrial belt.21 We were able to estimate the exact age of recruits. But due to small numbers, the dummies for recruitsyounger and older than 18 years proved non-significant. It is also possible that some recruits “resulted” of 17and 19 years of age due to errors in registering the dates of birth and of recruitment.22 Quite likely, this 2 percent of out-migration underestimates the degree of mobility of workers within theConurbano and between the Conurbano and the capital city.23 We considered urban any population over 5,000 inhabitants.24 The greater proportion of “skilled workers” was also affected by our classification scheme. We classifiedamong this group, in addition to artisans and workers with a specialized occupation, those workers who calledthemselves obreros (factory workers), in order to differentiate them from the laborers, registered commonlyunder the labels of jornaleros (day-laborers) and peons (non laborers). Among the “unskilled laborers” weincluded also street peddlers, street workers (such as shoe-shiners), delivery boys, and some constructionworkers (masons).

10
nervous and heart conditions, or signs of physical “weakness” (debilidad). As this variableproved non-significant, we assume that an important number of physical deficienciesdetected by doctors were not directly related to nutrition.25
Table 1
SAMPLE COMPOSITION (1916-1950)
Cases PercentageDistrict where bornAvellaneda 1824 11.8La Matanza 2029 13.1Lomas Zamora 1451 9.4Moron 1752 11.3Quilmas 1702 11.0San Martin 1543 9.9Vicente Lopez 1269 8.2Other Conurbano 3 0.0"Provincianos" 1912 12.3Total Conurbano 13485 86.9La Plata 2021 13.0Capital Federal 2 0.0Total Sample 15509 100.0
District where residingAvellaneda 1991 12.8La Matanza 2862 18.5Lomas Zamora 1563 10.1Moron 1688 10.9Quilmes 1795 11.6San Martin 1603 10.3Vicente Lopez 1313 8.5Other Conurbano* 139 0.8Total Conurbano 12954 83.4La Plata 2433 15.7Capital Federal 103 0.7Rest of Bue As prov 9 0.1Interior provinces 10 0.1Total Sample 15509 100.0
* Merlo (34), Gral. Sarmiento (20), Castelar (18), Moreno (16),Florencio Varela (15), San Isidro (12), Alte. Brown (11), Lanus (8)and others
Migrant-ResidentsInterior migrants 1913 12.3
25 A recruit could “save” himself from the burden of military service for having flat feet or been squint-eyed.Conversely, a number of debilitating diseases may not have been evident to military inspectors.

11
Born in BA & La Plata 13596 87.7Out migrants 333 2.1"Stayers" 15176 97.8
AgeAge 17 236 1.5Age 18 15130 97.6Age 19-21 143 0.9
Cases PercentageYear of Birth1916 698 4.51918 687 4.41920 735 4.71922 756 4.91924 755 4.91926 745 4.81928 810 5.21930 810 5.21932 808 5.21934 805 5.21936 918 5.91938 887 5.71940 965 6.21942 963 6.21944 1004 6.51946 1005 6.51948 1035 6.71950 1121 7.2
Urban-ruralUban born 15507 88.4Non-urban born 1789 11.5
OccupationsUnskilled laborer 2618 16.9Skilled worker 5343 34.4Employee 3397 21.9Farmer 210 1.4Students & profession. 3450 22.2Merchants & propietors 490 3.1Total 15509 100.0
Other AttributesIncapable of mil.serv. 3420 22.0Illiterate 82 0.5Horse riding skill 8466 54.6Car driving skill 5514 35.5Knows telegraphy 72 0.5

12
The low degree of illiteracy in the sample (less than 1 percent) requires some commentary.The question itself (“are you illiterate?”) was likely to produce negative answers. Possiblyalso, the army was interested in a very minimal definition of literacy: the recruit’s ability towrite his own name.26 Rather than a true measure of differences in human capital, thisvariable indicates the generalized nature of elementary education in Argentina.
Other two attributes registered by the military proved significant. One, a rural skill: theability to ride horses. The other, a modern, urban skill: the ability to drive motor vehicles.54 percent of recruit had horse-riding skills while 35 percent of them knew how to drive acar. Apparently, youngsters with the two types of skills constituted a workforce that was ina transition towards modernization. Between 1916 and 1950, many activities (productionand transportation) in the cities of the Conurbano replaced motor vehicles for horse-drivenvehicles. But as this transition was slow, young workers had to learn the skills of theirancestors (driving a horse or a horse-powered vehicle) in order to remain in the jobmarket.27
There were some important differences between recruits born and raised in the Conurbanoand internal migrants. These differences are summarized in Table 2. Internal migrants wereequally literate, but significantly more rural. A greater percentage of provincianos knewhow to ride horses. Internal migrants were as healthy as bonaerenses, showing lessproportion of physical incapacities. The proportion of unskilled laborers was greater amonginternal migrants than among those born and raised in the industrial belt (25 percent against16 percent).28 And so was the proportion of skilled workers (41 percent compared to 33percent). The counterpart of this was a smaller proportion of clerical employees (14 versus23 percent) and of students (16 percent compared with 23 percent) among internalmigrants.
We lack information about the educational level of recruits’ parents. The occupationbreakdown, however, gives us some ground to infer differences in social endowments andfamily efforts between the two types of recruits. Due to better social connections, thoseborn and raised in the industrial districts had better chances of getting clerical employment.If we assume that most migrants residing in the Conurbano and La Plata came during theirearly childhood, we can interpret the proportion of “students” and “skilled workers” amongprovinciano recruits as the outcome of family choices made in the place of destination.These youngsters had the chance to compete for a place in the urban labor market byundertaking formal schooling or enhancing their skills through job training. It is apparent
26 On the other hand, it is expected that in the more urbanized and industrial areas of the country, the rates ofliteracy would be quite high. Recruits who went to medical check-up in the late 1930s to the late 1960s hadthe benefit of 80 to 110 years of uninterrupted free elementary education. The actual rates of illiteracy in thesedistricts were in the order of…. to …. Percent … (Nelson….pag…)27 Unfortunately, the Argentine army was not interested in measuring other skills or in the level of educationalattainment. Military recruiters registered those who knew “telegraphy”. This was such rare a skill that thevariable could not be used in the regression analysis. The proportion of “students” constitutes our onlyindicator that 18-year-olds reached some degree of secondary education.28 The literature on internal migrations would lead us to expect a lesser proportion of skilled workers amongprovincianos. This was not the case.

13
from the occupational breakdown that migrants’ families took both paths. In addition, therelative advantage of bonaerenses in secondary education may be related to priorperformance in elementary school, conditioned by better-endowed homes.
Did the “quality” of internal migration change over time? In the first period (1916-1932)more of this migration came from the surrounding provinces of the Pampa region than fromthe interior (56 versus 44 percent). In the second period (1934-1950) the situation reversed,a greater proportion of migrants coming from the interior provinces than from the Pamparegion (59 versus 41 percent).29 After 1934, migrants were less urban than before, anindicator that more came from villages and towns probably located at greater distance fromBuenos Aires. In spite of coming from poor provinces, provinciano recruits were healthierin the second period. The share of provincianos physical unfit for service dropped from 22percent in 1916-32 to 17 percent in 1934-50.
Regarding occupation the most important changes were an important fall in the percentageof students (from 25 to 9 percent), a rise in the proportion of skilled workers (from 21 to 58percent), and a drop in the proportion of unskilled laborers (from 36 to 16 percent). Themigrants of the second period were less educated than those of the earlier period, but hadbetter job skills. In regard to the ability to ride a horse or drive a vehicle, there was almostno change between the first and the second period.
Table 2
"Bonaerenses" vs. "Provincianos"(in percentages)
1916-1932 1934-1950Born in BueAs Born in the Born in BueAs Born in the
and La Plata provinces and La Plata provincesOccupations
Unskilled laborer 27.2 35.9 6.8 16.5Skilled worker 29.9 21.3 36.2 57.9Employee 22.9 14.5 23 14.5Farmer 2.4 2.1 0.6 0.3Students & professionals 14.5 24.9 29.8 9.0Merchants & propietors 3.1 1.3 3.6 1.7
Other attributesAverage Height (cms) 170.4 170.0 172.3 170.2Iliteracy (%) 0.7 1.2 0.2 1.1
29 See Table A3, Appendix A.

14
Urban born (%) 93.6 48.1 95.6 40.7Physical incapacity (%) 27.8 21.6 18.3 16.7Horse-riding skill (%) 51.4 76.2 52.2 72.2Car-driving skill (%) 23.5 27.6 47.2 25.5
There are two ways to understand these changes. One is to consider that, thanks to thelowering of transportation costs, the industrialization in the Conurbano attracted migrantsfrom more distant and poorer provinces. The new migrants were less educated and probablytransmitted to their children a lesser need for formal education. Another way is to considerthat sons of migrants chose to accumulate job-skills rather than to acquire additional formaleducation. At a time when import-substituting industrialization created more opportunitiesfor skilled workers, this seemed a rational choice to make.
Regression Analysis
The distribution of frequencies was quasi-normal, as could be seen in Graphs 1a and 1b.The data showed some degree of “heaping,” more pronounced in the second period, but thisdid not affect the quality of OLS estimates.

15
Graph 1a: Histogram 1916-1932
0
50
100
150
200
250
300
350
400
450
500
147
149
151
153
155
157
159
161
163
165
167
169
171
173
175
177
179
181
183
185
187
189
n

16
Graph 1b: Histogram 1934-1950
0
100
200
300
400
500
600
700
150
152
154
156
158
160
162
164
166
168
170
172
174
176
178
180
182
184
186
188
190
192
194
height
To control for sample composition biases, we performed regressions 1 and 2 (shown inAppendix B). Occupational dummies proved significant. In the first period (1916-1932),compared with unskilled laborers, clerical employees were 1.4 centimeters taller andstudents 2.6 centimeters taller. In the second period (1934-1950), the category “skilledworker” proved significantly different than unskilled laborers, though the difference wasmodest (0.75 cms). Compared to unskilled laborers, the height advantage of clericalemployees (1.6 cms) and of students (3.1 cms) increased. Merchants and farmers, whiletaller than skilled workers, were not as tall as students. This confirms our view that familystrategies concerning children’s schooling and family connections to ease the entry of sonsinto the white-collar jobs had an important effect on stature.
Dummies by district show more significant for the period 1916-1932 than for the followingperiod. This might indicate a process of convergence of biological welfare among industrialdistricts during the period of import-substituting industrialization. Before 1932, the nativesof La Plata, Morón and Quilmes were taller in average than those born in Avellaneda, LaMatanza, Lomas de Zamora and San Martín—the difference ranged from 0.7 to 0.9 cms.The shortest recruits came from Vicente López, a district immediately north to the city ofBuenos Aires (these recruits were 1.4 cms shorter than those born in La Plata or Quilmes).By 1934-1950, recruits coming from this district were among the tallest, together withthose born in La Matanza. Apparently, the parallel processes of industrialization andurbanization brought about a spatial re-distribution of biological welfare that we need toexamine more thoroughly.

17
As expected, migrants coming from the interior provinces were 1.4 to 1.5 centimetersshorter than average. This result was sustained in both periods, indicating that the changesin the nature or “quality” of this migratory workforce did not affect relative net-nutritionoutcomes. We already mentioned that those variables representing “rural” and “modern”skills proved significant. During 1916-1932, recruits with rural skills (horse-riding) were inaverage 0.3 centimeters shorter while recruits with modern skills (car-driving) were 1centimeters taller in average. In the following period (1934-1950), the disadvantage of“rural” skills was maintained but the advantage of “modern” skills disappeared, probably asa result of the widespread dissemination of this type of skills.
Illiteracy proved more significant during the first period: recruits who declared to beanalfabetos were in average 1.7 centimeters shorter. In the second period, as this abilitybecame widespread, the indicator produced a less reliable coefficient. The difference wasstill of the same order (illiterates were 1.9 centimeters shorter). Less expected was to findthat the urban condition of recruits was not an important determinant of average heights.Probably, we need to disaggregate further the information into different types of cities. Butit is clear that the Buenos Aires industrial belt presents a case in which the problem of“urban disamenities” is absent.30 Surprisingly, the health condition of recruits—as observedby military physicians—proved also not significant. This might be due to the fact thatdoctors classified as “unfit for service” not only those considered “constitutionally weak”but also others affected by a variety of health conditions.
Main Results
We present here the main results emerging from the estimates obtained by regressionanalysis. Table 3 and Graph 2 show the estimated trend. These results show that, after arecession in 1920-22, there was a long and sustained improvement of net nutrition in theBuenos Aires industrial belt up to 1938.31 Between 1938 and 1946 the average stature ofrecruits declined in absolute terms. The last two observations corresponding to the firstPeronist administration (1948-1950) show that stature recovered rapidly to levels similar tothose of 1938. From a long-run perspective, the process of industrialization was associatedwith an increase of 2 to 3 centimeters in average heights. These estimates present threenovel findings. First, they emphasized the importance of welfare gains during the late1920s and 1930s. Second, they show the limitations of “Peronist welfare,” presenting thegrowth in stature during this period as a recovery of a previous fall. Third, they point toWWII as an important deviation or rupture in the long-run trend of biological welfare.
30 This does not mean that recruits did not face problems of urban congestion, unsatisfactory sanitation, andother environmental risks. It only means that these conditions did not translate into a systematic andpredictable way into net-nutrition.31 Estimates for the Conurbano do not include the city of La Plata.

18
Table 3:Estimated Heights—Recruits born in “Conurban Buenos Aires”*
Year of birth UnskilledLaborer
Employee Student
1916 169,1 170,5 171,71918 169,3 170,7 171,91920 169,7 171 172,31922 169 170,3 171,61924 169,3 170,6 171,91926 169,4 170,7 1721928 169,6 171 172,21930 169,8 171,2 172,51932 170,1 171,5 172,81934 170,5 172,1 173,61936 170,9 172,6 1741938 171,5 173,2 174,61940 171,3 172,9 174,31942 170,8 172,4 173,81944 170,7 172,3 173,81946 170,1 171,7 173,11948 170,8 172,4 173,91950 171,2 173 174,5
Source: Predicted values of Regressions 1 and 2.“Conurban Buenos Aires” includes Avellaneda, la Matanza, Lomas de Zamora,
Morón, Quilmas, San Martín and Vicente López.
These estimates constitute an important departure from traditional interpretations ofindustrialization and working-class welfare in the 1930s and 1940s. Instead of a decline ofwelfare in the so-called “década infame” (1930-1943), our estimates indicate an importantimprovement in net nutrition in the 1930s followed by a significant fall in 1938-46.According to this evidence, nutrition and health conditions started to improve well into thefirst Peronist administration. The estimates for 1944 and 1946 (statistically significant)show an unambiguous fall in average stature during this period. In fact, the low pointattained in 1946 refers to recruits born in this year. This cohort reached its third year of agein 1949. What does this say about the welfare of children during Peron’s first term?

19
Graph 2_Estimated Heights “Conurban Buenos Aires”*
166
167
168
169
170
171
172
173
174
175
176
1916 1918 1920 1922 1924 1926 1928 1930 1932 1934 1936 1938 1940 1942 1944 1946 1948 1950year of birth
heig
ht StudentEmployeeUnsk. Laborer
*“Conurban Buenos Aires” refers to the districts of Avellaneda, La Matanza, Lomas de Zamora, Morón, Quilmas, San Martín and Vicente López.
In addition, these estimates reaffirm earlier findings about the negligible effect of the worldeconomic depression of 1929-1932 on the welfare of Argentine children. Indeed, data forthe industrial belt shows an uninterrupted growth in net nutrition from the early 1920s to1938. This inference, previously drawn from samples taken in the city of Buenos Aires andin the Northwest, can now be extended to workers and residents of industrial districts in“Conurban” Buenos Aires and La Plata.32 The protectionism created by the worlddepression favored the development of national industry, the loss of agricultural exportsbeing compensated by the expansion of employment and income in the industrial sector.(About the limited impact of the GD on Argentina see Díaz Alejandro… and Thorp…)
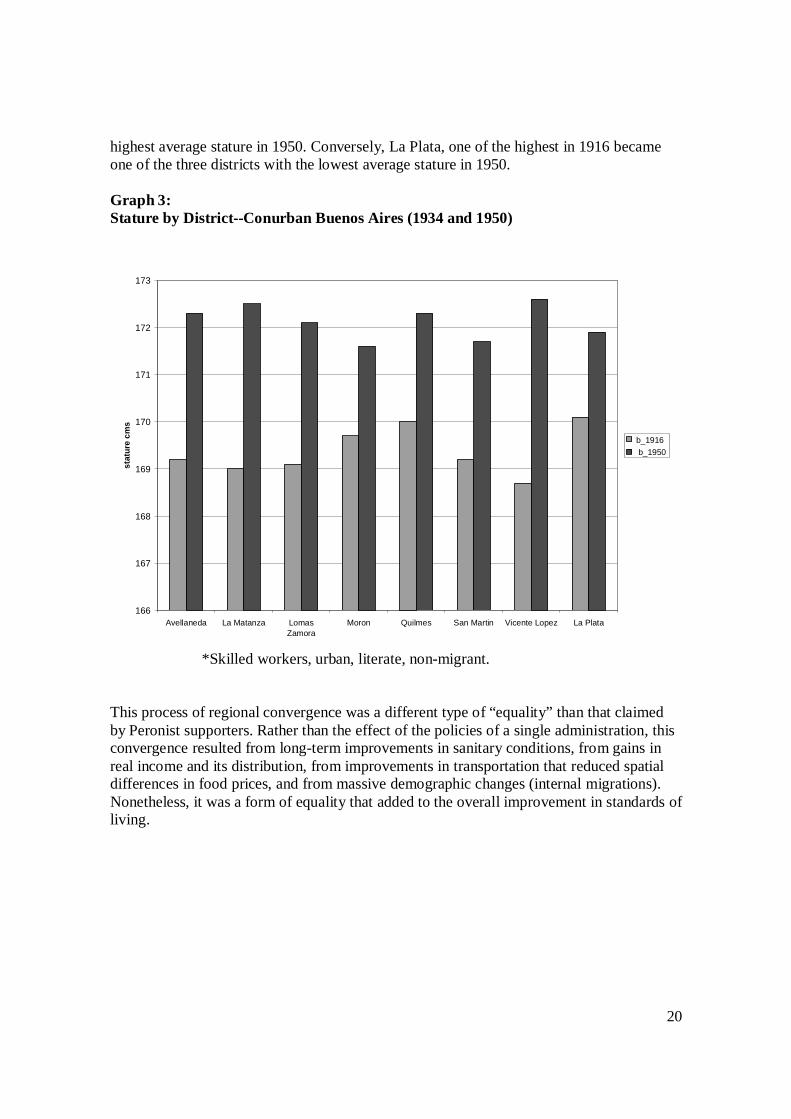
The results are also unambiguous in regard to the geographical distribution of biologicalwelfare in industrial districts. All districts show long-term growth. Vicente López, LaMatanza, Avellaneda and Lomas de Zamora gained between 3 and 3.9 centimeters between1916 and 1950. San Martín and Quilmes gained 2.3 and 2.5 centimeters, while La Plata andMorón showed gains of 1.8-1.9 centimeters. The dispersion of average heights amongdistricts tended to decline over time indicating the presence of regional convergence.Vicente López, which had the lowest average stature in 1916, became the district with the
32 See Salvatore 2004a and 2004b..
20
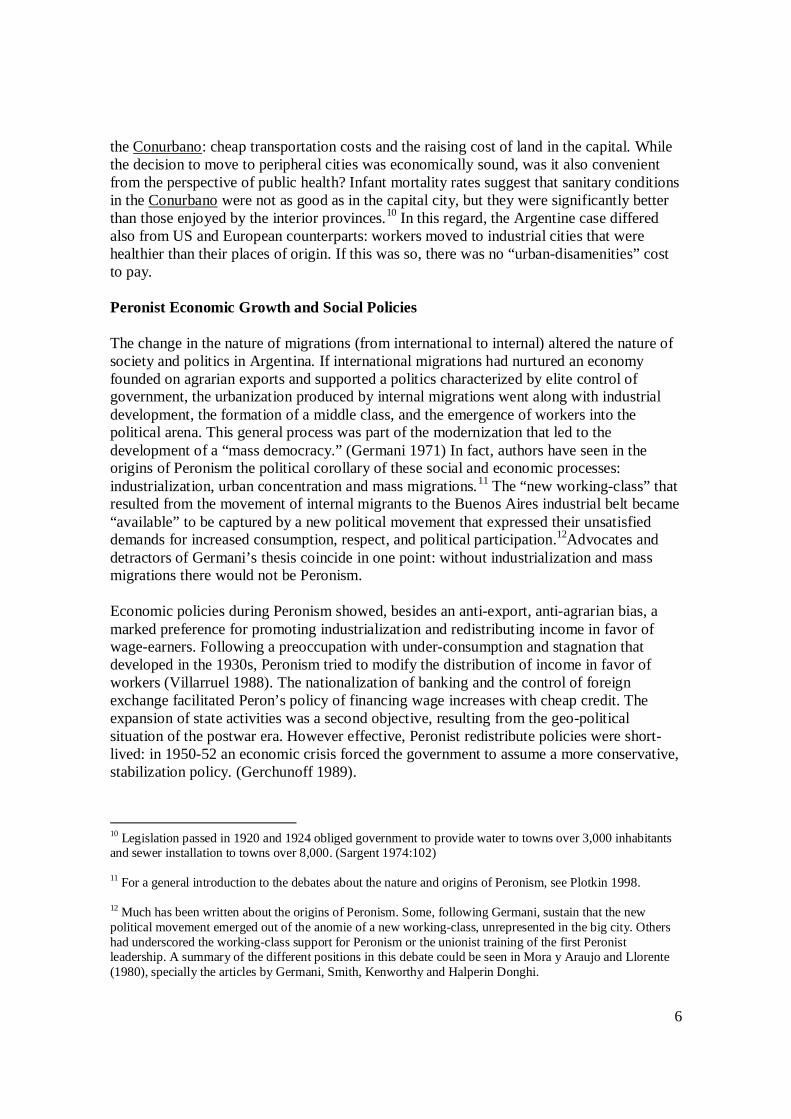
highest average stature in 1950. Conversely, La Plata, one of the highest in 1916 becameone of the three districts with the lowest average stature in 1950.
Graph 3:Stature by District--Conurban Buenos Aires (1934 and 1950)
166
167
168
169
170
171
172
173
Avellaneda La Matanza LomasZamora
Moron Quilmes San Martin Vicente Lopez La Plata
stat
ure
cms
b_1916 b_1950
*Skilled workers, urban, literate, non-migrant.
This process of regional convergence was a different type of “equality” than that claimedby Peronist supporters. Rather than the effect of the policies of a single administration, thisconvergence resulted from long-term improvements in sanitary conditions, from gains inreal income and its distribution, from improvements in transportation that reduced spatialdifferences in food prices, and from massive demographic changes (internal migrations).Nonetheless, it was a form of equality that added to the overall improvement in standards ofliving.
21
Graph 4: Stature Growth 1916-1950 (Convergence)
Cms.
0
0,5
1
1,5
2
2,5
3
3,5
4
4,5
Vicente Lopez La Matanza Lomas Zamora Avellaneda San Martin Moron Quilmes La Plata
stat growth
*Districts are ordered from left to right from shorter to taller in 1916.
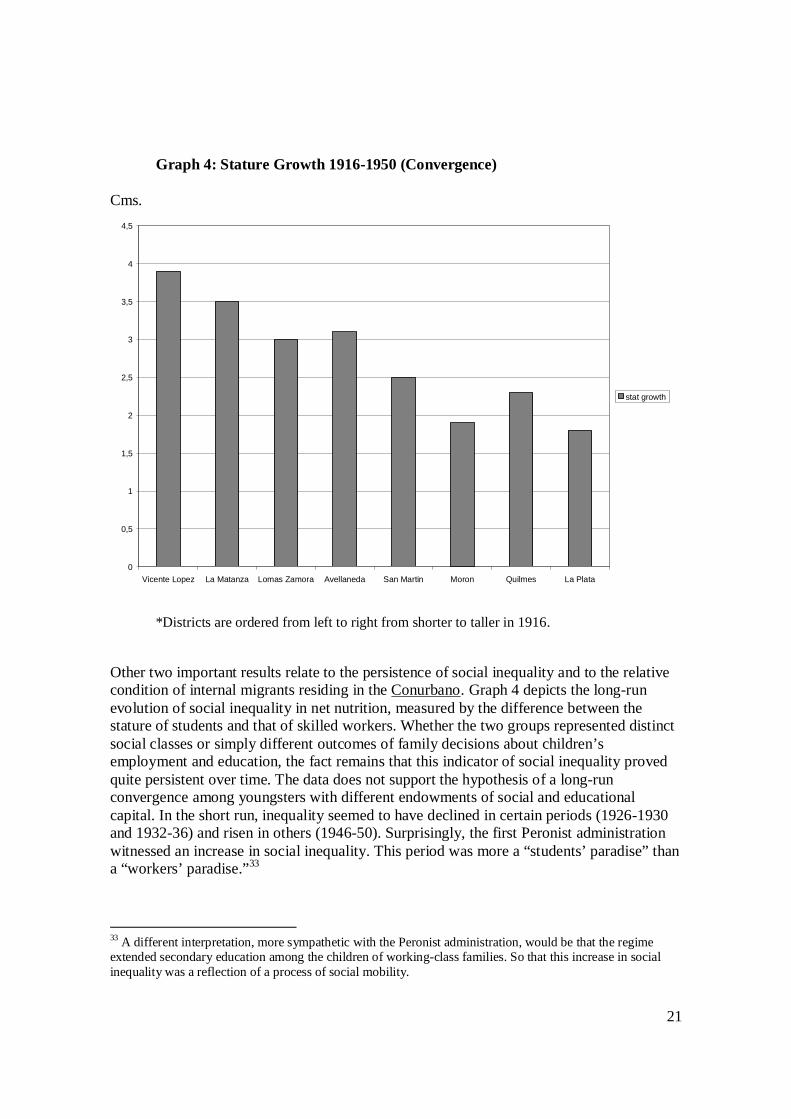
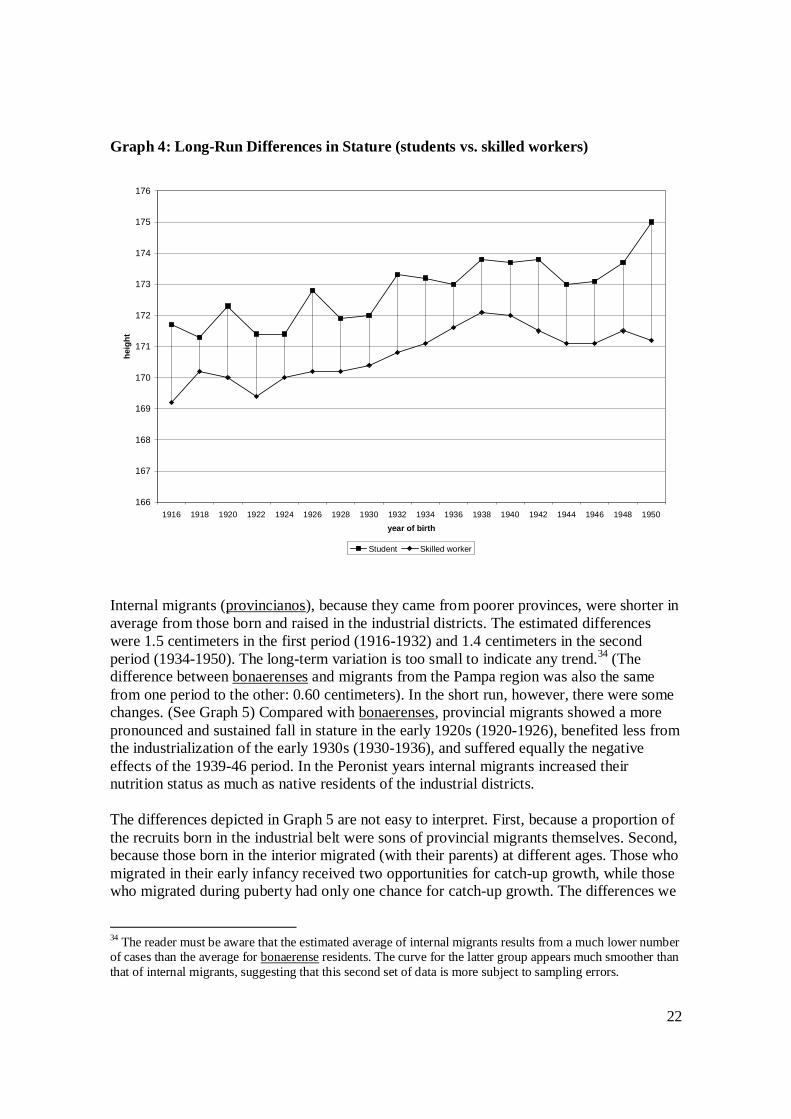
Other two important results relate to the persistence of social inequality and to the relativecondition of internal migrants residing in the Conurbano. Graph 4 depicts the long-runevolution of social inequality in net nutrition, measured by the difference between thestature of students and that of skilled workers. Whether the two groups represented distinctsocial classes or simply different outcomes of family decisions about children’semployment and education, the fact remains that this indicator of social inequality provedquite persistent over time. The data does not support the hypothesis of a long-runconvergence among youngsters with different endowments of social and educationalcapital. In the short run, inequality seemed to have declined in certain periods (1926-1930and 1932-36) and risen in others (1946-50). Surprisingly, the first Peronist administrationwitnessed an increase in social inequality. This period was more a “students’ paradise” thana “workers’ paradise.”33
33 A different interpretation, more sympathetic with the Peronist administration, would be that the regimeextended secondary education among the children of working-class families. So that this increase in socialinequality was a reflection of a process of social mobility.
22
Graph 4: Long-Run Differences in Stature (students vs. skilled workers)
166
167
168
169
170
171
172
173
174
175
176
1916 1918 1920 1922 1924 1926 1928 1930 1932 1934 1936 1938 1940 1942 1944 1946 1948 1950year of birth
heig
ht
Student Skilled worker
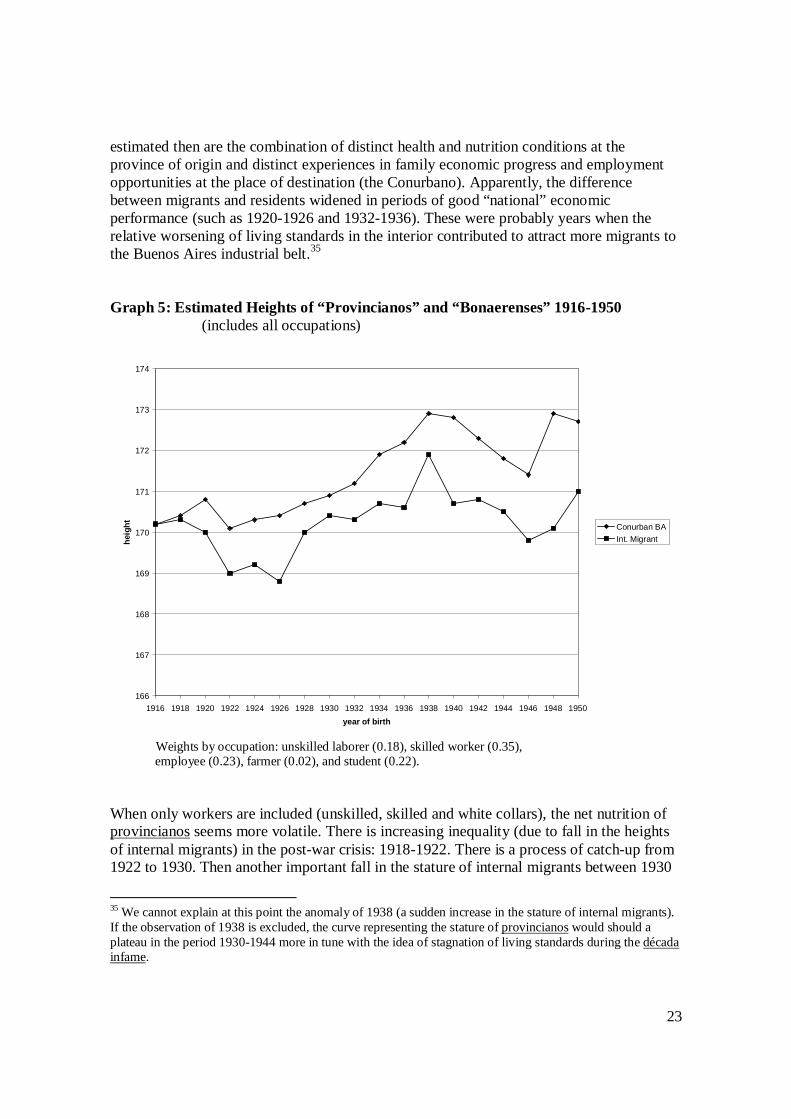
Internal migrants (provincianos), because they came from poorer provinces, were shorter inaverage from those born and raised in the industrial districts. The estimated differenceswere 1.5 centimeters in the first period (1916-1932) and 1.4 centimeters in the secondperiod (1934-1950). The long-term variation is too small to indicate any trend.34 (Thedifference between bonaerenses and migrants from the Pampa region was also the samefrom one period to the other: 0.60 centimeters). In the short run, however, there were somechanges. (See Graph 5) Compared with bonaerenses, provincial migrants showed a morepronounced and sustained fall in stature in the early 1920s (1920-1926), benefited less fromthe industrialization of the early 1930s (1930-1936), and suffered equally the negativeeffects of the 1939-46 period. In the Peronist years internal migrants increased theirnutrition status as much as native residents of the industrial districts.
The differences depicted in Graph 5 are not easy to interpret. First, because a proportion ofthe recruits born in the industrial belt were sons of provincial migrants themselves. Second,because those born in the interior migrated (with their parents) at different ages. Those whomigrated in their early infancy received two opportunities for catch-up growth, while thosewho migrated during puberty had only one chance for catch-up growth. The differences we
34 The reader must be aware that the estimated average of internal migrants results from a much lower numberof cases than the average for bonaerense residents. The curve for the latter group appears much smoother thanthat of internal migrants, suggesting that this second set of data is more subject to sampling errors.
23
estimated then are the combination of distinct health and nutrition conditions at theprovince of origin and distinct experiences in family economic progress and employmentopportunities at the place of destination (the Conurbano). Apparently, the differencebetween migrants and residents widened in periods of good “national” economicperformance (such as 1920-1926 and 1932-1936). These were probably years when therelative worsening of living standards in the interior contributed to attract more migrants tothe Buenos Aires industrial belt.35
Graph 5: Estimated Heights of “Provincianos” and “Bonaerenses” 1916-1950(includes all occupations)
166
167
168
169
170
171
172
173
174
1916 1918 1920 1922 1924 1926 1928 1930 1932 1934 1936 1938 1940 1942 1944 1946 1948 1950year of birth
heig
ht Conurban BAInt. Migrant
Weights by occupation: unskilled laborer (0.18), skilled worker (0.35), employee (0.23), farmer (0.02), and student (0.22).
When only workers are included (unskilled, skilled and white collars), the net nutrition ofprovincianos seems more volatile. There is increasing inequality (due to fall in the heightsof internal migrants) in the post-war crisis: 1918-1922. There is a process of catch-up from1922 to 1930. Then another important fall in the stature of internal migrants between 1930
35 We cannot explain at this point the anomaly of 1938 (a sudden increase in the stature of internal migrants).If the observation of 1938 is excluded, the curve representing the stature of provincianos would should aplateau in the period 1930-1944 more in tune with the idea of stagnation of living standards during the décadainfame.

24
and 1936 that worsens inequality. And finally two important falls in stature (more severethan for residents of the Conurbano): one in 1938-40; the other in 1944-46.
The information about heights can also be used to estimate a proxy for the rate ofmalnutrition. Subtracting one standard deviation (6.1 cms) to the estimated average heightsfor the Conurbano (171.4 cms), we calculated a benchmark for malnutrition: 165.3centimeters. The annual rates of malnutrition estimated with this fix benchmark arereported in Table 4 and Graph 6. This indicator shows that important improvements in thebiological wellbeing of the very poor (except for the exceptional year of 1920) were notreached until the 1930s. The period of the Great Depression (1930-34)—which inArgentina coincided with a robust process of industrialization—presents the most importantsingle fall in the estimated rate of malnutrition. The reason for this is quite simple: the fallin the internal cost of food (due to the nearly stop in the exportation of food staples) was sosignificant that it increased the number of calories available for poor families.
Declining rates of malnutrition continued through 1938, after which the rate went back upuntil 1942, then fell in 1944, raised again in 1946, and fell again in the last years of the firstPeronist administration. Clearly, the reduction of malnutrition appears more impressive inthe 1930s than in the Peronist years. The best year in this regard was 1938 and not 1948 or1950. Whether one considers the Conurbano with or without internal migrants, the result isthe same: the estimated rate of malnutrition for the year 1950 was similar to the ratesalready attained in the period 1934-36.

25
Graph 6: Estimated Malnutrition Rate 1916-1950 (calculated with fixed benchmark)
8
10
12
14
16
18
20
22
24
1916 1918 1920 1922 1924 1926 1928 1930 1932 1934 1936 1938 1940 1942 1944 1946 1948 1950year of birth
mal
nutri
tion
rate
(%)
Conurban BAWhole sample
*The whole sample includes provincial migrants.
Seeking Explanations
Let us summarize our findings. All districts of the industrial belt experienced significantgains in stature. Most of this growth was achieved before 1938; after that year a fall instature followed until 1946. The fall in stature in the industrial belt during WWII appears asan important finding that needs to be explained. The Peronist years showed a recovery ofstature growth, but only to match levels of biological wellbeing already attained in the1930s. The most important gains in the reduction of malnutrition coincided with the years1932-1938, a period of intense import-substituting industrialization. Within the industrialdistricts a process of convergence seemed to have taken place over the long-run. Biologicalwellbeing was more equally distributed across districts in 1950 than in 1916. Socialdifferences, as reflected by the information on heights by occupation, were maintained overtime: students were 2 to 2.5 cms taller than skilled workers. Internal migrants were shorterin average than natives of the industrial districts and this difference did not seem toconverge.

26
Three of these findings are quite revisionists and, consequently, should be examined morecarefully. One says that the Peronist experiment in workers’ rights and income re-distribution was not so effective in terms of net nutrition as previously thought; that the late1920s and first eight years of the 1930s were far more important in improving the welfareof children. Another finding that contrasts with the literature suggests that social andregional inequality in net nutrition did not decrease over time. Despite progressive andnation-wide sanitary and food policies, students continued to be taller than skilled workersand internal migrants continued to be shorter than recruits born in the Buenos AiresConurbano. A third finding relates to the quite persistent fall in stature during the period1939-45, a phenomenon not detected in our estimates for the capital city.
How do we interpret and explain these atypical findings? Let us examine first the relativebiological wellbeing of the 1930s against the Peronist years. One could argue that Peronistwelfare and redistributed policies tended to benefit organized labor and particularly skilledadult workers. That, in spite of the attempt to regulate food prices, Perón was unable orunwilling to uproot poverty and malnutrition among the population with the lowestincomes. This interpretation would be consistent with a widespread vision of the “NuevaArgentina”, one that sustains that an important social progress was to provide public goods(among them, education) to the sons of the working-class. In this regard, one could arguethat Peronist progress went along with upward social mobility. That many of those recruitsclassified as students in 1963-1968 (born in the years 1945-1950) were sons of workerswho had been able to attend secondary school, thanks to the welfare policies of Peronism.
The second finding is perhaps less revisionist and more easy to integrate into existingexplanations of Argentine socio-economic growth. The persistence of inequality in regionaland social terms is not inconsistence with the existence of upward social mobility. If aninternal migrant could elevate his position in life by migrating to the industrial belt, and hissons attained greater incomes via an increase in schooling or through an accumulation ofskills learned on the job, then there was inter-generational and life-cycle social mobility.But this by itself could not reduce regional or social inequalities, at least not in this timespan.
If internal migrations continued and actually intensified beyond our period it was becausedifferences in sanitary conditions and income did not converge sufficiently to make peoplestay in their provinces of origin. Or, put in other words, that the job-creating engine of theConurbano concentrated workforce from the interior without giving in return a proportionalspatial re-distribution of income and wealth. Similarly, if internal migrants could improvethe nutrition and health of their children by the educational opportunities and the job skillsoffered in the industrial belt, it is clear that the supply of skills and secondary education didnot increase sufficiently as to reduce the net-nutrition premium to students and skilledworkers.
Question 1: Rising Stature in the period 1922-1938
Available statistics on income, wages and employment during this period do not present along period of un-interrupted growth in wellbeing. Real wages rose in the postwar period,reaching a peak in 1928. Afterward, they declined during the first two years of the

27
depression (1929-1930), recovering later as a consequence of price deflation. Yet still in1932 they were 4 percent lower than in 1929. Between 1924 and 1928, as real wages grewfaster than per-capita income, there is the presumption that income was re-distributed infavor of waged workers. (Cortés Conde 2005: 63, 65, and 118) During the 1930s, nominalwages continued growing, stimulated by the more intense demand from industry and thestop in international migrations. Price stability was a given during this decade, to the extentthat many commentators judged food prices to be low in comparison with other nations.The real wage index for Capital Federal went from 113 in 1920-24 to 143 in 1935-39 whileindustrial workers reduced their weekly work hours from 49.5 to 45.3. (Díaz Alejandro1975: 54)
By contrast, average stature in the industrial belt rose un-interrupted by the depression. It ispossible that, during this period, working-class families learned to substitute moreexpensive foods (meat) for less expensive products (rice, potatoes), preserving orenhancing the number of calories consumed. Or that, with a modestly increased real wages,families were able to withdraw their younger members from the labor market, allowingthem more calories for body growth. It is also likely that an improvement in the distributionof income (to be explained)… combined with the allocation of food among poor children(through the school system) reduced the overall inequality in the distribution of nutrients.The dramatic fall in the estimated rate of malnutrition between 1922 and 1934 seems towork in this direction.
Question 2: Declining Stature in the period 1938-1946
For this period, the tension between income and wages indicators and average heights isgreater. During the war period (1939-44) the economy grew at a rate of 3.6 percent peryear, only experiencing a recession in 1945. The scarcity of imports facilitated thedevelopment of national industry which, aided also by credit facilities and new markets inLatin America. (Gerchunoff and Llach 2005: 158-159) Traditionally, this period isgenerally described as one in which real wages kept pace with inflation while infantmortality was declining. What could have occurred to produce such sustained fall instature?
First, we need to address the relationship between internal migrations and stature. Is itpossible that a massive and concentrated migration from provincianos generated adownward pressure on heights in the Conurbano? Under what conditions is this relationshippossible? First, it is necessary that internal migrants arrived at the Conurbano in the period1937-1943 so that their first and second children, born at the cities of destination,constituted a large part of the recruit cohorts of 1939-1945. We need here nothing short of aprovinciano “baby boom” in the Buenos Aires industrial belt. Second, it is necessary thatinternal migrants (shorter than locals) preferred to marry partners also from the interior, sothat their children result shorter than those begot by bonaerense couples. If Germani’sestimates are right (internal migrations became massive starting in 1936), the first conditionwas met. The second condition is difficult to test, for we lack information about the rates offertility of migrants compared with residents. (??) But, why did this “inheritance effect” didnot prolong itself into the next period (1946-50)? Did provincianos changed marriagestrategies (marring more into local families)? Or did the wage increases and greater

28
educational opportunities provided by Peronism more than compensate for this “inheritanceeffect”? Unfortunately, with the available evidence, we cannot answer these crucialquestions.
During the war, internal prices rose significantly. In Buenos Aires province, the cost ofliving increased 38 percent (1939-45), the prices of food rose 33 percent, while housingcosts increased by 35 percent. (“Nivel de vida de la familia obrera”, 1945) The impact ofinflation was unevenly distributed across the national territory, some provinces 1(such asCórdoba and Catamarca) reaching 50-51 percent, while others suffered more moderateprice increases. Nominal wages increased also. In average the increases tended to match,with some lag, the rise in prices. So that in average, real wages did not change much.However, it is possible that the dispersion of wages made increased income inequalitiesamong workers. This theme required further investigation.
Rates of infant mortality show that during this period nothing particularly differentoccurred. Rates continued to fall, though at a smaller pace, both in the capital and in theindustrial belt. There is some indication that, for some years, infant mortality caused bydiarrhea was abnormally high. But in general, there are no good reasons to attribute the fallin stature to a public health crisis. We have some indication that with the acceleration ofindustrialization in the 1930s the demand for child labor was on the rise. But why did thisfactor impact only starting in 1939?
Question 3: the best Peronist years (1946-50)
There is consensus that the redistributive policies of Peronism were quite effective duringthe years 1946-49. Real wages were in 1949 62 percent higher than in 1945. In spite of abusiness slowdown in 1949-50, real wages continued to grow, declining only in thefollowing years. (Gerchunoff 1989: 62-63) Our evidence in stature is consistent with thetraditional wisdom. But the estimated level of average stature for 1950 is similar or lower tothat attained in 1938. This result is quite robust. Explaining this result entails certaindifficulties. One could assume that the benefit of Peronist social policies concentrated onthe formal labor force, leaving aside informal workers. In a context of rising inflation,workers not affiliated with unions might have suffered more. Consequently, the rise in realwages did improve the standard of living of an important sector of the industrial workforce,but not of all. It is possible that the war years (1939-45) saw an increased participation ofchildren in the workforce, reducing the amount of nutrients available for physical growth.In this regard, the best Peronist years might have entailed a recovery to an early situation inthe control of child labor—once the bureaucracy of the Department of Labor caught upsupervising the new factories of the Conurbano.
In short, we are inclined to see the rise of stature in the 1920s and 1930s as the result ofgrowing real wages and the decline of child labor, in an environment of lesser risk ofdisease for infants. The fall of average heights in the 1938-46 period had little to do withdisease. Rising prices eroding the budgets of the lower categories of waged workers is onepossible reason for this fall. But wee need to look further into the enforcement of child

29
labor regulations and the rational of migrant families with regard to education and childlabor.
REFERENCES
Barbero, María Inés and Fernando Rocchi (2003). “Industry,” in G. della Paolera and Alan M.Taylor, eds. A New Economic History of Argentina (Cambridge, Eng.: Cambridge UniversityPress), 261-294.
Cortés Conde, Roberto (2005). La economía política de la Argentina en el siglo XX (Buenos Aires:Edhasa).
Díaz Alejandro, Carlos F. (1975). Ensayos sobre la historia económica argentina (Buenos Aires:Amorrortu Editores).
Dussel, Inés and Pablo Pineau (1995). «De cuando la clase obrera entró al paraíso: La educacióntécnica estatal en el primer peronismo,” in Adriana Puiggrós ed. Discursos pedagógicos eimaginario social en el peronismo (1945-1955) (Buenos Aires: Galerna), 107-173.
Dorfman, Adolfo (1942). Evolución industrial argentina (Buenos Aires: Losada).
Economic Commission for Latin America (1950). The economic development of Latin Americaand its principal problems (Washington, DC: United Nations).
Felix, David (1965). “Industrialización sustitutiva de importaciones y exportación industrial en laArgentina,” Documento de Trabajo no. 22. Buenos Aires, Centro de Investigaciones Económicas,Instituto Torcuato Di Tella.
Gené, Marcela (2005). Un mundo feliz. Imágenes de los trabajadores en el primer peronismo, 1946-1955 (Buenos Aires: Fondo de Cultura Económica/ Universidad de San Andrés).
Gerchunoff, Pablo (1989). “Peronist Economic Policies, 1945-55,” in G. Di Tella and R. Dornbush,eds. The Political Economy of Argentina, 1946-83 (Pittsburgh: University of Pittsburgh Press), 59-88.
Gerchunoff, Pablo and Lucas Llach (2005). El ciclo de la ilusión y el desencanto. Un siglo depolíticas económicas argentinas, second edition (Buenos Aires: Ariel).
Germani, Gino (1955). Estructura social de la Argentina: análisis estadístico (Buenos Aires:Editorial Raigal).
Germani, Gino (1963). “La movilidad social en la Argentina,” in Seymour M. Lipset and R.Bendix, eds., Movilidad social en la sociedad industrial (Buenos Aires: Eudeba), 317-356.
Germani, Gino (1971). “Hacia una democracia de masas,” in Torcuato Di Tella, Gino Germani andJorge Graciarena, eds., Argentina, sociedad de masas, second edition (Buenos Aires: Eudeba), 206-227.

30
Goetz, Arturo L. (1976). “Concentración y desconcentración en la industria argentina desde ladécada de 1930 a la de 1960,” Desarrollo Económico 15:60 (January-March), 507-548.
James, Daniel (1988). Resistance and Integration. Peronism and the Argentine working class,1946.1976 (New York: Cambridge University Press).
Lattes, Zulma Recchini de and Alfredo Lattes (1969). Migraciones en la Argentina. Estudio de lasmigraciones internas e internacionales basado en datos censales, 1869-1960 (Buenos Aires:Editorial del Instituto Torcuato Di Tella).
Llach, Juan J. and Carlos E. Sánchez (1984). “Los determinantes del salario en la Argentina. Undiagnóstico de largo plazo y propuestas de políticas,” Estudios (Fundación Mediterránea), 7:29(January-March).
Mora y Araujo, Manuel and Ignacio Llorente, eds. (1980). El voto peronista. Ensayos de sociologíaelectoral argentina (Buenos Aires: Editorial Sudamericana).
Plotkin, Mariano (2003). Mañana es San Perón: A cultural history of Peron’s Argentina, translatedby K. Zahniser (Wilmington, Del.: SR Books).
Ramacciotti, Karina I. (2004). “Las tensiones en la política sanitaria de Ramón Carrillo,” in PatriciaBerrotarán, Aníbal Jáuregui and Marcelo Rougier, eds. Sueños de bienestar en la Nueva Argentina.Estado y políticas públicas durante el Peronismo (1945-1955) (Buenos Aires: Imago Mundi), 229-268.
Recchini de Lattes, Zulma (1973). “El proceso de urbanización en la Argentina: Distribución,crecimiento y algunas características de la población urbana,” Desarrollo Económico 12:48(January-March), 867-886.
Rocchi, Fernando (1994), “La armonía de los opuestos: Industria, importaciones y la construcciónurbana de Buenos Aires en el período 1880-1920,” Entrepasados, año 4, no, 43-66.
Rocchi, Fernando (2006). Chimneys in the Desert. Industrialization in Argentina during the ExportBoom Years, 1870-1930 (Stanford: Stanford University Press).
Ross, Peter (1993). “Justicia social: Una evaluación de los logros del Peronismo clásico,” AnuarioIEHS (Tandil), vol. 8, 105-124.
Salvatore, Ricardo D. (2004a). “Stature Decline and Recovery in a Food-Rich Export Economy:Argentina 1900-1934,” Explorations in Economic History 41:3 (July), 233-255.
Salvatore, Ricardo D. (2004b). “Stature, Nutrition and Regional Convergence: The ArgentineNorthwest in the First Half of the Twentieth-Century,” Social Science History 28:2 (Summer), 297-324.
Salvatore, Ricardo D. (forthcoming) “Better-off in the Thirties: Quality of Life Indexes forArgentina, 1900-1940,” in R. Salvatore, J. Coatsworth and A. Challú, eds. Standards of Living inLatin American History (Harvard University Press, forthcoming).

31
Sargent, Charles S. (1974). The Spatial Evolution of Greater Buenos Aires, Argentina, 1870-1930.(Tempe, Arizona: Center for Latin American Studies, Arizona State University).
Schvarzer, Jorge (1996). La industria que supimos conseguir. Una historia político-social de laindustria argentina (Buenos Aires: Planeta).
Schvarzer, Jorge (2000). “La implantación industrial,” in José L. Romero and Luis A. Romero, eds.Buenos Aires. Historia de cuatro siglos, vol. 2 (Buenos Aires: Altamira),209-239.
Scobie, James (1974). Buenos Aires: Plaza to Suburb 1870-1910 (New York: Oxford UniversityPress).
Stawski, Martín (2004). “El populismo paralelo: Política social de la Fundación Eva Perón (1948-1955),” in Patricia Berrotarán, Aníbal Jáuregui and Marcelo Rougier, eds. Sueños de bienestar en laNueva Argentina. Estado y políticas públicas durante el Peronismo (1945-1955) (Buenos Aires:Imago Mundi), 193-226.
Torre, Juan C. (2000). “La ciudad y los obreros,” in José L. Romero and Luis A. Romero, eds.Buenos Aires. Historia de cuatro siglos, vol. 2 (Buenos Aires: Altamira), 259-271.
Torres, Horacio A. (1978). “El mapa social de Buenos Aires en 1943, 1947 y 1960. Buenos Aires ylos modelos urbanos,” Desarrollo Económico 18:70 (July-September), 163-204.
Villanueva, Javier (1972). “El origen de la industrialización argentina,” Desarrollo Económico12:47.
Villarruel, José C. (1988). “El estado, las clases sociales y la política de ingresos en los gobiernosperonistas, 1946-1955,” in M. Rapoport, ed. Economía e Historia (Buenos Aires: Editorial Tesis),380-446.
Zuvekas, Clarence (1966). “Economic Growth and Income Distribution in Postwar Argentina,”Inter-American Economic Affairs 20:3 (Winter), 19-38.