stats sa 2015 first quarter labour force survey
TRANSCRIPT
Quarterly Labour Force Survey Q1: 2015
Pali LehohlaStatistician-General
@StatsSA
#Labour
The South Africa I know, the home I understand
QLFS
Outline• New master sample• Results of QLFS Q1 2015• Employment
o Sources of formal sector employmento Employment in the formal and informal sector
• Unemployment• Inactivity• Labour dynamics• Q1 2015 Highlights
The introduction of the new 2013 Master sample
New
Mas
ter
Sam
ple
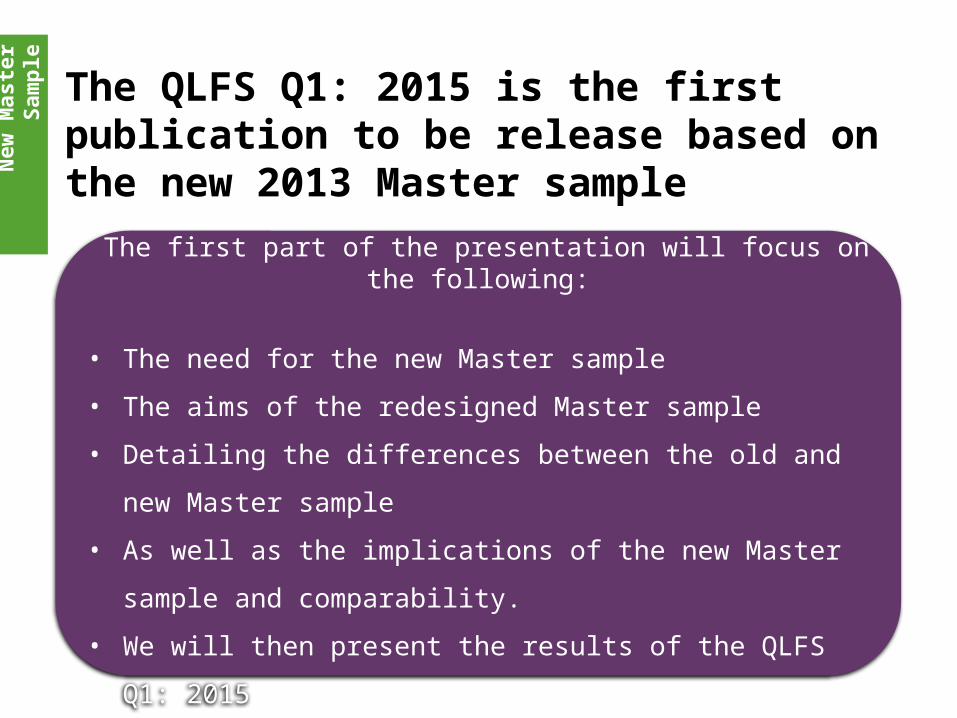
The first part of the presentation will focus on the following:
• The need for the new Master sample
• The aims of the redesigned Master sample
• Detailing the differences between the old and new Master
sample
• As well as the implications of the new Master sample and
comparability.
• We will then present the results of the QLFS Q1: 2015
The QLFS Q1: 2015 is the first publication to be release based on the new 2013 Master sample
New
Mas
ter
Sam
ple
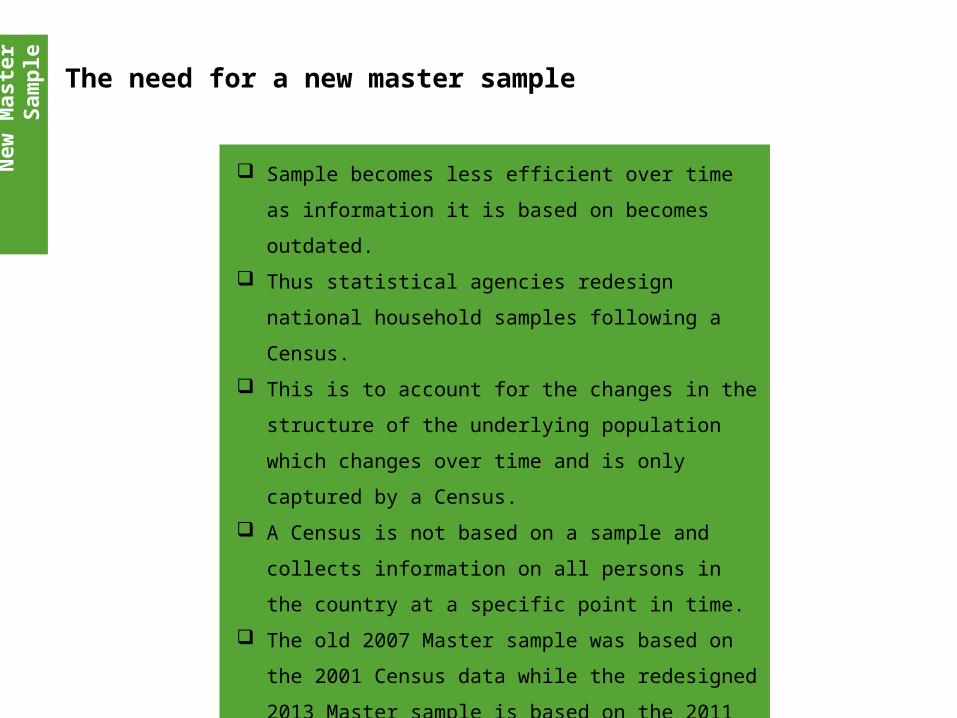
The need for a new master sample
Sample becomes less efficient over time as
information it is based on becomes outdated.
Thus statistical agencies redesign national
household samples following a Census.
This is to account for the changes in the
structure of the underlying population which
changes over time and is only captured by a
Census.
A Census is not based on a sample and collects
information on all persons in the country at a
specific point in time.
The old 2007 Master sample was based on the
2001 Census data while the redesigned 2013
Master sample is based on the 2011 Census.
New
Mas
ter
Sam
ple
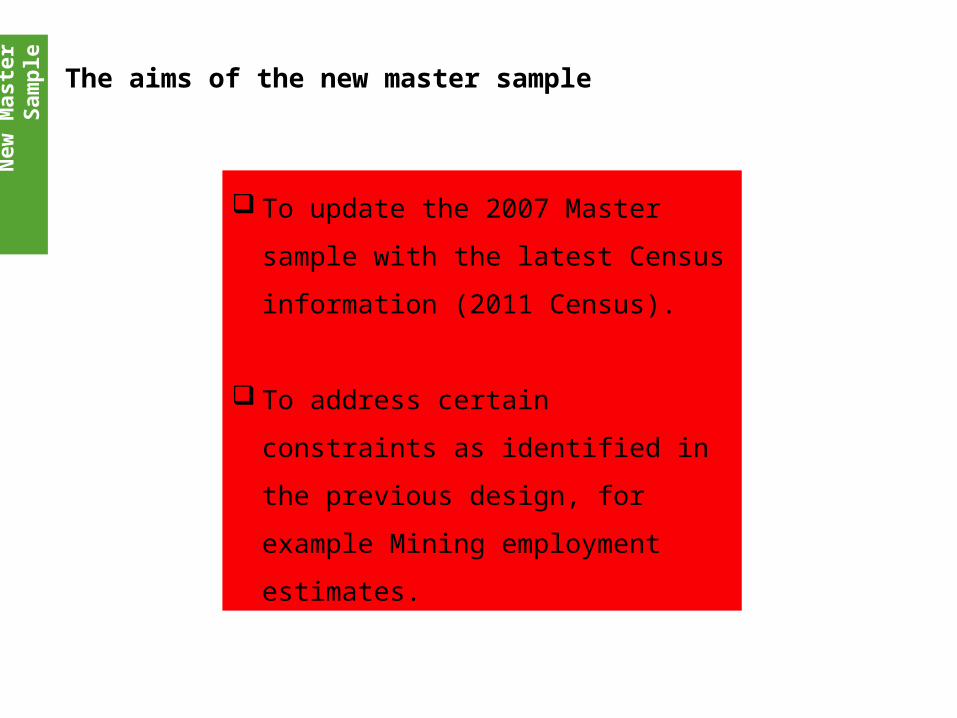
The aims of the new master sample
To update the 2007 Master sample with
the latest Census information (2011
Census).
To address certain constraints as
identified in the previous design, for
example Mining employment estimates.
New
Mas
ter
Sam
ple
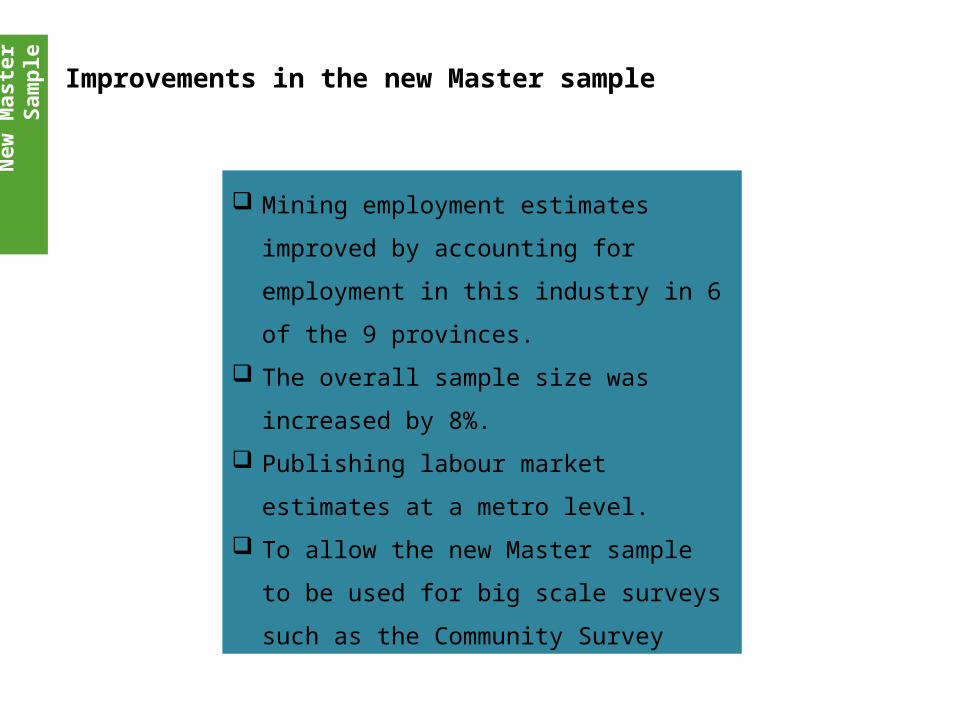
Improvements in the new Master sample
Mining employment estimates improved by
accounting for employment in this industry
in 6 of the 9 provinces.
The overall sample size was increased by
8%.
Publishing labour market estimates at a
metro level.
To allow the new Master sample to be used
for big scale surveys such as the
Community Survey
New
Mas
ter
Sam
ple
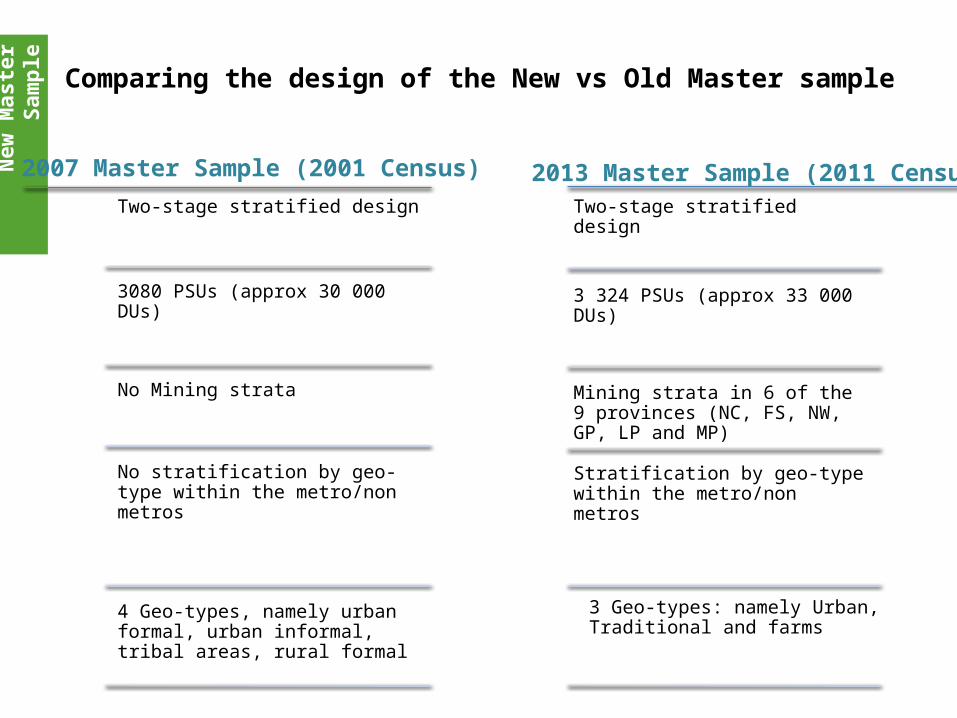
Comparing the design of the New vs Old Master sample
Two-stage stratified design
3080 PSUs (approx 30 000 DUs)
No Mining strata
No stratification by geo-type within the metro/non metros
4 Geo-types, namely urban formal, urban informal, tribal areas, rural formal
Two-stage stratified design
3 324 PSUs (approx 33 000 DUs)
Mining strata in 6 of the 9 provinces (NC, FS, NW, GP, LP and MP)
Stratification by geo-type within the metro/non metros
2007 Master Sample (2001 Census) 2013 Master Sample (2011 Census)
3 Geo-types: namely Urban, Traditional and farms
New
Mas
ter
Sam
ple
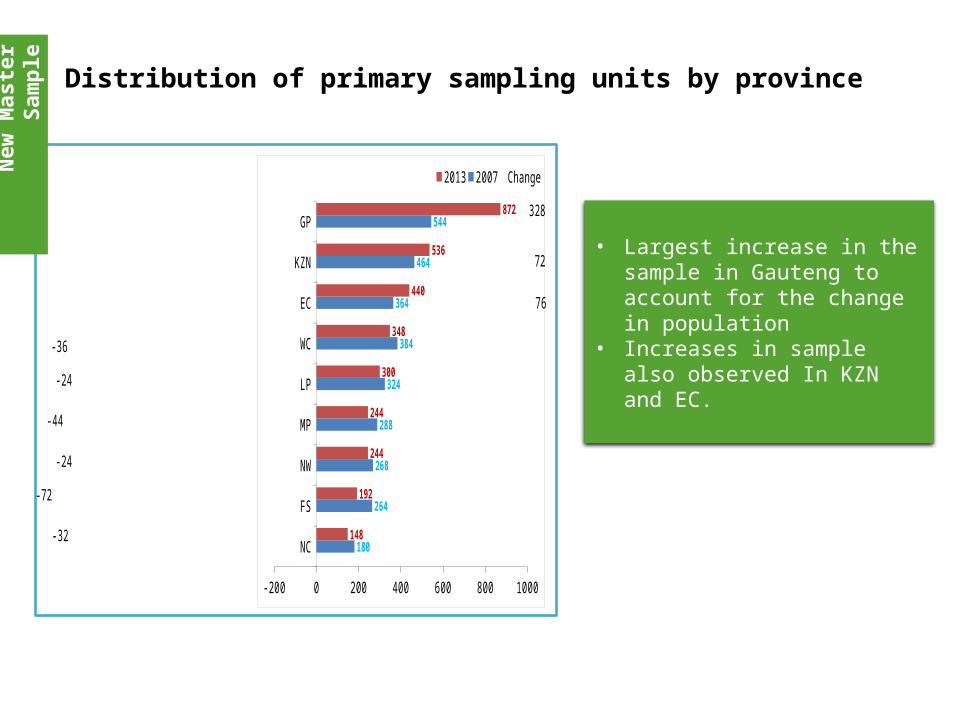
Distribution of primary sampling units by province
• Largest increase in the sample in Gauteng to account for the change in population
• Increases in sample also observed In KZN and EC.
NC
FS
NW
MP
LP
WC
EC
KZN
GP
-200 0 200 400 600 800 1000
-32
-72
-24
-44
-24
-36
76
72
328
180
264
268
288
324
384
364
464
544
148
192
244
244
300
348
440
536
872
2013 2007 Change
New
Mas
ter
Sam
ple
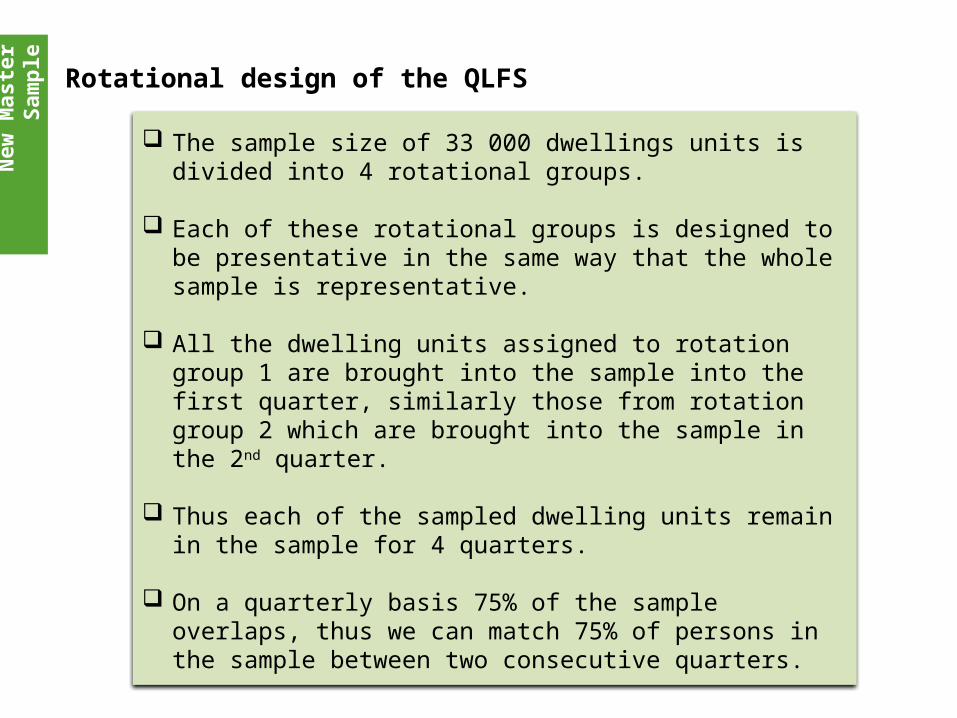
Rotational design of the QLFS
The sample size of 33 000 dwellings units is divided into 4 rotational groups.
Each of these rotational groups is designed to be presentative in the same way that the whole sample is representative.
All the dwelling units assigned to rotation group 1 are brought into the sample into the first quarter, similarly those from rotation group 2 which are brought into the sample in the 2nd quarter.
Thus each of the sampled dwelling units remain in the sample for 4 quarters.
On a quarterly basis 75% of the sample overlaps, thus we can match 75% of persons in the sample between two consecutive quarters.
New
Mas
ter
Sam
ple
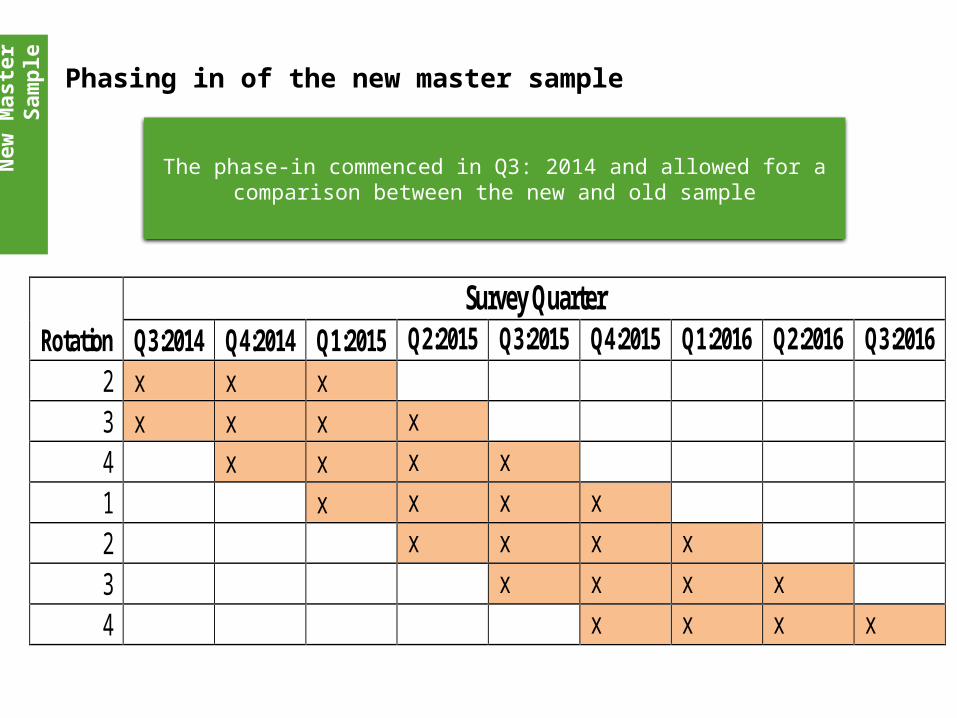
Phasing in of the new master sample
The phase-in commenced in Q3: 2014 and allowed for a comparison between the new and old sample
Rotation Survey Quarter
Q3:2014 Q4:2014 Q1:2015 Q2:2015 Q3:2015 Q4:2015 Q1:2016 Q2:2016 Q3:2016 2 x x x 3 x x x x 4 x x x x 1 x x x x 2 x x x x 3 x x x x 4 x x x x

New
Mas
ter
Sam
ple
Phasing in of the new master sample
In Q3:2014, information continued to be collected using the old sample, at the same time the new master sample was phased in as well. By Q1:
2015 the information collected was based on the new master sample
New sample phase-in 2 3Old sample 1 2 3 4
Q3: 2014Rotational groups
New sample phase-in 2 3 4Old sample 1 2 3 4
Q4: 2014Rotational groups
New sample phase-in 1 2 3 4Old sample
Q1: 2015Rotational groups
Phased out
In Q3: 2014, the overlap occurred in rotation group 2
and 3
In Q4: 2014, the overlap occurred in rotation group 2,
3 and 4
In Q1: 2015, the old sample was phased out and Q1:
2015 data collected using the new sample.
New
Mas
ter
Sam
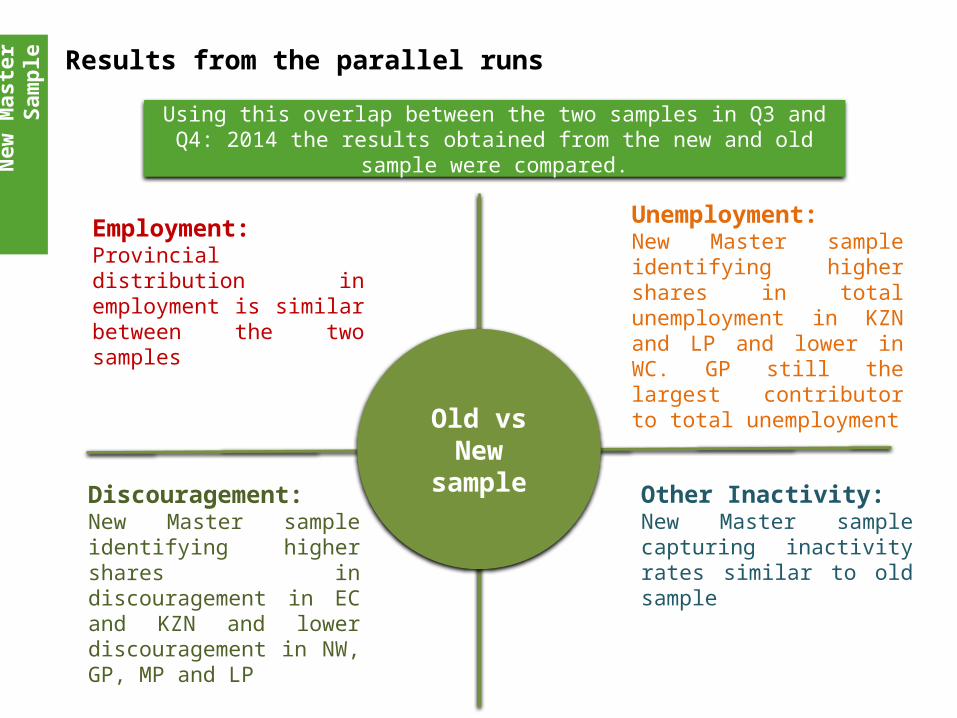
ple Results from the parallel runs
Using this overlap between the two samples in Q3 and Q4: 2014 the results obtained from the new and old sample were compared.
Employment: Provincial distribution in employment is similar between the two samples
Old vs New sample
Unemployment: New Master sample identifying higher shares in total unemployment in KZN and LP and lower in WC. GP still the largest contributor to total unemployment
Discouragement: New Master sample identifying higher shares in discouragement in EC and KZN and lower discouragement in NW, GP, MP and LP
Other Inactivity: New Master sample capturing inactivity rates similar to old sample
New
Mas
ter
Sam
ple
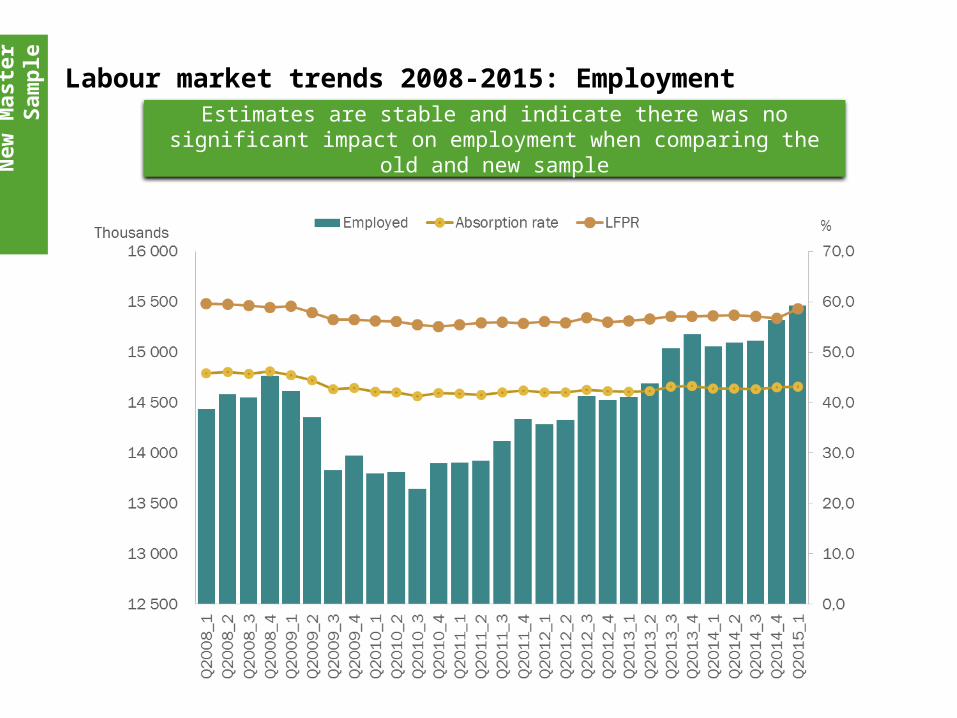
Labour market trends 2008-2015: Employment
Estimates are stable and indicate there was no significant impact on employment when comparing the old and new sample
New
Mas
ter
Sam
ple
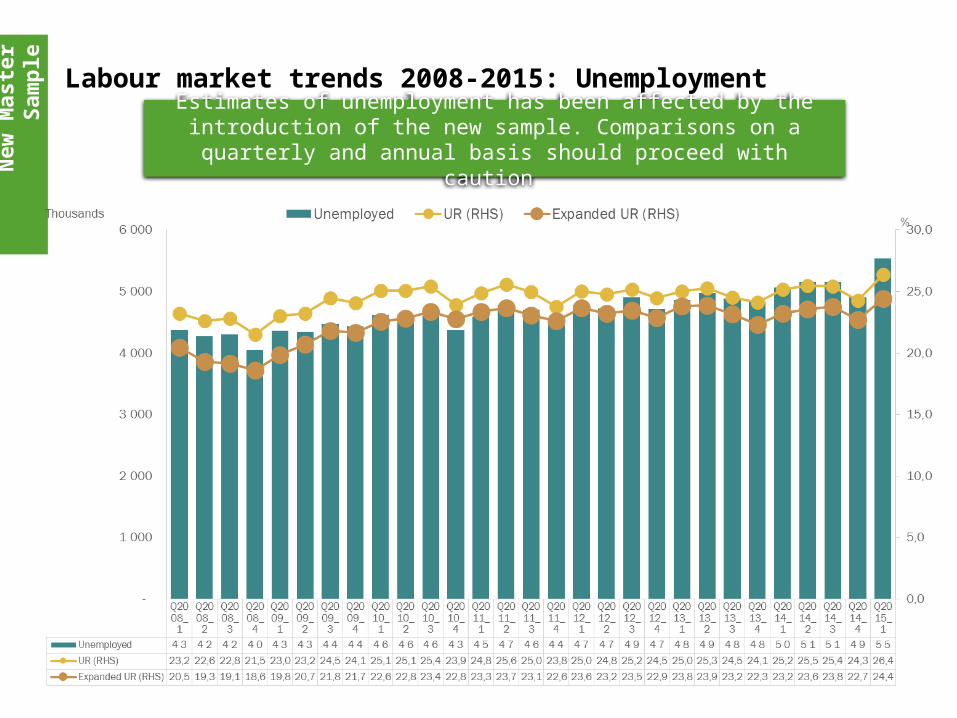
Labour market trends 2008-2015: UnemploymentEstimates of unemployment has been affected by the introduction of the
new sample. Comparisons on a quarterly and annual basis should proceed with caution
New
Mas
ter
Sam
ple
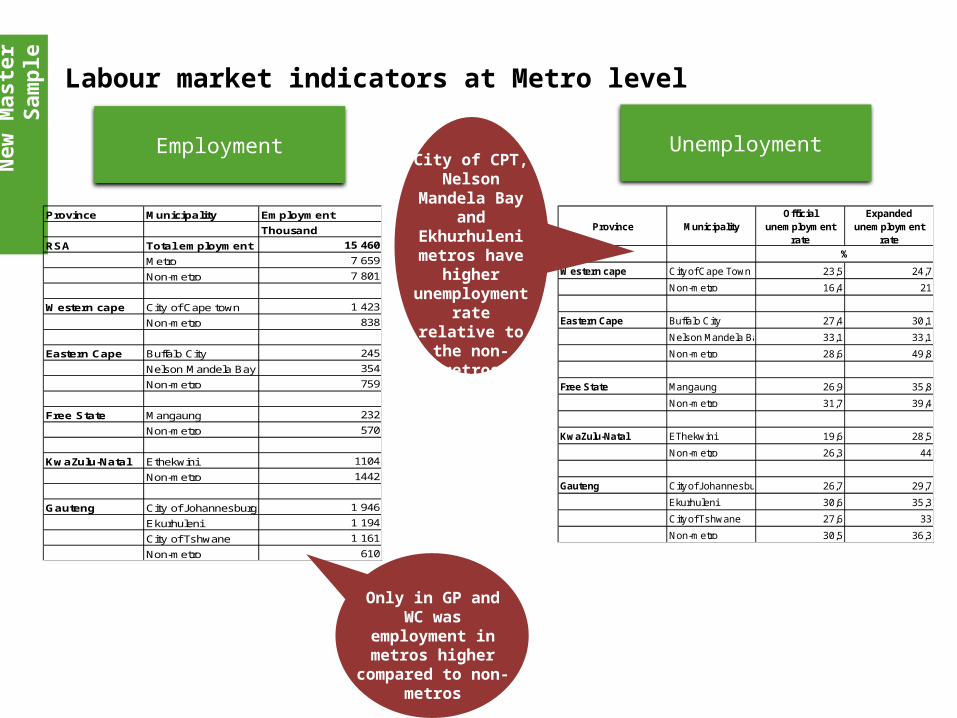
Labour market indicators at Metro level
Employment
Province Municipality Employment
Thousand
RSA Total employment 15 460
Metro 7 659
Non-metro 7 801
Western cape City of Cape town 1 423
Non-metro 838
Eastern Cape Buffalo City 245
Nelson Mandela Bay 354
Non-metro 759
Free State Mangaung 232
Non-metro 570
KwaZulu-Natal Ethekwini 1104
Non-metro 1442
Gauteng City of Johannesburg 1 946
Ekurhuleni 1 194
City of Tshwane 1 161
Non-metro 610
Unemployment
Province MunicipalityOfficial
unemployment rate
Expanded unemployment
rate
Western cape City of Cape Town 23,5 24,7
Non-metro 16,4 21
Eastern Cape Buffalo City 27,4 30,1
Nelson Mandela Bay 33,1 33,1
Non-metro 28,6 49,8
Free State Mangaung 26,9 35,8
Non-metro 31,7 39,4
KwaZulu-Natal EThekwini 19,6 28,5
Non-metro 26,3 44
Gauteng City of Johannesburg 26,7 29,7
Ekurhuleni 30,6 35,3
City of Tshwane 27,6 33
Non-metro 30,5 36,3
%
Only in GP and WC was employment in
metros higher compared to non-
metros
City of CPT, Nelson
Mandela Bay and
Ekhurhuleni metros have
higher unemployment rate relative to the non-metros
New
Mas
ter
Sam
ple
Conclusion
The updating of the old master sample using the 2011 Census brings with it efficiency gains in terms of the estimates produced.
There have been a number of improvements in the new sample including Mining estimates and estimates published at the metro level.
When comparing the old and new sample, employment estimates are stable.
The new master sample is capturing higher levels of unemployment and lower inactivity in provinces such as Gauteng. Due to the update of the master sample, the quarter on quarter and year on year comparisons may be unstable for a few quarters.
The estimates produced by the sample will be monitored over the coming quarters.
18The South Africa I know, the home I understand
QLFSL
abo
ur
Mar
ket
Q1:
2015
Results of QLFS Q1:2015
Lab
ou
r M
arke
t Q
1:20
15
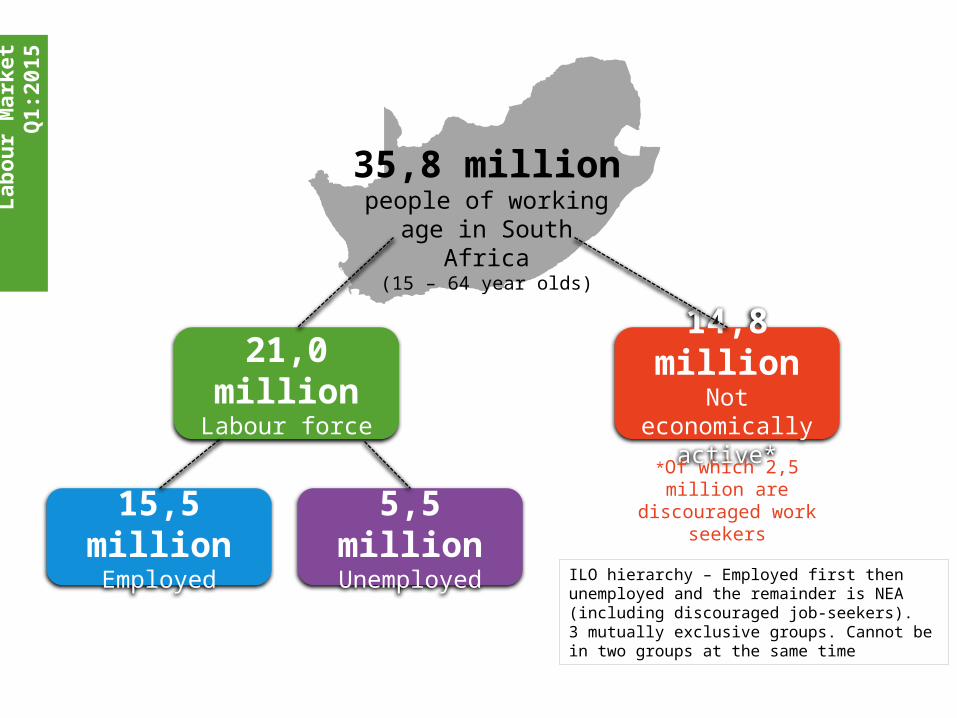
21,0 millionLabour force
15,5 millionEmployed
5,5 millionUnemployed
14,8 millionNot economically
active*
*Of which 2,5 million are discouraged work
seekers
35,8 millionpeople of working age in
South Africa(15 – 64 year olds)
ILO hierarchy – Employed first then unemployed and the remainder is NEA (including discouraged job-seekers). 3 mutually exclusive groups. Cannot be in two groups at the same time
Lab
ou
r M
arke
t Q
1:20
15
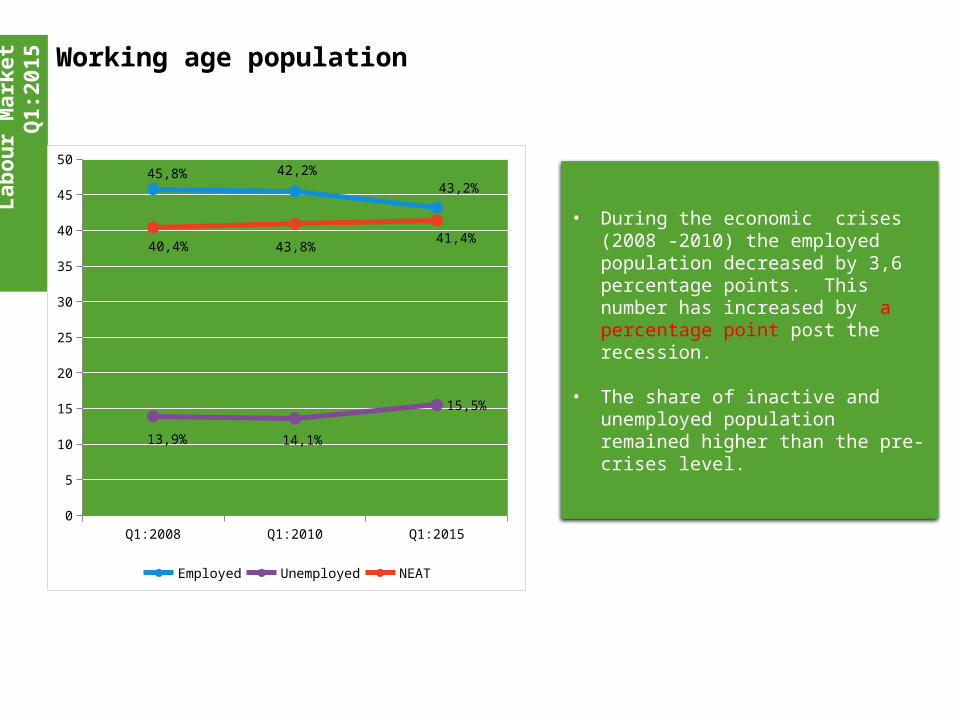
• During the economic crises (2008 -2010) the employed population decreased by 3,6 percentage points. This number has increased by a percentage point post the recession.
• The share of inactive and unemployed population remained higher than the pre-crises level.
Working age population
Q1:2008 Q1:2010 Q1:20150
5
10
15
20
25
30
35
40
45
5045,8% 42,2%
43,2%
13,9% 14,1%
15,5%
40,4% 43,8%41,4%
Employed Unemployed NEAT
Abs
orpt
ion
rate
Une
mpl
oym
ent r
ate
Lab
ou
r M
arke
t Q
1:20
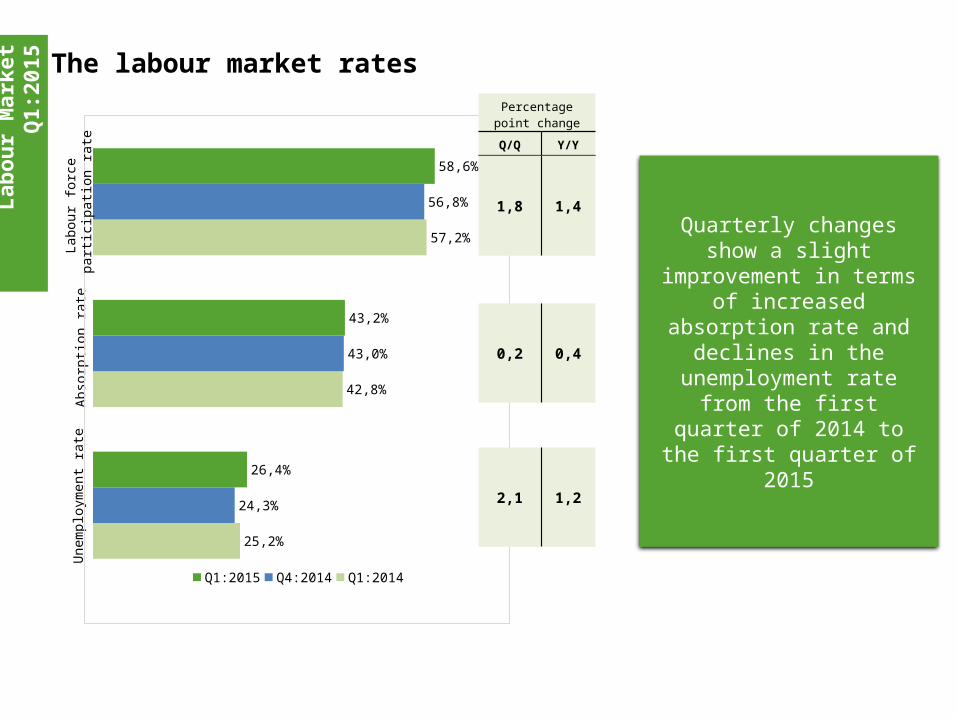
15 The labour market rates
Quarterly changes show a slight improvement in terms of increased absorption rate
and declines in the unemployment rate from the first quarter of 2014 to the
first quarter of 2015
25,2%
42,8%
57,2%
24,3%
43,0%
56,8%
26,4%
43,2%
58,6%
Q1:2015 Q4:2014 Q1:2014
Labo
ur fo
rce
part
icip
atio
n ra
tePercentage point
change
Q/Q Y/Y
1,8 1,4
0,2 0,4
2,1 1,2
Em
plo
ymen
t
Employment
2009 2010 2011 2012 2013 2014-900
-600
-300
0
300
600
900
-3.0
-2.0
-1.0
0.0
1.0
2.0
3.0
4.0
5.0
Employed GDP
Th
ou
sa
nd
%
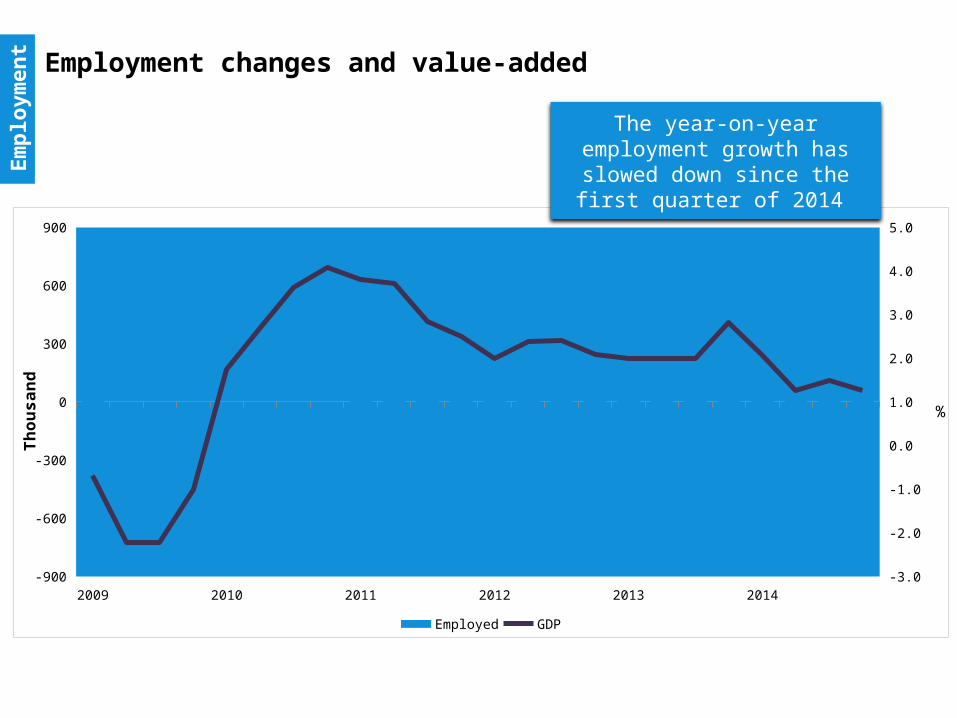
Employment changes and value-added
Em
plo
ymen
t
The year-on-year employment growth has slowed down since
the first quarter of 2014
Em
plo
ymen
t
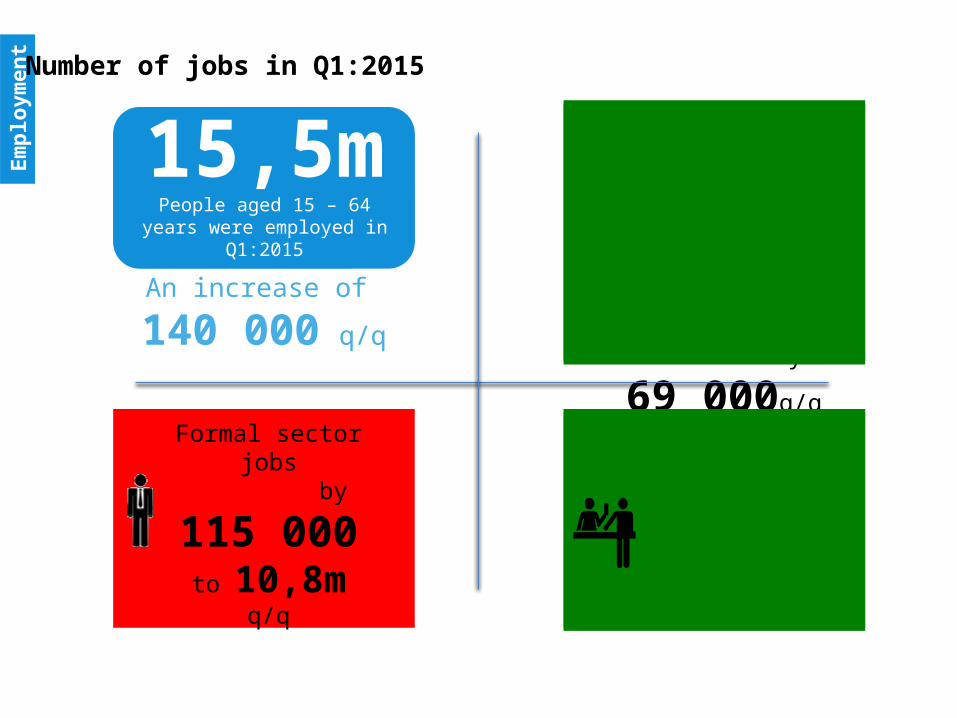
Number of jobs in Q1:2015
Jobs in the agricultural sector increased by
150 000q/qPrivate households
increased by
69 000q/q
Informal sector jobs increased by
35 000 to
2,5m q/q
15,5mPeople aged 15 – 64 years were employed in Q1:2015
An increase of
140 000 q/q
Formal sector jobs decreased by
115 000 to
10,8m q/q
15,5mPeople aged 15 – 64 years were employed in Q1:2015

EC
LP
NW
KZN
NC
MP
FS
GP
WC
RSA
33,1%
34,1%
37,8%
38,2%
40,3%
42,2%
43,0%
51,9%
53,2%
43,2%
32,7%
35,0%
39,5%
37,9%
42,1%
41,8%
41,5%
51,8%
51,4%
43,0%
Q4:2014 Q1:2015
Em
plo
ymen
t
43,2%people of working age in
South Africa(15 – 64 year olds)
Absorption rate
The Western Cape had the highest absorption rate
53,2%
33,1% The lowest absorption rate was recorded in the Eastern Cape
Percentage point change
q/q
0,2
1,8
0,1
1,5
0,4
-1,8
0,3
-1,7
-0,9
0,4
Em
plo
ymen
t
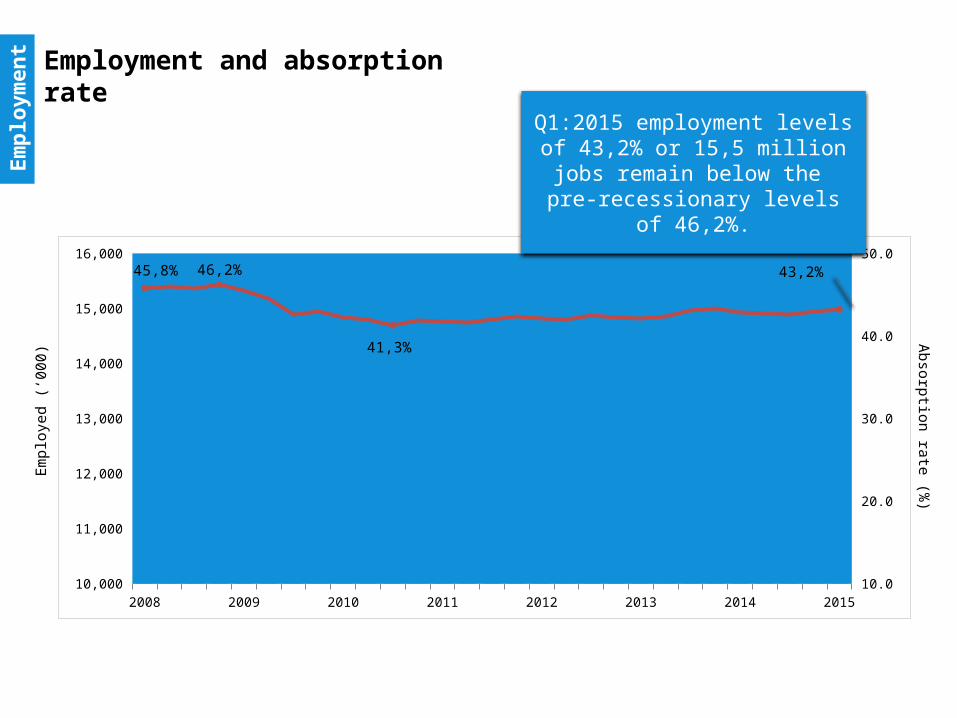
Employment and absorption rate
2008 2009 2010 2011 2012 2013 2014 201510,000
11,000
12,000
13,000
14,000
15,000
16,000
10.0
20.0
30.0
40.0
50.045,8% 46,2%
41,3%
43,2%
Q1:2015 employment levels of 43,2% or 15,5 million jobs remain
below the pre-recessionary levels of 46,2%.
Em
ploy
ed (
‘000
) Absorption rate (%
)
Em
plo
ymen
t
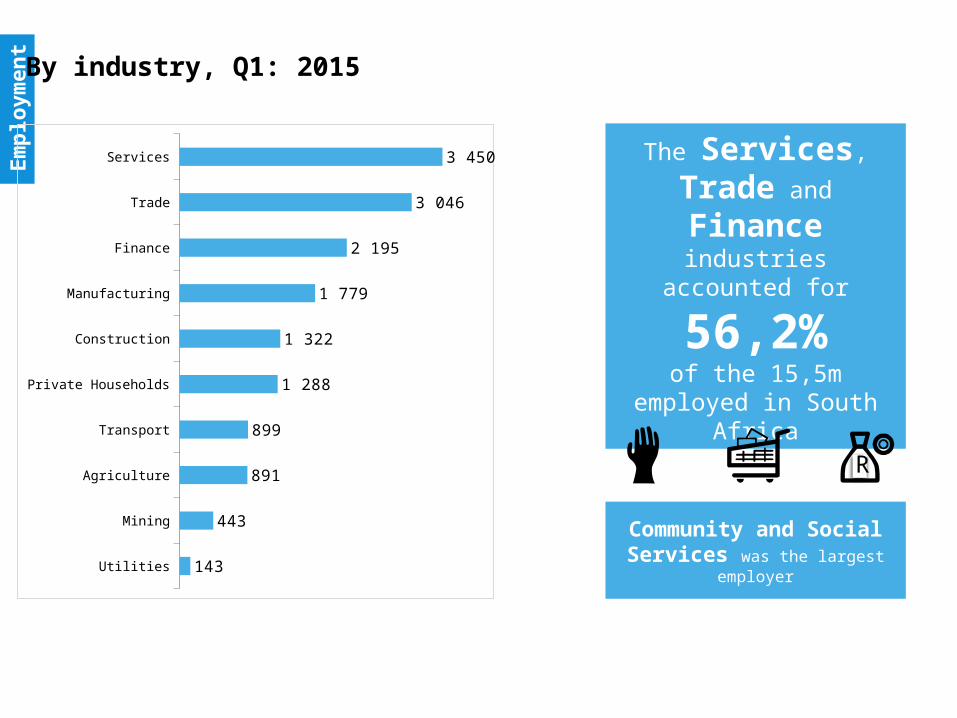
By industry, Q1: 2015
Community and Social Services was the largest employer
The Services, Trade
and Finance industries accounted for
56,2%of the 15,5m employed in
South Africa
Utilities
Mining
Agriculture
Transport
Private Households
Construction
Manufacturing
Finance
Trade
Services
143
443
891
899
1 288
1 322
1 779
2 195
3 046
3 450
R
Em
plo
ymen
t
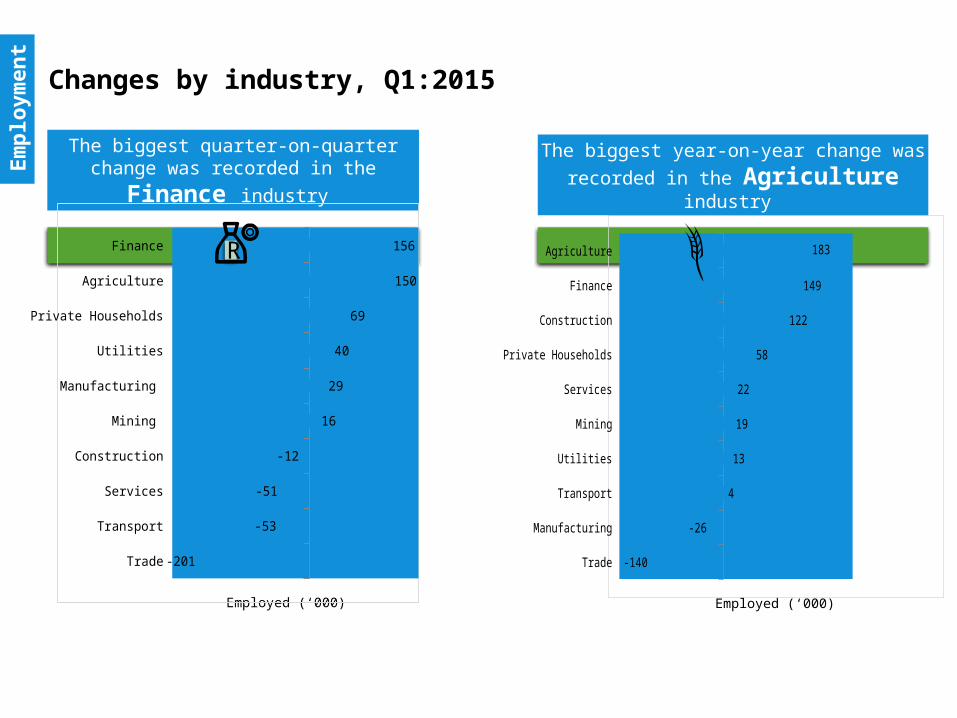
Changes by industry, Q1:2015
The biggest quarter-on-quarter change was
recorded in the Finance industry
Employed (‘000)
Trade
Manufacturing
Transport
Utilities
Mining
Services
Private Households
Construction
Finance
Agriculture
-140
-26
4
13
19
22
58
122
149
183
The biggest year-on-year change was
recorded in the Agriculture industry
Trade
Transport
Services
Construction
Mining
Manufacturing
Utilities
Private Households
Agriculture
Finance
-201
-53
-51
-12
16
29
40
69
150
156
Employed (‘000)
R
Em
plo
ymen
t
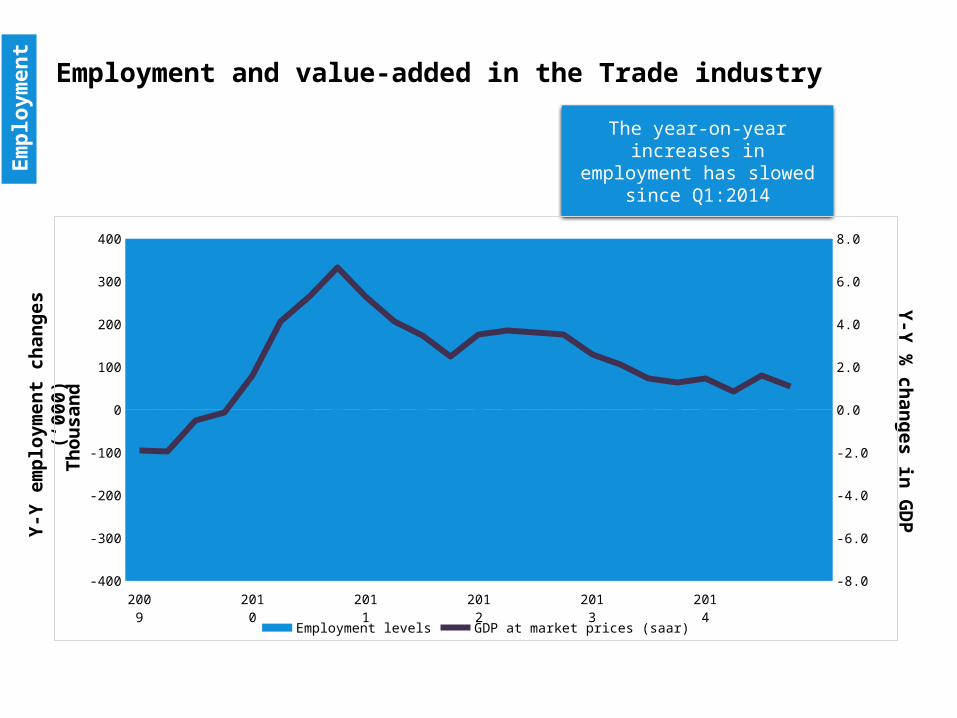
Employment and value-added in the Trade industry
Y-Y
em
plo
ymen
t ch
ang
es (
‘000
)Y
-Y %
chan
ge
s in G
DP
The year-on-year increases in employment has slowed since
Q1:2014
2009
2010
2011
2012
2013
2014
-400
-300
-200
-100
0
100
200
300
400
-8.0
-6.0
-4.0
-2.0
0.0
2.0
4.0
6.0
8.0
Employment levels GDP at market prices (saar)
Th
ou
sa
nd
Em
plo
ymen
t
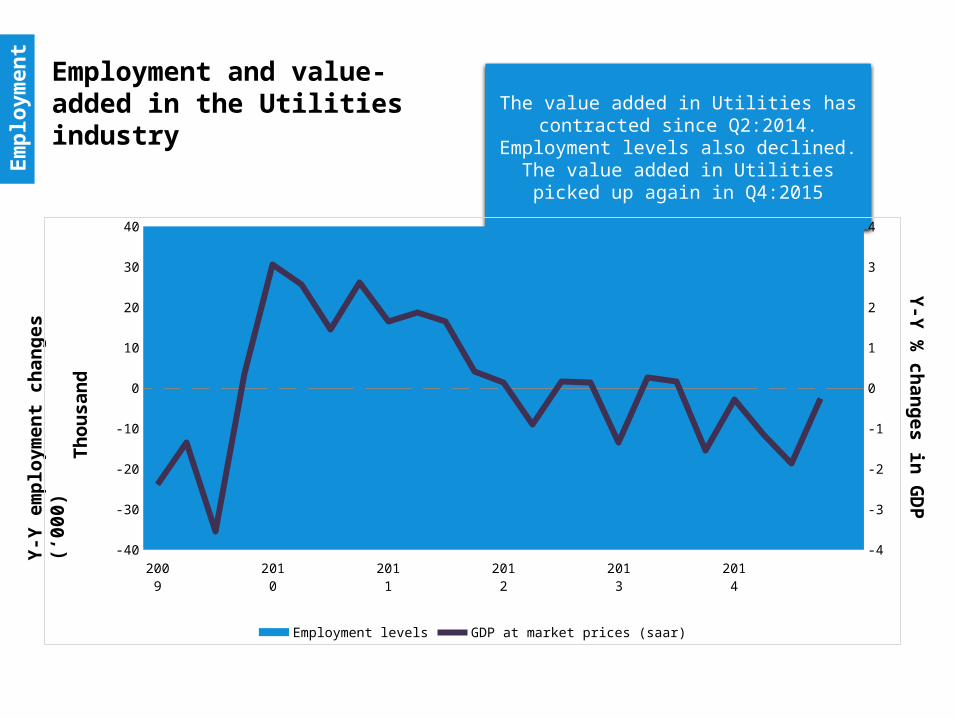
The value added in Utilities has contracted since Q2:2014. Employment levels also
declined. The value added in Utilities picked up again
in Q4:2015
Y-Y
em
plo
ymen
t ch
ang
es (
‘000
)Y
-Y %
chan
ge
s in G
DP
2009 2010 2011 2012 2013 2014-40
-30
-20
-10
0
10
20
30
40
-4
-3
-2
-1
0
1
2
3
4
Employment levels GDP at market prices (saar)
Th
ou
sa
nd
Employment and value-added in the Utilities industry
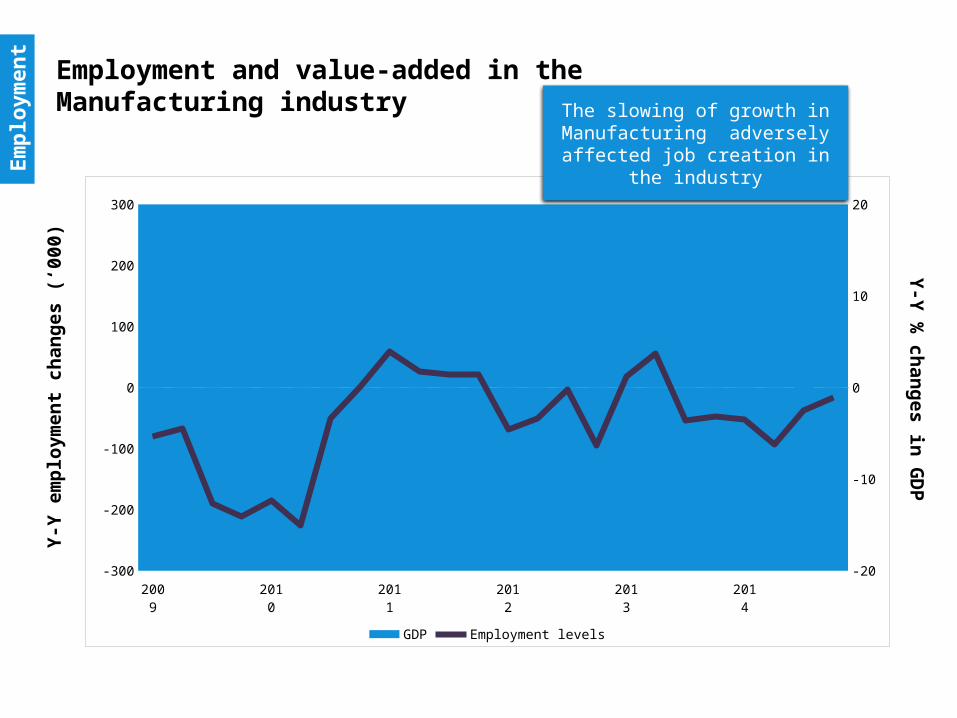
Employment and value-added in the Manufacturing industry
Y-Y
em
plo
ymen
t ch
ang
es (
‘000
)Y
-Y %
chan
ge
s in G
DP
2009 2010 2011 2012 2013 2014-300
-200
-100
0
100
200
300
-20
-10
0
10
20
GDP Employment levels
Em
plo
ymen
t
The slowing of growth in Manufacturing adversely affected
job creation in the industry
So
urc
es o
f fo
rmal
sec
tor
emp
loym
ent
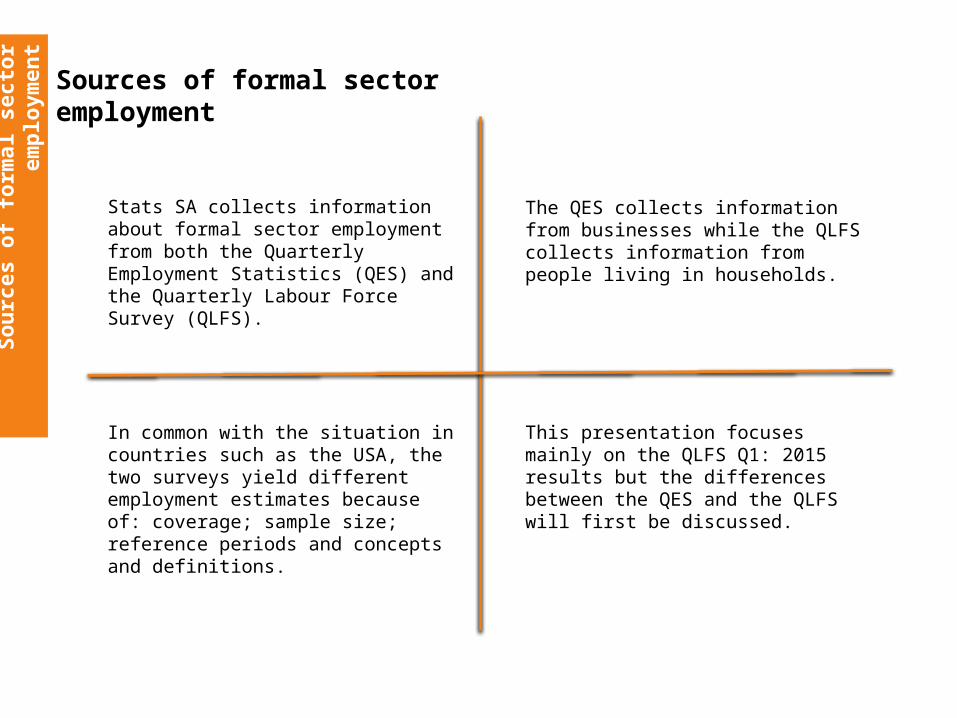
Sources of formal sector employment
Stats SA collects information about formal sector employment from both the Quarterly Employment Statistics (QES) and the Quarterly Labour Force Survey (QLFS).
The QES collects information from businesses while the QLFS collects information from people living in households.
In common with the situation in countries such as the USA, the two surveys yield different employment estimates because of: coverage; sample size; reference periods and concepts and definitions.
This presentation focuses mainly on the QLFS Q1: 2015 results but the differences between the QES and the QLFS will first be discussed.
So
urc
es o
f fo
rmal
sec
tor
emp
loym
ent
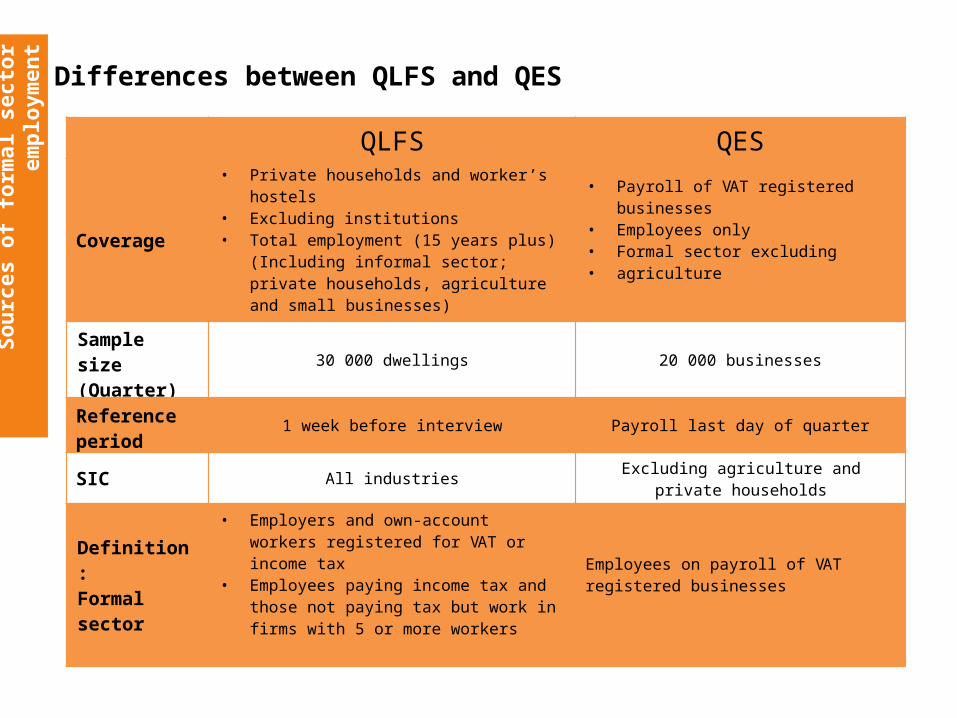
Differences between QLFS and QESQLFS QES
QLFS QES
Coverage
• Private households and worker’s hostels• Excluding institutions• Total employment (15 years plus) (Including
informal sector; private households, agriculture and small businesses)
• Payroll of VAT registered businesses• Employees only• Formal sector excluding • agriculture
Sample size(Quarter)
30 000 dwellings 20 000 businesses
Reference period
1 week before interview Payroll last day of quarter
SIC All industriesExcluding agriculture and private
households
Definition:Formal sector
• Employers and own-account workers registered for VAT or income tax
• Employees paying income tax and those not paying tax but work in firms with 5 or more workers
Employees on payroll of VAT registered businesses
So
urc
es o
f fo
rmal
sec
tor
emp
loym
ent
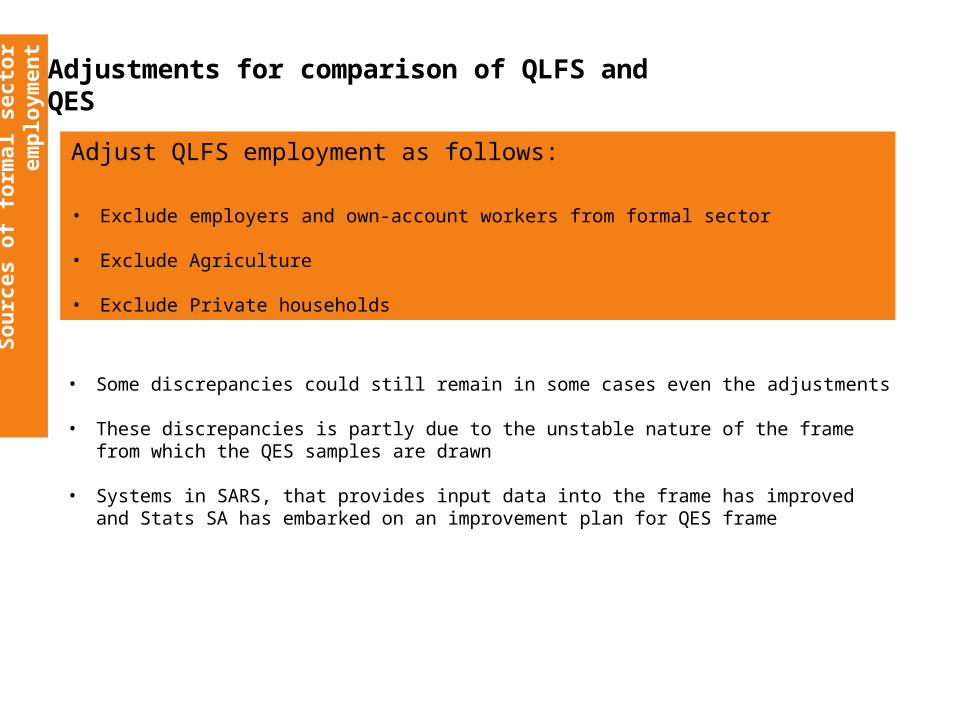
Adjustments for comparison of QLFS and QES
• Some discrepancies could still remain in some cases even the adjustments
• These discrepancies is partly due to the unstable nature of the frame from which the QES samples are drawn
• Systems in SARS, that provides input data into the frame has improved and Stats SA has embarked on an improvement plan for QES frame
Adjust QLFS employment as follows:
• Exclude employers and own-account workers from formal sector
• Exclude Agriculture
• Exclude Private households
So
urc
es o
f fo
rmal
sec
tor
emp
loym
ent
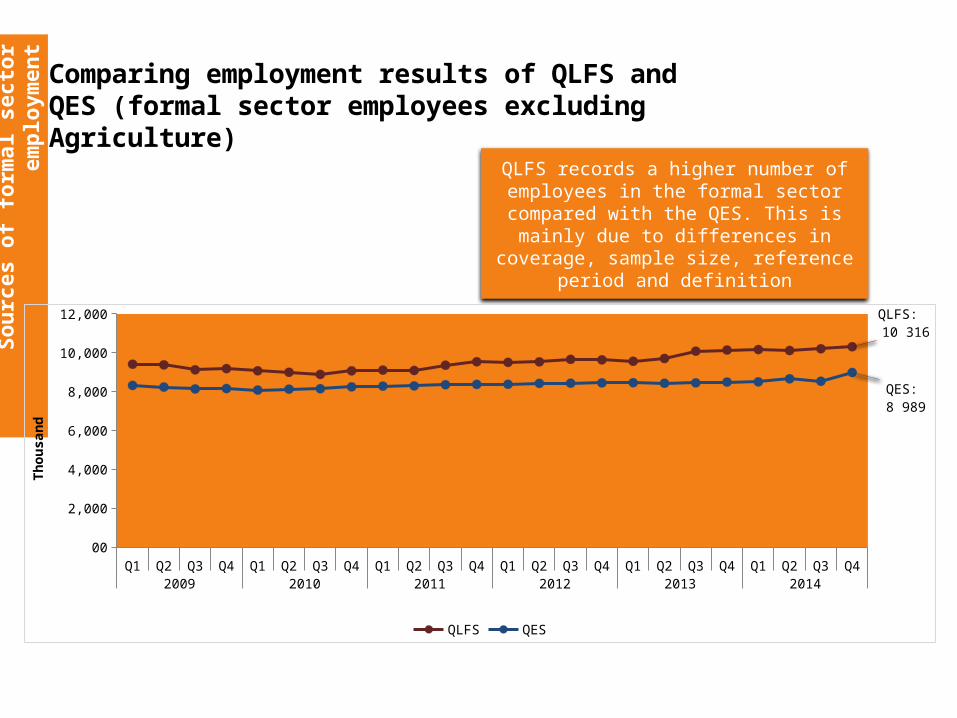
Comparing employment results of QLFS and QES (formal sector employees excluding Agriculture)
QLFS records a higher number of employees in the formal sector compared
with the QES. This is mainly due to differences in coverage, sample size,
reference period and definition
Q1 Q2 Q3 Q4 Q1 Q2 Q3 Q4 Q1 Q2 Q3 Q4 Q1 Q2 Q3 Q4 Q1 Q2 Q3 Q4 Q1 Q2 Q3 Q42009 2010 2011 2012 2013 2014
00
2,000
4,000
6,000
8,000
10,000
12,000 QLFS: 10 316
QES: 8 989
QLFS QES
Th
ou
san
d
Fo
rmal
& In
form
al s
ecto
r em
plo
ymen
t
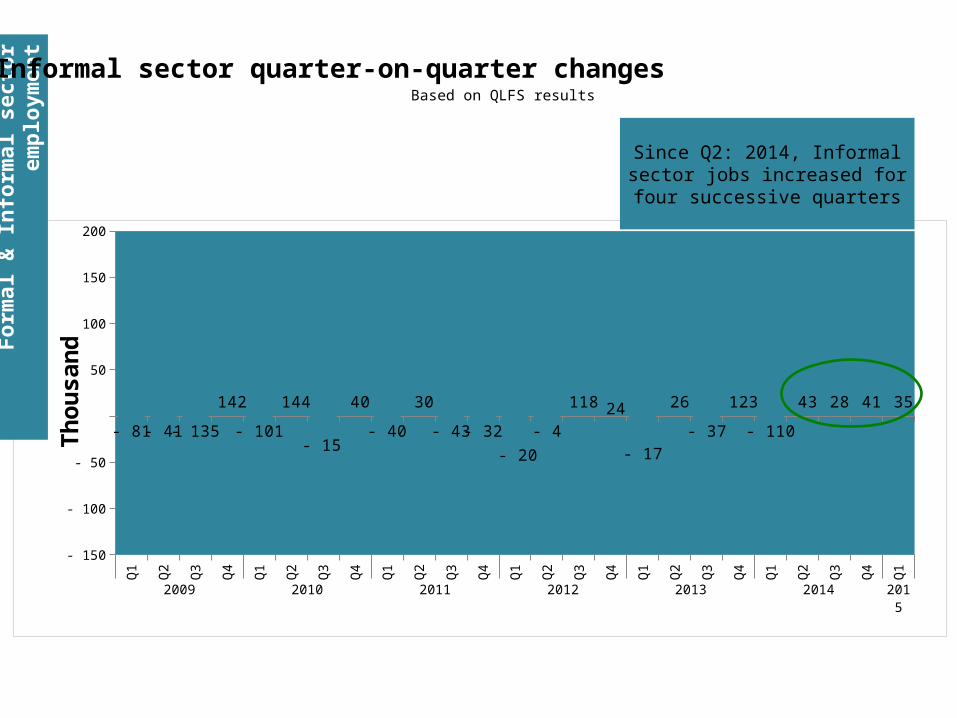
Based on QLFS results
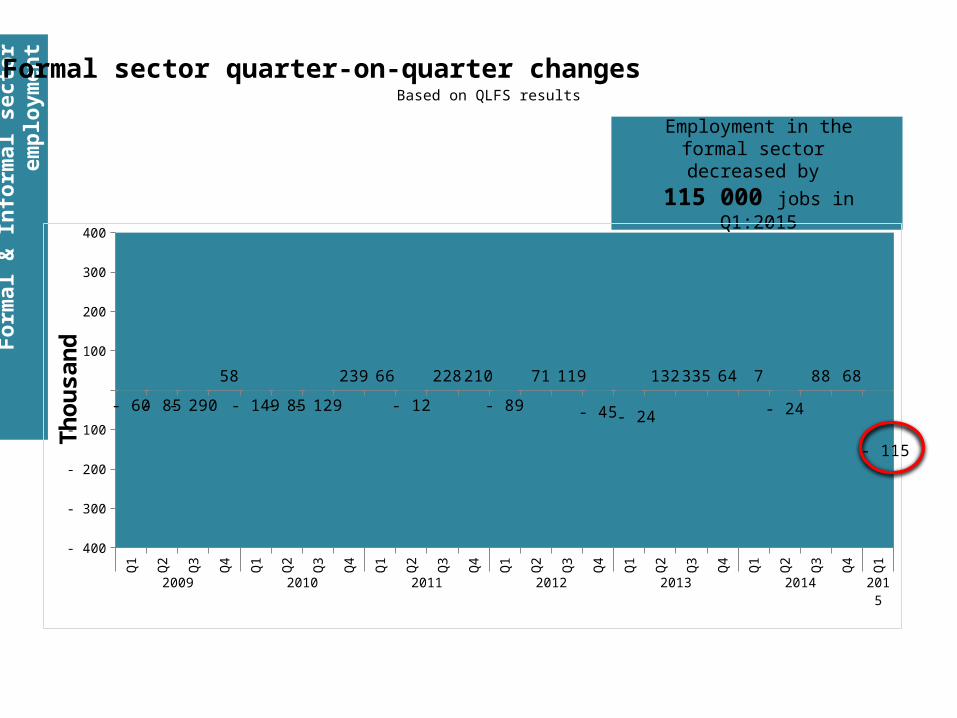
Formal sector quarter-on-quarter changes
Employment in the formal sector decreased by
115 000 jobs in Q1:2015
Q1 Q2 Q3 Q4 Q1 Q2 Q3 Q4 Q1 Q2 Q3 Q4 Q1 Q2 Q3 Q4 Q1 Q2 Q3 Q4 Q1 Q2 Q3 Q4 Q12009 2010 2011 2012 2013 2014 2015
- 400
- 300
- 200
- 100
100
200
300
400
- 60 - 85- 290
58
- 149- 85- 129
239 66
- 12
228 210
- 89
71 119
- 45 - 24
132 335 64 7
- 24
88 68
- 115Th
ou
san
d
Fo
rmal
& In
form
al s
ecto
r em
plo
ymen
t
Based on QLFS results
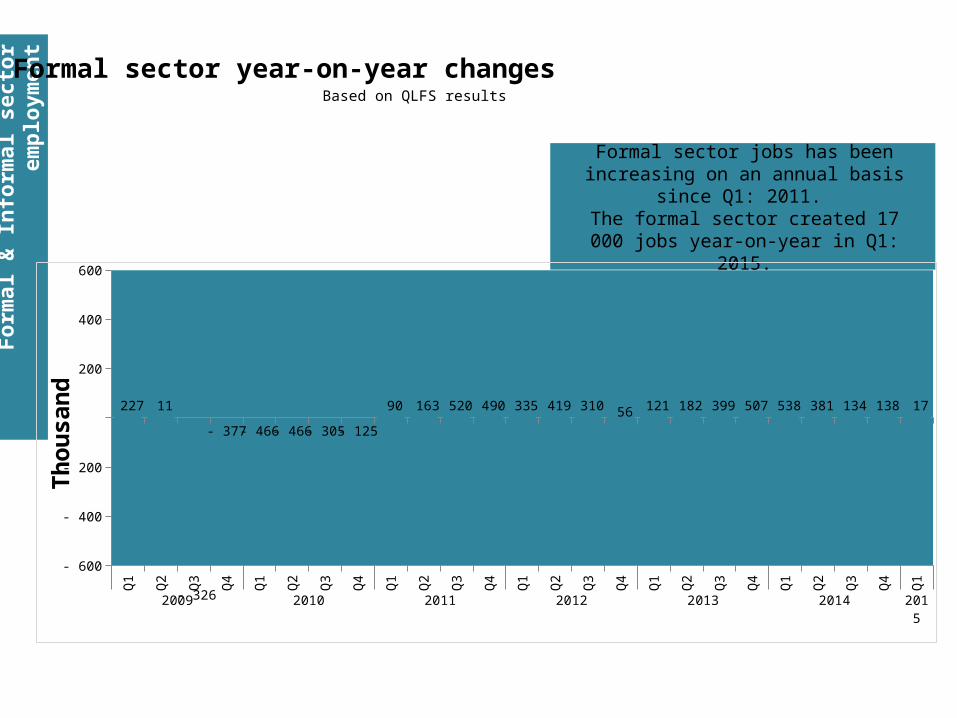
Formal sector year-on-year changes
Formal sector jobs has been increasing on an annual basis since Q1: 2011.
The formal sector created 17 000 jobs year-on-year in Q1: 2015.
Q1 Q2 Q3 Q4 Q1 Q2 Q3 Q4 Q1 Q2 Q3 Q4 Q1 Q2 Q3 Q4 Q1 Q2 Q3 Q4 Q1 Q2 Q3 Q4 Q12009 2010 2011 2012 2013 2014 2015
- 600
- 400
- 200
200
400
600
227 11
- 326
- 377 - 466 - 466 - 305 - 125
90 163 520 490 335 419 310 56 121 182 399 507 538 381 134 138 17
Th
ou
san
d
Fo
rmal
& In
form
al s
ecto
r em
plo
ymen
t
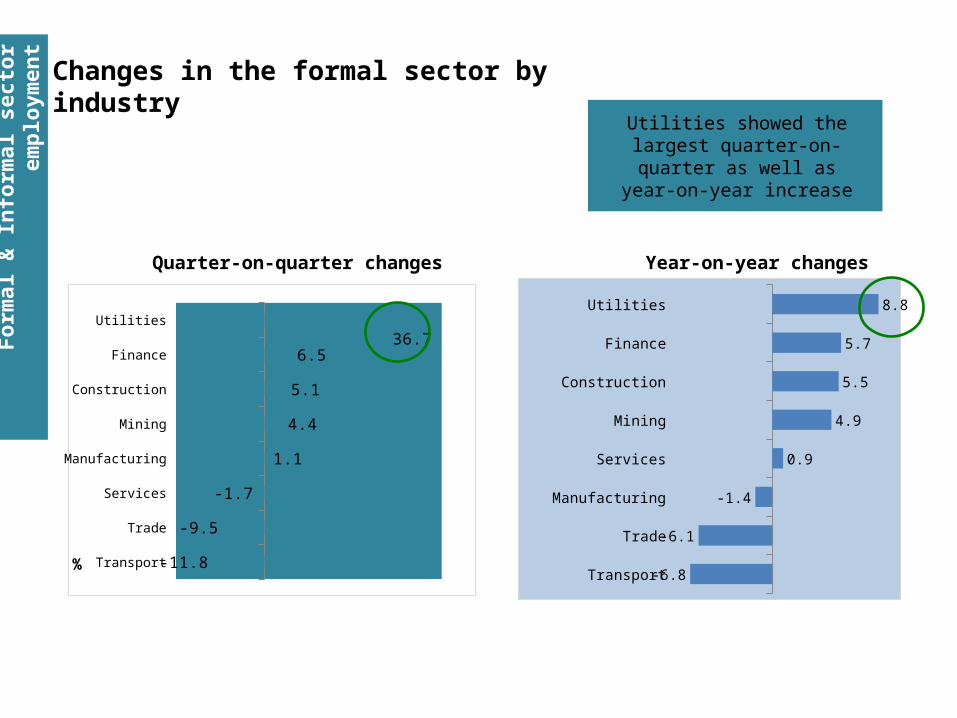
Changes in the formal sector by industry
Utilities showed the largest quarter-on-quarter as well as
year-on-year increase
Quarter-on-quarter changes Year-on-year changes
Transport
Trade
Services
Manufacturing
Mining
Construction
Finance
Utilities
-11.8
-9.5
-1.7
1.1
4.4
5.1
6.536.7
% Transport
Trade
Manufacturing
Services
Mining
Construction
Finance
Utilities
-6.8
-6.1
-1.4
0.9
4.9
5.5
5.7
8.8
Q1 Q2 Q3 Q4 Q1 Q2 Q3 Q4 Q1 Q2 Q3 Q4 Q1 Q2 Q3 Q4 Q1 Q2 Q3 Q4 Q1 Q2 Q3 Q4 Q12009 2010 2011 2012 2013 2014 2015
- 150
- 100
- 50
50
100
150
200
- 81 - 41- 135
142
- 101
144
- 15
40
- 40
30
- 43 - 32
- 20
- 4
118 24
- 17
26
- 37
123
- 110
43 28 41 35
Th
ou
san
d
Fo
rmal
& In
form
al s
ecto
r em
plo
ymen
t
Based on QLFS results
Informal sector quarter-on-quarter changes
Since Q2: 2014, Informal sector jobs increased for four successive
quarters
Fo
rmal
& In
form
al s
ecto
r em
plo
ymen
t
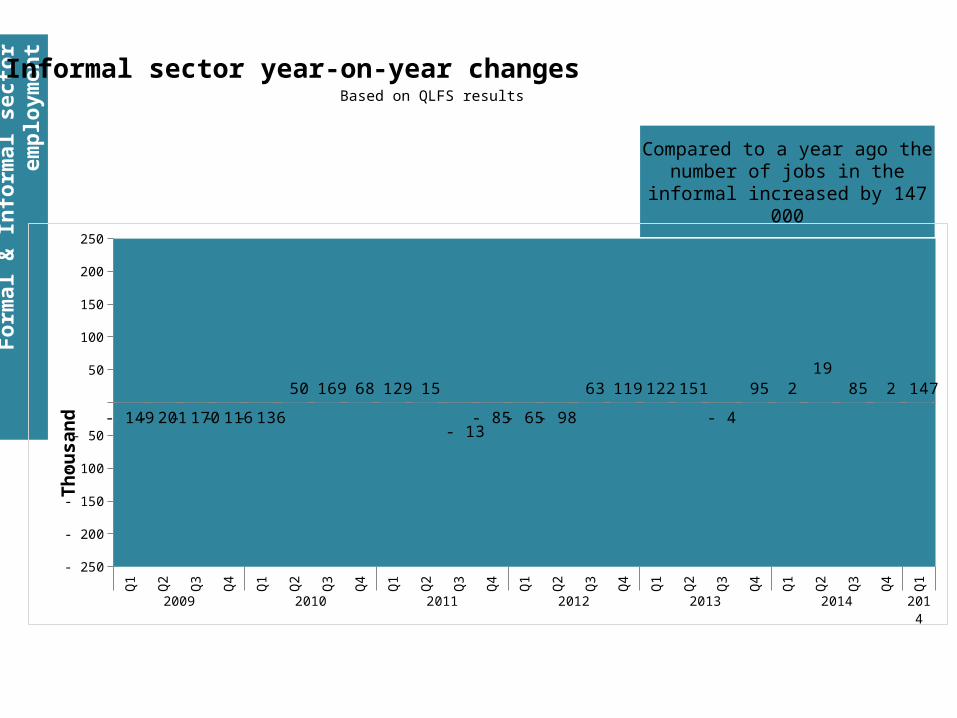
Based on QLFS results
Informal sector year-on-year changes
Compared to a year ago the number of jobs in the informal
increased by 147 000
Q1 Q2 Q3 Q4 Q1 Q2 Q3 Q4 Q1 Q2 Q3 Q4 Q1 Q2 Q3 Q4 Q1 Q2 Q3 Q4 Q1 Q2 Q3 Q4 Q12009 2010 2011 2012 2013 2014 2014
- 250
- 200
- 150
- 100
- 50
50
100
150
200
250
- 149- 201- 170- 116- 136
50 169 68 129 15
- 13- 85 - 65 - 98
63 119 122 151
- 4
95 2 19
85 2 147
Th
ou
sa
nd
Fo
rmal
& In
form
al s
ecto
r em
plo
ymen
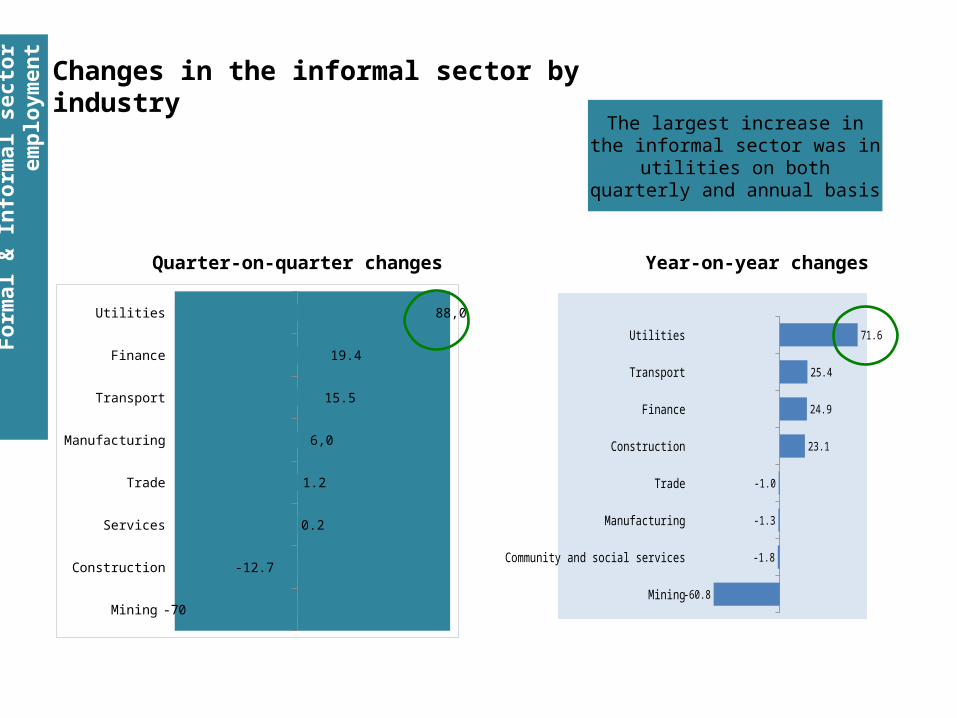
t
The largest increase in the informal sector was in utilities on both quarterly and annual basis
Quarter-on-quarter changes Year-on-year changes
Changes in the informal sector by industry
Mining
Construction
Services
Trade
Manufacturing
Transport
Finance
Utilities
-70
-12.7
0.2
1.2
6,0
15.5
19.4
88,0
Mining
Community and social services
Manufacturing
Trade
Construction
Finance
Transport
Utilities
-60.8
-1.8
-1.3
-1.0
23.1
24.9
25.4
71.6
Un
emp
loym
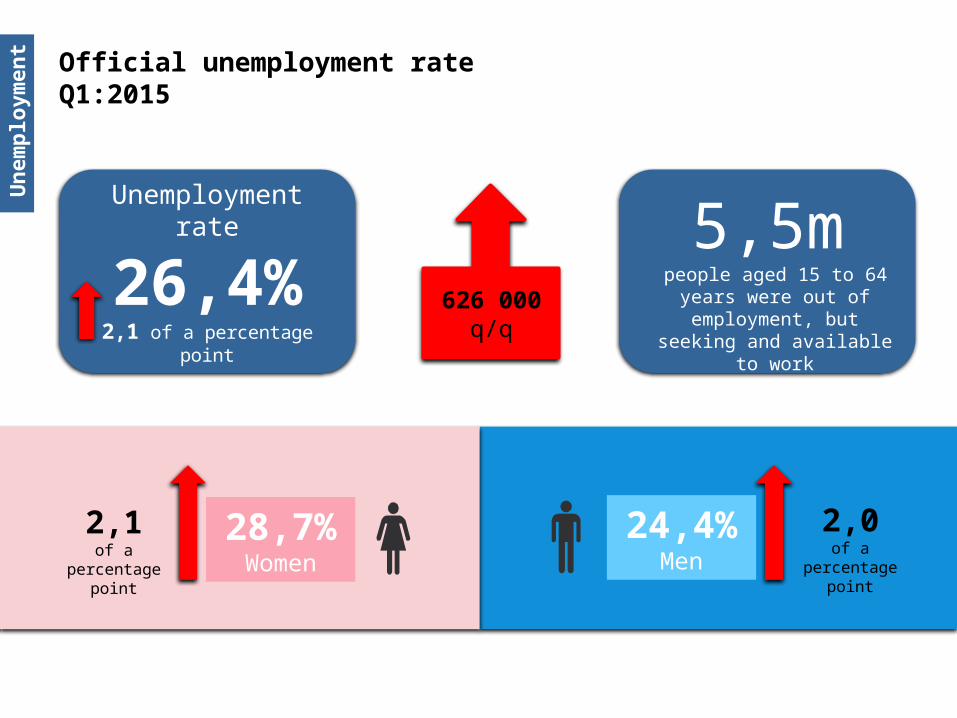
ent
Official unemployment rate Q1:2015
28,7%Women
2,1of a percentage
point
24,4%Men
2,0of a percentage
point
Unemployment rate
26,4%2,1 of a percentage point
626 000q/q
5,5mpeople aged 15 to 64
years were out of employment, but seeking
and available to work
Un
emp
loym
ent
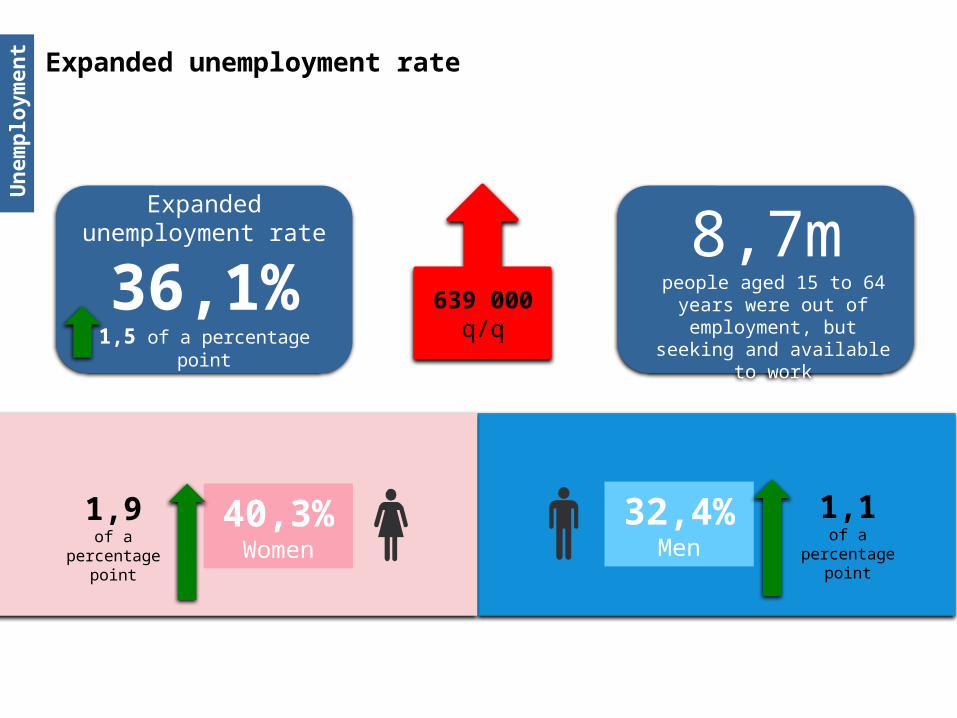
Expanded unemployment rate
40,3%Women
1,9of a percentage
point
32,4%Men
1,1of a percentage
point
639 000q/q
Expanded unemployment rate
36,1%1,5 of a percentage point
8,7mpeople aged 15 to 64
years were out of employment, but seeking
and available to work
Un
emp
loym
ent
2008 2009 2010 2011 2012 2013 2014 20150.0
5.0
10.0
15.0
20.0
25.0
30.0
35.0
40.0
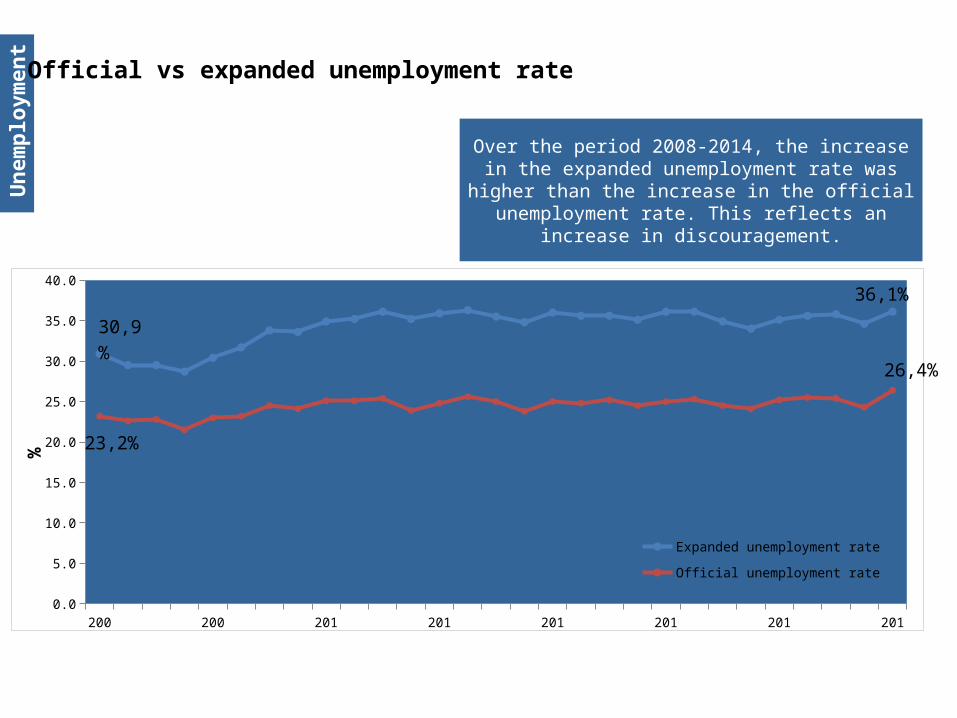
23,2%
26,4%
Expanded unemployment rate
Official unemployment rate
%
30,9%
36,1%
Over the period 2008-2014, the increase in the expanded unemployment rate was higher than the
increase in the official unemployment rate. This reflects an increase in discouragement.
Official vs expanded unemployment rate
LP
WC
KZN
NW
GP
MP
EC
FS
NC
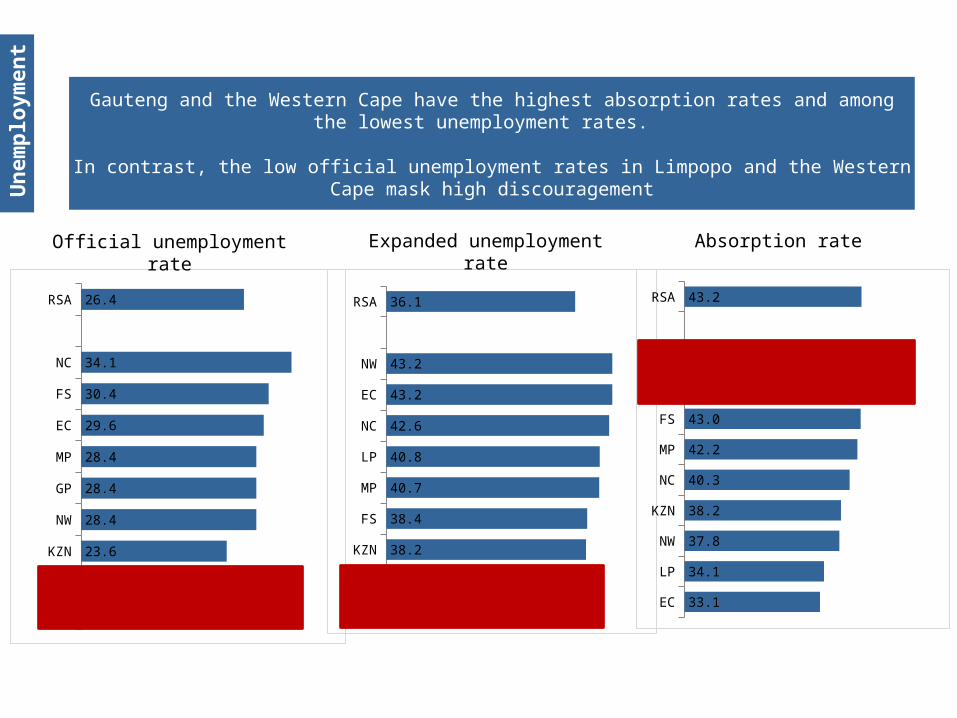
RSA
20.1
21.0
23.6
28.4
28.4
28.4
29.6
30.4
34.1
26.4
WC
GP
KZN
FS
MP
LP
NC
EC
NW
RSA
23.3
32.8
38.2
38.4
40.7
40.8
42.6
43.2
43.2
36.1
EC
LP
NW
KZN
NC
MP
FS
GP
WC
RSA
33.1
34.1
37.8
38.2
40.3
42.2
43.0
51.9
53.2
43.2
Un
emp
loym
ent
Gauteng and the Western Cape have the highest absorption rates and among the lowest unemployment rates.
In contrast, the low official unemployment rates in Limpopo and the Western Cape mask high discouragement
Expanded unemployment rate Absorption rateOfficial unemployment rate

Inactivity

Definition of inactivity
Those who do not meet the criteria of employment and unemployment are classified as the not economically active population
Inac
tivi
ty
Discouraged job-seekers
Other not economically inactive
Inactive population
Wanted to work and available to work but did not search for job due to:1. No jobs available in area.2. Unable to find for skills.3. Lost hope of finding a job.
Wanted to work but not available due to reasons such as:• Retired• Scholar/student• Housewife.• Too old/young to
work
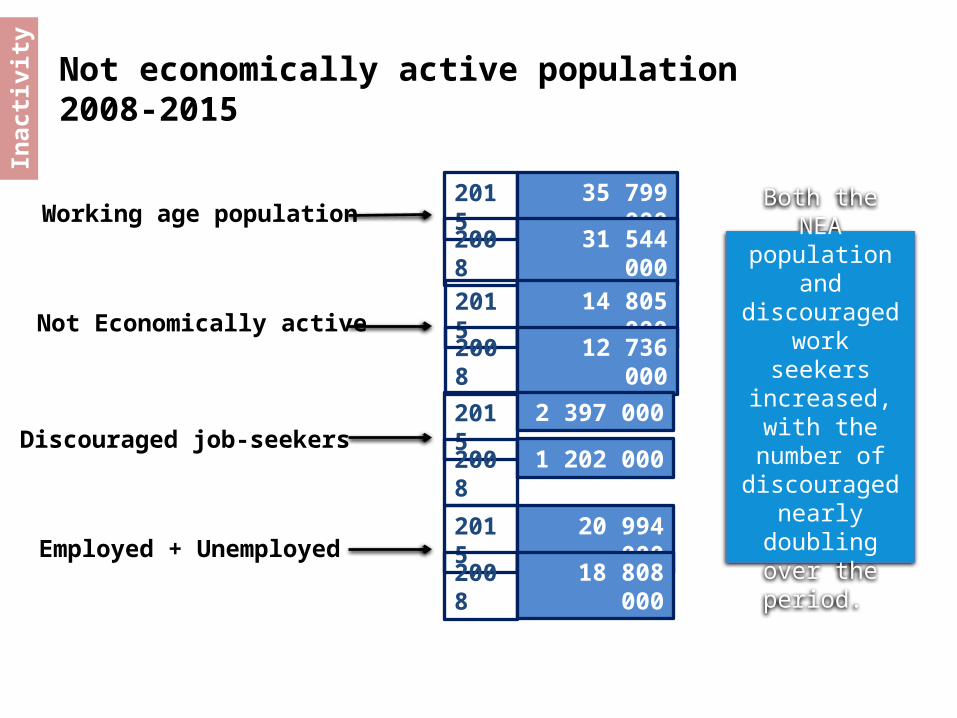
Not economically active population 2008-2015
Inac
tivi
ty
Working age population2015
Discouraged job-seekers
Employed + Unemployed
35 799 000
2008 31 544 000
Not Economically active2015 14 805 000
2008 12 736 000
2015 2 397 000
2008 1 202 000
2015 20 994 000
2008 18 808 000
Both the NEA population and discouraged work seekers
increased, with the number of discouraged
nearly doubling over the period.
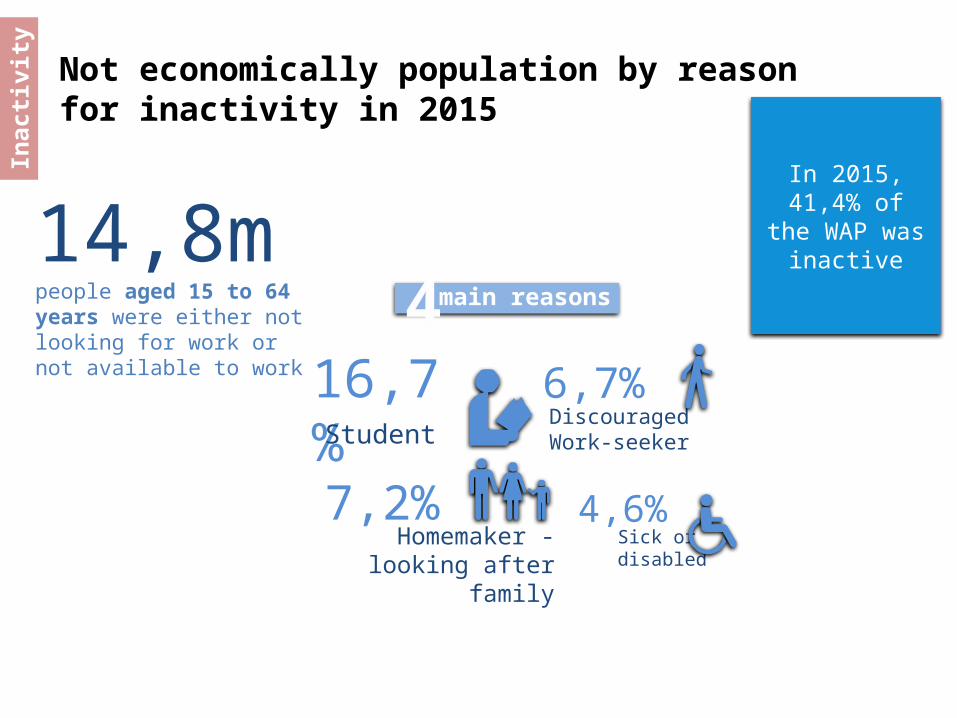
Not economically population by reason for inactivity in 2015
Inac
tivi
ty
In 2015, 41,4% of the WAP was
inactive
main reasons4
Homemaker - looking after family
16,7%7,2%
Sick or disabled
4,6%
DiscouragedWork-seeker
6,7%Student
14,8mpeople aged 15 to 64 years were either not looking for work or not available to work
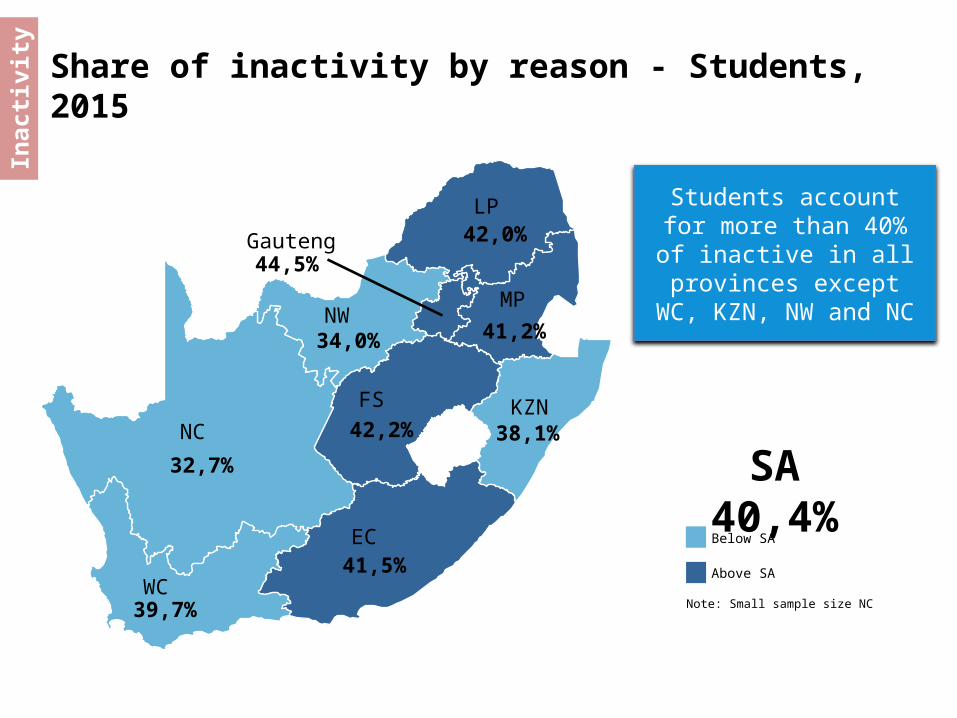
Share of inactivity by reason - Students, 2015
Students account for more than 40% of inactive in all
provinces except WC, KZN, NW and NC
Gauteng44,5%
EC41,5%
KZN38,1%
WC39,7%
FS
42,2%
NW34,0%
LP42,0%
41,2%
MP
NC
32,7% SA 40,4%
Note: Small sample size NC
Below SA
Above SA
Inac
tivi
ty
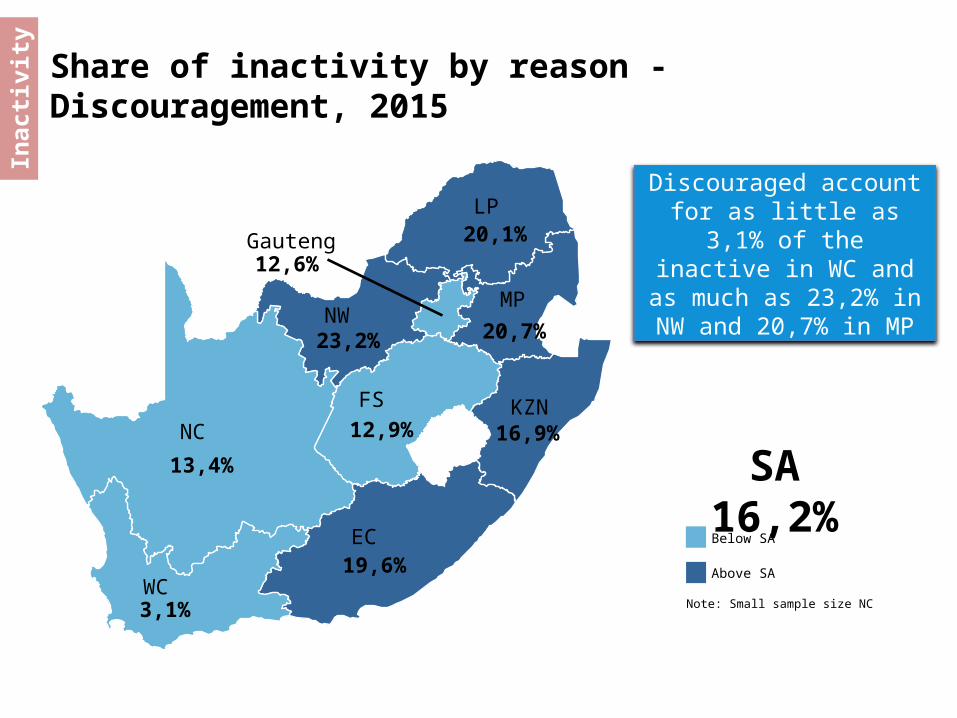
Share of inactivity by reason - Discouragement, 2015
Discouraged account for as little as 3,1% of the inactive in WC and as
much as 23,2% in NW and 20,7% in MP
Gauteng12,6%
EC19,6%
KZN16,9%
WC3,1%
FS
12,9%
NW23,2%
LP20,1%
20,7%
MP
NC
13,4% SA 16,2%
Note: Small sample size NC
Below SA
Above SA
Inac
tivi
ty
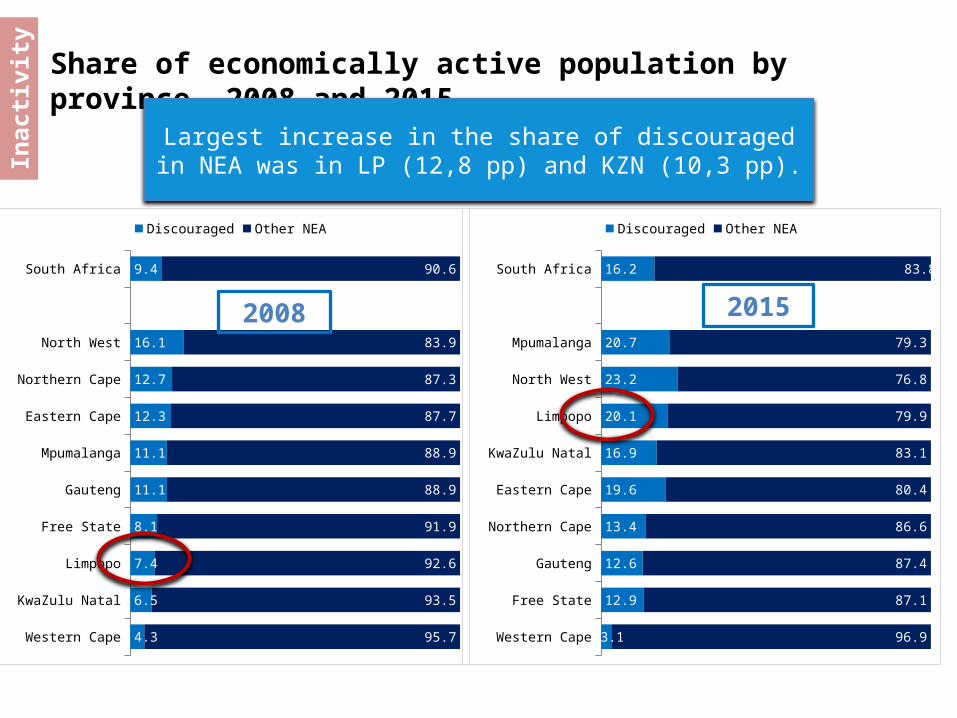
Share of economically active population by province, 2008 and 2015
Largest increase in the share of discouraged in NEA was in LP (12,8 pp) and KZN (10,3 pp).
Inac
tivi
ty
Western Cape
KwaZulu Natal
Limpopo
Free State
Gauteng
Mpumalanga
Eastern Cape
Northern Cape
North West
South Africa
4.3
6.5
7.4
8.1
11.1
11.1
12.3
12.7
16.1
9.4
95.7
93.5
92.6
91.9
88.9
88.9
87.7
87.3
83.9
90.6
Discouraged Other NEA
2008 2015
Western Cape
Free State
Gauteng
Northern Cape
Eastern Cape
KwaZulu Natal
Limpopo
North West
Mpumalanga
South Africa
3.1
12.9
12.6
13.4
19.6
16.9
20.1
23.2
20.7
16.2
96.9
87.1
87.4
86.6
80.4
83.1
79.9
76.8
79.3
83.8
Discouraged Other NEA
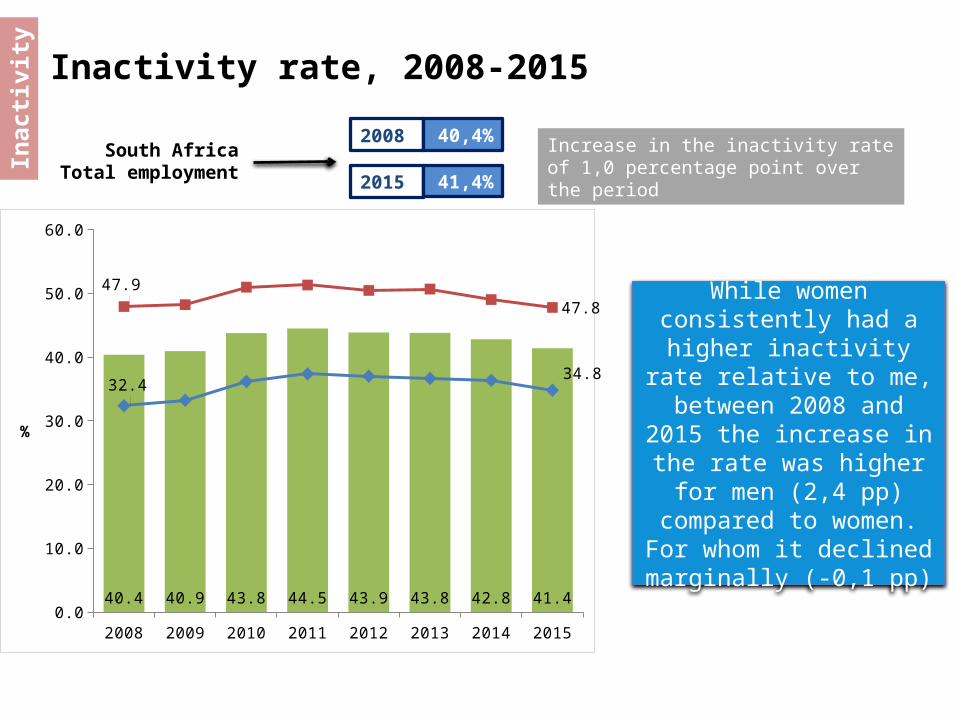
Inactivity rate, 2008-2015
Inac
tivi
ty
2008 40,4%
2015 41,4%
South Africa Total employment
Increase in the inactivity rate of 1,0 percentage point over the period
While women consistently had a higher inactivity rate
relative to me, between 2008 and 2015 the
increase in the rate was higher for men (2,4 pp)
compared to women. For whom it declined marginally
(-0,1 pp)
2008 2009 2010 2011 2012 2013 2014 20150.0
10.0
20.0
30.0
40.0
50.0
60.0
40.4 40.9 43.8 44.5 43.9 43.8 42.8 41.4
32.434.8
47.9
47.8
%
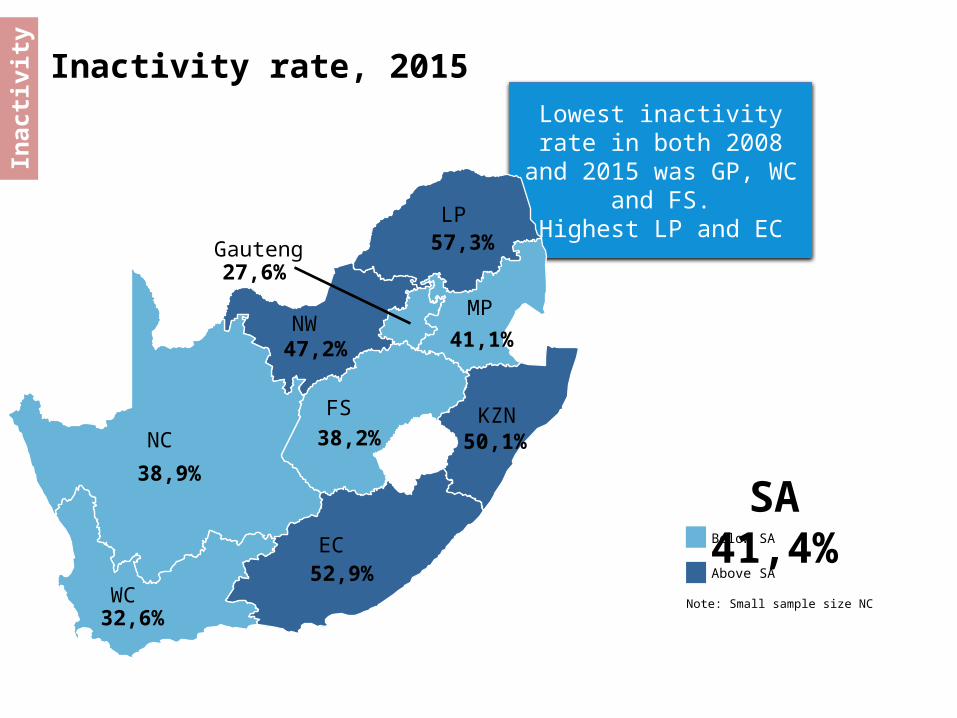
Inactivity rate, 2015
Lowest inactivity rate in both 2008 and 2015 was
GP, WC and FS.Highest LP and EC
Gauteng27,6%
EC52,9%
KZN50,1%
WC32,6%
FS
38,2%
NW47,2%
LP57,3%
41,1%
MP
NC
38,9%
SA 41,4%
Note: Small sample size NC
Below SA
Above SA
Inac
tivi
ty
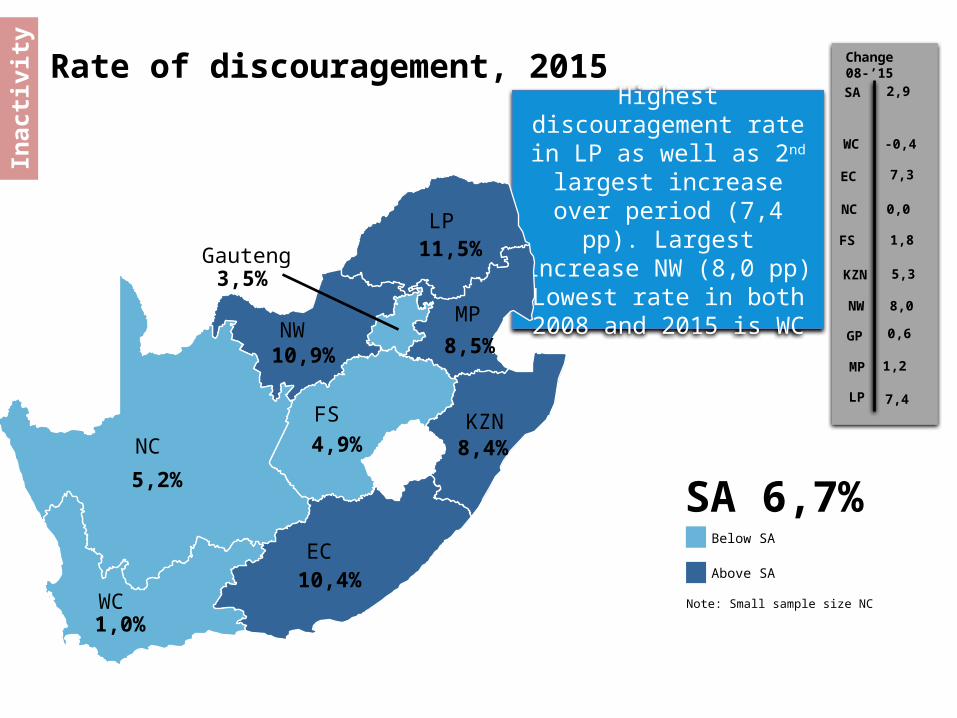
Rate of discouragement, 2015
Highest discouragement rate in LP as well as 2nd
largest increase over period (7,4 pp). Largest increase NW (8,0 pp)
Lowest rate in both 2008 and 2015 is WC
Gauteng3,5%
EC10,4%
KZN8,4%
WC1,0%
FS
4,9%
NW10,9%
LP11,5%
8,5%
MP
NC
5,2%SA 6,7%
Note: Small sample size NC
Below SA
Above SA
Inac
tivi
ty Change 08-’15
2,9
-0,4
7,3
0,0
1,8
5,3
8,0
0,6
1,2
7,4
SA
WC
EC
NC
FS
KZN
NW
GP
MP
LP
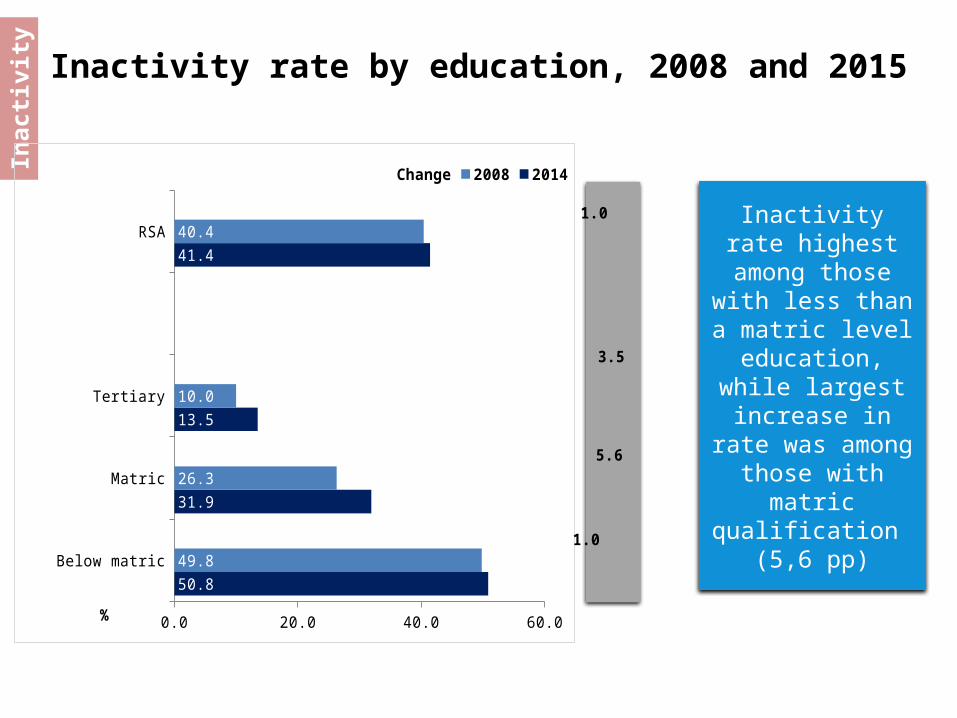
Inactivity rate by education, 2008 and 2015
Inac
tivi
ty
Inactivity rate highest among those with less
than a matric level education, while
largest increase in rate was among those with matric qualification (5,6
pp)
Below matric
Matric
Tertiary
RSA
0.0 20.0 40.0 60.0
50.8
31.9
13.5
41.4
49.8
26.3
10.0
40.4
1.0
5.6
3.5
1.0
Change 2008 2014
%
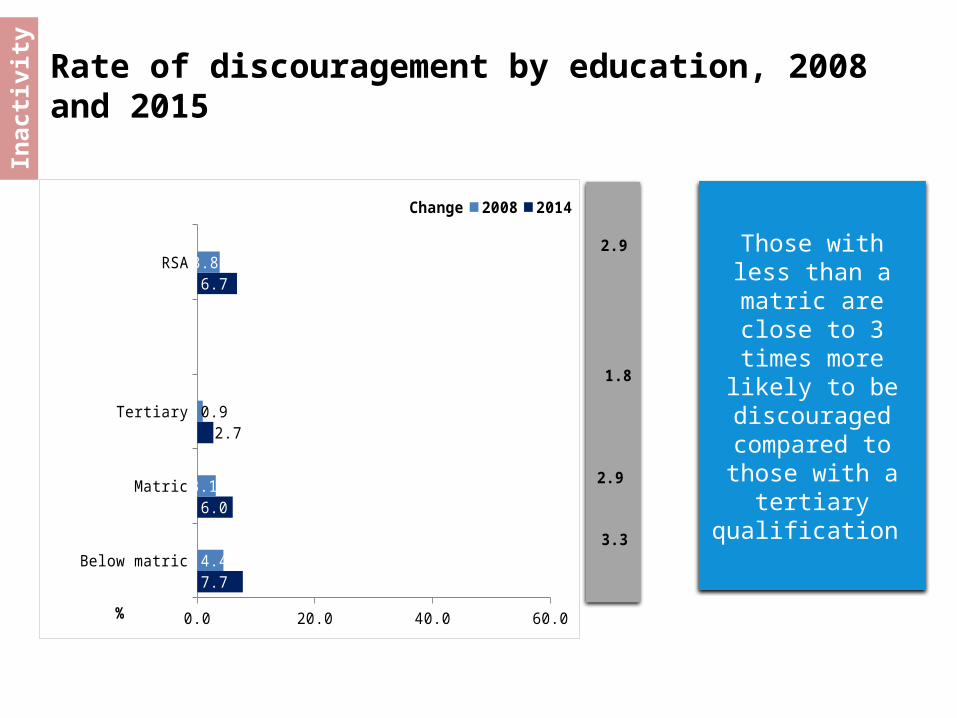
Rate of discouragement by education, 2008 and 2015
Inac
tivi
ty
Those with less than a matric are close to 3 times more likely to be
discouraged compared to those
with a tertiary qualification
Below matric
Matric
Tertiary
RSA
0.0 20.0 40.0 60.0
7.7
6.0
2.7
6.7
4.4
3.1
0.9
3.8
3.3
2.9
1.8
2.9
Change 2008 2014
%
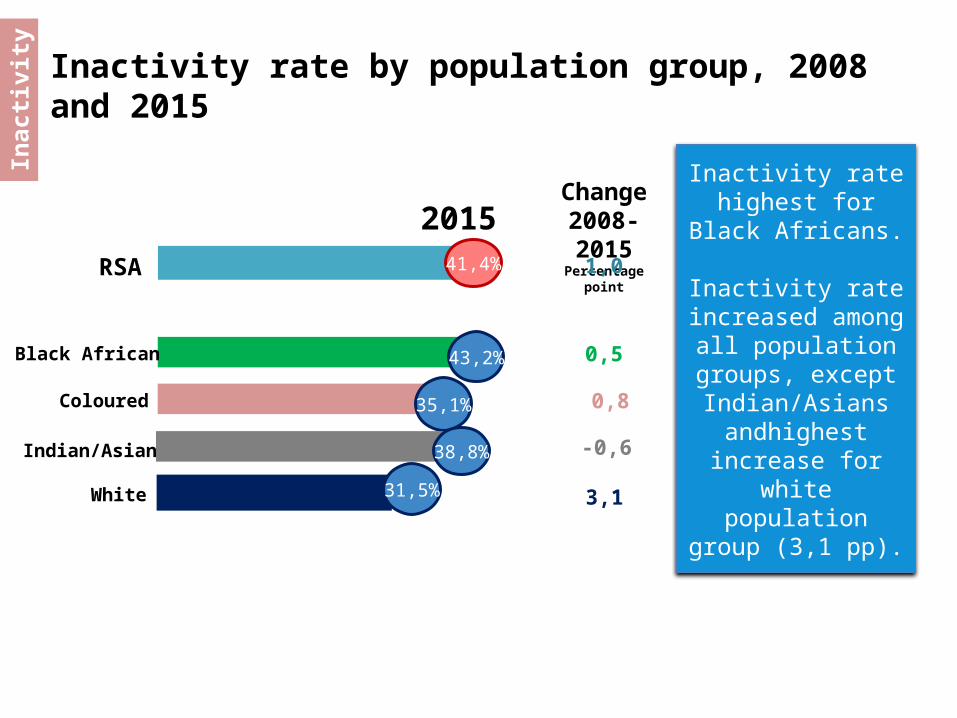
Inactivity rate by population group, 2008 and 2015
Inac
tivi
ty
Inactivity rate highest for Black
Africans.
Inactivity rate increased among all population groups,
except Indian/Asians andhighest increase for white population
group (3,1 pp).
2015
RSA
Coloured
41,4%
43,2%
35,1%
Black African
Indian/Asian 38,8%
White 31,5%
Change 2008-2015Percentage point
1,0
0,5
0,8
-0,6
3,1
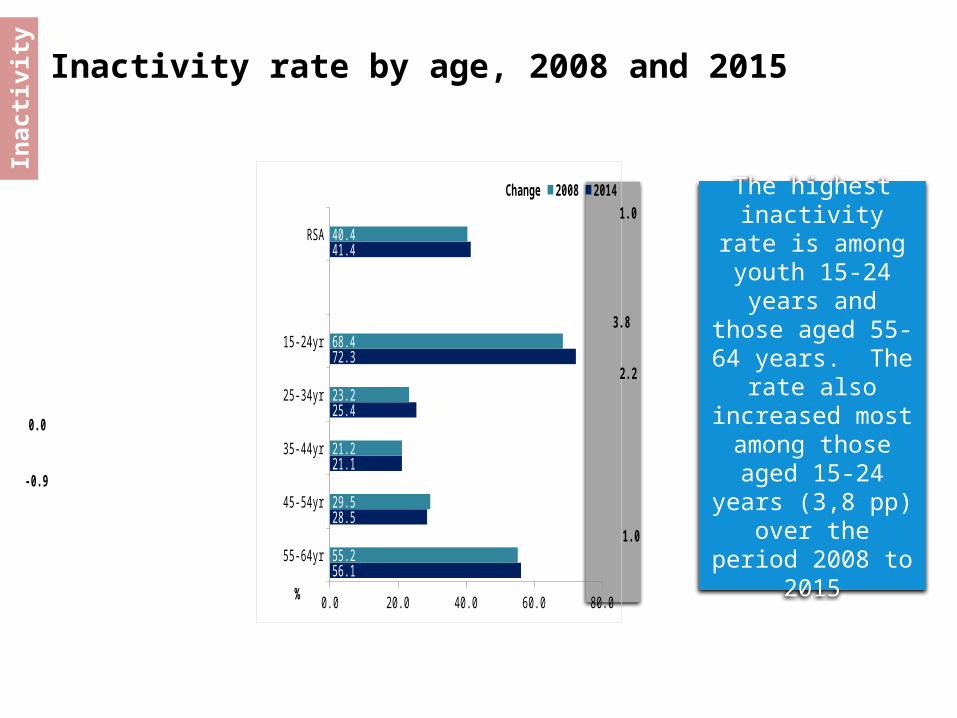
Inactivity rate by age, 2008 and 2015
Inac
tivi
ty
The highest inactivity rate is
among youth 15-24 years and those
aged 55-64 years. The rate also
increased most among those aged 15-24 years (3,8
pp) over the period 2008 to 2015
55-64yr
45-54yr
35-44yr
25-34yr
15-24yr
RSA
0.0 20.0 40.0 60.0 80.0
56.1
28.5
21.1
25.4
72.3
41.4
55.2
29.5
21.2
23.2
68.4
40.4
1.0
-0.9
0.0
2.2
3.8
1.0Change 2008 2014
%
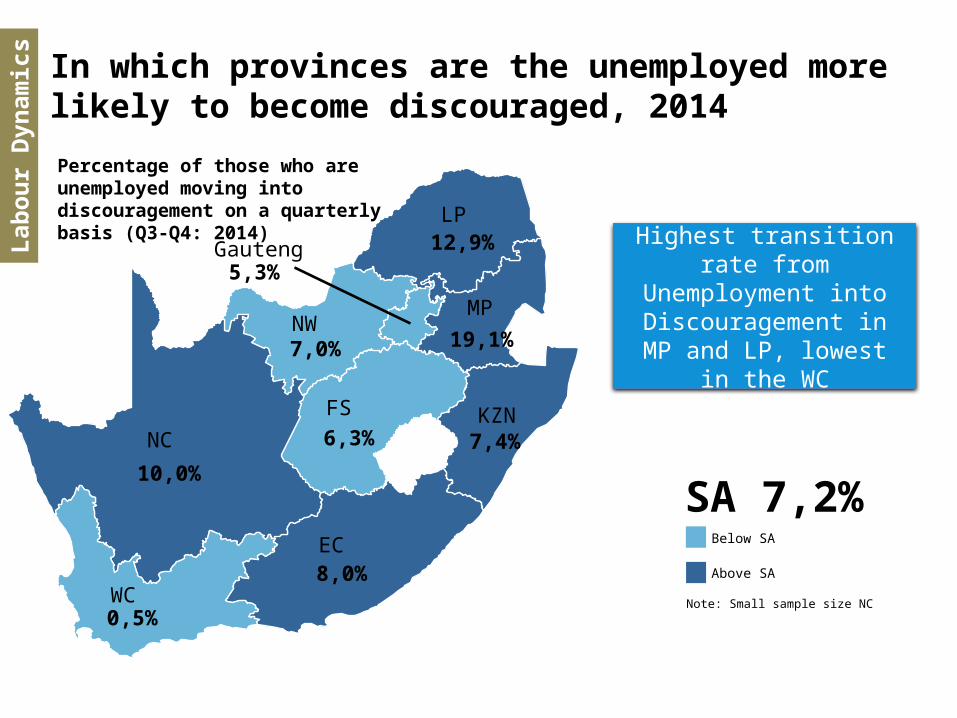
In which provinces are the unemployed more likely to become discouraged, 2014
Highest transition rate from Unemployment into Discouragement in MP
and LP, lowest in the WC
Gauteng5,3%
EC8,0%
KZN7,4%
WC0,5%
FS
6,3%
NW7,0%
LP12,9%
19,1%
MP
NC
10,0%
SA 7,2%
Note: Small sample size NC
Below SA
Above SA
Percentage of those who are unemployed moving into discouragement on a quarterly basis (Q3-Q4: 2014)
Lab
ou
r D
ynam
ics
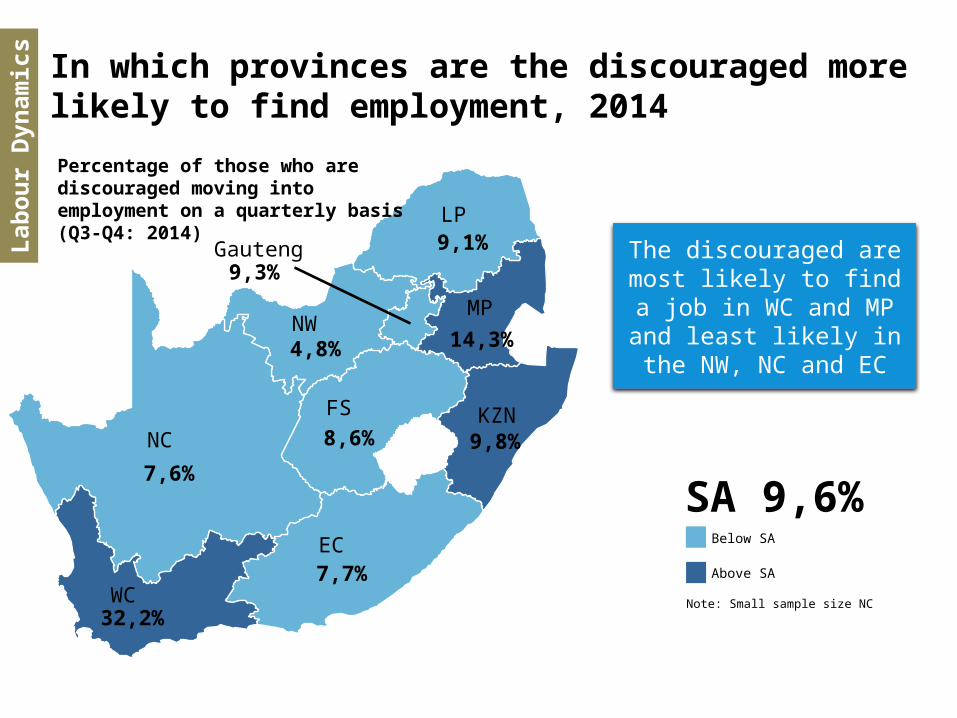
In which provinces are the discouraged more likely to find employment, 2014
The discouraged are most likely to find a job in WC
and MP and least likely in the NW, NC and EC
Gauteng9,3%
EC7,7%
KZN9,8%
WC32,2%
FS
8,6%
NW4,8%
LP9,1%
14,3%
MP
NC
7,6%
SA 9,6%
Note: Small sample size NC
Below SA
Above SA
Percentage of those who are discouraged moving into employment on a quarterly basis (Q3-Q4: 2014)
Lab
ou
r D
ynam
ics
Q1:
2015
QL
FS
Hig
hli
gh
ts
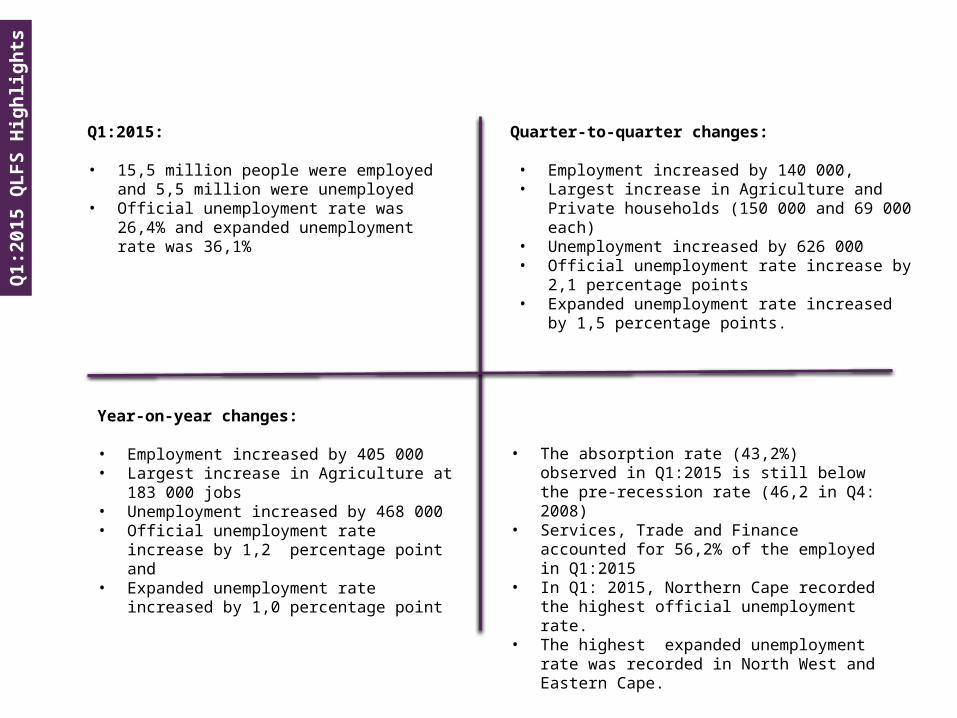
Q1:2015:
• 15,5 million people were employed and 5,5 million were unemployed
• Official unemployment rate was 26,4% and expanded unemployment rate was 36,1%
Quarter-to-quarter changes:
• Employment increased by 140 000,• Largest increase in Agriculture and Private
households (150 000 and 69 000 each)• Unemployment increased by 626 000• Official unemployment rate increase by 2,1
percentage points • Expanded unemployment rate increased by 1,5
percentage points.
Year-on-year changes:
• Employment increased by 405 000• Largest increase in Agriculture at 183 000 jobs• Unemployment increased by 468 000• Official unemployment rate increase by 1,2
percentage point and• Expanded unemployment rate increased by
1,0 percentage point
• The absorption rate (43,2%) observed in Q1:2015 is still below the pre-recession rate (46,2 in Q4: 2008)
• Services, Trade and Finance accounted for 56,2% of the employed in Q1:2015
• In Q1: 2015, Northern Cape recorded the highest official unemployment rate.
• The highest expanded unemployment rate was recorded in North West and Eastern Cape.