statistics south africa · 2 statistics south africa private bag x44 pretoria 0001 south africa 170...
TRANSCRIPT
2
Statistics South Africa Private Bag X44
Pretoria 0001 South Africa
170 Thabo Sehume Street
Pretoria 0002
User information services: (012) 310 8600 Fax: (012) 310 8500
Main switchboard: (012) 310 8911 Fax: (012) 321 7381
Website: www.statssa.gov.za
Email: [email protected]
i
Editor’s comment
‘Poverty – and its common consequences such as malnutrition, homelessness, poor housing and destitution – is a major contributor to vulnerability.’ This is according to the World Health Organization. Many children in South Africa find themselves in such vulnerable situations. Some are orphans (children whose both biological parents have passed away), while others reside in ‘Skip’ generation households (where grandparents raise grandchildren and parents are absent from the household) while some children are parents themselves (either to their own biological children or to their siblings). These conditions make it more challenging for children to have adequate access to healthcare services, social security, sufficient food, water and education. Although some children are able to rise above these conditions and carve a better future for themselves, some remain in these conditions even in their adulthood and also raise their own children in similar conditions.
Our educational article for this month’s issue of Mbalo Brief gives us a broader view of the living conditions of children in South Africa. The article is titled ‘South Africa’s young children: their family and home environment’ and it is derived from Report No. 03-10-07 of 2012. The article looks at the population distribution, living arrangements of the children, their social security, access to food and health care; among other areas.
Included in this issue are our monthly articles such as the Consumer price index (CPI), Selected building statistics of the private sector, Retail trade sales and Tourist accommodation. We have also included a crossword puzzle and solutions for the February 2015 puzzle.
Articles published in this issue are based on results of industry surveys conducted for the months ranging from December 2014 to January 2015 which were released in February and March 2015.
For more details on any of the surveys, visit our website at: www.statssa.gov.za
Enjoy the read.

ii

iii
CONTENTS
Editor’s comment ........................................................................................... i
Crossword puzzle .........................................................................................iv
Educational article: South Africa’s young children: their family and home environment, 2012.....………………………………...............………………...1
Primary industries .......................................................................................10
Mining: Production and sales ....................................................................10
Secondary industries ..................................................................................13
Manufacturing: Production and sales ........................................................13
Selected building statistics of the private sector .......................................14
Electricity generated and available for distribution ...................................15
Tertiary industries .......................................................................................17
Wholesale trade sales ...............................................................................17
Retail trade sales ......................................................................................18
Motor trade sales ......................................................................................19
Food and beverages .................................................................................20
Tourist accommodation .............................................................................21
Statistics of civil cases for debt .................................................................22
Statistics of liquidations and insolvencies .................................................24
Land transport survey ...............................................................................25
Prices ............................................................................................................27
Producer price index (PPI) ........................................................................27
Consumer price index (CPI) ......................................................................29
Glossary .......................................................................................................32

iv
Crossword Puzzle

v
Across
4. Who was the first South African to travel to space? Fill in surname only
8. Who is the minister of Basic Education? Fill in Surname only
9. Who is South Africa's Statistician General?
10. Which animal is used to represent Easter?
Down
1. In which month is International Children's Day observed?
2. Which province has the highest proportion of children aged 0 to 4 years?
3. Children whose parents have passed on are known as ....Fill in missing word.
5. Which team won the African Cup of Nations (AFCON) 2015?
6. What is the abbreviation of Millennium Development Goals?
7. According to the World Health Organization (WHO), what is the major contributor to vulnerability?
Solutions for February 2015 puzzle Across Down
3. Public 1. Once 7. Iron ore 2. Elephants 8. Tuberculosis 3. Peak 9. Ethiopia 4. Loadshedding 5. Contralesa 6. Fe

1
Educational article: South Africa’s young children: their family and home environment, 2012
Introduction
The South African government has an obligation to ensure that children’s rights are protected at all times and to create an environment that allows children to grow and reach their potential. In its quest to meet some of the obligations as outlined in the Millennium Development Goals (MDGs), the government has also introduced certain programmes, among others, child development, improved health care that aims at reducing child mortality, as well as those programmes that focus on environmental sustainability. All these are done with the aim of ensuring quality standard of living for children.
This article presents the findings on South Africa’s children: their home and home environment, as contained in Report No. 03-10-07 of 2012. This latest survey was conducted in 2012 and published in 2013. The article will cover, among others, population distribution, social security, access to food and health care.
Age and sex distribution
In 2012, there were about 5,3 million children aged 0–4 years in South Africa, representing 10,1% of the total population. About 1 064 747 children were infants (aged zero years), followed by 2,1 million children aged 1–2 years, while 2 132 837 were aged 3–4 years.
For children aged 0–4 years, 1 036 688 were boys, while the number of girls totalled 1 096 149. Disaggregation of the number of young children by age showed that there were more males (551 089) than females (513 658) among infants and among children aged 1–2 years, with 1 079 789 males and 1 017 910 females. In contrast, there were more females (1 096 149) than males (1 036 688) for children aged 3–4 years.
Demography
The largest number of young children aged 0–4 years in South Africa were found in KwaZulu-Natal (20,6%), followed by Gauteng (19,6%), Eastern Cape (13,9%), Limpopo (12,2%), Western Cape (10,1%), Mpumalanga

2
(8,4%) and North West (7,5%). The smallest number of young children were found in Northern Cape (2,3%) and Free State (5,3%). With regard to geographic type, many young children lived in urban formal areas (46,3%) and traditional areas (41,0%). About 9,1% of these children lived in urban informal settlements and 3,6% in rural formal areas. The majority of young children who lived in Western Cape (87,6%), Gauteng (80,4%), Free State (73,7%) and Northern Cape (67,0%) lived in urban formal areas. In contrast, the majority of young children who lived in Limpopo (87,4%), Eastern Cape (64,9%), KwaZulu-Natal (55,5%), Mpumalanga (55,3%) and North West (51,3%) lived in traditional areas. Gauteng (16,9%) and KwaZulu-Natal (12,6%) had relatively high proportions of young children living in urban informal settlements, while the proportions of young children living in rural formal areas were higher in Free State (9,4%), Mpumalanga (8,4%) and North West (7,2%).

3
Figure 1 – Percentage distribution of children aged 0–4 years by province of usual residence, 2012
Population group In relation to population group, the majority of young children aged below five years in South Africa were black African (85,1%), followed by the coloured (8,0%), white (5,0%) and Indian/Asian (1,9%) population groups.
4
Living arrangements Survival status of biological parents
In total, 92,7% of all young children had both their parents alive. About 96,7% of infants had both parents alive, while children aged 1–2 years (constituting 93,5%) had both parents alive, after which the percentage decreases further to 90,0% for those aged 3–4 years. In total, 97,7% of young children aged below five years had their mother alive; 93,9% had their father alive; and 98,9% had a single parent alive. By age 3–4 years, 96,6% of children had their mother alive and 91,6% had their father alive. The proportions of children with one parent alive and those with both parents dead increased with age among the young children. At infancy, 2,5% of children only had a mother alive compared to 0,4% of those with only the father alive. By the age of 3–4 years, 6,6% of children had only their mother alive compared to 1,6% of those having only a father alive. In general, 0,7% of infants and children aged 1–2 years had both parents unknown/unspecified, with 1,1% among those aged 3–4 years having both parents dead. Living arrangements with biological parents In relation to living arrangements, about 42,5% of children aged below five years lived with only their biological mother; 36,4% lived with both their biological parents; 2,0% lived with only their biological father and 18,7% lived with neither of their biological parents. In 2012, a total of 87,9% of infants lived with their mother (37,8% living with both parents and 50,1% living with their mother only), while a total of only 39,1% of infants lived with their father (37,8% living with both parents and 1,3% living with their father only). In total, 18,7% of young children aged below five years lived with neither parent. In comparison, 10,4% of infants and 16,7% of children aged 1–2 years lived with neither of their biological parents, and by age 3–4 years, 24,9% of the children lived with neither parent. The majority of young children from the white (86,5%), Indian/Asian (77,5%), coloured (53,5% ) and black African (31,0% ) population groups lived with

5
both biological parents. About 45,6% of black African children lived with only their biological mother, while 21,0% lived with neither parent. Living arrangements for children not living with biological parents The majority of children (85,4%) who did not live with any of their biological parents, lived in households headed by their grandparents. Children who lived where the household head was their relative comprised 12,5% in 2012, while those who lived with their siblings totalled 1,1%.
Foster care About 0,5% of children aged less than five years were placed in foster care. Children placed in foster care in 2012 comprised 0,3% infants; 0,5% of those aged 1–2 years; and 0,7% of those aged 3–4 years. Early childhood development A total of 35,7% of children aged below five years were attending ECD programmes. In 2012, 7% of infants, followed by 28% of children aged 1–2 years and 57% of children aged 3–4 years were attending Early Childhood Development (ECD) programmes. A significant percentage of children aged below five years who lived in the Free State (45,9%), Gauteng (45,0%), Western Cape (39,0%), Eastern Cape (37,2%) and Limpopo (36,1%) were attending ECD programmes. Lower proportions were observed in Northern Cape (25,4%) and KwaZulu-Natal (26,6%). With regard to geographic type, the largest percentage of children aged 0–4 years who were attending ECD centres could be found in urban formal areas at about 42,4%, while the smallest percentage was observed in rural formal areas at 26,3%. Social security A total of 3,2 million (20,9%) children aged below five years received social grants in 2012. A total of 60,8% of children aged below five years received a social grant, mainly in the form of a child support grant (60,5%), while 0,3% received the foster child grant. Children aged 3–4 years (67,1%), followed by those aged 1–2 years (62,2%) and 44,0% of infants received the child support grant in 2012.

6
Children who received a social grant during their infancy while living with their biological mother totalled only 53,0%. The percentage increased to 77,7% for children aged 1–2 years and further to 81,2% for those aged 3–4 years. Overall, 73,1% of children aged 0–4 years who lived with their biological mother received a social grant. Mothers and fathers of young children in South Africa Total number of young children living with biological parents A total of 4 266 641 young children aged 0–4 years lived in the same household as their biological mother in 2012. The largest percentage (72,1%) of children were the only biological children who lived with their mother in the same household, 25,4% were two biological children who lived with their mother in the same household and 2,4% were three or more children aged 0–4 years living with their mother in the same household. With regard to fathers, 2 007 879 children below the age of five years lived with their biological father in 2012. The highest percentage (67,6%) was for the only biological children residing with their father in the same household, while 32,0% of two siblings lived with their father in the same household. About 0,4% of three or more of children aged 0–4 years lived with their father in the same household. Age distribution of parents Mothers of children aged 0–4 years were generally aged 20–24 and 30–34 years with a total percentage of 69,6%. The highest proportion (25,5%) of mothers of children aged 0–4 years belonged to the 25–29-year-old age group, while 1,9% of mothers of children aged 0–4 years were aged 45 and older (1,6% aged 45–49 years and 0,3% aged 50 and older). In total, 3 653 955 mothers lived in the same household with their biological children. On the other hand, 1 677 696 fathers lived in the same household with their biological children. Fathers of children aged 0–4 years were generally aged between 30 and 34 (25,5%) and 35 and 39 (25,2%) years. The proportions of fathers who were living with their children were lower for younger fathers aged 20–24 (4,8%), and for older fathers aged 45–49 (8,2%) and 50 years and older (5,6%).

7
Marital status Mothers living with their biological children aged 0–4 years and who were legally married made up 31,1%, while those living together with their partners as a married couple totalled 18,3%. However, the majority of mothers (48,4%) of children had never been married. In contrast, the majority of fathers (94,7%) who lived with their young biological children were either legally married (59,7%) or living together as married partners (35,0%), while 4,8% of fathers had never married. Only 2,2% of mothers and 0,5% of fathers were divorced, widowed or separated. Educational background In 2012, 46,8% of mothers of children aged below five years had attained some secondary education, followed by 29,3% who had completed Grade 12, while 12,0% of mothers did not have a minimum secondary education. Only 11,6% of mothers had received post-school education (any qualification higher than Grade 12). About 7,2% of the mothers and only 2,2% of fathers were attending school in 2012. The highest number (58,3%) of mothers were attending a formal school (up to Grade 12), 18,3% were enrolled at higher education and 12,5% in were enrolled at further education and training institutions. Labour market status The proportion of economically active mothers who lived with their children was 52,4%, while the majority of economically active fathers (90,7%) lived with their children. About 65,3% of mothers were employed and 34,7% were unemployed. However, 90,4% of fathers were employed and 9,6% were unemployed. Home environment of South Africa’s young children Dwelling The majority of children aged below five years (72,0%) lived in formal dwellings, followed by 14,0% who lived in traditional dwellings and 11,2% living in informal settlements. Dwelling by population group indicates that 98,1% of young children from the white and 98,6% children from the
8
Indian/Asian population groups lived in formal dwellings. However, 84,4% of young children from the coloured and 68,7% from the black African population groups lived in informal dwellings. A higher proportion of young children from the coloured (12,5%) and black African (11,8%) populations lived in informal dwellings. Access to social services Water Children aged below five years from the Indian/Asian (97,0%) and white (93,7%) population groups lived in households with piped water in their dwelling, while 77,9% of children from the coloured and 27,1% children from the black African population groups resided in households with piped water in their dwelling. About 25,2% of young black African children lived in households that accessed piped water outside their homes (neighbour’s tap or public/communal tap) and 10,2% had to obtain their water from natural sources (flowing water/stream/river, well and spring). Energy In 2012, children aged below five years lived in households that used 84,6% of electricity for lighting, 65,8% for cooking and 32,5% for heating. Wood/coal/animal dung was commonly used for cooking (22,5%) and heating (27,5%). Paraffin was also used for heating (9,3%) while candles were used for lighting (9,9%). About 25,7% of children lived in households that did not use any energy source for heating. A large proportion of children aged below five years from the white (99,5%), Indian/Asian (98,4%) and coloured (95,9%) population groups lived in households that used electricity for lighting, whereas 82,3% of black African children did so. Children aged below five years in Limpopo lived in households that used wood for both cooking (55,8%) and heating (56,3%). Wood was also used more commonly for heating (41,5%) and cooking (30,0%) in Eastern Cape, while in KwaZulu-Natal (28,6%) and Mpumalanga (28,2%), wood was used mostly for cooking. The use of coal was more common in Mpumalanga, both for cooking (5,9%) and heating (9,6%). Access to health services With regard to health care, the majority of young children below the age of five from the black African (82,8%) and coloured (66,0%) population groups
9
lived in households that used public hospitals or clinics, whereas the majority of those from the Indian/Asian and white population groups mainly used private doctors (55,4% and 65,2% respectively). About 11,7% of children from the white population group lived in households that used public hospitals or clinics. Access to food
On food access, the proportions were high for households of black African children (30,1%), followed by the coloured population group (24,9%). Proportions were lower for the Indian/Asian population group (2,0%). However, 31,5% of children below the age of five from the black African and 25,0% from the coloured population groups lived in households that ran out of money to buy food, while only 2,0% from the Indian/Asian and 2,3% from the white population groups experienced the same problem. Conclusion More mothers than fathers were living with their young biological children. The majority of these mothers were not attending school during the survey. Although the majority of children had access to social grants, most children under foster care were not receiving a foster grant. Reference
1. Statistics South Africa. 2012. South Africa’s young children: their family and home environment, (Report No. 03-10-07), 2012. Pretoria: Statistics South Africa.
10
Primary industries Mining: production and sales Mining production and sales decrease According to the gross domestics product (GDP) estimates published by Statistics South Africa (Stats SA), two of the ten industry groups (mining and electricity) experienced a decrease in growth in 2014. The mining industry was also a negative contributor towards the annual producer price index (PPI) for 2014. This was because the mining industry was troubled by strikes during the first half of 2014. However, production started to pick up in the second half of 2014 due to higher production in the mining of ‘other’ metal ores (including platinum) and ‘other’ mining and quarrying (including diamonds). This article highlights mining production for December 2014 and mineral sales for November 2014. Mining production decreased by 2,0% year-on-year in December 2014 (see Table A). Negative growth rates were recorded for the following minerals: diamonds (-27,9%); iron ore (-15,6%); PGMs (-14,9%); and nickel (-1,1%). The three largest contributors to the 2,0% decrease were: iron ore (contributing -3,5 percentage points); PGMs (contributing -3,1 percentage points); and diamonds (contributing -1,0 percentage point). Coal was a positive contributor (contributing 3,2 percentage points). Total mining production was 1,5% lower in 2014 compared with 2013. The 1,5% decrease in annual mining production followed an increase of 3,6% in 2013 and a decrease of 3,1% in 2012.

11
Table A – Key growth rates in the volume of mining production for December 2014
Jul-14 Aug-14 Sep-14 Oct-14 Nov-14 Dec-14
Year-on-year % change, unadjusted
-5,1 -7,1 6,1 -0,5 -0,1 -2,0
Month-on-month % change, seasonally adjusted 1,4 -2,1 6,4 0,0 -1,1 0,9
3-month % change, seasonally adjusted 1/ 0,4 -0,3 0,7 2,8 5,0 3,1
1/ Percentage change between the previous 3 months and the 3 months ending in the month indicated.
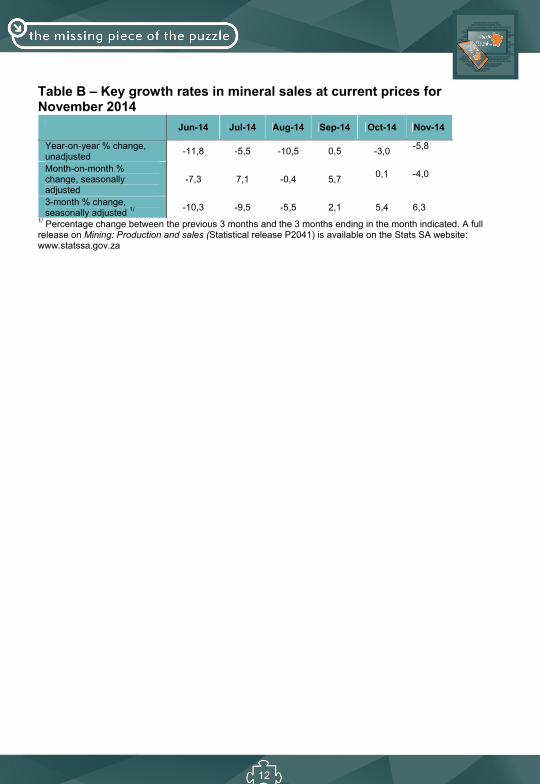
Mineral sales decreased by 5,8% year-on-year in November 2014 (see Table B). The largest negative growth rates were recorded for the following minerals: nickel (-38,6%); iron ore (-15,7%); copper (-15,7%); and gold (-11,2%). The following minerals were the major contributors to the 5,8% decrease: iron ore (contributing -2,6 percentage points); coal (contributing -1,9 percentage points); PGMs (contributing -1,3 percentage points); gold (contributing -1,3 percentage points); and nickel (contributing -1,0 percentage point).
12
Table B – Key growth rates in mineral sales at current prices for November 2014
Jun-14 Jul-14 Aug-14 Sep-14 Oct-14 Nov-14
Year-on-year % change, unadjusted
-11,8 -5,5 -10,5 0,5 -3,0 -5,8
Month-on-month % change, seasonally adjusted
-7,3 7,1 -0,4 5,7 0,1
-4,0
3-month % change, seasonally adjusted 1/
-10,3 -9,5 -5,5 2,1 5,4 6,3 1/ Percentage change between the previous 3 months and the 3 months ending in the month indicated. A full release on Mining: Production and sales (Statistical release P2041) is available on the Stats SA website: www.statssa.gov.za

13
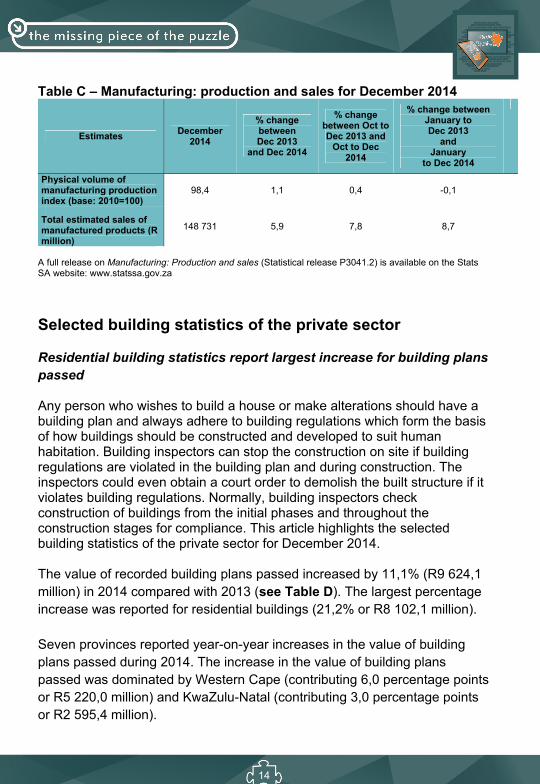
Secondary industries Manufacturing: production and sales Manufacturing production increases The manufacturing industry is one of South Africa’s largest contributors to the growth of the country’s economy. As such, many campaigns have been running in an effort to boost the performance of the industry. One such campaign is 'Proudly South African', which was launched in 1998. The campaign seeks to encourage consumers to take pride in what is manufactured in the country and support locally produced and manufactured products, thereby creating and sustaining jobs while also stimulating the economy. Consumers can easily spot some of these products as they carry the 'Proudly South African' logo or a 'Made in South Africa' label. These two are an indication that the company, product and/or the service provided is of good quality. Presented in this article is the manufacturing: production and sales statistics for December 2014. In 2014, manufacturing production decreased by 0,1% compared with 2013 (see Table C). Lower production was reported by four of the ten manufacturing divisions. The annual decrease of 0,1% was mainly due to lower production in the following divisions: basic iron and steel, non-ferrous metal products, metal products and
machinery (-3,0%, contributing -0,6 of a percentage point); and glass and non-metallic mineral products (-5,8%, contributing -0,3 of a
percentage point). Manufacturing production increased by 1,1% in December 2014 compared with December 2013. The 1,1% year-on-year increase in manufacturing production in December 2014 was mainly due to higher production in the food and beverages division (8,3%, contributing 2,4 percentage points).
14
Table C – Manufacturing: production and sales for December 2014
Estimates December
2014
% change between Dec 2013
and Dec 2014
% change between Oct to Dec 2013 and
Oct to Dec 2014
% change between January to Dec 2013
and January
to Dec 2014
Physical volume of manufacturing production index (base: 2010=100)
98,4 1,1 0,4 -0,1
Total estimated sales of manufactured products (R million)
148 731 5,9 7,8 8,7
A full release on Manufacturing: Production and sales (Statistical release P3041.2) is available on the Stats SA website: www.statssa.gov.za
Selected building statistics of the private sector
Residential building statistics report largest increase for building plans passed
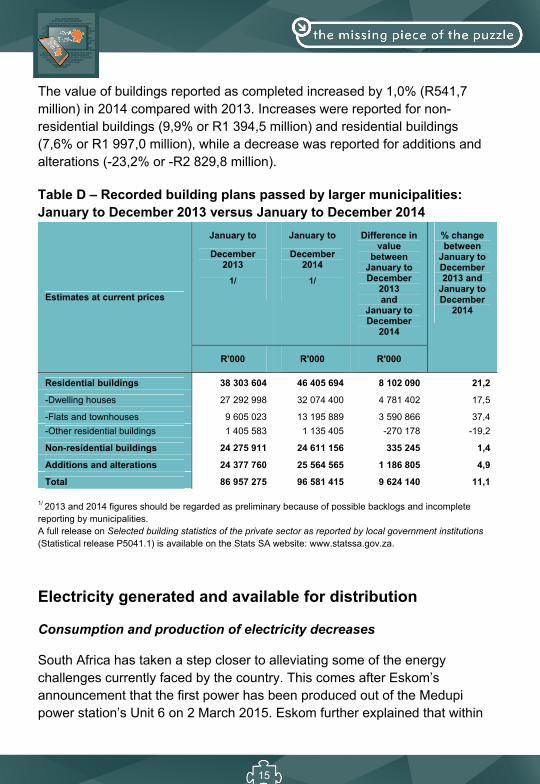
Any person who wishes to build a house or make alterations should have a building plan and always adhere to building regulations which form the basis of how buildings should be constructed and developed to suit human habitation. Building inspectors can stop the construction on site if building regulations are violated in the building plan and during construction. The inspectors could even obtain a court order to demolish the built structure if it violates building regulations. Normally, building inspectors check construction of buildings from the initial phases and throughout the construction stages for compliance. This article highlights the selected building statistics of the private sector for December 2014. The value of recorded building plans passed increased by 11,1% (R9 624,1 million) in 2014 compared with 2013 (see Table D). The largest percentage increase was reported for residential buildings (21,2% or R8 102,1 million). Seven provinces reported year-on-year increases in the value of building plans passed during 2014. The increase in the value of building plans passed was dominated by Western Cape (contributing 6,0 percentage points or R5 220,0 million) and KwaZulu-Natal (contributing 3,0 percentage points or R2 595,4 million).
15
The value of buildings reported as completed increased by 1,0% (R541,7 million) in 2014 compared with 2013. Increases were reported for non-residential buildings (9,9% or R1 394,5 million) and residential buildings (7,6% or R1 997,0 million), while a decrease was reported for additions and alterations (-23,2% or -R2 829,8 million). Table D – Recorded building plans passed by larger municipalities: January to December 2013 versus January to December 2014
Estimates at current prices
January to
December 2013
1/
January to
December 2014
1/
Difference in value
between January to December
2013 and
January to December
2014
% change between
January to December 2013 and
January to December
2014
R'000 R'000 R'000
Residential buildings 38 303 604 46 405 694 8 102 090 21,2
-Dwelling houses 27 292 998 32 074 400 4 781 402 17,5
-Flats and townhouses 9 605 023 13 195 889 3 590 866 37,4
-Other residential buildings 1 405 583 1 135 405 -270 178 -19,2
Non-residential buildings 24 275 911 24 611 156 335 245 1,4
Additions and alterations 24 377 760 25 564 565 1 186 805 4,9
Total 86 957 275 96 581 415 9 624 140 11,1
1/ 2013 and 2014 figures should be regarded as preliminary because of possible backlogs and incomplete reporting by municipalities. A full release on Selected building statistics of the private sector as reported by local government institutions (Statistical release P5041.1) is available on the Stats SA website: www.statssa.gov.za.
Electricity generated and available for distribution
Consumption and production of electricity decreases
South Africa has taken a step closer to alleviating some of the energy challenges currently faced by the country. This comes after Eskom’s announcement that the first power has been produced out of the Medupi power station’s Unit 6 on 2 March 2015. Eskom further explained that within

16
the next three to six months of 2015, South Africa will see Medupi Unit 6’s full potential of 794 megawatt (MW) being fed into the South African national grid (network of wires and cables by which sources of power, such as electricity, are distributed throughout a country or area). Although this will make a difference, Eskom indicated that it will still not be adequate to solve the load shedding problem. It is therefore still advisable to use electricity sparingly in order to alleviate electricity pressure. This can be achieved by switching off lights that are not used, unplug chargers and other household appliances that are not used, boil as much water as you need at a time etc. This article highlights the statistics of electricity produced and consumed in December 2014.
The actual estimated volume of electricity consumption decreased by 1,6% year-on-year in December 2014 (see Table E). Annual consumption of electricity decreased by 0,7% in 2014 compared with 2013.
Electricity production decreased by 1,0% year-on-year in December 2014. Annual production of electricity decreased by 1,4% in 2014 compared with 2013.
Table E – Selected key figures regarding electricity generated and available for distribution – December 2014
Actual estimates December
20141/
% change between
December 2013 and
December 2014
% change between
October to December 2013 and
October to December
2014
% change between
January to December
2013 and
January to December
2014
Electricity available for distribution (Gigawatt-hours)
18 406 -1,6 -1,1 -0,7
Index of the physical volume of electricity production (2010=100)
92,3 -1,0 -1,3 -1,4
1/ Preliminary. A full release on Electricity generated and available for distribution (Statistical release P4141) is available on the Stats SA website: www.statssa.gov.za
17
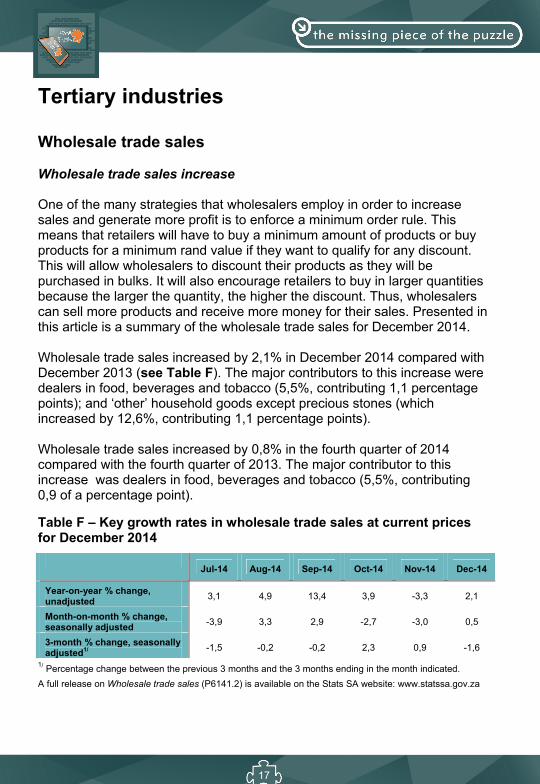
Tertiary industries Wholesale trade sales Wholesale trade sales increase One of the many strategies that wholesalers employ in order to increase sales and generate more profit is to enforce a minimum order rule. This means that retailers will have to buy a minimum amount of products or buy products for a minimum rand value if they want to qualify for any discount. This will allow wholesalers to discount their products as they will be purchased in bulks. It will also encourage retailers to buy in larger quantities because the larger the quantity, the higher the discount. Thus, wholesalers can sell more products and receive more money for their sales. Presented in this article is a summary of the wholesale trade sales for December 2014. Wholesale trade sales increased by 2,1% in December 2014 compared with December 2013 (see Table F). The major contributors to this increase were dealers in food, beverages and tobacco (5,5%, contributing 1,1 percentage points); and ‘other’ household goods except precious stones (which increased by 12,6%, contributing 1,1 percentage points). Wholesale trade sales increased by 0,8% in the fourth quarter of 2014 compared with the fourth quarter of 2013. The major contributor to this increase was dealers in food, beverages and tobacco (5,5%, contributing 0,9 of a percentage point).
Table F – Key growth rates in wholesale trade sales at current prices for December 2014
Jul-14 Aug-14 Sep-14 Oct-14 Nov-14 Dec-14
Year-on-year % change, unadjusted
3,1 4,9 13,4 3,9 -3,3 2,1
Month-on-month % change, seasonally adjusted
-3,9 3,3 2,9 -2,7 -3,0 0,5
3-month % change, seasonally adjusted1/
-1,5 -0,2 -0,2 2,3 0,9 -1,6
1/ Percentage change between the previous 3 months and the 3 months ending in the month indicated.
A full release on Wholesale trade sales (P6141.2) is available on the Stats SA website: www.statssa.gov.za
18
Retail trade sales
Sales increase during the festive season
The recently concluded festive season gave some retailers something to smile about as some of them celebrated an increase in sales. However, since the beginning of the year it has been doom and gloom for some grocery retailers and food producers who faced challenges emanating from load shedding. As a result, retailers had to deal with reduced trading hours and fewer customers, as some shoppers avoided malls during power cuts. Larger retailers with generators also had to fork out more money for running generators while those without generators suffered wastage of food due to lack of alternative methods of keeping the food chilled. Presented in this article is a summary of the retail trade sales statistics for December 2014.
Retail trade sales increased by 3,4% year-on-year in December 2014 (see Table G). The highest annual growth rates were recorded for retailers in: household furniture, appliances and equipment (9,8%); pharmaceuticals and medical goods, cosmetics and toiletries (5,6%);
and textiles, clothing, footwear and leather goods (5,3%).
The main contributors to the 3,4% increase were general dealers (contributing 1,4 percentage points) and retailers in textiles, clothing, footwear and leather goods (contributing 1,3 percentage points).
Table G – Key growth rates in retail trade sales for December 2014 – at constant 2012 prices
Jul-14 Aug-14 Sep-14 Oct-14 Nov-14
Dec-14
Year-on-year % change, unadjusted 2,4 2,0 2,3 3,2 2,5 3,4
Month-on-month % change, seasonally adjusted
1,2 0,6 -0,6 0,4 1,4 -0,2
3-month % change, seasonally adjusted 1/
0,7 0,9 1,0 0,8 0,9 1,0
1/ Percentage change between the previous 3 months and the 3 months ending in the month indicated. A full release on Retail trade sales (Statistical release P6242.1) is available on the Stats SA website: www.statssa.gov.za

19
Motor trade sales
Convenience store sales increase
Convenience store (small stores that sell a range of items from snacks, tobacco, newspapers, magazines, soft drinks and toiletries) sales were one of the three activities in the motor trade industry that recorded the highest growth rates in December 2014. When people travel for holidays, visit relatives in other provinces or undertake any other travelling, they usually make a stop at a garage/filling station to fill up, freshen up and get something to eat. Through these activities, they boost the sales of fuel as well as that of convenience stores. Convenience stores usually charge higher prices than conventional groceries stores because they order their products in smaller quantities from wholesalers and therefore pay more for these products than conventional stores. Presented in this article is a summary of the motor trade sales statistics for December 2014.
Motor trade sales increased by 3,5% in 2014 compared with 2013. The highest annual growth rates were recorded for fuel sales (6,3%), workshop income (5,9%) and sales of accessories (5,2%).
In December 2014, motor trade sales increased by 6,5% year-on-year (see Table H). The highest annual growth rates were recorded for: new vehicle sales (12,7%); sales of accessories (10,9%); and convenience store sales (8,7%). Table H – Key growth rate figures in motor trade sales for December 2014
Jul-14 Aug-14 Sep-14 Oct-14 Nov-14 Dec-14
Year-on-year % change, unadjusted
3,7 1,7 8,1 4,9 0,9 6,5
Month-on-month % change, seasonally adjusted
1,2 -0,4 1,1 0,7 -3,1 1,2
3-month % change, seasonally adjusted 1/
1,8 3,1 2,7 2,2 0,6 -0,5 1/ Percentage change between the previous 3 months and the 3 months ending in the month indicated. A full release on Motor trade sales (Statistical release P6343.2) is available on the Stats SA website: www.statssa.gov.za

20
Food and beverages
Food and beverages income increases by 7,4%
The high spending on beverages and food by consumers has boosted the revenue of the retailers in December. The high sales could have been as a result of many families’ outings (enjoyment trips) to eat during this month. Catering companies also contributed by supplying prepared meals and drinks on a set amount during events such as, among others, wedding ceremonies, parties and New Year’s celebrations. This article highlights food and beverages income for December 2014. The total income generated by the food and beverages industry increased by 7,4% in December 2014 compared with December 2013. Positive annual growth rates were recorded for ‘other’ income (18,4%) and food sales (10,1%) (see Table I). In December 2014, the highest annual growth rate was recorded for takeaway and fast-food outlets (9,0%, contributing 3,4 percentage points). Total income increased by 8,9% in the fourth quarter of 2014 compared with fourth quarter of 2013. The main contributors to this increase were: restaurants and coffee shops (8,2%, contributing 3,9 percentage points);
and takeaway and fast-food outlets (10,3%, contributing 3,8 percentage
points).
Table I – Annual percentage change in food and beverages income at current prices by type of enterprise – December 2014
Type of income Jul-14 Aug-14 Sep-14 Oct-14 Nov-14 Dec-14
Food sales 8,2 8,7 5,3 13,3 9,3 10,1
Bar sales -9,6 -0,4 -3,2 3,6 -1,6 -11,2
Other income -3,8 1,0 0,4 3,0 8,5 18,4
Total 5,8 7,5 4,2 11,8 7,9 7,4
A full release on Food and beverages (Statistical release P6420) is available on the Stats SA website: www.statssa.gov.za

21
Tourist accommodation
More income generated from tourist accommodation
On the 10th of March 2014, the Department of Tourism launched the Tourism Incentive Programme (TIP). This programme is made up of a series of new incentives aimed at growing the performance of tourism establishments as well as improving South Africa’s iconic tourism attractions The Department of Tourism will subsidise a portion of the costs incurred by tourism establishments to participate in trade exhibitions and marketing road shows. The subsidy will include a capped reimbursement towards pre-determined expenses such as airfare, accommodation and exhibition fees for participation in marketing platforms supported by South African Tourism. The Department hopes that this new programme will make South Africa a more competitive global destination. This article highlights the tourists accommodation statistics for December 2014.
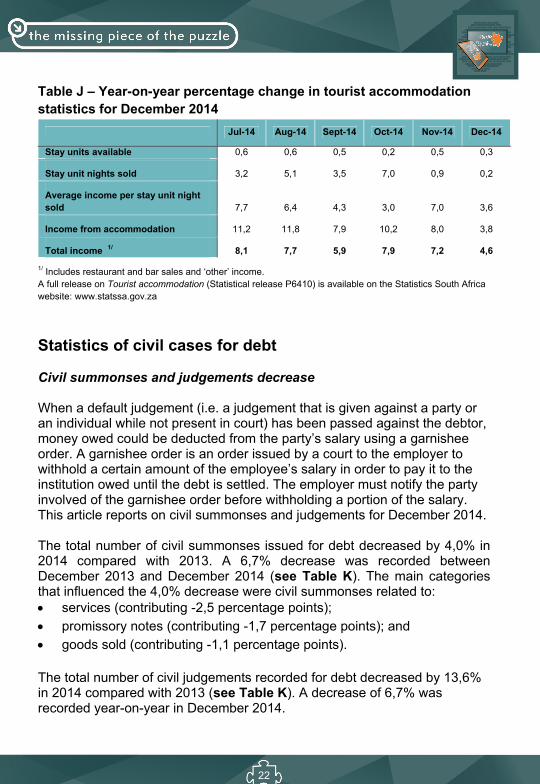
Total income for the tourist accommodation industry increased by 4,6% in December 2014 compared with December 2013 (see Table J). Income from accommodation increased by 3,8% year-on-year in December 2014, the result of a 0,2% increase in the number of stay unit nights sold and a 3,6% increase in the average income per stay unit night sold. The main contributors to the 3,8% year-on-year increase in income from accommodation in December 2014 were hotels (contributing 1,7 percentage points) and guest-houses and guest-farms (contributing 1,2 percentage points).
In December 2014, the types of accommodation that recorded the highest year-on-year growth rates in income from accommodation were guest-houses and guest-farms (18,3%) and caravan parks and camping sites (16,7%).
Income from accommodation increased by 7,2% in the fourth quarter of 2014 compared with the fourth quarter of 2013. The main contributors to this increase were hotels (5,6% and contributing 3,5 percentage points) and ‘other’ accommodation (8,7% and contributing 2,6 percentage points).
22
Table J – Year-on-year percentage change in tourist accommodation statistics for December 2014
Jul-14 Aug-14 Sept-14 Oct-14 Nov-14 Dec-14
Stay units available 0,6 0,6 0,5 0,2 0,5 0,3
Stay unit nights sold 3,2 5,1 3,5 7,0 0,9 0,2
Average income per stay unit night sold 7,7 6,4 4,3 3,0 7,0 3,6
Income from accommodation 11,2 11,8 7,9 10,2 8,0 3,8
Total income 1/ 8,1 7,7 5,9 7,9 7,2 4,6
1/ Includes restaurant and bar sales and ‘other’ income. A full release on Tourist accommodation (Statistical release P6410) is available on the Statistics South Africa website: www.statssa.gov.za
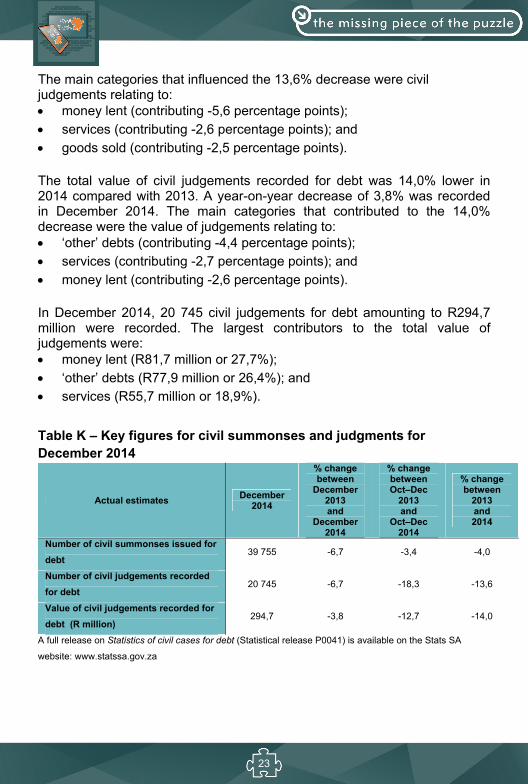
Statistics of civil cases for debt Civil summonses and judgements decrease When a default judgement (i.e. a judgement that is given against a party or an individual while not present in court) has been passed against the debtor, money owed could be deducted from the party’s salary using a garnishee order. A garnishee order is an order issued by a court to the employer to withhold a certain amount of the employee’s salary in order to pay it to the institution owed until the debt is settled. The employer must notify the party involved of the garnishee order before withholding a portion of the salary. This article reports on civil summonses and judgements for December 2014. The total number of civil summonses issued for debt decreased by 4,0% in 2014 compared with 2013. A 6,7% decrease was recorded between December 2013 and December 2014 (see Table K). The main categories that influenced the 4,0% decrease were civil summonses related to: services (contributing -2,5 percentage points); promissory notes (contributing -1,7 percentage points); and goods sold (contributing -1,1 percentage points). The total number of civil judgements recorded for debt decreased by 13,6% in 2014 compared with 2013 (see Table K). A decrease of 6,7% was recorded year-on-year in December 2014.
23
The main categories that influenced the 13,6% decrease were civil judgements relating to: money lent (contributing -5,6 percentage points); services (contributing -2,6 percentage points); and goods sold (contributing -2,5 percentage points). The total value of civil judgements recorded for debt was 14,0% lower in 2014 compared with 2013. A year-on-year decrease of 3,8% was recorded in December 2014. The main categories that contributed to the 14,0% decrease were the value of judgements relating to: ‘other’ debts (contributing -4,4 percentage points); services (contributing -2,7 percentage points); and money lent (contributing -2,6 percentage points).
In December 2014, 20 745 civil judgements for debt amounting to R294,7 million were recorded. The largest contributors to the total value of judgements were: money lent (R81,7 million or 27,7%); ‘other’ debts (R77,9 million or 26,4%); and services (R55,7 million or 18,9%).
Table K – Key figures for civil summonses and judgments for December 2014
Actual estimates December
2014
% change between
December 2013 and
December 2014
% change between Oct–Dec
2013 and
Oct–Dec 2014
% change between
2013 and 2014
Number of civil summonses issued for
debt 39 755 -6,7 -3,4 -4,0
Number of civil judgements recorded
for debt 20 745 -6,7 -18,3 -13,6
Value of civil judgements recorded for
debt (R million) 294,7 -3,8 -12,7 -14,0
A full release on Statistics of civil cases for debt (Statistical release P0041) is available on the Stats SA
website: www.statssa.gov.za

24
Statistics of liquidations and insolvencies
Liquidations and insolvencies increase
When a company is under liquidation, it stops trading and this affects the employees negatively as this process usually results in more job losses and, in most cases, employees are not paid salaries. This is because when the company is under the liquidation, the liquidator takes custody and control of all the company’s assets. Then, the use or selling of assets is prohibited. However, employees can claim for their unpaid salaries or overtime and other claims owed by the company (from the liquidator) before the company is liquidated. This article presents the statistics of liquidations for January 2015 and insolvencies for December 2014.
The total number of liquidations recorded increased by 6,5% (from 402 to 428) in the three months ended January 2015 compared with the three months ended January 2014 (see Table L). Voluntary liquidations increased by 7,7% (from 352 to 379), while compulsory liquidations decreased by only 1 case. The total number of liquidations increased by 3,0% year-on-year in January 2015.
Liquidations
Table L – Total number of liquidations for January 2015
Number of liquidations January 2015
% change between January 2014
and January 2015
% change between November 2013 to January 2014
and November 2014 to January 2015
136 3,0 6,5
Insolvencies
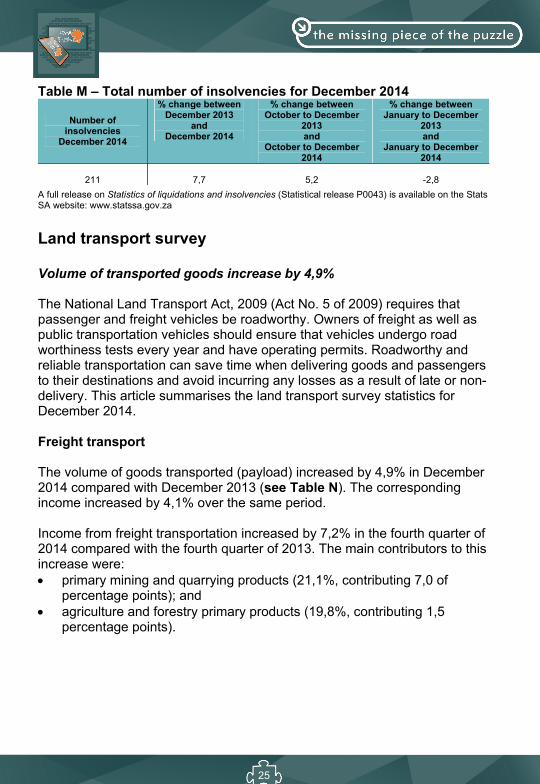
The estimated number of insolvencies decreased by 2,8% (from 3 189 to 3 100) in 2014 compared with 2013 (see Table M). A 5,2% increase was estimated between the fourth quarter of 2013 and the fourth quarter of 2014. The number of insolvencies increased by 7,7% year-on-year in December 2014.
25
Table M – Total number of insolvencies for December 2014
Number of insolvencies
December 2014
% change between December 2013
and December 2014
% change between October to December
2013 and
October to December 2014
% change between January to December
2013 and
January to December 2014
211 7,7 5,2 -2,8
A full release on Statistics of liquidations and insolvencies (Statistical release P0043) is available on the Stats SA website: www.statssa.gov.za
Land transport survey
Volume of transported goods increase by 4,9%
The National Land Transport Act, 2009 (Act No. 5 of 2009) requires that passenger and freight vehicles be roadworthy. Owners of freight as well as public transportation vehicles should ensure that vehicles undergo road worthiness tests every year and have operating permits. Roadworthy and reliable transportation can save time when delivering goods and passengers to their destinations and avoid incurring any losses as a result of late or non-delivery. This article summarises the land transport survey statistics for December 2014.
Freight transport
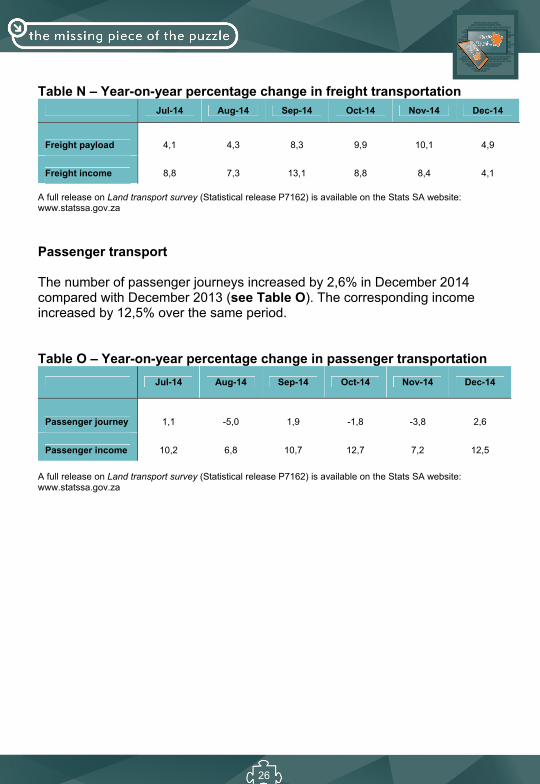
The volume of goods transported (payload) increased by 4,9% in December 2014 compared with December 2013 (see Table N). The corresponding income increased by 4,1% over the same period.
Income from freight transportation increased by 7,2% in the fourth quarter of 2014 compared with the fourth quarter of 2013. The main contributors to this increase were: primary mining and quarrying products (21,1%, contributing 7,0 of
percentage points); and agriculture and forestry primary products (19,8%, contributing 1,5
percentage points).
26
Table N – Year-on-year percentage change in freight transportation Jul-14 Aug-14 Sep-14 Oct-14 Nov-14 Dec-14
Freight payload 4,1 4,3 8,3 9,9 10,1 4,9
Freight income 8,8 7,3 13,1 8,8 8,4 4,1 A full release on Land transport survey (Statistical release P7162) is available on the Stats SA website: www.statssa.gov.za
Passenger transport The number of passenger journeys increased by 2,6% in December 2014 compared with December 2013 (see Table O). The corresponding income increased by 12,5% over the same period. Table O – Year-on-year percentage change in passenger transportation
A full release on Land transport survey (Statistical release P7162) is available on the Stats SA website: www.statssa.gov.za
Jul-14 Aug-14 Sep-14 Oct-14 Nov-14 Dec-14
Passenger journey 1,1 -5,0 1,9 -1,8 -3,8 2,6
Passenger income 10,2 6,8 10,7 12,7 7,2 12,5
27
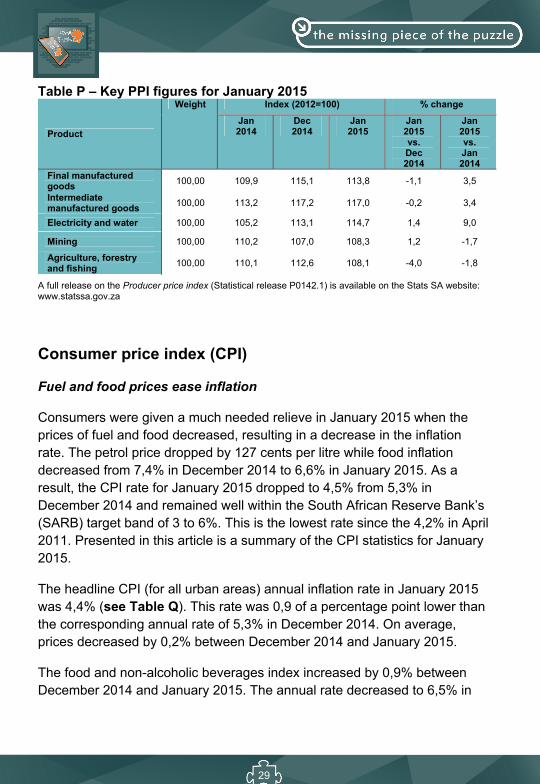
Prices Producer price index (PPI) Annual PPI for final manufactured products at 3,5% in January 2015
In order for a motor vehicle to be a final product, it needs certain vehicle parts to be installed as part of its final production stage. For instance, a motor vehicle needs an engine, rims and exhaust where steel (which is an intermediate good) plays a significant role. At this stage of processing of intermediary goods, the price change of the PPI is measured. This article presents producer price index (PPI) statistics for January 2015. The annual percentage change in the PPI for final manufactured goods was 3,5% in January 2015 compared with 5,8% in December 2014 (see Table P).
The main contributors to the annual rate of 3,5% were: food products, beverages and tobacco products (7,4%, contributing 2,5
percentage points); and metals, machinery, equipment and computing equipment (6,7%,
contributing 1,0 percentage point).
Intermediate manufactured goods The annual percentage change in the PPI for intermediate manufactured goods was 3,4% in January 2015 compared with 6,1% in December 2014 (see Table P). The main contributors to the annual rate of 3,4% were: basic and fabricated metals (3,1%, contributing 1,0 percentage point); sawmilling and wood (5,5%, contributing 1,1 percentage points); and chemicals, rubber and plastic products (3,6%, contributing 1,1
percentage points). From August 2014 to January 2015 the PPI for intermediate manufactured goods decreased by 0,2%. The main contributor to the monthly decrease of 0,2% was chemicals, rubber and plastic products (-1,4%, contributing -0,5 of a percentage point).
28
Electricity and water The annual percentage change in the PPI for electricity and water was 9,0% in January 2015 compared with 8,9% in December 2014 (see Table P). The contributors to the annual rate of 9,0% were electricity (9,5%, contributing 8,0 percentage points) and water (7,0%, contributing 1,1 percentage points). From December 2014 to January 2015 the PPI for electricity and water increased by 1,4%. The contributor to the monthly increase of 1,4% was electricity (1,8%, contributing 1,5 percentage points). Mining The annual percentage change in the PPI for mining was -1,7% in January 2015, compared with 3,6% in December 2014(see Table P). The main contributor to the annual rate of -1,7% was coal and gas (-6,8%, contributing -1,8 percentage points) From December 2014 to January 2015 the PPI for mining increased by 1,2%. The main contributors to the monthly increase of 1,2% were gold and other metal ores (1,8%, contributing 0,6 of a percentage point). Agriculture, forestry and fishing The annual percentage change in the PPI for agriculture, forestry and fishing was -1,8% in January 2015, compared with 2,3% in December 2014(see Table P). . The main contributor to the annual rate of -1,8% was agriculture (-3,0%, contributing -2,6 percentage points). From December 2014 to January 2015 the PPI for agriculture, forestry and fishing decreased by 4,0%. The main contributor to the monthly decrease of 4,0% was agriculture (-4,5%, contributing -3,9 percentage points).
29
Table P – Key PPI figures for January 2015
Product
Weight Index (2012=100) % change
Jan 2014
Dec 2014
Jan 2015
Jan 2015 vs. Dec 2014
Jan 2015 vs. Jan 2014
Final manufactured goods
100,00 109,9 115,1 113,8 -1,1 3,5
Intermediate manufactured goods
100,00 113,2 117,2 117,0 -0,2 3,4
Electricity and water 100,00 105,2 113,1 114,7 1,4 9,0
Mining 100,00 110,2 107,0 108,3 1,2 -1,7
Agriculture, forestry and fishing
100,00 110,1 112,6 108,1 -4,0 -1,8
A full release on the Producer price index (Statistical release P0142.1) is available on the Stats SA website: www.statssa.gov.za
Consumer price index (CPI)
Fuel and food prices ease inflation
Consumers were given a much needed relieve in January 2015 when the prices of fuel and food decreased, resulting in a decrease in the inflation rate. The petrol price dropped by 127 cents per litre while food inflation decreased from 7,4% in December 2014 to 6,6% in January 2015. As a result, the CPI rate for January 2015 dropped to 4,5% from 5,3% in December 2014 and remained well within the South African Reserve Bank’s (SARB) target band of 3 to 6%. This is the lowest rate since the 4,2% in April 2011. Presented in this article is a summary of the CPI statistics for January 2015.
The headline CPI (for all urban areas) annual inflation rate in January 2015 was 4,4% (see Table Q). This rate was 0,9 of a percentage point lower than the corresponding annual rate of 5,3% in December 2014. On average, prices decreased by 0,2% between December 2014 and January 2015.
The food and non-alcoholic beverages index increased by 0,9% between December 2014 and January 2015. The annual rate decreased to 6,5% in
30
January 2015 from 7,2% in December 2014. The following components in the food and non-alcoholic beverages index increased: other food (2,0%); cold beverages (1,7%); fish (1,5%); meat (1,4%); sugar, sweets and desserts (1,0%); oils and fats (0,7%); hot beverages (0,6%); bread and cereals (0,5%); milk, eggs and cheese (0,2%); and vegetables (0,1%). The component that decreased was fruit (-1,0%).
The transport index decreased by 3,0% between December 2014 and January 2015, mainly due to a 127 cents per litre decrease in the price of petrol. The annual rate decreased to 2,5% in January 2015 from 1,7% in December 2014.
The miscellaneous goods and services index increased by 0,6% between December 2014 and January 2015. The annual rate increased to 7,3% in January 2015 from 7,1% in December 2014.
The provinces with an annual inflation rate lower than or equal to headline inflation were: Northern Cape (4,3%); Gauteng (4,3%); KwaZulu-Natal (4,2%); and Limpopo (4,0%).
The provinces with an annual inflation rate higher than headline inflation
were: Western Cape (4,9%); Eastern Cape (4,8%); Free State (4,6%); North West (4,5%); and

31
Mpumalanga (4,5%).
Table Q – Consumer price index: Index numbers and year-on-year rates Base year: December 2012 = 100
Year Jan Feb Mar Apr May Jun Jul Aug Sep Oct Nov Dec Avg1/
2010 Index 86,4 87,0 87,7 87,8 88,0 88,0 88,6 88,6 88,7 88,9 89,0 89,2 88,2 Rate 6,2 5,7 5,1 4,8 4,6 4,2 3,7 3,5 3,2 3,4 3,6 3,5 4,3
2011 Index 89,6 90,2 91,3 91,6 92,0 92,4 93,2 93,4 93,8 94,2 94,5 94,6 92,6 Rate 3,7 3,7 4,1 4,2 4,5 5,0 5,3 5,3 5,7 6,0 6,1 6,1 5,0
2012 Index 95,2 95,7 96,8 97,2 97,2 97,5 97,8 98,0 98,9 99,5 99,8 100,0 97,8
Rate 6,3 6,1 6,0 6,1 5,7 5,5 4,9 5,0 5,5 5,6 5,6 5,7 5,6 2013 Index 100,3 101,3 102,5 102,9 102,6 102,9 104,0 104,3 104,8 105,0 105,1 105,4 103,4
Rate 5,4 5,9 5,9 5,9 5,6 5,5 6,3 6,4 6,0 5,5 5,3 5,4 5,7 2014 Index 106,1 107,3 108,7 109,2 109,4 109,7 110,6 111,0 111,0 111,2 111,2 111,0 109,7
Rate 5,8 5,9 6,0 6,1 6,6 6,6 6,3 6,4 5,9 5,9 5,8 5,3 6,1 2015 Index 110,8
Rate 4,4
1/ Annual average. A full release on Consumer price index (Statistical release P0141) is available on the Stats SA website: www.statssa.gov.za
32
Glossary
Primary industries
Gigawatt-hour (gWh): one gigawatt-hour of electricity is equal to one million kilowatt-hours. A kilowatt-hour is the basic unit of electrical energy equal to one kilowatt of power supplied to or taken from an electric circuit steadily for one hour. One kilowatt-hour equals one thousand watt-hours.
Index of physical volume of manufacturing production: also known as a production index, is a statistical measure of the change in the volume of production. The production index of a major group is the ratio between the volume of production of a major group in a given period and the volume of production of the same major group in the base period.
Index of physical volume of mining production: a statistical measure of the change in the volume of production. The production index of a mineral group is the ratio between the volume of production of a mineral group in a given period and the volume of production of the same mineral group in the base period.
Index of the physical volume of electricity production: a statistical measure of the change in the volume of production of electricity in a given period and the volume of production of electricity in the base period.
Industry: a group of establishments engaged in the same or similar kinds of economic activity.
PGMs – Platinum group metals: include platinum; iridium; osmiridium, palladium; rhodium; ruthenium and osmium.
Sales: total value of sales and transfers-out of goods mined by the mining establishments and the amounts received for installation, erection or assembly or other services.
33
Secondary industries
Additions and alterations: extensions to existing buildings as well as internal and external alterations of existing buildings.
Blocks of flats: a structure, usually multi-storey, consisting of a number of dwellings sharing the same residential address, and usually sharing a common entrance, foyer or staircase.
Dwelling houses: a free-standing, complete structure on a separate stand or a self-contained dwelling-unit, e.g. granny flat, on the same premises as existing residence. Out-buildings and garages are included.
Other residential buildings: include institutions for the disabled, boarding houses, old age homes, hostels, hotel, motels, guest houses, holiday chalets, bed and breakfast accommodation, entertainment centres and casinos.
Residential buildings: dwelling houses, flats, townhouses and other residential buildings.
Tertiary industries
Acknowledgements of debt: a statement by a person/debtor in which he admits that he owes money to an individual or a company or a bank.
Average income per stay unit night sold: average rate per stay unit (i.e. rate per room in a hotel or powered site in a caravan park) is calculated by dividing the total income from accommodation by the number of stay unit nights sold in the survey period.
Catering services: enterprises involved in the sale and supply of meals and drinks prepared on the premises on a contract basis and brought to other premises chosen by the person ordering them, to be served for immediate consumption to guests or customers. Include bars, taverns, other drinking places, ice-cream parlours, etc.
Civil judgements: decisions taken in a civil matter or a dispute between two people or parties.
34
Civil summonses: notices to appear before the court of law where a dispute between two parties or people has to be heard, i.e. not for criminal offence.
Enterprise: a legal entity or a combination of legal units that includes and directly controls all functions necessary to carry out its sales activities.
Foreign traveller: a person who resides outside South Africa and visits the country temporarily.
Income from accommodation industry: income from amounts charged for rooms or equivalent. Other income is excluded (e.g. income from meals).
Income from bar sales: refers to income from liquor sales.
Income from food sales: refers to income from the sale of meals and non-alcoholic drinks.
Income from restaurant and bar sales: income from meals, banqueting and beverages and tobacco sales.
Insolvency: refers to an individual or partnership which is unable to pay its debt and is placed under final sequestration. The number of insolvencies does not refer to the number of persons involved, as a partnership which is unable to pay its debt is regarded as one insolvency, irrespective of the number of partners.
Liquidation: refers to the winding-up of the affairs of a company or close corporation when liabilities exceed assets and it can be resolved by voluntary action or by an order of the court.
Microdata: data gathered on a small scale, such as data on an individual.
‘Other’ African countries: refers to all non SADC African countries.
Other income: includes all income not earned from food sales or bar sales.
Other SADC: refers to the thirteen countries, excluding South Africa, that belong to the Southern African Development Community.

35
Professional services: refer to medical doctors, dentists, advocates, attorney, auditors, accountants, architects, engineers, hospital services etc.
Promissory notes: written undertaking, signed by a person or party, to pay money to another person or to be the bearer of such a note on a specific date or on demand.
Restaurants and coffee shops: enterprises involved in the sale and provision of meals and drinks, ordered from a menu, prepared on the premises for immediate consumption and with provided seating.
Retailer: a retailer is an enterprise deriving more than 50% of its turnover from sales of goods to the general public for household use.
Retail trade: includes the resale (sale without transformation) of new and used goods and products to the general public for household use.
Stay unit: unit accommodation available to be charged out to guests, for example, a powered site in a caravan park or a room in a hotel.
Stay unit night sold: total number of stay units occupied on each night during the survey period.
Takeaway and fast-food outlets: enterprises involved in the sale and provision of meals and drinks, ordered from a menu, prepared on the premises for takeaway purposes in a packaged format, at a stand or in a location, with or without provided seating.
Total income: includes income from food sales, income from bar sales and other income.
Tourism: comprises the activities of persons travelling to, and staying in places outside their usual environment, for not more than one consecutive year, for leisure, business and other purposes not related to the exercise of an activity remunerated from within the place visited.
Tourist: a visitor who stays at least one night in the place visited. Traveller: any person on a trip between two or more countries or between two or more localities within his/her country of residence.
36
Voluntary liquidation: takes place when a company or close corporation, by own choice, resolves to wind-up its affairs.
Wholesale trade: Includes the resale (sale without transformation) of new and used goods and products to other wholesalers, retailers, agricultural, industrial, commercial, institutional and professional users either directly or through agents on a fee or contract basis.
Prices
Annual percentage change: change in the index of the relevant month of the current year compared with the index of the same month in the previous year expressed as a percentage.
Consumer price index (CPI): an index that measures the price of a fixed basket of consumer goods and services.
Inflation rate: annual percentage change in the CPI for all items of the relevant month of the current year compared with the CPI for all items of the same month in the previous year expressed as a percentage.
Monthly percentage change: change in the index of the relevant month compared to the index of the previous month expressed as a percentage.
Year-on-year: A term used frequently in investment research and other reports to mean ‘compared with the same period in the previous fiscal year’