statistics and other damned lies - caltechauthorsauthors.library.caltech.edu/25038/186/chapter 12....
TRANSCRIPT
Chapter 12
Statistics and other damned lies
The remark attributed to Disraeli would often apply with justice and force: 'There are three kinds of lies: lies, damned lies, and statistics'.
Mark Twain
['lies, damn lies - and statistics' (sic) -usually attributed to Twain (a lie) -or to Disraeli (a damn lie), as Twain took trouble to do; Lord Blake, Disraeli's biographer, thinks that this is most unlikely (statistics)].
Overview
Semantics, rhetoric, logic and assumptions play a large role in science but are usually relegated to specialized books and courses on philosophy and paradigms. Conventional wisdom is often the controlling factor in picking and solving problem.s. This chapter is a detour into issues that may be holding up efforts to develop a theory of the Earth, one that is as paradox free as possible.
A large part of petrology, geochemistry and geophysics is about sampling the Earth. Sampl i ng t heor y is a branch of statistics . If the mantle is blobby on a kilometer scale , then individual rocks will exhibit large scatter - or variance - but the mean of a large number of samples will eventually settle down to the appropriate mean for the mantle; the same mean will
be achieved in one fell swoop by a large volcano sampling a large volume of the same mantle. If the outputs of many large volcanoes are plotted on a histogram, the spread will be much smaller than from the rock samples, even though the same mantle is being sampled. Midocean ridges sample vast volumes of the mantle and mix together a variety of components. TI1ey are the world's largest blenders. Seamount and ocean island volcanoes sample much smaller volumes. This is a situation where the cent ra l l imi t theor em (CLT) applies.
The central limit theorem
The central limi t theorem and the law of l arge numbers state that variably sized samples from a heterogenous population will yield the same mean but will have variances that decrease as n (the sample size) or V (the volume of the sampled region) increases. Small sample sizes are more likely to have extreme values than samples that blend components from a large volume [CLT i sotopes]. One expects that melt inclusions in a lava sample will have greater isotopic diversity than that sampled in whole rocks.
An amazing thing about the central limit theorem is that no matter what the shape of the original distribution - bimodal, uniform, exponential, multiple peaks - the sampling distribution of the mean approaches a normal distribution. Furthermore, a normal distribution is usually approached very quicldy as n increases;
144 STATISTICS AND OTHER DAMNED LIES
n is the sample size for each mean and is not the number of samples. The sample size is the number of measurements that goes in to the computation of each mean. In the case of sampling by a volcano of a heterogenous mantle, the volume of the sample space is equivalent to the number of discrete samples that are averaged; the volcano does the averaging in this case.
Suppose the mantle has a variety of discrete components, or blobs , with distinctive isotope ratios. The probability density function has, say, five peaks; call them DM, EM1, EM2, HIMU and Q The CLT states that a sufficiently large sample, or average, from this population, will have a narrow Gaussian distribution. MORE has this property; it has nothing to do with the homogeneity of the mantle or convective stirring. MORE is best viewed as an average, not a reservoir or component.
If one has several large datasets there are statistical ways to see if they are drawn from the same population. If two datasets have different means and different standard deviations they may still be drawn from the same population. But if the datasets have been filtered, trimmed or corrected, then statistics cannot be applied. Often these corrections involve some hypothesis about what the data should look like. This is a very common error in seismology and geochemistry; data can be selected, filtered and discarded for various reasons but there are formal and statistically valid ways of doing this.
The problems of scale
Volcanoes sample and average large volumes of the mantle. It is not necessary that the source region correspond to a rock type familiar in hand-specimen size. The 'grains' of the source may be kilometres in extent, and the melt from one source region may rise and interact with melts from a different lithology, or smaller degree melts from the same lithology. The properties of individual crystals are greatly washed out in the average. The hypothetical rock typespyrolite and piclogite - and hypothetical reservoirs - MORE, FOZO - may only exist as averages, rather than as distinct 10 em by 10 em 'rocks'
that might be found in a rock collection. Magmas average over a large volume of the mantle, just as river sediments can average over a large area of a continent. Similarly, seismic waves average over tens to hundreds of km and see many different ldnds of lithologies; they do not see the extremes in properties of the material that they average.
Anisotropy of the mantle may be due to anisotropy of individual mantle minerals or due to large-scale organized heterogeneity. A 1-second P-wave has a wavelength of about 10 km and therefore does not usually care whether it is microphysics or macrophysics that gives the fabric. Similar considerations apply to seismic anelasticity. Geophysics is as much a matter of composites, and averaging, as it is a science of crystallography and mineral physics. The problem of averaging occurs throughout the sciences of petrology, geochemistry and geophysics. Much of deep Earth science is about unravelling averages. In seismology this is called tomography.
The scale becomes important if it becomes big enough so that gravity takes over from diffusion. A large blob behaves differently, over time, than a small impurity, because of buoyancy. If the heterogeneities are large, a fertile blob can be confused with a hot plume.
Scrabble statistics
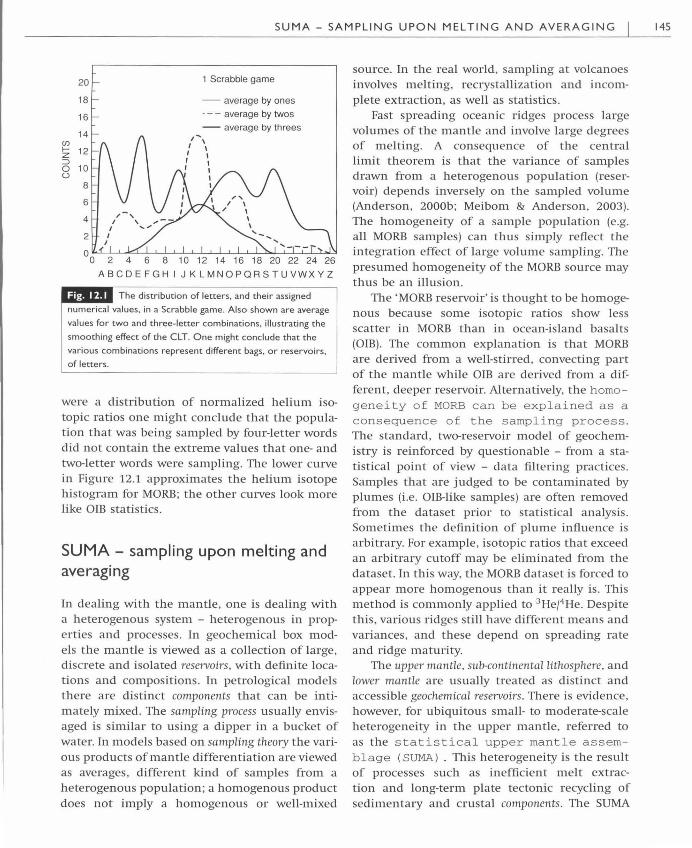
The central limit theorem can be illustrated with the game of Scrabble, which has a welldefined distribution function of letters or scores (Figure 12.1). Put all the letter tiles into a can and draw them out repeatedly. Plot the number of times each letter is pulled out on a cumulative histogram. The histogram is very ragged; this is what the population - the world of letters - looks like. Now play a game with only two-letter combinations - words - allowed, and plot the average scores. Continu e this process with three- and four-letter words (but do not filter out the offensive words or words that do not make sense). The histograms get smoother and smoother and narrower and narrower. By the time one gets to three-letter words one already has nearly a Gaussian distribution, with very few average scores of 4 or 5, or 20 and higher. If this
SUMA- SAMPLING UPON MELTING AND AVERAGING 145
1 Scrabble game
18 - average by ones
16 · - - average by twos
14 - average by threes
(f) 1- 12 z ::J 0 u
8
6
4
2 4 6 8 1 0 1 2 14 16 1 8 20 22 24 26
ABCDEFGHIJKLMNOPQRSTUVWXYZ
The distribution of letters, and their assigned
numerical values, in a Scrabble game. Also shown are average
values for two and three-letter combinations, illustrating the
smoothing effect of the CLT. One might conclude that the
various combinations represent different bags. or reservoirs, of letters.
were a distribution of normalized helium isotopic ratios one might conclude that the population that was being sampled by four-letter words did not contain the extreme values that one- and two-letter words were sampling. The lower curve in Figure 12.1 approximates the helium isotope histogram for MORB; the other curves look more like OIB statistics.
SUMA- sampl ing upon melting and averaging
In dealing with the mantle, one is dealing with a heterogenous system - heterogenous in properties and processes. In geochemical box models the mantle is viewed as a collection of large, discrete and isolated reservoirs, with definite locations and compositions. In petrological models there are distinct components that can be intimately mixed . The sampling process usually envisaged is similar to using a dipper in a bucket of water. In models based on sampling theory the various products of mantle differentiation are viewed as averages, different kind of samples from a heterogenous population; a homogenous product does not imply a homogenous or well-mixed
source. In the real world, sampling at volcanoes involves melting, recrystallization and incomplete extraction, as well as statistics.
Fast spreading oceanic ridges process large volumes of the mantle and involve large degrees of melting. A consequence of the central limit theorem is that the variance of samples drawn from a heterogenous population (reservoir) depends inversely on the sampled volume (Anderson, 2000b; Meibom & Anderson, 2003). The homogeneity of a sample population (e.g. all MORB samples) can thus simply reflect the integration effect of large volume sampling. The presumed homogeneity of the MORB source may thus be an illusion.
The 'MORB reservoir ' is thought to be homogenous because some isotopic ratios show less scatter in MORB than in ocean-island basalts (OIB). The common explanation is that MORB are derived from a well-stirred, convecting part of the mantle while OIB are derived from a different, deeper reservoir. Alternatively, the homogeneity of MORB can be explained as a consequence of the sampling process. The standard, two-reservoir model of geochemistry is reinforced by questionable - from a statistical point of view - data filtering practices. Samples that are judged to be contaminated by plumes (i.e. OIB-like samples) are often removed from the dataset prior to statistical analysis. Sometimes the definition of plume influence is arbitrary. For example, isotopic ratios that exceed an arbitrary cutoff may be eliminated from the dataset. In this way, the MORB dataset is forced to appear more homogenous than it really is. This method is commonly applied to 3 HerHe. Despite this , various ridges still have different means and variances, and these depend on spreading rate and ridge maturity.
The upper mantle, sub-continental lithosphere, and lower mantle are usually treated as distinct and accessible geochemical reservoirs. There is evidence, however, for ubiquitous small- to moderate-scale heterogeneity in the upper mantle, referred to as the statistical upper mantle assemblage ( SUMA) . This heterogeneity is the result of processes such as inefficient melt extraction and long-term plate tectonic recycling of sedimentary and crustal components. The SUMA
146 STATISTICS AND OTHER DAMN ED LIES
concept derives from the CLT and contrasts with the idea of a convectively homogenized MORB mantle reservoir, and different reservoirs for OIB where homogenization of the source is achieved by convective stirring and mixing. In contrast, in the SUMA model, the isotopic compositions of MORB and OIB are the outcome of homogenization during sampling, by partial melting and magma mixing. The primary homogenization process sampling upon melting and averaging, SUMA, does not require the participation of distinct (e.g. lower mantle) reservoirs to explain OIB compositions. Statistical distributions of lithologic components and sampling theory replace the concept of distinct, isolated geochemical reservoirs, and extensive solid-state convective stirring prior to sampling. In sampling theory terms, SUMA is the heterogenous population to be sampled - the probability density function. MORB represents a large scale sample, or average, from this population ; near-ridge seamounts are a smaller-scale sample; grain boundaries , fluidinclusions and melt-inclusions are very smallscale samples. MORB is uniform and does not have the extremes of composition because it is large-scale average of the sampled mantle. Mathematical and statistical treatments of isotopic heterogeneity of basalts and upper mantle assemblages are starting to replace the static reservoir and convective stirring concepts.
Bayesian statistics
The use of prior probabilities and subjective constraints external to the dataset is known as bayesian statistics [Harold Jeffreys bayesian statistics]. Bayesian reasoning is common in geophysical inversion problems and in the statistical treatments of isotope data. For example, it is often assumed that there are two populations in isotopic data - the MORB reservoir, corresponding to the 'convecting degassed upper mantle', and the OIB reservoir, assumed to be an isolated, more primitive, less-degassed, more variable reservoir in the lower mantle. Data are corrected or filtered to remove the influence of contamination or pollution by materials
from the 'wrong' reservoir, and then statistics is applied. In seismology, a prior or reference model is adopted and perturbations are made to this to satisfY new datasets .
Which kind of statistical approach is preferable in these situations? Bayesian methods have a long and controversial history. Bayesian reasoning has emerged from an intuitive to a formal level in many fields of science. Subjective probability was developed to quantifY the plausibility of events under circumstances of uncertainty. Bayes' theorem is a natural way of reasoning, e.g. www.ipac.caltech.edu/ level5/March01/Dagostini/Dagostini2.html.
There is an apparent contradiction between rigorous normal statistics and the intuition of geologists. Geologists' intuition resembles the less familiar bayesian approach; conclusions should not deviate too much from prior beliefs. On the other hand, a common objection to bayesian statistics is that science must be objective - there is no room for belief or prejudice. Science is not a matter of religion. But scientific beliefs and assumptions are always there, but often well hidden.
There are good reasons for applying bayesian methods to geological problems and geochemical datasets . First of all, geochemical data are often ratios, they cannot be negative. Conclusions should not depend on whether a ratio or its inverse is analysed. In the absence of information to the contrary it can be assumed that all values of 0 to infinity are equally probable in the underlying distribution (i.e. the magma source- or mantle- prior to sampling and averaging). Ruling out negative values already is a prior constraint. Sampling of a heterogenous source, according to the central limit theorem (CLT) will yield a peaked distribution that, in the limit of a large sample volume, is nOI'mal or log-normal. Many geochemical samples can be considered to have sampled fairly large volumes. These considerations are more critical for 3 Hej4He than for heavier isotopes since the spread of values about the mean is larger, and median values are not far from 0. Similarly, histograms of seismic wave travel-time residuals, which can be negative, or heat flow values, depend on the distance the rays travel or the number of samples averaged used to

characterize a heat flow province. Large volcanoes and global tomography average large volumes of the mantle.
Distributions are commonly asymmetric and skewed. Medians of isotope data are more robust measures than the arithmetic means, with which they commonly disagree. Log-normal distributions are more appropriate than linear Gaussian distributions for many geophysical and geochemical datasets. These are relatively mild applications of bayesian reasoning. Stronger bayesian priors would involve placing a low prior probability on certain ranges of values of the parameter being estimated, or on external parameters.
Basaltic volcanism is by nature an integrator of the underlying source. All volcanoes average, to a greater or lesser extent, the underlying heterogeneities. To determine the true heterogeneity of the mantle, samples from a large variety of environments are required, including fast and slow spreading ridges, small off-axis seamounts, fracture zones, new and dying ridges, various ridge depths , overlapping spreading centers, melt-starved regions, unstable ridge systems such as back-arc ridges, and so on. These regions are often avoided, as being anomalous. Various materials enter subduction zones, including sediments, altered oceanic crust and peridotite, and some of these are incorporated into the upper mantle. To the extent that anomalous materials are excluded, or anomalous regions left unsampled, the degree of true intrinsic heterogeneity of the mantle will be unknown. In essence, one must sample widely, collecting specimens that represent different degrees of melting and different source volumes. The data can be weighted or given low probability in the bayesian approach.
The main distinguishing feature of the bayesian approach is that it makes use of more information than the standard statistical approach. Whereas the latter is based on analysis of 'hard data ', i.e. data derived from a welldefined observation process, bayesian statistics accommodates 'prior information' which is usually less well specified and may even be subjective. This makes bayesian methods potentially more powerful, but also imposes the requirement for extra care in their use. In particular,
FALLACIES 147
we are no longer approaching an analysis in an 'open-minded' manner, allowing the data to determine the result. Instead, we input 'prior information' about what we think the answer is before we analyse the data! The danger of subjective bayesian priors, if improperly applied, is that prior beliefs become immune to data.
Fallacies
Logic, argument, rhetoric and fallacies are branches of philosophy; science started out as a branch of philosophy. Scientific truth is now treated differently from logical truth, or mathematical truth, and statistics. But in the search for scientific truth it is important not to make logical errors, and not to make arguments based on logical fallacies. The rules of logical inference form the foundation of good science.
A fallacy is an error in reasoning and differs from a factual or statistical error. A fallacy is an 'argument' in which the premises given for the conclusion do not provide the necessary support. Many of the paradoxes in Earth science, as discussed in the following chapters, are the result of poor assumptions or erroneous reasoning (l ogica l paradoxe s ) [mantleplumes fallac ies ].
The following chapters discuss some of the controversies and paradoxes in Earth science. Some of these can be traced to assumptions and fallacies. The following are a few examples of logical fallacies;
Midocean-ridge basalts are homogenous; therefore their mantle source is homogenous ; therefore it is vigorously convecting. therefore it is well stirred. (There are four logical fallacies in that sentence, and at least one factual error.)
Midocean-ridge basalts are derived fi·om the upper mantle; ocean-island basalts are not midocean-ridge basalts ; they therefore are derived from the lower mantle.
Seismic velocities and density decrease with temperature ; therefore regions of the mantle that have low seismic velocities are hotter and less dense than other regions .
Some other well known fallacies are categorized below, with examples. The examples are
148 STATISTICS AND OTHER DAMNED LIES
picked from an ongoing debate about the source of oceanic magmas and large igneous provinces.
Circulus in demonstrando and affirming the consequent Absolute plate motions agree well with the fixed hotspot hypothesis; therefore ...
Argumentum ad populum For many geoscientists, t he mantle-plume model is as well established as plate tectonics.
False dilemma and bifurcation A limited number of options (usually two) is given, while in reality there are more options (or perhaps only one). A false dilemma is a n illegitimate u se of the 'or' operator. Putting issues or
opinions into 'black or white' terms is a common instance of this fallacy.
Melting anomalies (oceanic islands, hotspots) are due to either high absolute temperatures or high degrees of melting
Plumes either come from the core-mantle boundary or the transition region.
Red herring and fallacy of irrelevant conclusion The upwelling mantle under Hawaii must also be 200
to 300 K hotter than the surrounding mantle to achieve the required large melt fractions ... such hot rock must come from a thermal boundary layer ... the core-mantle boundary is the most likely source, unless there is another interface within the mantle between compositionally distinct layers.
These are requirements of the plume hypothesis, not general requirements . Large melt volumes have a variety of explanations and thermal boundary layers are not essential for creating upwellings .
The ratio fallacy and the slippery slope fallacy The chemistry and isotopic composition of hotspot lavas indicate that the hotspots sample a part of the mantle distinct from that sampled by midocean-ridge basalts. High ratios imply high 3 He contents,
therefore an ancient undegassed reservoir, therefore the deep mantle.
Fallacy of irrelevant conclusion Numerical simulations of plum es reproduce many of the geophysical observations, such as the rate of m agma production and the topography and gravity anomalies produced by plume material as it spreads beneath the lithosphere. Therefore, ...
Fallacy of irrelevant conclusion, affirming the consequent and permissivity Theoretical and laboratory studies of fluids predict that plumes should form in the deep Earth because the core is much hotter than the mantle. Therefore hotspots are caused by plumes from the core-mantle boundary.
Con fu sion of 'should' with 'do' or 'must'.
Ignoratio elenchi and circulus in demonstrando Continental flood basalts (CFB) erupt a million cubic kilometers of basalt or more in 1 million years or less . TI1erefore plumes erupt a million cubic kilometers of basalt or more in 1 million years or less.
This circular argument is often used as a basis for supporting a plume model for CFB.
Some invalid deductive arguments are so common that logicians have tabulated them, and g iven some of them names; t h e fo llowing are just
a few:
IfP then Q Q Therefore, P
If P then Q Not-P Therefore, Not-Q
IfP then Q Therefore, if Not-P then Not-Q
The following statements can all be written in these forms:
We have a midocean-ridge basalt (MORB). It is from the upper mantle. We have a sample from the upper mantle. It is therefore MORE.
We have a sample that is not MORB. It therefore cannot come from the upper mantle.
These are all variants of the modus moron fallacy.
Hypothesis testing
In discussing the early history of quantum mechanics, Werner Heisenberg noted how difficult it is when we try to push new ideas into an old system of concepts belonging to an earlier philosophy and attempt to put new wine into old bottles. Paradigms differ from theories and hypotheses in that they represent a culture, a way of viewing the world. They come with sets of assumptions and dogmas that are shared by the community, but which are generally not stated. The standard models of geodynamics and mantle geochemistry combine the independent paradigms of rigid plate tectonics, the convective mantle and accessible but isolated reservoirs. These, in turn, spawned the plume paradigm. The assumptions hidden in 'the convective mantle' are that the upper mantle is homogenous, it is vigorously stirred by convection, and that MORB is homogenous and requires a homogenous source.
Seismic tomography uses inverse methods to convert seismic data to models of the interior. Because the sampling is so sparse and the data represent large-scale averages, and because the local properties of the interior are unknown, tomography is best used as a hypothesis tester rather than a method for determining definitive and unique structures. Probabilistic tomography maps are one way to display the results. The parameters are all given prior probabilities, as in bayesian statistics. Tomography is a form of large-scale averaging. Magmatism is another.
The technique of testing a hypothesis by assuming the opposite, is called reductio ad absurdum. A simpler more powerful theory often emerges when we drop the adjectives - such as rigid, accessible, homogenous - and reverse the assumptions. This technique is useful if an alternative to a popular reigning paradigm is not yet fully developed. One can at least test whether a
LANGUAGE : A GUIDE TO THE LITERATURE 149
standard model is more successful than its opposite, and whether paradoxes are the results of assumptions.
Language: a guide to the literature
We think only through the medium of words -The art of reasoning is nothing more than a language well arranged . Thus, while I thought myself employed only in forming a Nomenclature, and while I proposed to myself nothing more than to improve the chemical language, my work transformed itself by degrees, without my being able to prevent it, into a treatise upon the Elements of Chemistry.
... we cannot improve the language of any science without at the same time improving the science itself; neither can we, on the other hand , improve a science, without improving the language or nomenclature which belongs to it. However certain the facts of any science may be, and, however just the ideas we may have formed of these facts, we can only communicate false impressions to others, while we want words by which these may be properly expressed.
Antoine Lavoisier
The study of the Earth's interior involves a large number of parameters, some much more important than others, and a specialized language. Once we leave the familiar parameter range of the surface of the Earth and of the laboratory, our intuition often fails. Temperature is one of the key parameters of the Earth's interior but it is often over-used and abused; it is not an explanation of everything. But what could be more natural than to assume that volcanic islands are the result of hotter than average mantle? Or to assume that low seismic velocities in the mantle are caused by high mantle temperatures? The words hotspots and upwelling thermal plumes have been applied to these features. But the mantle is heterogenous; it is variable in composition and melting point and is not simply a homogenous ideal fluid with variable temperature. Pressure increases with depth and this changes the role and importance of temperature.
The study of the Earth's interior also involves a number of assumptions, often unstated. The unwary reader can be misled by semantics and assumptions and the following is a guide to both
ISO STATISTICS AND OTHER DAMN ED LIES
the parameters and assumptions that are used in the following chapters.
Temperature A rise in temperature generally decreases the density and the seismic velocity and it is usually assumed that temperature increases with depth. It does not follow that seismic velocity is a proxy for temperature and density. Rates of magmatism and crustal thicknesses are also not proxies for temperature.
The largest temperature variations in the mantle are across conduction boundary layers, plates and slabs; the high-temperature gradient allows the internal heat to be conducted away or the surrounding heat to be conducted in. The temperature rise across the upper thermal boundary layer (TBL) is about 1400 oc. Geophysical and petrological data are consistent with a variation of temperature of about 200 oc at any given depth in the mantle , averaged over several hundred lan.
Petrologically inferred temperature variations in the upper mantle are much lower than geophysically plausible estimates for the temperature change across the core-mantle boundary -CMB. This implies that deep mantle material does not get into the upper mantle or contribute to surface volcanism.
There are trade-offs between composition and temperature. Equally satisfactory fits to seismic data can be obtained using a range of plausible compositions and temperatures. If the mantle is homogenous in composition and if the lower mantle composition is the same as estimates of upper mantle peridotites, then the lower mantle is cold and iron-poor. On the other hand, if the lower mantle has chondri tic Mg/Si ratios then the same data require a hot and iron-rich lower mantle . In most cases , the inferred geotherms are subadiabatic.
In the calculation of seismic velocity, there are several temperature effects to be considered; intrinsic, extrinsic, anharmonic, anelastic, quantum and Arrhenius or exponential. In some of these, the associated density effect is small.
Potential temperature If a parcel of material at depth is brought to the surface on an adiabatic path (rapid upwelling)
it defines the potential temperature of the mantle at that point. Potential temperatures of the mantle vary by about 200 °C. Such variations in temperature are also required to cause the mantle to convect and are the result of plate tectonic processes such as subduction cooling and continental insulation.
Homologous temperature The homologous temperature is the absolute temperature divided by 'the melting temperature.' Many physical properties depend on this scaled temperature rather than on the absolute temperature. The homologous temperature varies from place to place in the mantle and this may be confused with variations of absolute temperature. This confusion has led to the hotspot hypothesis. There are other parameters that also control the locations and rates of excess magmatism at places called melting anomalies or hotspots.
Melting temperature Rocks begin to melt at the solidus and are completely molten at the liquidus. The addition of water and C02 and other 'impurities' such as potassium decrease the solidus temperature. The materials in the mantle have quite different melting temperatures; eclogite, for example, melts at temperatures about 200 K below the melting point of peridotite. Partially molten eclogite can be denser and colder than unmelted peridotite. Variations of seismic velocity in the upper mantle can be due to variations in lithology and melting temperature, in addition to variations in absolute temperature. A cold dense sinldng eclogite blobperhaps a bit of delaminated lower continental crust- can have low seismic velocities and high homologous temperature.
Adiabatic gradient The temperature gradient in the mantle is fundamental in prescribing properties , such as the composition, density, seismic velocity, viscosity, thermal conductivity and electrical conductivity. It is also essential in discussions of whole mantle vs . layered or stratified mantle convection. An adiabatic temperature gradient is commonly assumed. The adiabatic gradient is achieved by a homogenous self-compressed solid. A fluid heated from below will not convect until the radial

temperature gradient exceeds the adiabatic gradient by a given amount. The adiabat does not define a unique temperature; it defines a gradient. TI1e average temperature variation with depth is called the geotherm. Its basic form is almost always assumed to consist of adiabatic regions where temperatures rises slightly with depth (approximately 0.3 to 0.5 °Cjkm), and of narrow thermal boundary layers (TBL) where temperatures increase rapidly (approximately 5 to 10 °Cjkm) over a depth of a few hundred kilometers . If the mantle were entirely heated from below, was not experiencing secular cooling and if the mantle were a fluid with constant properties, the horizontally averaged temperature gradient would be adiabatic. Material brought up rapidly from depth without cooling by conduction or heating by radioactivity will follow an adiabatic path. The mantle geotherm is not, in general, along the adiabat; departures from an adiabat are due to secular cooling, internal radioactive heat production and the cooling from below by material that sank from the upper cold TEL. As a volume element rises through the mantle its temperature decreases in response to adiabatic decompression but at the same time its temperature increases due to internal heat released from radioactive decay. TI1e actual temperature gradient in the mantle can be slightly subadiabatic. The mantle geotherm away from thermal boundary layers may depart by as much as 500 K from the adiabat.
Pressure Pressure is not an intmt1ve parameter, at least in the pressure range of the deep mantle. For geophysical purposes it is the compression, or the volume, that controls physical properties. The specific volume, or inverse density, of the mantle decreases by about 30% from the top to the bottom and most physical properties are strong non-linear functions of volume. This is ignored in most simulations of mantle convection and the insight gained from these simulations is therefore restricted. Laboratory simulations of mantle convection cannot model this pressure effect. Since mantle dynamics is an example of a farjrom-equilibrium system that is sensitive to small perturbations in initial or boundary conditions, or changes in parameters , it is difficult,
LAN G UAG E: A GUID E T O TH E LITERATURE 151
or impossible, even under the best of conditions, to generalize from a small number of simulations or experiments.
Volume Equations of state can be cast into forms that involve P and T, or V and T. Many physical properties depend on P and T only in-so-far as the specific volume is changed . The intrinsic effect of T is often a small perturbation. TI1is is not true for radiative conductivity, rigidity and viscosity. Various laws of corresponding states, Debye theory, and the quasi-harmonic approximation are cast in terms of inter-atomic distances or volume. Usually, volume refers to specific volume. In discussions of sampling theory, volume will refer to the size of the sampled domain.
Composition Density, seismic velocity, melting temperature, fertility and so on are affected by changes in composition or lithology. TI1e mantle is a multicomponent system. Yet it is often assumed that the mantle is homogenous and that variations in seismic velocity and magmatism are controlled only by variations in temperature.
Phase changes Phase changes are responsible for most of the seismic velocity and density increases at 410- and 650-1011 depth. There are other seismic reflectors and scatterers in the mantle and some of these may be due to chemical or lithologic changes. Chemical boundaries are generally harder to detect than phase boundaries because they are more variable in depth and reflectivity or impedance, and their existence is not controlled by P and T. TI1e absence of features similar to 410-and 650-1011 discontinuities does not imply that there are no chemical variations in the mantle or that the mantle is not chemically stratified.
Ratios Geophysics, fluid dynamics and geochemistry abound in dimensionless ratios such as the Vp/Vs ratio, Poisson's ratio, Rayleigh number and isotopic ratios such as 3 Hef4 He. Ratios are handy but they do not constrain absolute values of the numerator and denominator. For example, high 3 Hef4 He ratios do not imply high 3 He-contents,
152 STATISTICS AND OTHER DAMNED LIES
or an undegassed reservoir. They also cannot be treated the same as other quantities in mixing calculations and in statistics. Means of ratios can be misleading. The robust measures of central tendency for ratios are the geometric mean and the median, these are invariant to inversion of the ratio. Arithmetic means of ratios are widely used, even in this book, but they can be misleading.
Convection vs. stirring Stirring is one way to homogenize a fluid . Gravity and centrifuging are good ways to de-homogenize a fluid. Thermal convection is not necessarily a good homogenizer. The mantle is stirred by plate motions and subduction but these also are not efficient homogenizers. Homogeneity of basalts is more likely to be a result of the central limit theorem; the averaging out of heterogeneity by the sampling process. Large-scale averages of the properties of the upper mantle tend toward Gaussian distributions with small variance.
Smaller-scale averages tend to have more outliers and these have given rise to ideas about different reservoirs. The convecting mantle is geochemical jargon for the upper mantle, the MOREreservoir or for the source of homogenous basalts. A homogenous product does not imply a homogenous source.
Plume This is a catch-all word in mantle studies, although it has a precise fluid dynamic meaning. In tomographic studies it means red, a region that has relatively slow seismic velocities. In isotope geochemistry it means any composition other than MORB. as in the plume component. In marine geophysics it is any anomalously shallow region. In geology it often means any region except ridges and arcs with extensive magmatism. In geophysics it means a hot buoyant upwelling from a deep unstable thermal boundary layer, heated from below. [do plumes exi s t]