statistical table 20: prevalence of antibodies against...
TRANSCRIPT
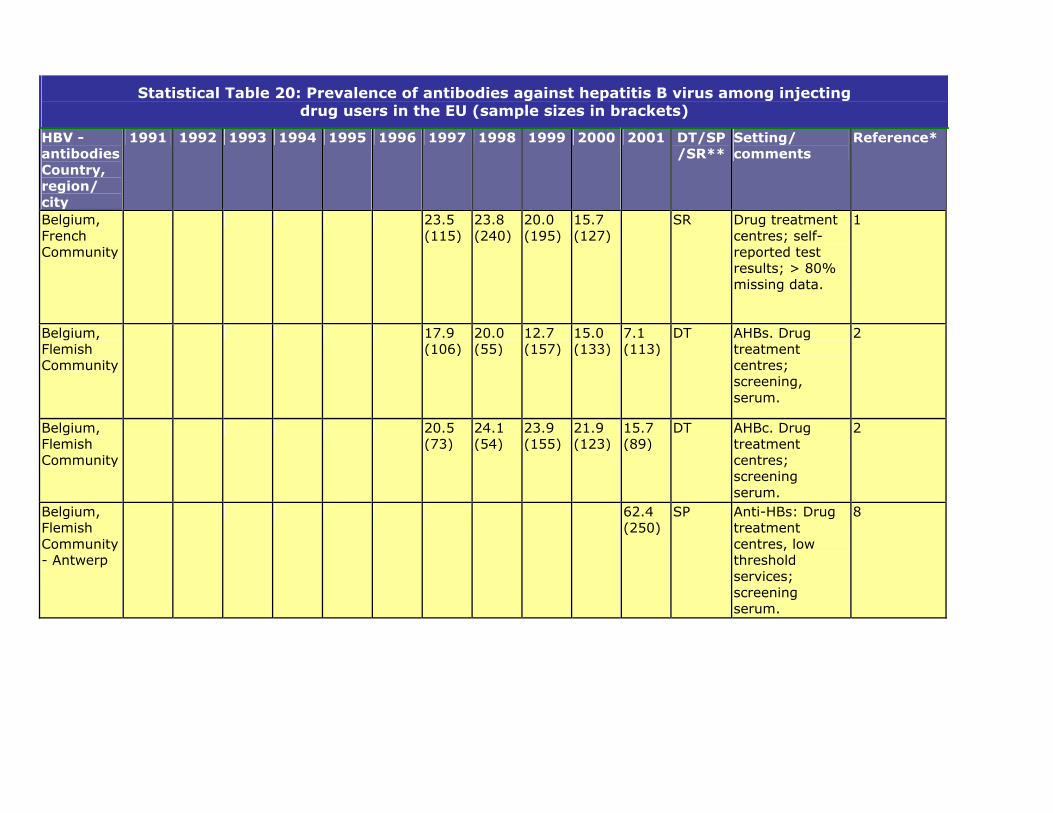
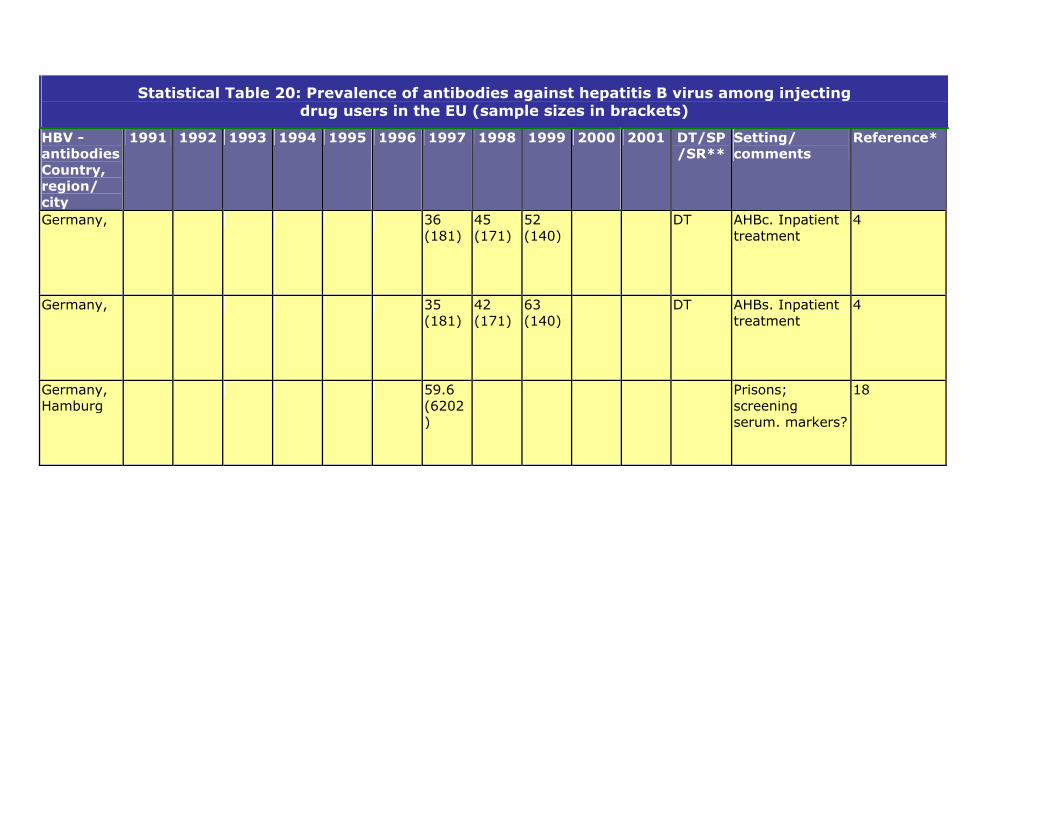
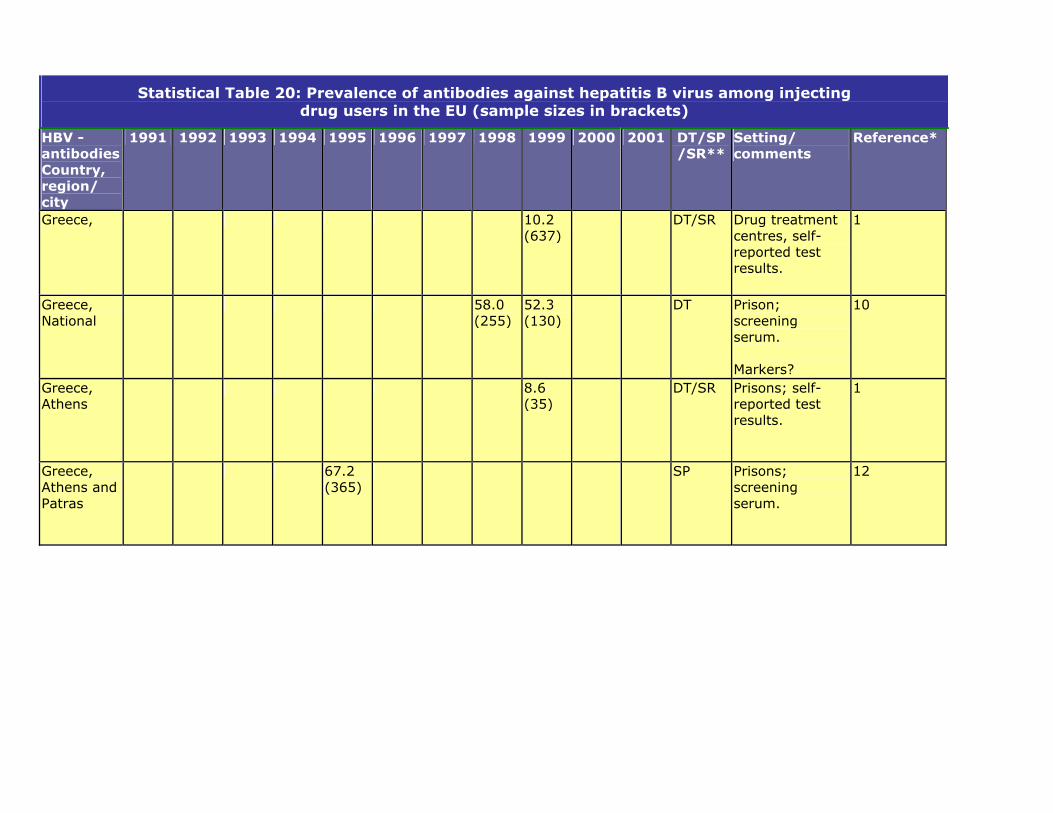
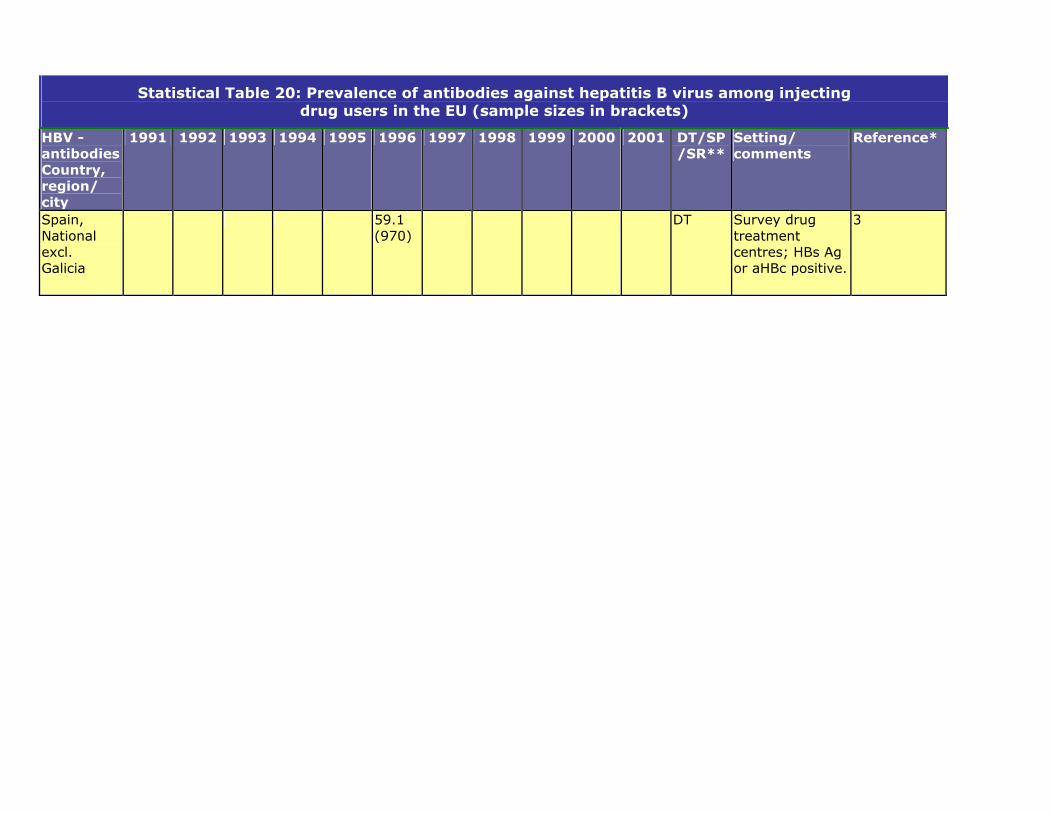
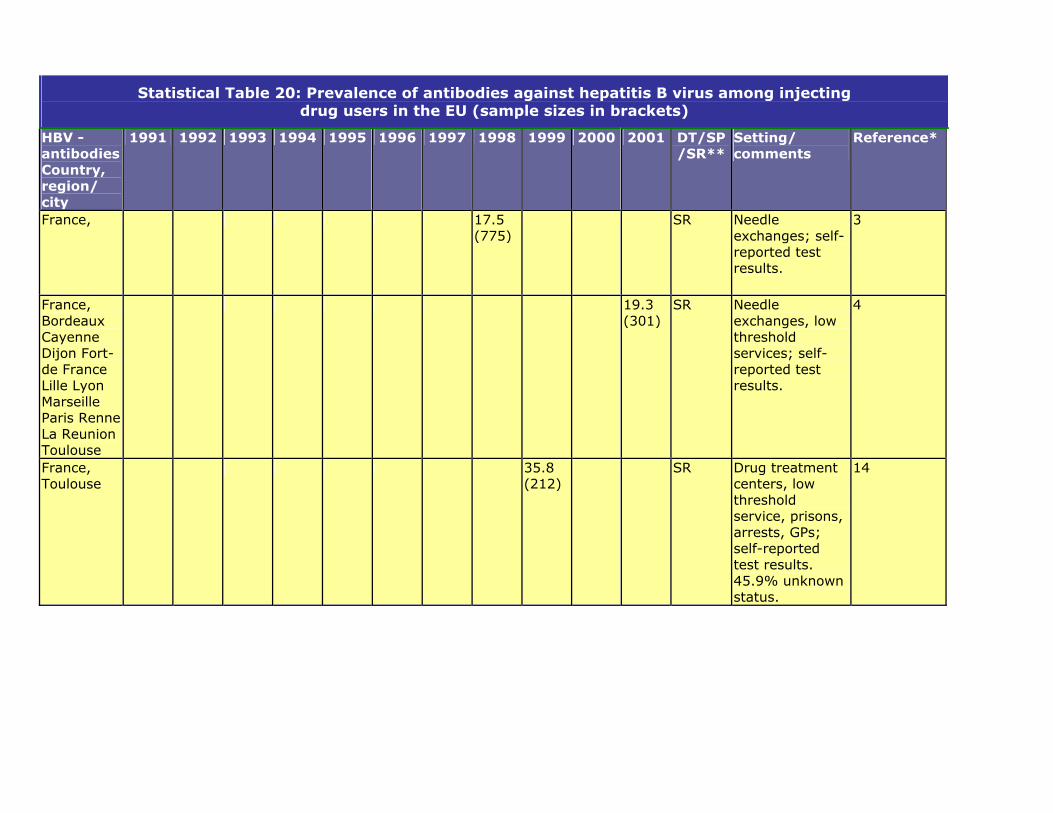
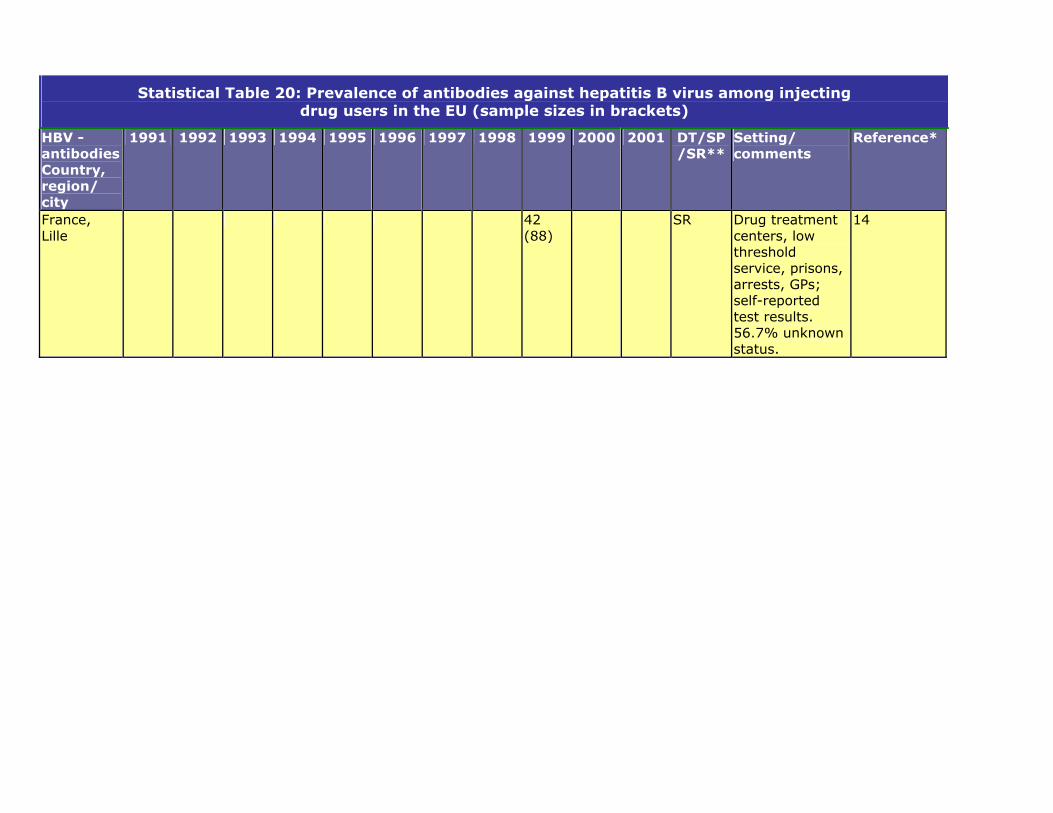
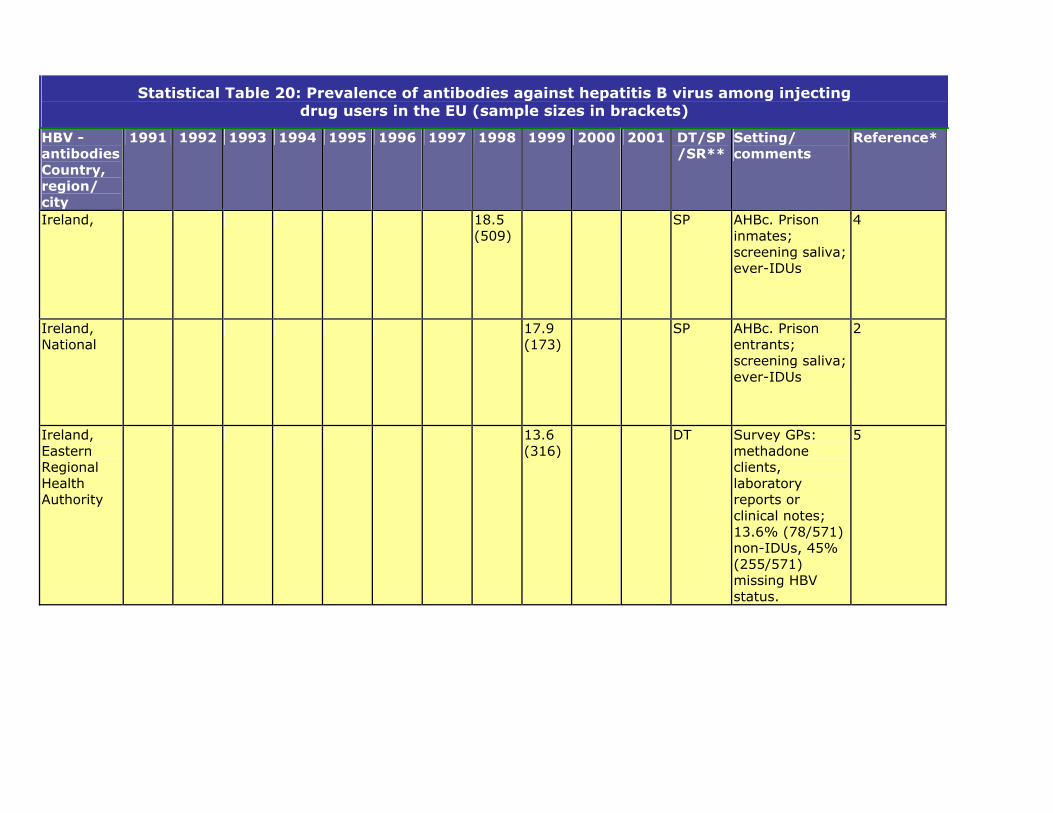
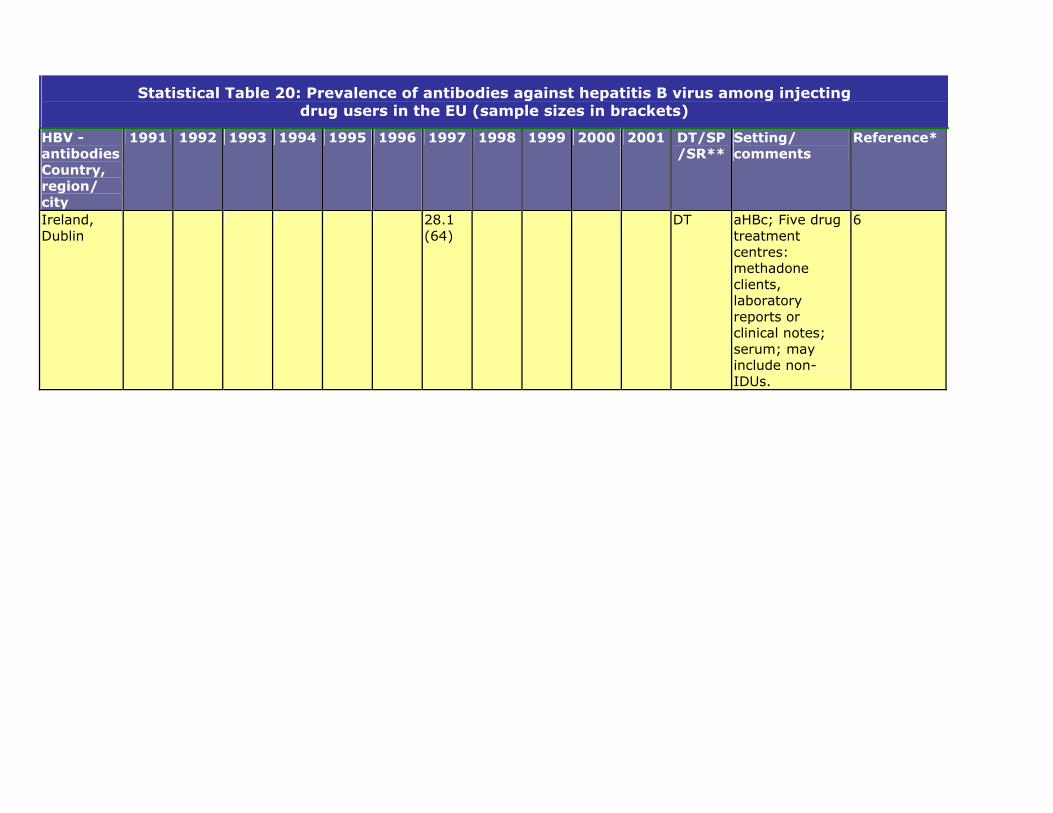
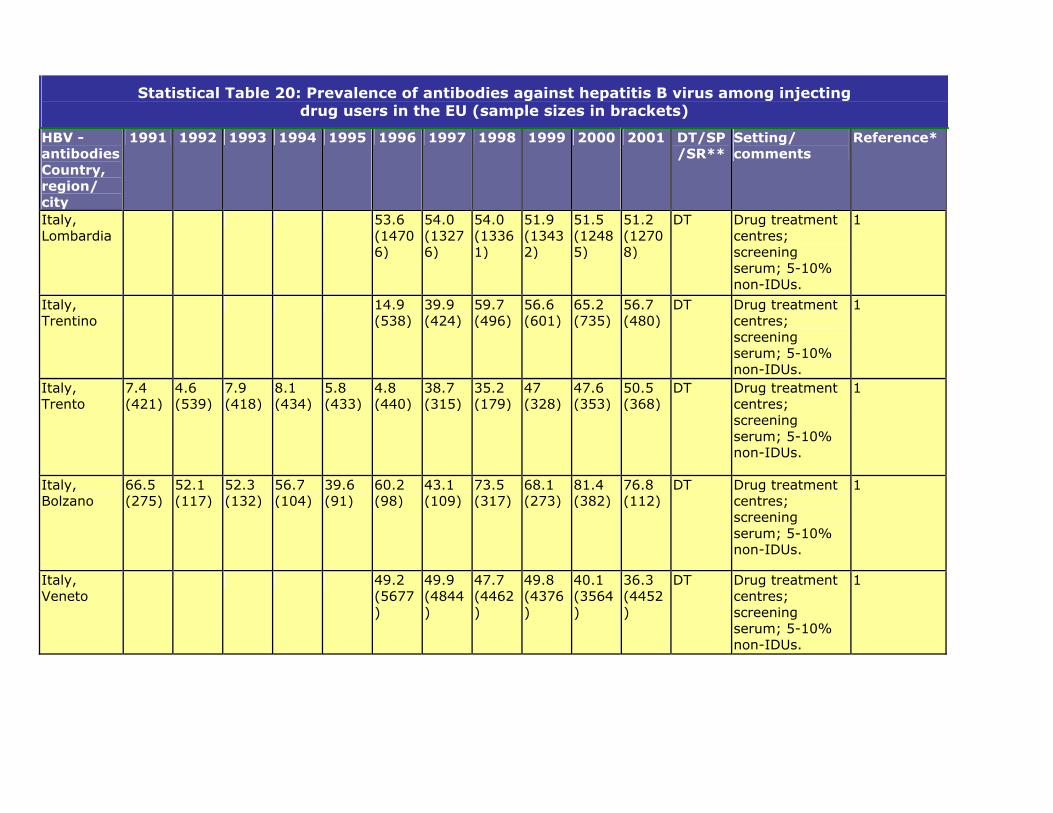
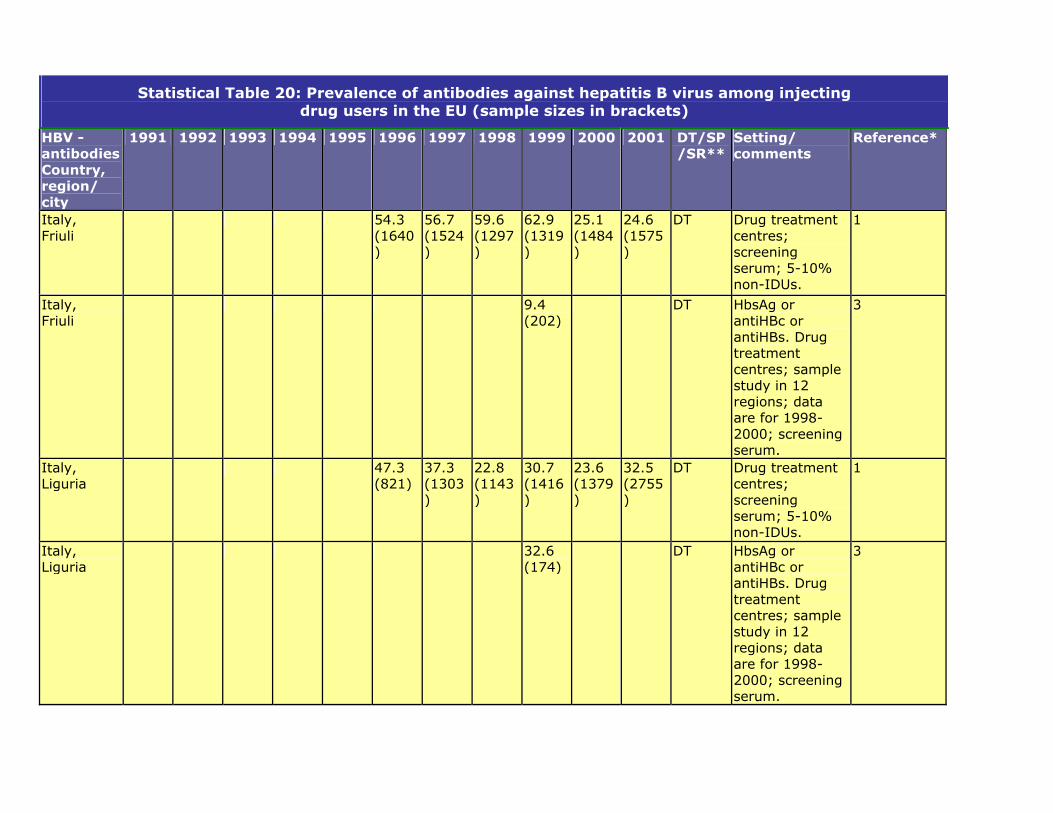
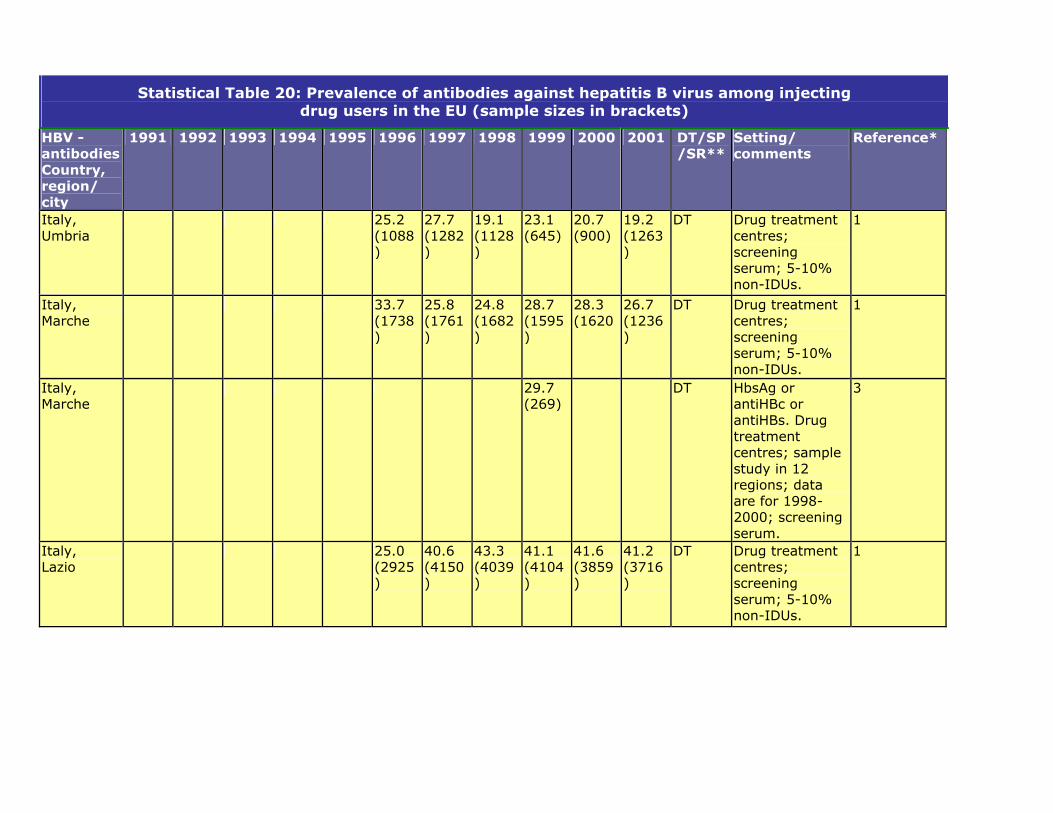
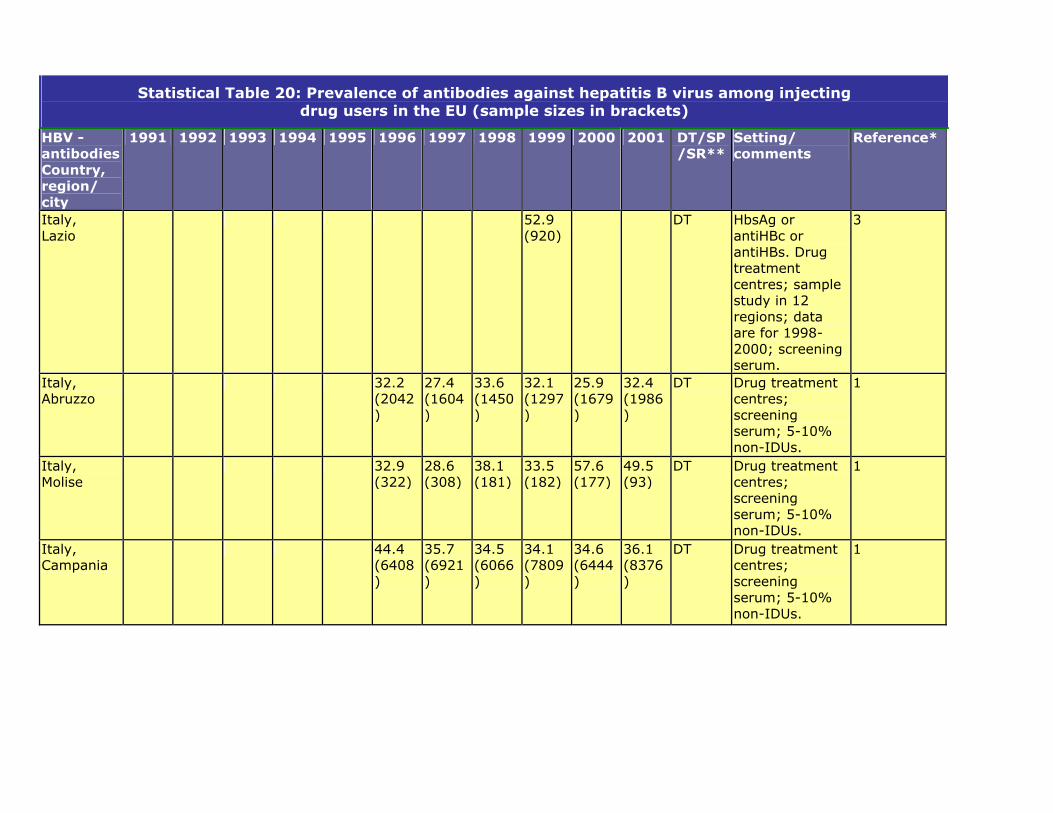
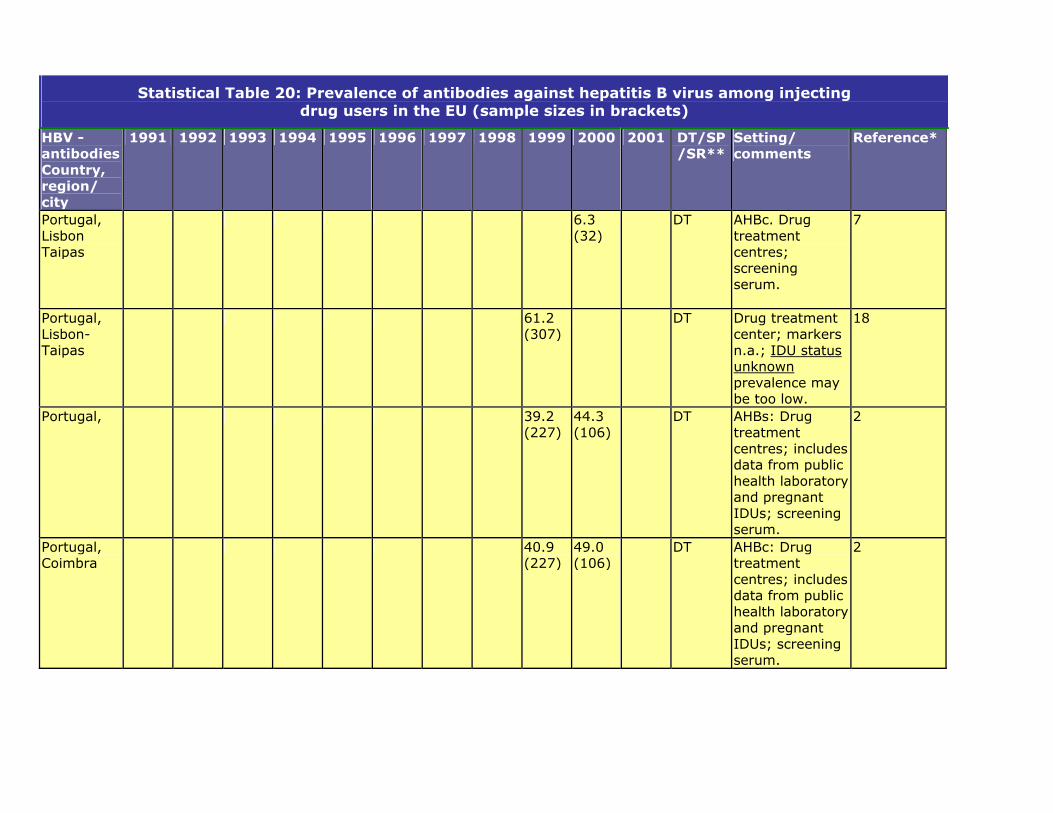
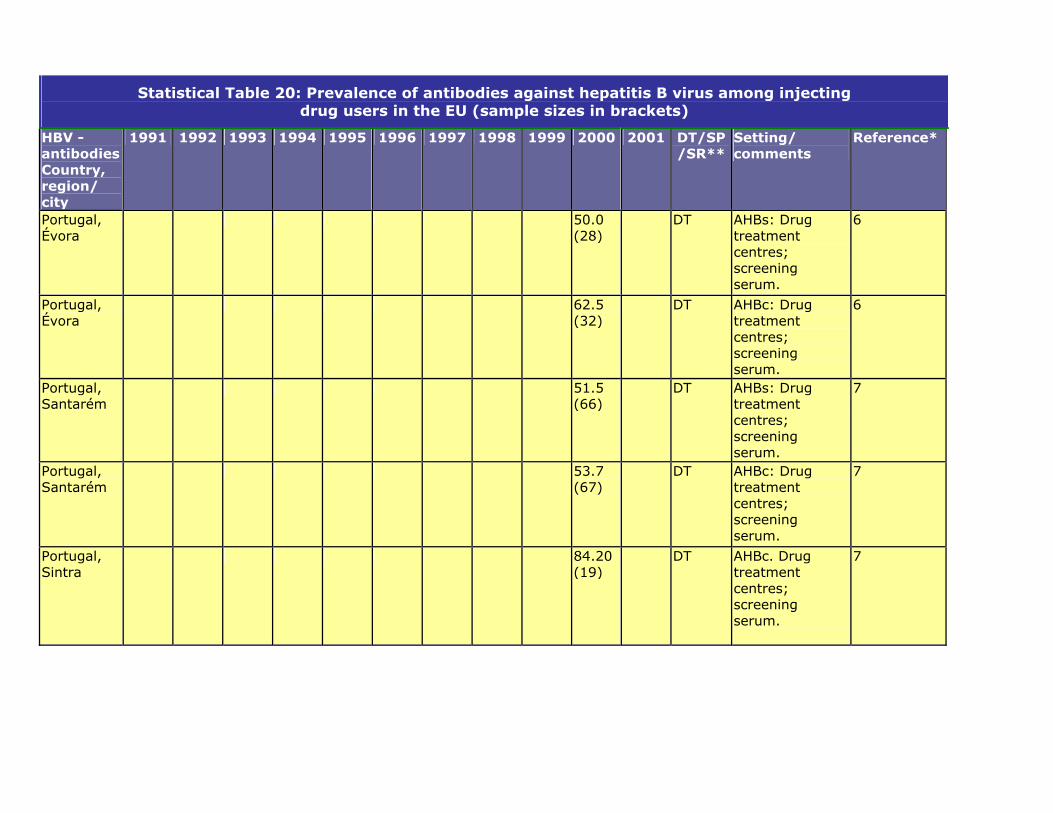
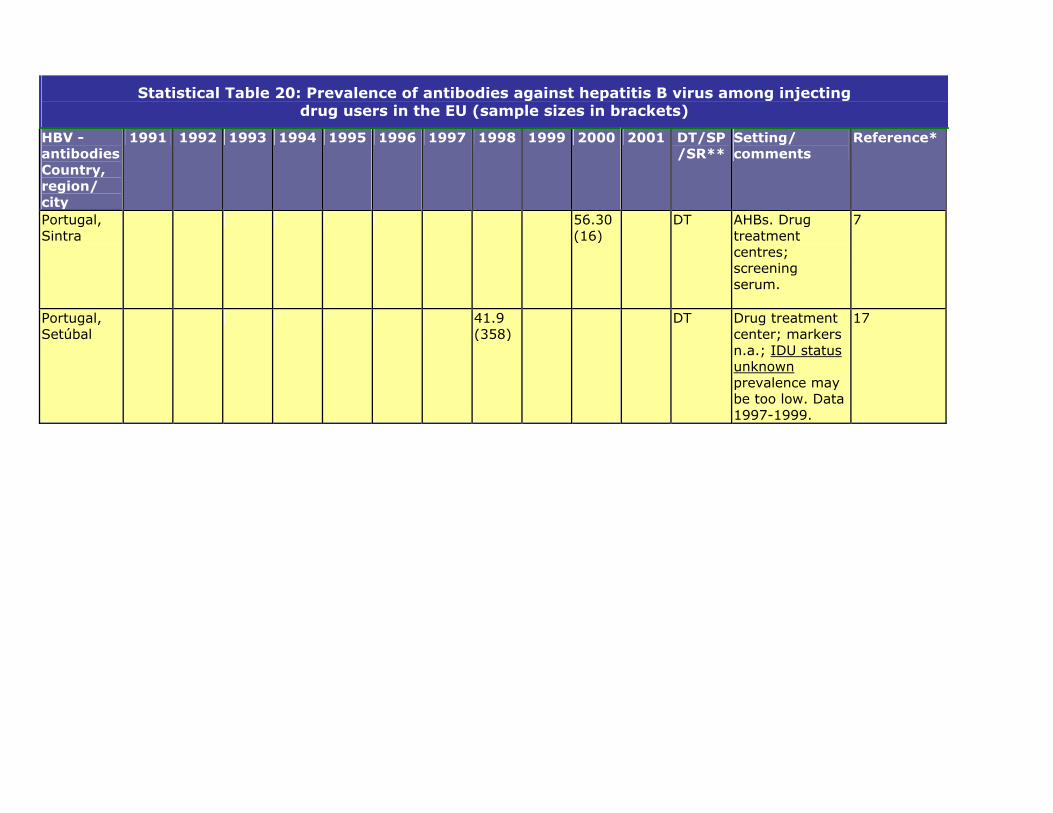
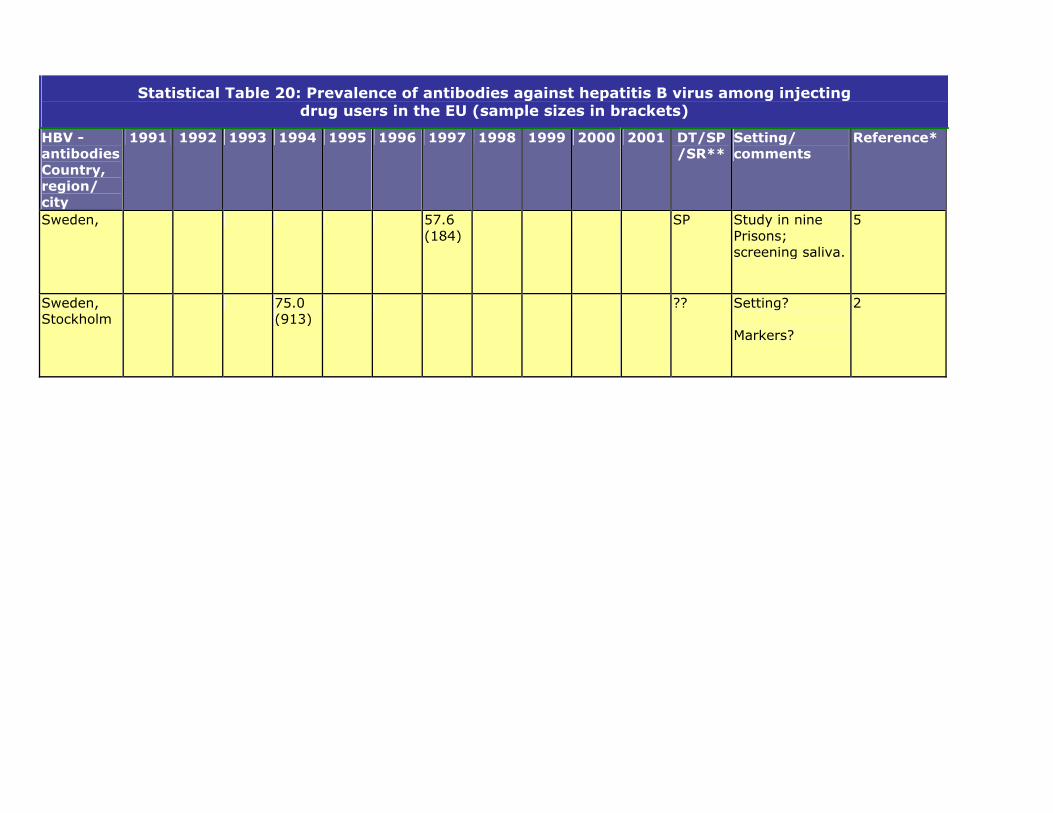
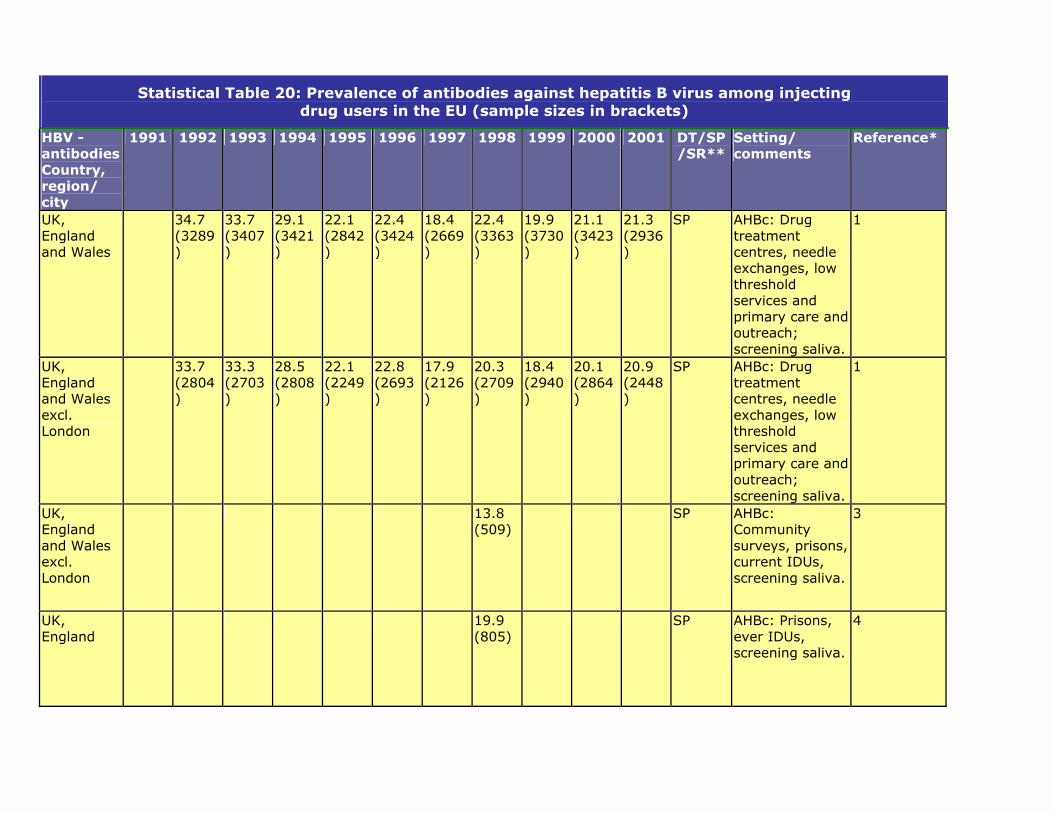
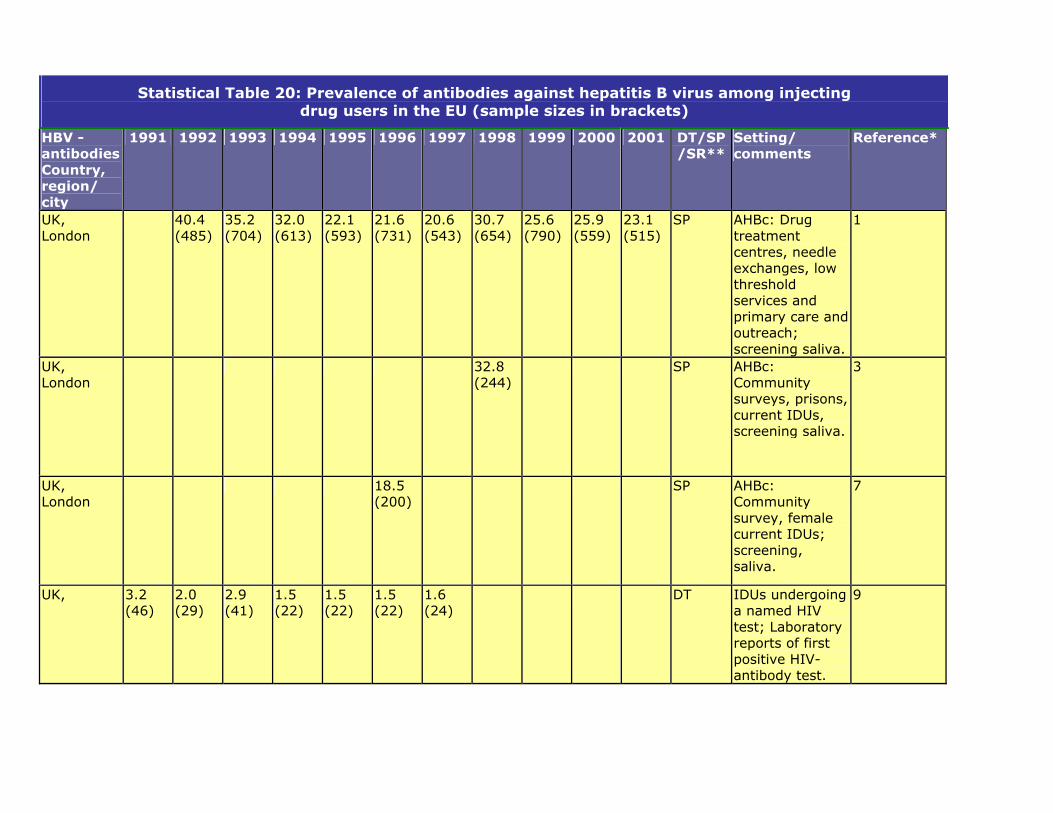
Statistical Table 20: Prevalence of antibodies against hepatitis B virus among injecting drug users in the EU (sample sizes in brackets)
HBV - antibodies Country, region/ city
1991 1992 1993 1994 1995 1996 1997 1998 1999 2000 2001 DT/SP /SR**
Setting/ comments
Reference*
Belgium, French Community
23.5 (115)
23.8 (240)
20.0 (195)
15.7 (127)
SR Drug treatment centres; self-reported test results; > 80% missing data.
1
Belgium, Flemish Community
17.9 (106)
20.0 (55)
12.7 (157)
15.0 (133)
7.1 (113)
DT AHBs. Drug treatment centres; screening, serum.
2
Belgium, Flemish Community
20.5 (73)
24.1 (54)
23.9 (155)
21.9 (123)
15.7 (89)
DT AHBc. Drug treatment centres; screening serum.
2
Belgium, Flemish Community - Antwerp
62.4 (250)
SP Anti-HBs: Drug treatment centres, low threshold services; screening serum.
8

Statistical Table 20: Prevalence of antibodies against hepatitis B virus among injecting drug users in the EU (sample sizes in brackets)
HBV - antibodies Country, region/ city
1991 1992 1993 1994 1995 1996 1997 1998 1999 2000 2001 DT/SP /SR**
Setting/ comments
Reference*
Belgium, Flemish Community -Antwerp
43.0 (249)
SP AHBc: Drug treatment centres, low threshold services, screening serum.
8
Belgium, French Community - Charleroi
16.0 (232)
35.7 (238)
SP All markers; general practitioners; screening serum.
10

Statistical Table 20: Prevalence of antibodies against hepatitis B virus among injecting drug users in the EU (sample sizes in brackets)
HBV - antibodies Country, region/ city
1991 1992 1993 1994 1995 1996 1997 1998 1999 2000 2001 DT/SP /SR**
Setting/ comments
Reference*
Denmark, Funen
68 (357)
SP AHBc or HBsAg: prison, drug treatment centres.
1
Denmark, Copenhagen
64 (247)
SP Drug treatment centres; serum.
2
Statistical Table 20: Prevalence of antibodies against hepatitis B virus among injecting drug users in the EU (sample sizes in brackets)
HBV - antibodies Country, region/ city
1991 1992 1993 1994 1995 1996 1997 1998 1999 2000 2001 DT/SP /SR**
Setting/ comments
Reference*
Germany, 36 (181)
45 (171)
52 (140)
DT AHBc. Inpatient treatment
4
Germany, 35 (181)
42 (171)
63 (140)
DT AHBs. Inpatient treatment
4
Germany, Hamburg
59.6 (6202)
Prisons; screening serum. markers?
18
Statistical Table 20: Prevalence of antibodies against hepatitis B virus among injecting drug users in the EU (sample sizes in brackets)
HBV - antibodies Country, region/ city
1991 1992 1993 1994 1995 1996 1997 1998 1999 2000 2001 DT/SP /SR**
Setting/ comments
Reference*
Greece, 10.2 (637)
DT/SR Drug treatment centres, self-reported test results.
1
Greece, National
58.0 (255)
52.3 (130)
DT Prison; screening serum. Markers?
10
Greece, Athens
8.6 (35)
DT/SR Prisons; self-reported test results.
1
Greece, Athens and Patras
67.2 (365)
SP Prisons; screening serum.
12
Statistical Table 20: Prevalence of antibodies against hepatitis B virus among injecting drug users in the EU (sample sizes in brackets)
HBV - antibodies Country, region/ city
1991 1992 1993 1994 1995 1996 1997 1998 1999 2000 2001 DT/SP /SR**
Setting/ comments
Reference*
Spain, National excl. Galicia
59.1 (970)
DT Survey drug treatment centres; HBs Ag or aHBc positive.
3
Statistical Table 20: Prevalence of antibodies against hepatitis B virus among injecting drug users in the EU (sample sizes in brackets)
HBV - antibodies Country, region/ city
1991 1992 1993 1994 1995 1996 1997 1998 1999 2000 2001 DT/SP /SR**
Setting/ comments
Reference*
France, 17.5 (775)
SR Needle exchanges; self-reported test results.
3
France, Bordeaux Cayenne Dijon Fort-de France Lille Lyon Marseille Paris Renne La Reunion Toulouse
19.3 (301)
SR Needle exchanges, low threshold services; self-reported test results.
4
France, Toulouse
35.8 (212)
SR Drug treatment centers, low threshold service, prisons, arrests, GPs; self-reported test results. 45.9% unknown status.
14
Statistical Table 20: Prevalence of antibodies against hepatitis B virus among injecting drug users in the EU (sample sizes in brackets)
HBV - antibodies Country, region/ city
1991 1992 1993 1994 1995 1996 1997 1998 1999 2000 2001 DT/SP /SR**
Setting/ comments
Reference*
France, Lille
42 (88)
SR Drug treatment centers, low threshold service, prisons, arrests, GPs; self-reported test results. 56.7% unknown status.
14
Statistical Table 20: Prevalence of antibodies against hepatitis B virus among injecting drug users in the EU (sample sizes in brackets)
HBV - antibodies Country, region/ city
1991 1992 1993 1994 1995 1996 1997 1998 1999 2000 2001 DT/SP /SR**
Setting/ comments
Reference*
Ireland, 18.5 (509)
SP AHBc. Prison inmates; screening saliva; ever-IDUs
4
Ireland, National
17.9 (173)
SP AHBc. Prison entrants; screening saliva; ever-IDUs
2
Ireland, Eastern Regional Health Authority
13.6 (316)
DT Survey GPs: methadone clients, laboratory reports or clinical notes; 13.6% (78/571) non-IDUs, 45% (255/571) missing HBV status.
5
Statistical Table 20: Prevalence of antibodies against hepatitis B virus among injecting drug users in the EU (sample sizes in brackets)
HBV - antibodies Country, region/ city
1991 1992 1993 1994 1995 1996 1997 1998 1999 2000 2001 DT/SP /SR**
Setting/ comments
Reference*
Ireland, Dublin
28.1 (64)
DT aHBc; Five drug treatment centres: methadone clients, laboratory reports or clinical notes; serum; may include non-IDUs.
6

Statistical Table 20: Prevalence of antibodies against hepatitis B virus among injecting drug users in the EU (sample sizes in brackets)
HBV - antibodies Country, region/ city
1991 1992 1993 1994 1995 1996 1997 1998 1999 2000 2001 DT/SP /SR**
Setting/ comments
Reference*
Italy, 43.8 (69092)
43.6 (68062)
45.3 (64629)
44.7 (63552)
44.5 (61873)
43.5 (66068)
DT Drug treatment centres; screening serum; 5-10% non-IDUs.
1
Italy, Sardegna Sicilia Calabria Campania Lazio Marche Toscana Emilia Romagna Liguria Friuli Piemonte Puglia
44.7 (6320)
DT HbsAg or antiHBc or antiHBs. Drug treatment centres; sample study in 12 regions; data are for 1998-2000; screening serum.
3
Italy, Piemonte
50.9 (7101)
52.5 (6201)
51.6 (6236)
48.0 (5941)
57.1 (5291)
53.3 (6179)
DT Drug treatment centres; screening serum; 5-10% non-IDUs.
1
Italy, Valle d’ Aosta
29.8 (94)
43.6 (163)
62.2 (127)
39.3 (135)
18.3 (71)
26.3 (57)
DT Drug treatment centres; screening serum; 5-10% non-IDUs.
1
Statistical Table 20: Prevalence of antibodies against hepatitis B virus among injecting drug users in the EU (sample sizes in brackets)
HBV - antibodies Country, region/ city
1991 1992 1993 1994 1995 1996 1997 1998 1999 2000 2001 DT/SP /SR**
Setting/ comments
Reference*
Italy, Lombardia
53.6 (14706)
54.0 (13276)
54.0 (13361)
51.9 (13432)
51.5 (12485)
51.2 (12708)
DT Drug treatment centres; screening serum; 5-10% non-IDUs.
1
Italy, Trentino
14.9 (538)
39.9 (424)
59.7 (496)
56.6 (601)
65.2 (735)
56.7 (480)
DT Drug treatment centres; screening serum; 5-10% non-IDUs.
1
Italy, Trento
7.4 (421)
4.6 (539)
7.9 (418)
8.1 (434)
5.8 (433)
4.8 (440)
38.7 (315)
35.2 (179)
47 (328)
47.6 (353)
50.5 (368)
DT Drug treatment centres; screening serum; 5-10% non-IDUs.
1
Italy, Bolzano
66.5 (275)
52.1 (117)
52.3 (132)
56.7 (104)
39.6 (91)
60.2 (98)
43.1 (109)
73.5 (317)
68.1 (273)
81.4 (382)
76.8 (112)
DT Drug treatment centres; screening serum; 5-10% non-IDUs.
1
Italy, Veneto
49.2 (5677)
49.9 (4844)
47.7 (4462)
49.8 (4376)
40.1 (3564)
36.3 (4452)
DT Drug treatment centres; screening serum; 5-10% non-IDUs.
1
Statistical Table 20: Prevalence of antibodies against hepatitis B virus among injecting drug users in the EU (sample sizes in brackets)
HBV - antibodies Country, region/ city
1991 1992 1993 1994 1995 1996 1997 1998 1999 2000 2001 DT/SP /SR**
Setting/ comments
Reference*
Italy, Friuli
54.3 (1640)
56.7 (1524)
59.6 (1297)
62.9 (1319)
25.1 (1484)
24.6 (1575)
DT Drug treatment centres; screening serum; 5-10% non-IDUs.
1
Italy, Friuli
9.4 (202)
DT HbsAg or antiHBc or antiHBs. Drug treatment centres; sample study in 12 regions; data are for 1998-2000; screening serum.
3
Italy, Liguria
47.3 (821)
37.3 (1303)
22.8 (1143)
30.7 (1416)
23.6 (1379)
32.5 (2755)
DT Drug treatment centres; screening serum; 5-10% non-IDUs.
1
Italy, Liguria
32.6 (174)
DT HbsAg or antiHBc or antiHBs. Drug treatment centres; sample study in 12 regions; data are for 1998-2000; screening serum.
3

Statistical Table 20: Prevalence of antibodies against hepatitis B virus among injecting drug users in the EU (sample sizes in brackets)
HBV - antibodies Country, region/ city
1991 1992 1993 1994 1995 1996 1997 1998 1999 2000 2001 DT/SP /SR**
Setting/ comments
Reference*
Italy, Emilia Romagna
47.5 (6121)
50.0 (5995)
62.0 (3775)
61.5 (3809)
68.4 (3479)
70.0 (3494)
DT Drug treatment centres; screening serum; 5-10% non-IDUs.
1
Italy, Emilia Romagna
67.0 (336)
DT HbsAg or antiHBc or antiHBs. Drug treatment centres; sample study in 12 regions; data are for 1998-2000; screening serum.
3
Italy, Toscana
32.3 (3170)
43.6 (4116)
45.9 (3737)
43.1 (3815)
40.9 (4586)
47.3 (3697)
DT Drug treatment centres; screening serum; 5-10% non-IDUs.
1
Italy, Toscana
39.0 (490)
DT HbsAg or antiHBc or antiHBs. Drug treatment centres; sample study in 12 regions; data are for 1998-2000; screening serum.
3
Statistical Table 20: Prevalence of antibodies against hepatitis B virus among injecting drug users in the EU (sample sizes in brackets)
HBV - antibodies Country, region/ city
1991 1992 1993 1994 1995 1996 1997 1998 1999 2000 2001 DT/SP /SR**
Setting/ comments
Reference*
Italy, Umbria
25.2 (1088)
27.7 (1282)
19.1 (1128)
23.1 (645)
20.7 (900)
19.2 (1263)
DT Drug treatment centres; screening serum; 5-10% non-IDUs.
1
Italy, Marche
33.7 (1738)
25.8 (1761)
24.8 (1682)
28.7 (1595)
28.3 (1620
26.7 (1236)
DT Drug treatment centres; screening serum; 5-10% non-IDUs.
1
Italy, Marche
29.7 (269)
DT HbsAg or antiHBc or antiHBs. Drug treatment centres; sample study in 12 regions; data are for 1998-2000; screening serum.
3
Italy, Lazio
25.0 (2925)
40.6 (4150)
43.3 (4039)
41.1 (4104)
41.6 (3859)
41.2 (3716)
DT Drug treatment centres; screening serum; 5-10% non-IDUs.
1
Statistical Table 20: Prevalence of antibodies against hepatitis B virus among injecting drug users in the EU (sample sizes in brackets)
HBV - antibodies Country, region/ city
1991 1992 1993 1994 1995 1996 1997 1998 1999 2000 2001 DT/SP /SR**
Setting/ comments
Reference*
Italy, Lazio
52.9 (920)
DT HbsAg or antiHBc or antiHBs. Drug treatment centres; sample study in 12 regions; data are for 1998-2000; screening serum.
3
Italy, Abruzzo
32.2 (2042)
27.4 (1604)
33.6 (1450)
32.1 (1297)
25.9 (1679)
32.4 (1986)
DT
Drug treatment centres; screening serum; 5-10% non-IDUs.
1
Italy, Molise
32.9 (322)
28.6 (308)
38.1 (181)
33.5 (182)
57.6 (177)
49.5 (93)
DT Drug treatment centres; screening serum; 5-10% non-IDUs.
1
Italy, Campania
44.4 (6408)
35.7 (6921)
34.5 (6066)
34.1 (7809)
34.6 (6444)
36.1 (8376)
DT Drug treatment centres; screening serum; 5-10% non-IDUs.
1
Statistical Table 20: Prevalence of antibodies against hepatitis B virus among injecting drug users in the EU (sample sizes in brackets)
HBV - antibodies Country, region/ city
1991 1992 1993 1994 1995 1996 1997 1998 1999 2000 2001 DT/SP /SR**
Setting/ comments
Reference*
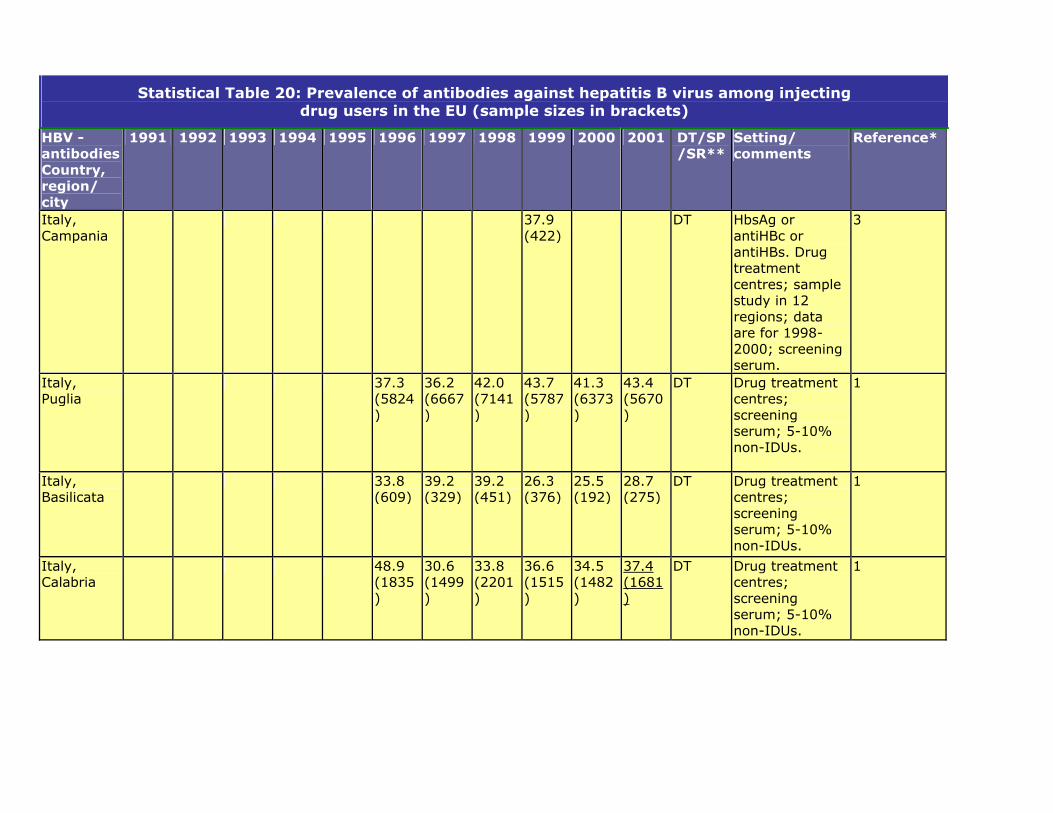
Italy, Campania
37.9 (422)
DT HbsAg or antiHBc or antiHBs. Drug treatment centres; sample study in 12 regions; data are for 1998-2000; screening serum.
3
Italy, Puglia
37.3 (5824)
36.2 (6667)
42.0 (7141)
43.7 (5787)
41.3 (6373)
43.4 (5670)
DT Drug treatment centres; screening serum; 5-10% non-IDUs.
1
Italy, Basilicata
33.8 (609)
39.2 (329)
39.2 (451)
26.3 (376)
25.5 (192)
28.7 (275)
DT Drug treatment centres; screening serum; 5-10% non-IDUs.
1
Italy, Calabria
48.9 (1835)
30.6 (1499)
33.8 (2201)
36.6 (1515)
34.5 (1482)
37.4 (1681)
DT Drug treatment centres; screening serum; 5-10% non-IDUs.
1

Statistical Table 20: Prevalence of antibodies against hepatitis B virus among injecting drug users in the EU (sample sizes in brackets)
HBV - antibodies Country, region/ city
1991 1992 1993 1994 1995 1996 1997 1998 1999 2000 2001 DT/SP /SR**
Setting/ comments
Reference*
Italy, Calabria
24.0 (263)
DT HbsAg or antiHBc or antiHBs. Drug treatment centres; sample study in 12 regions; data are for 1998-2000; screening serum.
3
Italy, Sicilia
29.0 (4071)
25.5 (3622)
33.1 (3106)
28.7 (3456)
39.1 (4263)
27.7 (4500)
DT Drug treatment centres; screening serum; 5-10% non-IDUs.
1
Italy, Sicilia
24.4 (614)
DT HbsAg or antiHBc or antiHBs. Drug treatment centres; sample study in 12 regions; data are for 1998-2000; screening serum.
3
Italy, Sardegna
41.2 (2362)
49.8 (2073)
49.2 (2550)
59.6 (1942)
72.8 (1810)
69.8 (1875)
DT Drug treatment centres; screening serum; 5-10% non-IDUs.
1

Statistical Table 20: Prevalence of antibodies against hepatitis B virus among injecting drug users in the EU (sample sizes in brackets)
HBV - antibodies Country, region/ city
1991 1992 1993 1994 1995 1996 1997 1998 1999 2000 2001 DT/SP /SR**
Setting/ comments
Reference*
Italy, Sardegna
49.6 (683)
DT HbsAg or antiHBc or antiHBs. Drug treatment centres; sample study in 12 regions; data are for 1998-2000; screening serum.
3
Statistical Table 20: Prevalence of antibodies against hepatitis B virus among injecting drug users in the EU (sample sizes in brackets)
HBV - antibodies Country, region/ city
1991 1992 1993 1994 1995 1996 1997 1998 1999 2000 2001 DT/SP /SR**
Setting/ comments
Reference*
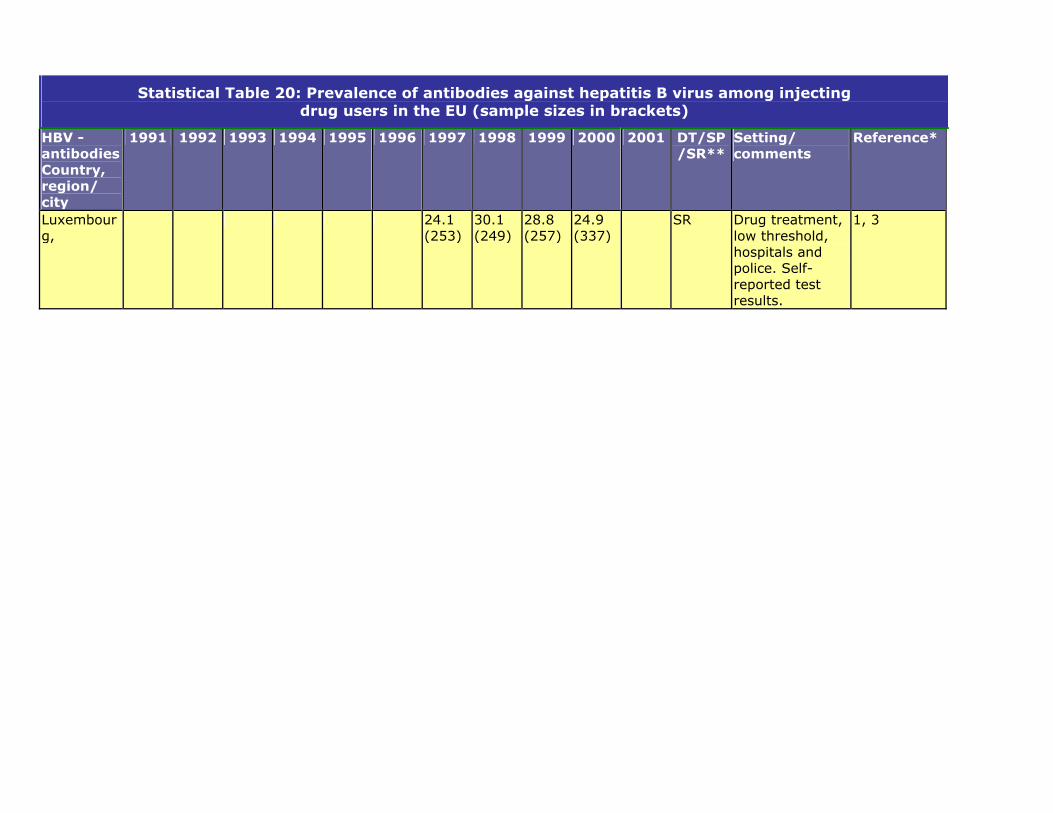
Luxembourg,
24.1 (253)
30.1 (249)
28.8 (257)
24.9 (337)
SR Drug treatment, low threshold, hospitals and police. Self-reported test results.
1, 3
Statistical Table 20: Prevalence of antibodies against hepatitis B virus among injecting drug users in the EU (sample sizes in brackets)
HBV - antibodies Country, region/ city
1991 1992 1993 1994 1995 1996 1997 1998 1999 2000 2001 DT/SP /SR**
Setting/ comments
Reference*
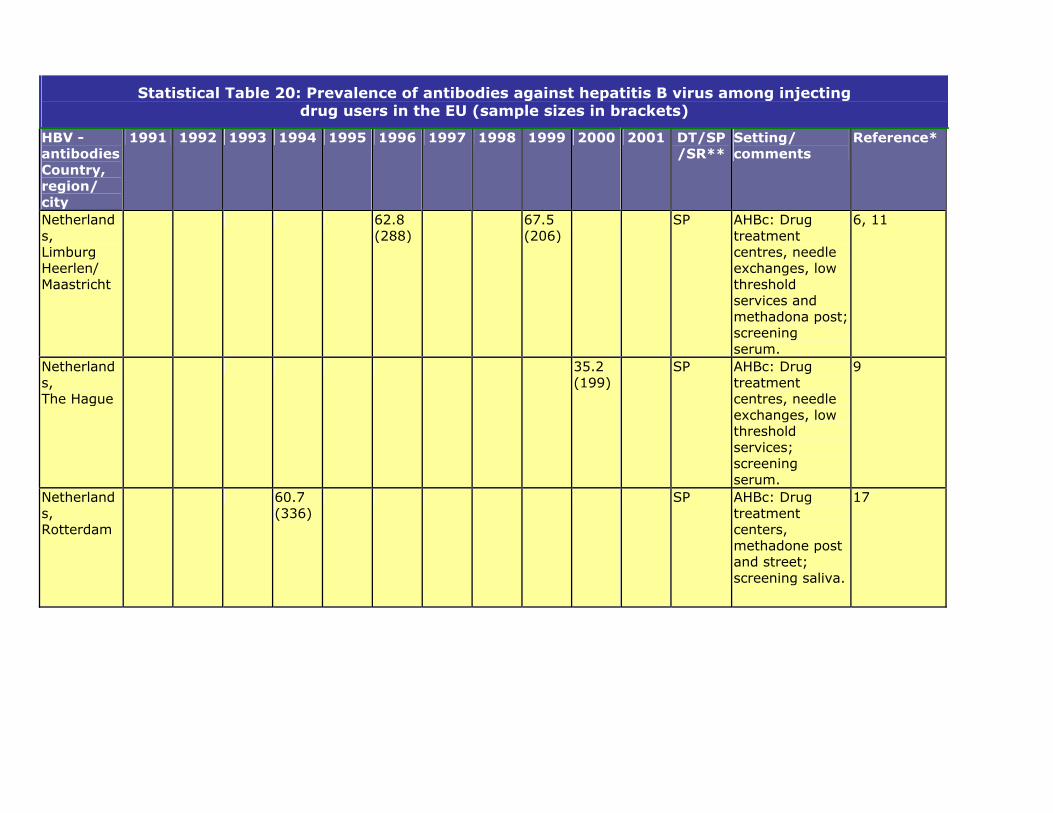
Netherlands, Limburg Heerlen/ Maastricht
62.8 (288)
67.5 (206)
SP AHBc: Drug treatment centres, needle exchanges, low threshold services and methadona post; screening serum.
6, 11
Netherlands, The Hague
35.2 (199)
SP AHBc: Drug treatment centres, needle exchanges, low threshold services; screening serum.
9
Netherlands, Rotterdam
60.7 (336)
SP AHBc: Drug treatment centers, methadone post and street; screening saliva.
17
Statistical Table 20: Prevalence of antibodies against hepatitis B virus among injecting drug users in the EU (sample sizes in brackets)
HBV - antibodies Country, region/ city
1991 1992 1993 1994 1995 1996 1997 1998 1999 2000 2001 DT/SP /SR**
Setting/ comments
Reference*
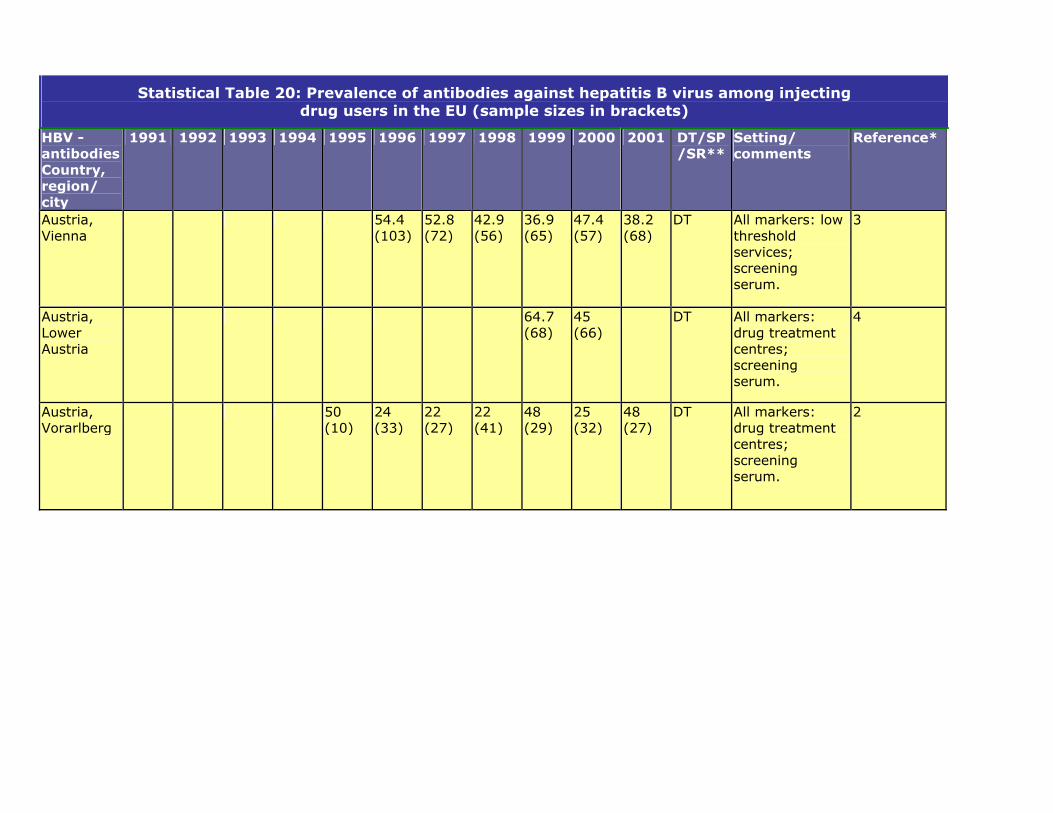
Austria, Vienna
54.4 (103)
52.8 (72)
42.9 (56)
36.9 (65)
47.4 (57)
38.2 (68)
DT All markers: low threshold services; screening serum.
3
Austria, Lower Austria
64.7 (68)
45 (66)
DT All markers: drug treatment centres; screening serum.
4
Austria, Vorarlberg
50 (10)
24 (33)
22 (27)
22 (41)
48 (29)
25 (32)
48 (27)
DT All markers: drug treatment centres; screening serum.
2

Statistical Table 20: Prevalence of antibodies against hepatitis B virus among injecting drug users in the EU (sample sizes in brackets)
HBV - antibodies Country, region/ city
1991 1992 1993 1994 1995 1996 1997 1998 1999 2000 2001 DT/SP /SR**
Setting/ comments
Reference*
Portugal, National
28.5 (988)
DT Drug treatment centers; markersn.a.; IDU status unknown prevalence may be too low.
16
Portugal, Lisbon
64.3 (252)
DT AHBc: Study low-threshold services 1998/99, IDU status unknown prevalence may be too low; screening serum.
4
Portugal, Lisbon Xabregas
65.0 (417)
DT Drug treatment centers; markersn.a.; IDU status unknown prevalence may be too low.
18
Portugal, Lisbon Taipas
41.20 (34)
DT AHBs. Drug treatment centres; screening serum.
7
Statistical Table 20: Prevalence of antibodies against hepatitis B virus among injecting drug users in the EU (sample sizes in brackets)
HBV - antibodies Country, region/ city
1991 1992 1993 1994 1995 1996 1997 1998 1999 2000 2001 DT/SP /SR**
Setting/ comments
Reference*
Portugal, Lisbon Taipas
6.3 (32)
DT AHBc. Drug treatment centres; screening serum.
7
Portugal, Lisbon-Taipas
61.2 (307)
DT Drug treatment center; markers n.a.; IDU status unknown prevalence may be too low.
18
Portugal, 39.2 (227)
44.3 (106)
DT AHBs: Drug treatment centres; includes data from public health laboratoryand pregnant IDUs; screening serum.
2
Portugal, Coimbra
40.9 (227)
49.0 (106)
DT AHBc: Drug treatment centres; includes data from public health laboratoryand pregnant IDUs; screening serum.
2
Statistical Table 20: Prevalence of antibodies against hepatitis B virus among injecting drug users in the EU (sample sizes in brackets)
HBV - antibodies Country, region/ city
1991 1992 1993 1994 1995 1996 1997 1998 1999 2000 2001 DT/SP /SR**
Setting/ comments
Reference*
Portugal, Évora
50.0 (28)
DT AHBs: Drug treatment centres; screening serum.
6
Portugal, Évora
62.5 (32)
DT AHBc: Drug treatment centres; screening serum.
6
Portugal, Santarém
51.5 (66)
DT AHBs: Drug treatment centres; screening serum.
7
Portugal, Santarém
53.7 (67)
DT AHBc: Drug treatment centres; screening serum.
7
Portugal, Sintra
84.20 (19)
DT AHBc. Drug treatment centres; screening serum.
7
Statistical Table 20: Prevalence of antibodies against hepatitis B virus among injecting drug users in the EU (sample sizes in brackets)
HBV - antibodies Country, region/ city
1991 1992 1993 1994 1995 1996 1997 1998 1999 2000 2001 DT/SP /SR**
Setting/ comments
Reference*
Portugal, Sintra
56.30 (16)
DT AHBs. Drug treatment centres; screening serum.
7
Portugal, Setúbal
41.9 (358)
DT Drug treatment center; markers n.a.; IDU status unknown prevalence may be too low. Data 1997-1999.
17
Statistical Table 20: Prevalence of antibodies against hepatitis B virus among injecting drug users in the EU (sample sizes in brackets)
HBV - antibodies Country, region/ city
1991 1992 1993 1994 1995 1996 1997 1998 1999 2000 2001 DT/SP /SR**
Setting/ comments
Reference*
Sweden, 57.6 (184)
SP Study in nine Prisons; screening saliva.
5
Sweden, Stockholm
75.0 (913)
?? Setting? Markers?
2
Statistical Table 20: Prevalence of antibodies against hepatitis B virus among injecting drug users in the EU (sample sizes in brackets)
HBV - antibodies Country, region/ city
1991 1992 1993 1994 1995 1996 1997 1998 1999 2000 2001 DT/SP /SR**
Setting/ comments
Reference*
UK, England and Wales
34.7 (3289)
33.7 (3407)
29.1 (3421)
22.1 (2842)
22.4 (3424)
18.4 (2669)
22.4 (3363)
19.9 (3730)
21.1 (3423)
21.3 (2936)
SP AHBc: Drug treatment centres, needle exchanges, low threshold services and primary care and outreach; screening saliva.
1
UK, England and Wales excl. London
33.7 (2804)
33.3 (2703)
28.5 (2808)
22.1 (2249)
22.8 (2693)
17.9 (2126)
20.3 (2709)
18.4 (2940)
20.1 (2864)
20.9 (2448)
SP AHBc: Drug treatment centres, needle exchanges, low threshold services and primary care and outreach; screening saliva.
1
UK, England and Wales excl. London
13.8 (509)
SP AHBc: Community surveys, prisons, current IDUs, screening saliva.
3
UK, England
19.9 (805)
SP AHBc: Prisons, ever IDUs, screening saliva.
4
Statistical Table 20: Prevalence of antibodies against hepatitis B virus among injecting drug users in the EU (sample sizes in brackets)
HBV - antibodies Country, region/ city
1991 1992 1993 1994 1995 1996 1997 1998 1999 2000 2001 DT/SP /SR**
Setting/ comments
Reference*
UK, London
40.4 (485)
35.2 (704)
32.0 (613)
22.1 (593)
21.6 (731)
20.6 (543)
30.7 (654)
25.6 (790)
25.9 (559)
23.1 (515)
SP AHBc: Drug treatment centres, needle exchanges, low threshold services and primary care and outreach; screening saliva.
1
UK, London
32.8 (244)
SP AHBc: Community surveys, prisons, current IDUs, screening saliva.
3
UK, London
18.5 (200)
SP AHBc: Community survey, female current IDUs; screening, saliva.
7
UK, 3.2 (46)
2.0 (29)
2.9 (41)
1.5 (22)
1.5 (22)
1.5 (22)
1.6 (24)
DT IDUs undergoing a named HIV test; Laboratory reports of first positive HIV-antibody test.
9
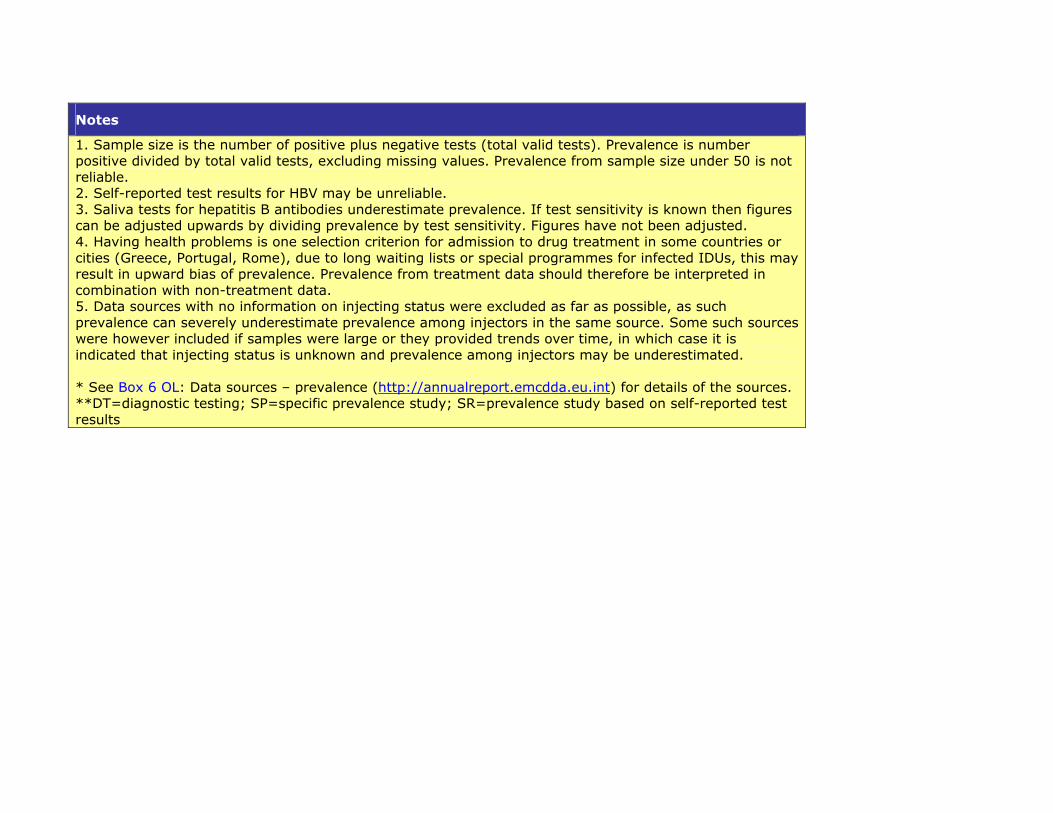
Notes
1. Sample size is the number of positive plus negative tests (total valid tests). Prevalence is number positive divided by total valid tests, excluding missing values. Prevalence from sample size under 50 is not reliable. 2. Self-reported test results for HBV may be unreliable. 3. Saliva tests for hepatitis B antibodies underestimate prevalence. If test sensitivity is known then figures can be adjusted upwards by dividing prevalence by test sensitivity. Figures have not been adjusted. 4. Having health problems is one selection criterion for admission to drug treatment in some countries or cities (Greece, Portugal, Rome), due to long waiting lists or special programmes for infected IDUs, this may result in upward bias of prevalence. Prevalence from treatment data should therefore be interpreted in combination with non-treatment data. 5. Data sources with no information on injecting status were excluded as far as possible, as such prevalence can severely underestimate prevalence among injectors in the same source. Some such sources were however included if samples were large or they provided trends over time, in which case it is indicated that injecting status is unknown and prevalence among injectors may be underestimated. * See Box 6 OL: Data sources – prevalence (http://annualreport.emcdda.eu.int) for details of the sources. **DT=diagnostic testing; SP=specific prevalence study; SR=prevalence study based on self-reported test results