statistical pitfalls stephen senn (c) stephen senn1statistical pitfalls
TRANSCRIPT

Statistical Pitfalls
Stephen Senn
(c) Stephen Senn 1Statistical Pitfalls

(c) Stephen Senn 2
Four to watch out for
• Regression to the mean
• Simpson’s paradox
• Invalid inversion– The error of the transposed conditional
• Selective sampling
Statistical Pitfalls

There are Three Kinds of Statistician
• Those who can count
• Those who can’t
(c) Stephen Senn 3Statistical Pitfalls
(c) Stephen Senn 4
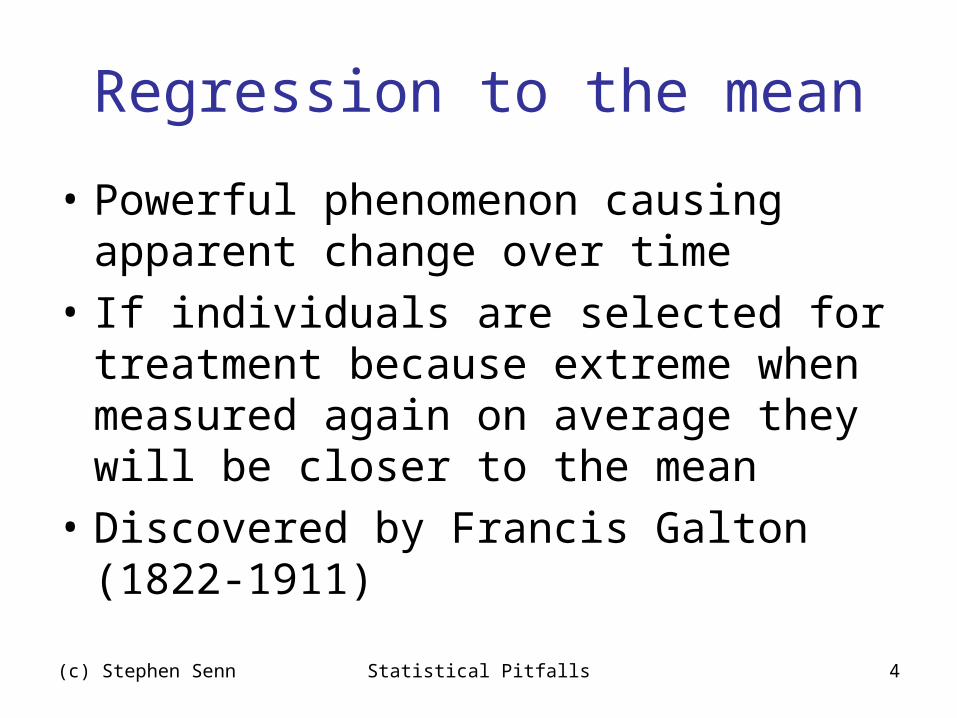
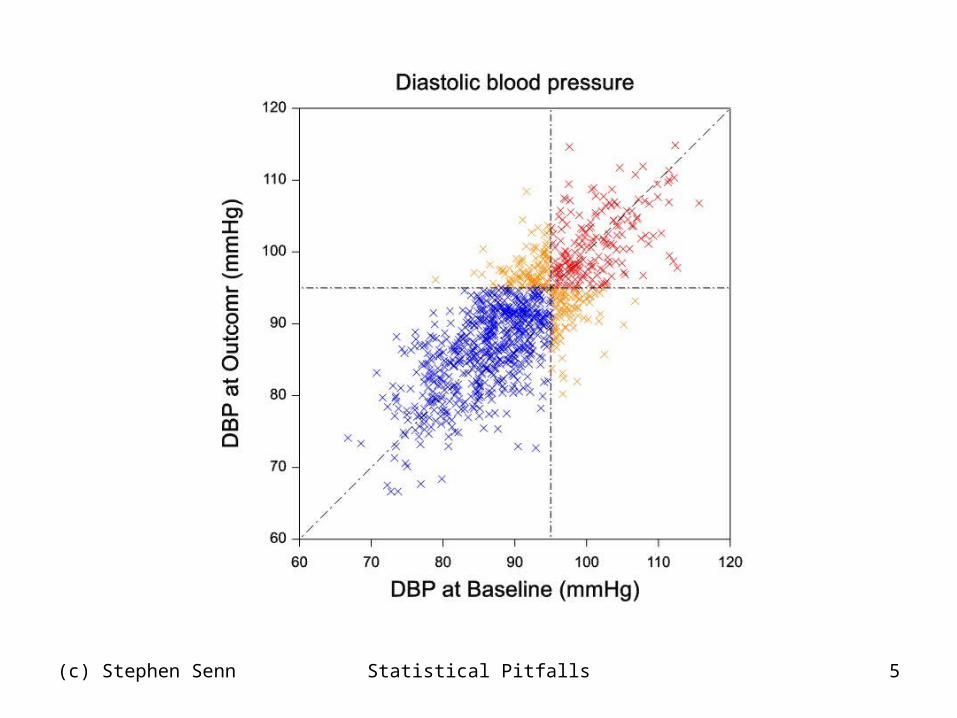
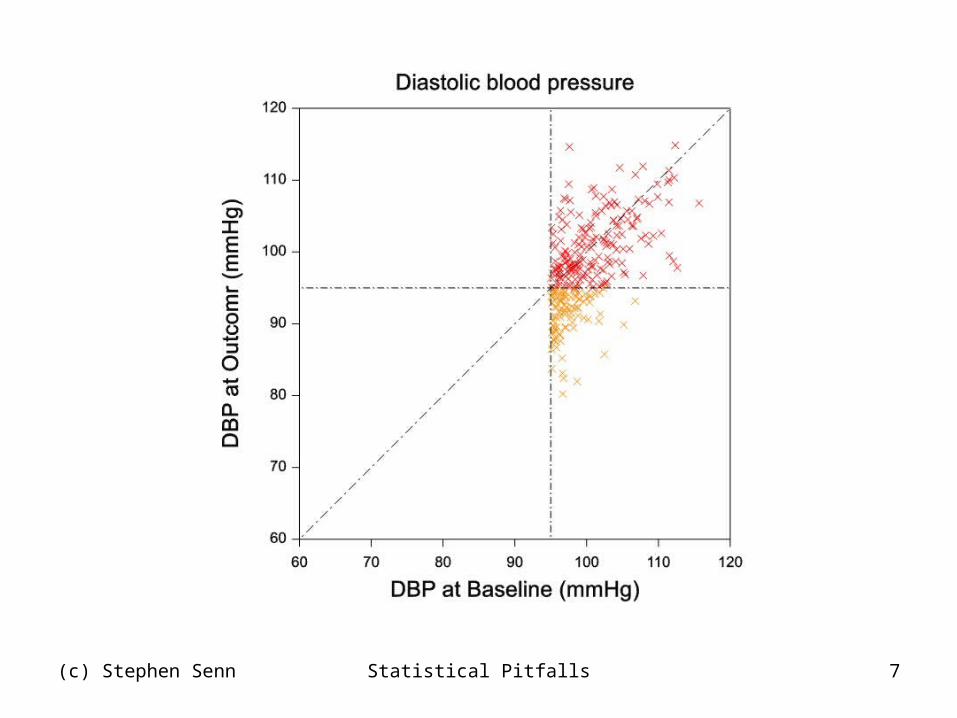
Regression to the mean
• Powerful phenomenon causing apparent change over time
• If individuals are selected for treatment because extreme when measured again on average they will be closer to the mean
• Discovered by Francis Galton (1822-1911)
Statistical Pitfalls
(c) Stephen Senn 5Statistical Pitfalls

(c) Stephen Senn 6Statistical Pitfalls
(c) Stephen Senn 7Statistical Pitfalls
(c) Stephen Senn 8
Consequences
• Spontaneous improvement over time easy to produce
• Is a consequence of the way data are studied not the phenomenon being studied
• Always compare to the control group
• Quite possibly the explanation of the placebo effect
Statistical Pitfalls
(c) Stephen Senn 9
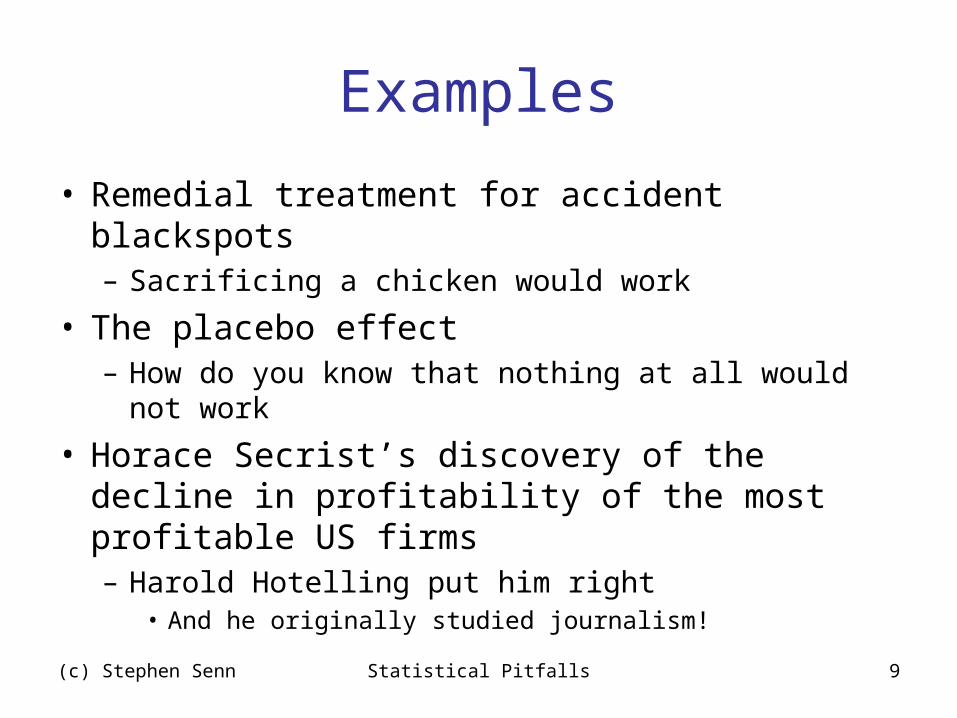
Examples
• Remedial treatment for accident blackspots– Sacrificing a chicken would work
• The placebo effect– How do you know that nothing at all would not work
• Horace Secrist’s discovery of the decline in profitability of the most profitable US firms– Harold Hotelling put him right
• And he originally studied journalism!
Statistical Pitfalls

10
How to Prove Spells Against Rain Work
• Wait for a very rainy day• Say these words
– “Rain rain go away, come again another day”
• By some mystical pluvioincantory process the weather will be drier at some stage in the future than it was on the day the spell was uttered
• Conclusion– The spell works against rain
(c) Stephen Senn Statistical Pitfalls

11
Simpson’s Paradox
Admitted Denied TotalMale 44 56 100Female 35 65 100
Graduate Admissions to Berkeley 1973
A Bias against Women?
Per cent admission by sex
(c) Stephen Senn Statistical Pitfalls
Simpson, E. H. (1951). "The interpretation of interaction in contingency tables." Journal of the Royal Statistical Society, Series B 13: 238-241.

12
Graduate Admissions to Berkeley 1973The Bias Disappears?
Faculty Admitted Denied Admitted DeniedA 62 38 82 18B 60 40 68 32C 37 63 34 66D 33 67 35 65E 28 72 24 76F 6 94 7 93
Male Female
(c) Stephen Senn Statistical Pitfalls

13
Simpson’s ParadoxThe Berkeley Data
• Women were more likely to target arts faculty departments
• These department had lower admission rates
• Hence, admission rates for women were lower overall
• Despite fact that department by department they were not
(c) Stephen Senn Statistical Pitfalls
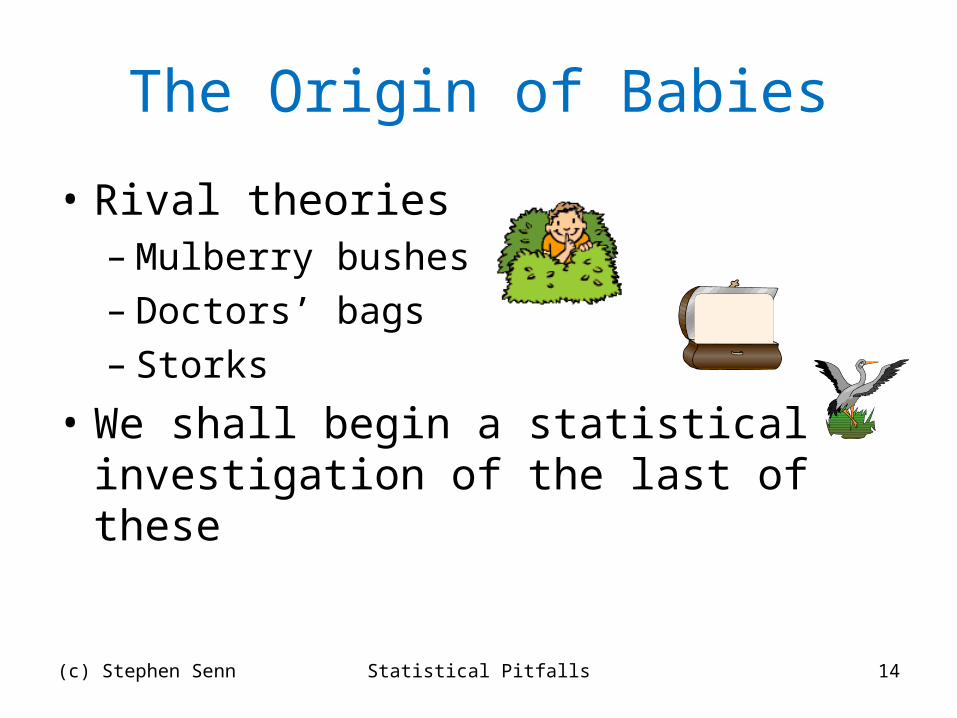
The Origin of Babies
• Rival theories– Mulberry bushes– Doctors’ bags– Storks
• We shall begin a statistical investigation of the last of these
(c) Stephen Senn 14Statistical Pitfalls

3000020000100000
1500
1000
500
0
Storks
Bir
ths
Storks and Births in Europe
Source
Matthews, 2000
Teaching Statistics, 22, 36-28
(c) Stephen Senn 15Statistical Pitfalls

Storks and Babies
• Larger countries tend to have more storks
• Larger countries tend to have more babies
• Hence the size of the country may be a third factor responsible for the correlation
(c) Stephen Senn 16Statistical Pitfalls

0.100.050.00
30
20
10
Storks
Bir
ths
Storks per Area and Birth Rates in Europe
(c) Stephen Senn 17Statistical Pitfalls

Correlations: S per A, B Rate
Pearson correlation of S per A and B Rate = 0.161P-Value = 0.536
(c) Stephen Senn 18Statistical Pitfalls

19
Morals
• Watch out for confounding variables
• Where possible (it is not always possible) design the study so that these are accounted for– For example in experiment have controls and
randomise
• Take care in jumping to conclusions
(c) Stephen Senn Statistical Pitfalls
(c) Stephen Senn 20
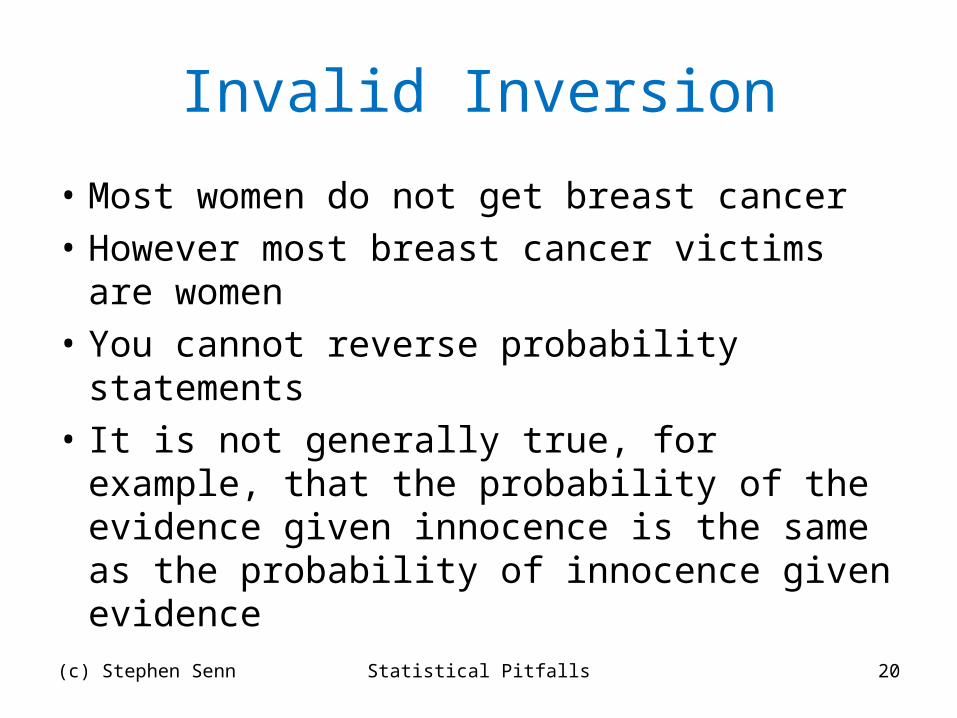
Invalid Inversion
• Most women do not get breast cancer
• However most breast cancer victims are women
• You cannot reverse probability statements
• It is not generally true, for example, that the probability of the evidence given innocence is the same as the probability of innocence given evidence
Statistical Pitfalls

21
OJ Simpson’s Paradox
“Let me begin with a refrain constantly repeated by attorney Alan Dershowitz during the trial. He declared that since fewer than 1 in a 1000 women who are abused by their mates go on to be killed by them, the spousal abuse in the Simpsons' marriage was irrelevant to the case.”
John Allen Paulos
“the issue is whether a history of spousal abuse is necessarily a prelude to murder”.
Alan Dershowitz
(c) Stephen Senn Statistical Pitfalls

22
That Calculation
About 2000 women are murdered annually by a current or former mate in the USA
About 2 million spousal assaults occur annually.
The ratio of one to the other is one in thousand.
Therefore a woman in an abusive relationship has only a 1 in 1000 chance of being murdered by their mate each year
(c) Stephen Senn Statistical Pitfalls
23
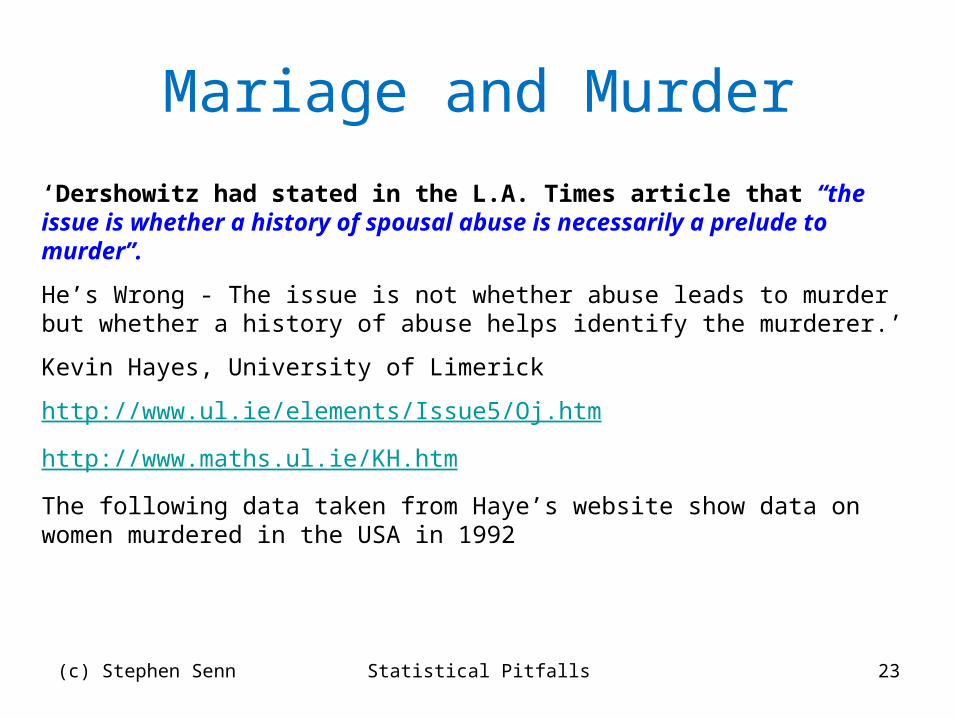
Mariage and Murder
‘Dershowitz had stated in the L.A. Times article that “the issue is whether a history of spousal abuse is necessarily a prelude to murder”.
He’s Wrong - The issue is not whether abuse leads to murder but whether a history of abuse helps identify the murderer.’
Kevin Hayes, University of Limerick
http://www.ul.ie/elements/Issue5/Oj.htm
http://www.maths.ul.ie/KH.htm
The following data taken from Haye’s website show data on women murdered in the USA in 1992
(c) Stephen Senn Statistical Pitfalls

24
‘Marriage’ and Murder
History
Current/FormerHusband or Mate
Other Total
Abuse 715 175 890
No Abuse 715 3330 4045
Totals 1430 3506 4936
(c) Stephen Senn Statistical Pitfalls

25
Abuse and Murder
History
Current/FormerHusband or Mate
Other Total
Abuse 715 175 890
No Abuse 715 3330 4045
Totals 1430 3506 4936
(c) Stephen Senn Statistical Pitfalls

26
OJ Simpson Revisited
“Given certain reasonable factual assumptions, it can be easily shown using probability theory that if a man abuses his wife and she is later murdered, the batterer is the murderer more than 80% of the time. (A nice demonstration of this by Jon Merz and Jonathan Caulkins appeared in a recent issue of Chance magazine.) Thus, without any further evidence, there was mathematical warrant for immediate police suspicion of Mr. Simpson.”
John Allen Paulos
(c) Stephen Senn Statistical Pitfalls
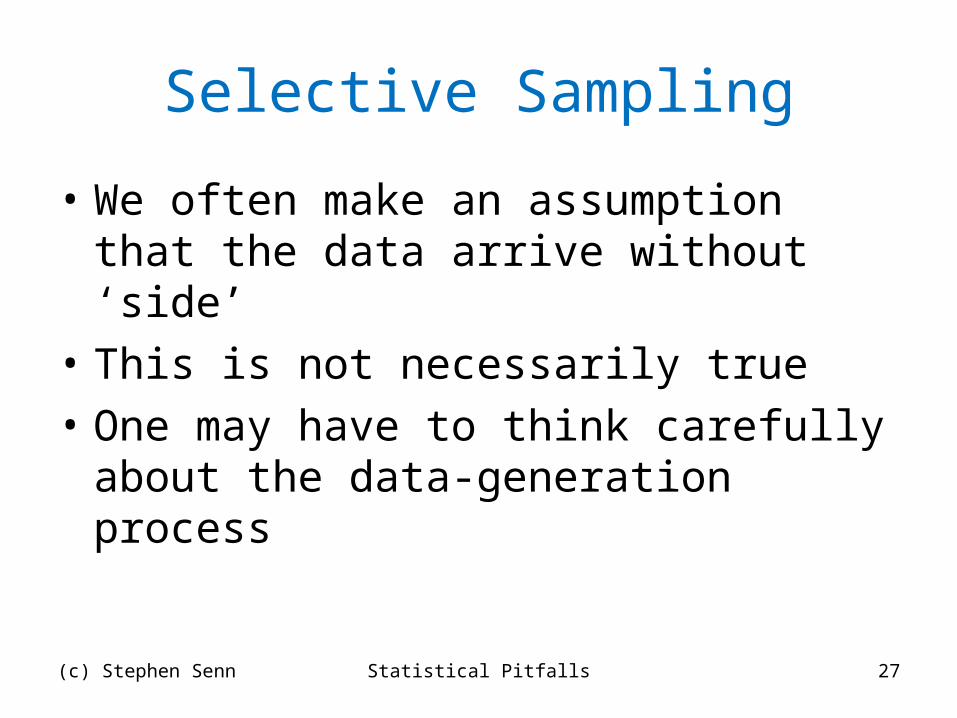
Selective Sampling
• We often make an assumption that the data arrive without ‘side’
• This is not necessarily true
• One may have to think carefully about the data-generation process
(c) Stephen Senn 27Statistical Pitfalls

28
Abraham Wald (1902-1950)
• Rumanian/Hungarian/American, mathematical statistician
• Inventor of decision theory– brilliant and seminal paper of 1939
• Also innovator for sequential analysis
• Died in a plane crash in India
• Ironically, was employed by US military to advise on plane safety in World War II
(c) Stephen Senn Statistical Pitfalls

29
Wald’s Problem
• Returning planes were examined to see where they had been hit
• Engines were rarely hit
• Fuel tanks very often
• Extra armour could be placed but not everywhere
• Where should it be placed?
(c) Stephen Senn Statistical Pitfalls

30
WaldThe Military and The Aircraft
• The US Military decided to reinforce the fuel tanks
• That was where the most shots were
• They argued that therefore the fuel tanks needed protection
(c) Stephen Senn Statistical Pitfalls

31
Wald and the Aircraft
• Wald argued that the pattern of shots received ought to be random
• The fact that it was not, indicated that this sample was not random
• If the shots hit the fuel tank, the plane returned safely
• If it hit the engine, it did not• Solution: reinforce the engines not the fuel tanks!
(c) Stephen Senn Statistical Pitfalls

Moral
• Think carefully about the process that has led to the data in hand
• There may be subtle effects at work
• Don’t jump to conclusions
(c) Stephen Senn 32Statistical Pitfalls

Question
• Studies have shown that if popes from the 13th to 19th century are compared to artists of the same era, they died older
• It has been claimed that this shows the effect of status in society on longevity
• Is there a snag?
(c) Stephen Senn Statistical Pitfalls 33
Carrieri, M. P. and D. Serraino (2005). "Longevity of popes and artists between the 13th and the 19th century.“ Int J Epidemiol 34(6): 1435-1436.
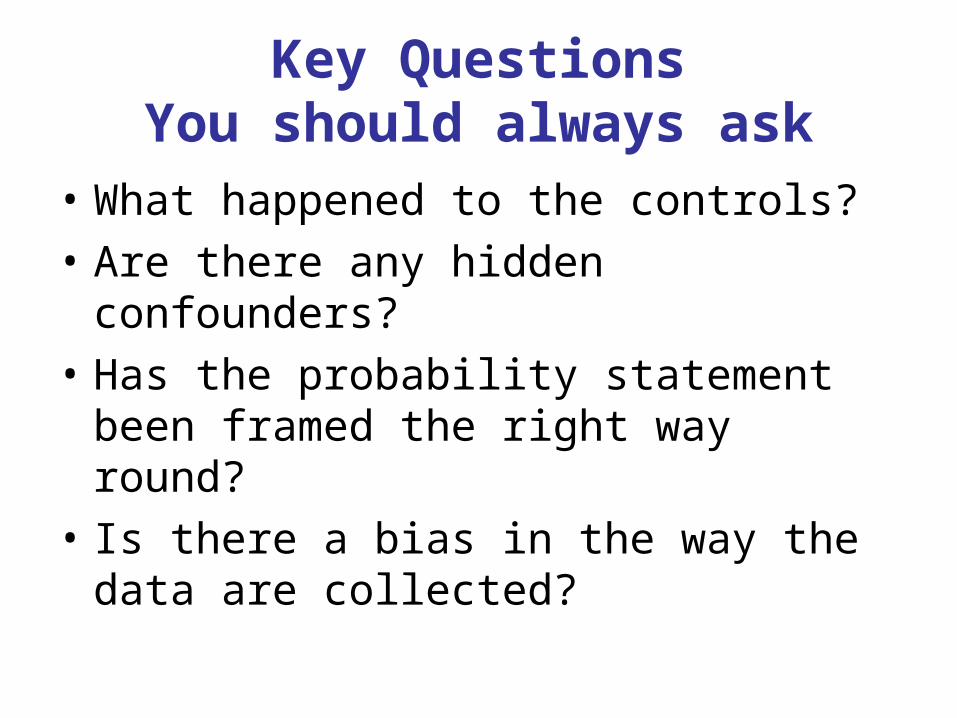
Key QuestionsYou should always ask
• What happened to the controls?
• Are there any hidden confounders?
• Has the probability statement been framed the right way round?
• Is there a bias in the way the data are collected?