statewide freight transportation network optimization · èt ca iica *˚wa (ate! ˇ + eight &...
TRANSCRIPT
co
ns
ult
ing
& t
ec
hn
olo
gy
Statewide Freight Transportation Network Optimization Strategy – Project UpdateSeptember 9, 2016
© 2016 Quetica, LLC. All rights reserved
quèt�icaquèt�ica
Agenda
2
� Project Overview
� Key Recommendations
� Next Steps
© 2016 Quetica, LLC. All rights reserved
quèt�ica
Project Overview3
© 2016 Quetica, LLC. All rights reserved
quèt�icaquèt�ica
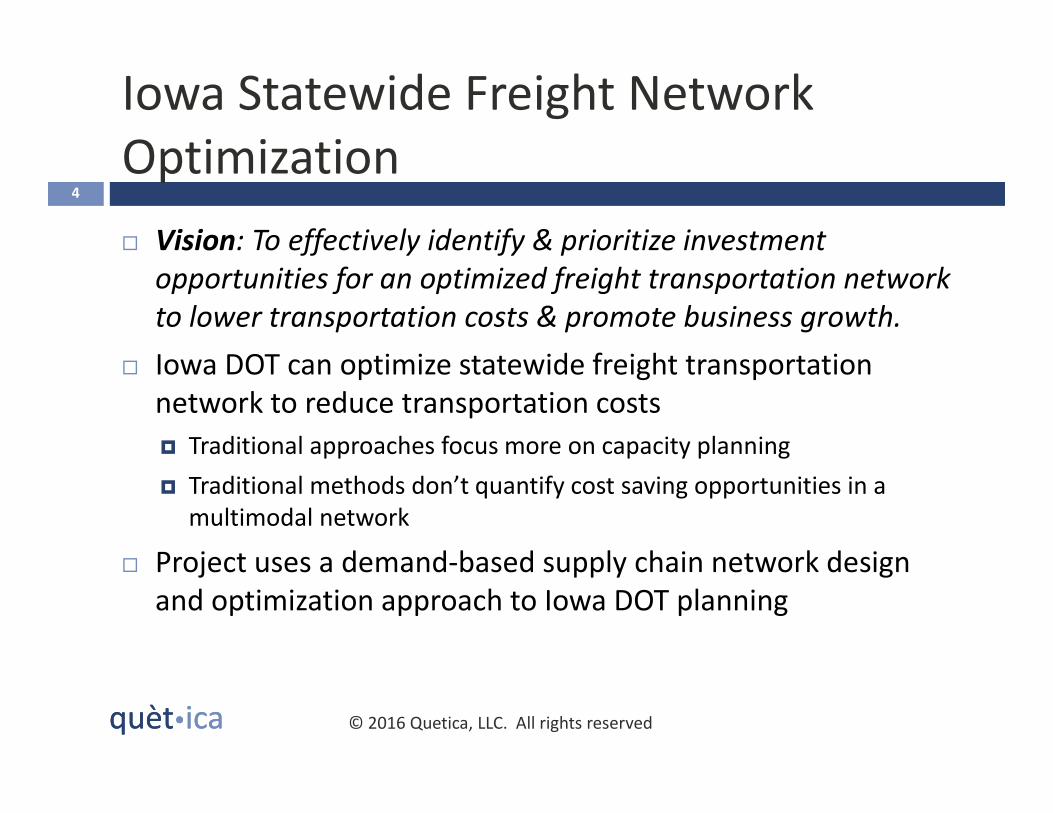
Iowa Statewide Freight Network
Optimization4
� Vision: To effectively identify & prioritize investment
opportunities for an optimized freight transportation network
to lower transportation costs & promote business growth.
� Iowa DOT can optimize statewide freight transportation
network to reduce transportation costs
� Traditional approaches focus more on capacity planning
� Traditional methods don’t quantify cost saving opportunities in a
multimodal network
� Project uses a demand-based supply chain network design
and optimization approach to Iowa DOT planning
© 2016 Quetica, LLC. All rights reserved
quèt�ica quèt�ica
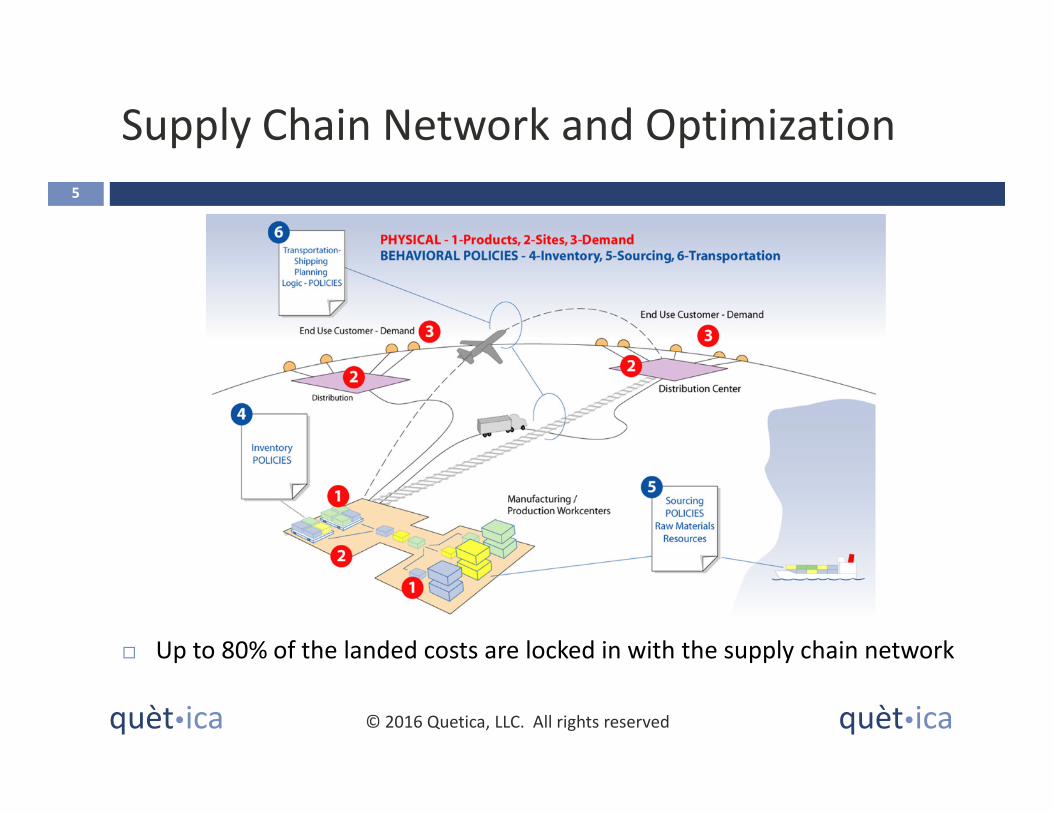
Supply Chain Network and Optimization
5
� Up to 80% of the landed costs are locked in with the supply chain network
© 2016 Quetica, LLC. All rights reserved
quèt�ica quèt�ica
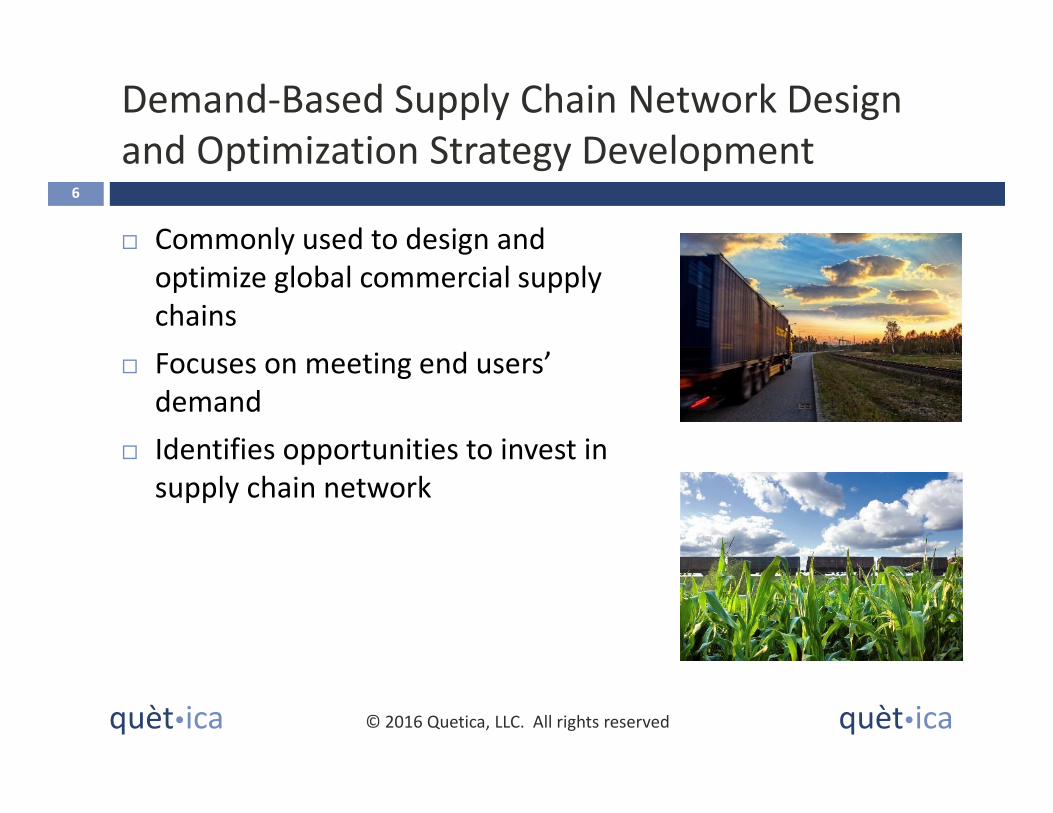
Demand-Based Supply Chain Network Design
and Optimization Strategy Development
� Commonly used to design and
optimize global commercial supply
chains
� Focuses on meeting end users’
demand
� Identifies opportunities to invest in
supply chain network
6
© 2016 Quetica, LLC. All rights reserved
quèt�icaquèt�ica
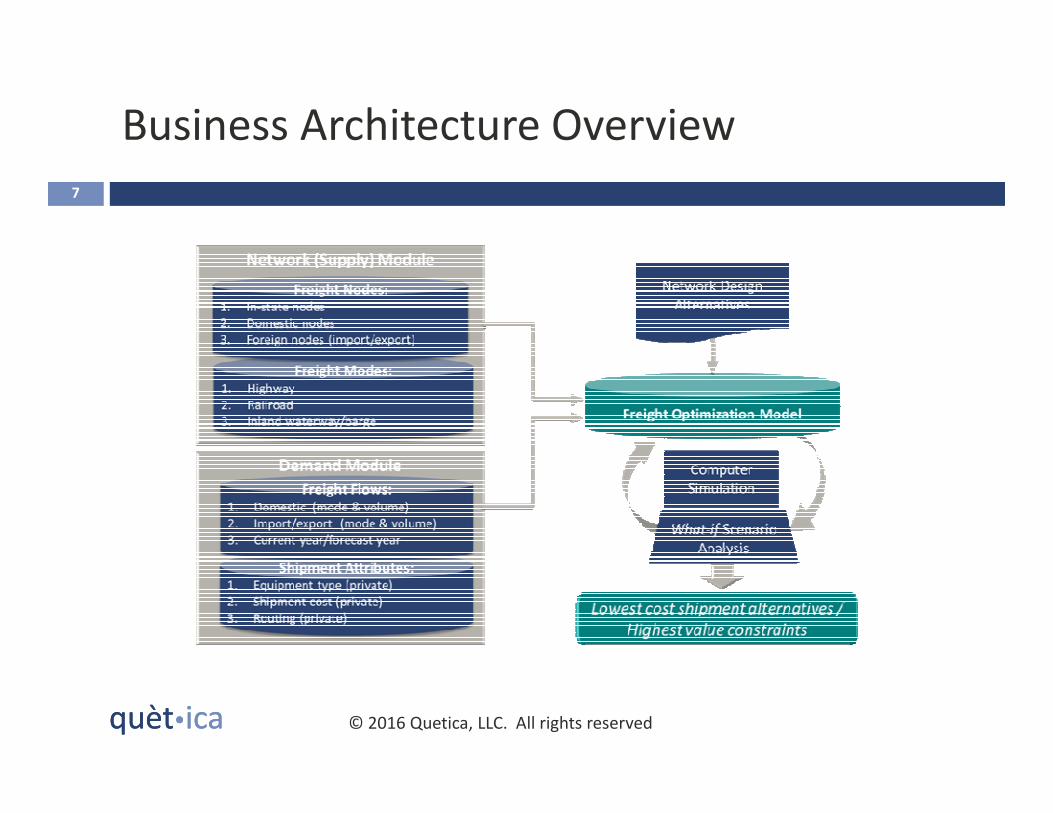
Business Architecture Overview
7
© 2016 Quetica, LLC. All rights reserved
quèt�icaquèt�ica
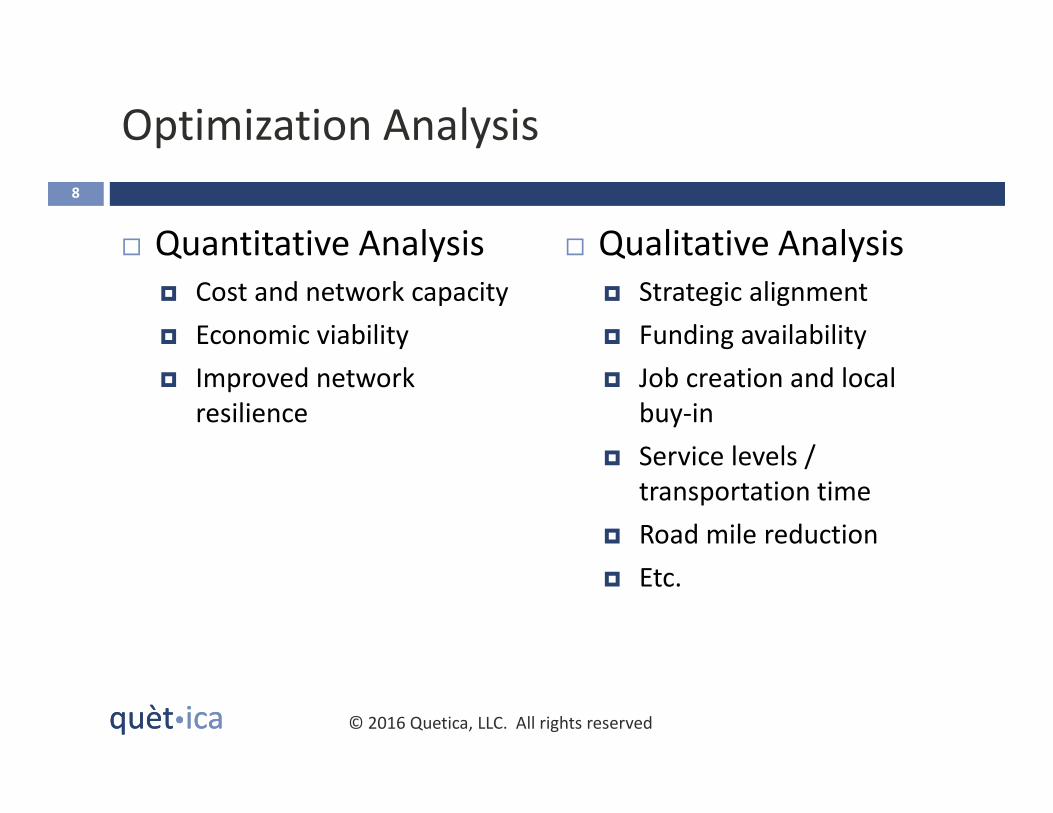
Optimization Analysis
� Quantitative Analysis
� Cost and network capacity
� Economic viability
� Improved network
resilience
� Qualitative Analysis
� Strategic alignment
� Funding availability
� Job creation and local
buy-in
� Service levels /
transportation time
� Road mile reduction
� Etc.
8
© 2016 Quetica, LLC. All rights reserved
quèt�icaquèt�ica
Benefits of Multi-Modal Freight Network
Optimization 9
� Determine the highest value multi-modal
infrastructure public and private investments
� Reduce road freight truck traffic
� Improve transportation network resiliency
� Provide a foundational model to help Iowa
businesses optimize their supply chains
© 2016 Quetica, LLC. All rights reserved
quèt�icaquèt�ica
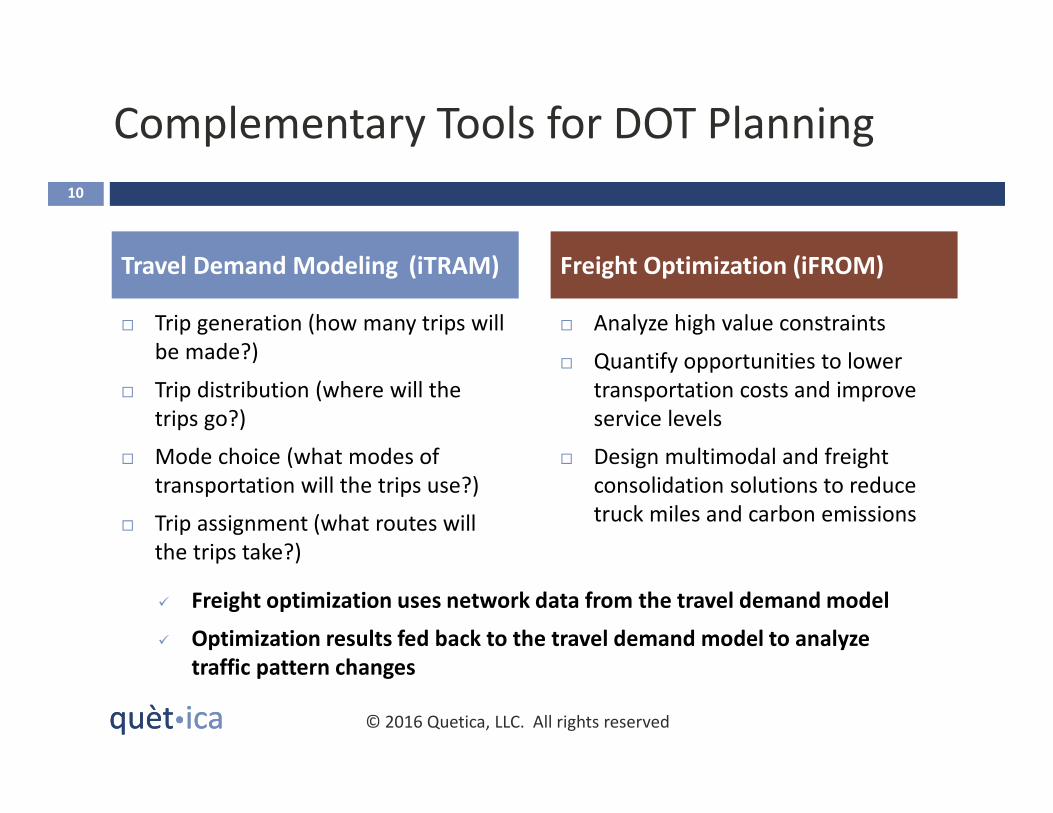
Complementary Tools for DOT Planning
10
© 2016 Quetica, LLC. All rights reserved
Travel Demand Modeling (iTRAM) Freight Optimization (iFROM)
� Freight optimization uses network data from the travel demand model
� Optimization results fed back to the travel demand model to analyze
traffic pattern changes
� Trip generation (how many trips will
be made?)
� Trip distribution (where will the
trips go?)
� Mode choice (what modes of
transportation will the trips use?)
� Trip assignment (what routes will
the trips take?)
� Analyze high value constraints
� Quantify opportunities to lower
transportation costs and improve
service levels
� Design multimodal and freight
consolidation solutions to reduce
truck miles and carbon emissions
quèt�icaquèt�ica
Scope of the Iowa Freight Optimization Model
(iFROM)11
� Modes included: Truck, Rail, Water, multimodal
� 43 commodities
� Data is disaggregated to 99 Iowa counties and 40
foreign countries/groups
� Domestic commodity flow data primarily from Federal
Highway Administration’s Freight Analysis Framework
� Import/Export commodity flow data from EDR
Group/U.S. Customs & Border Protection
� Base year: 2010; Forecast year: 2040
© 2016 Quetica, LLC. All rights reserved
quèt�icaquèt�ica
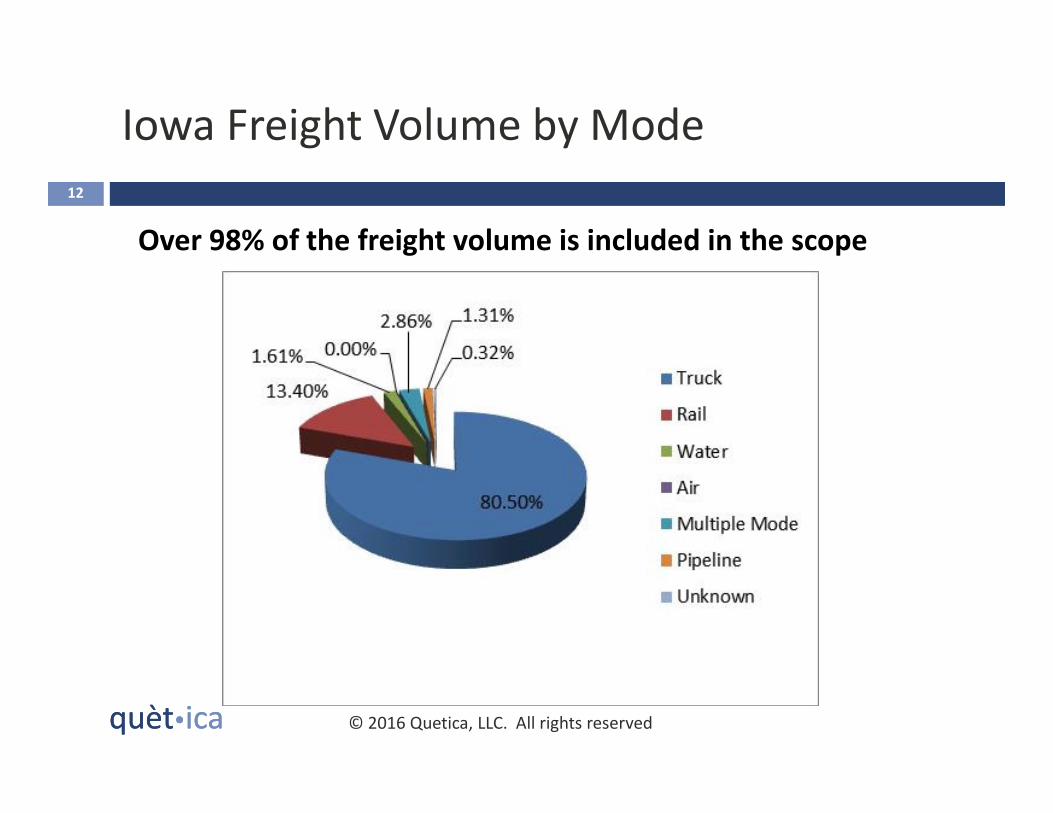
Iowa Freight Volume by Mode
12
Over 98% of the freight volume is included in the scope
© 2016 Quetica, LLC. All rights reserved
quèt�icaquèt�ica
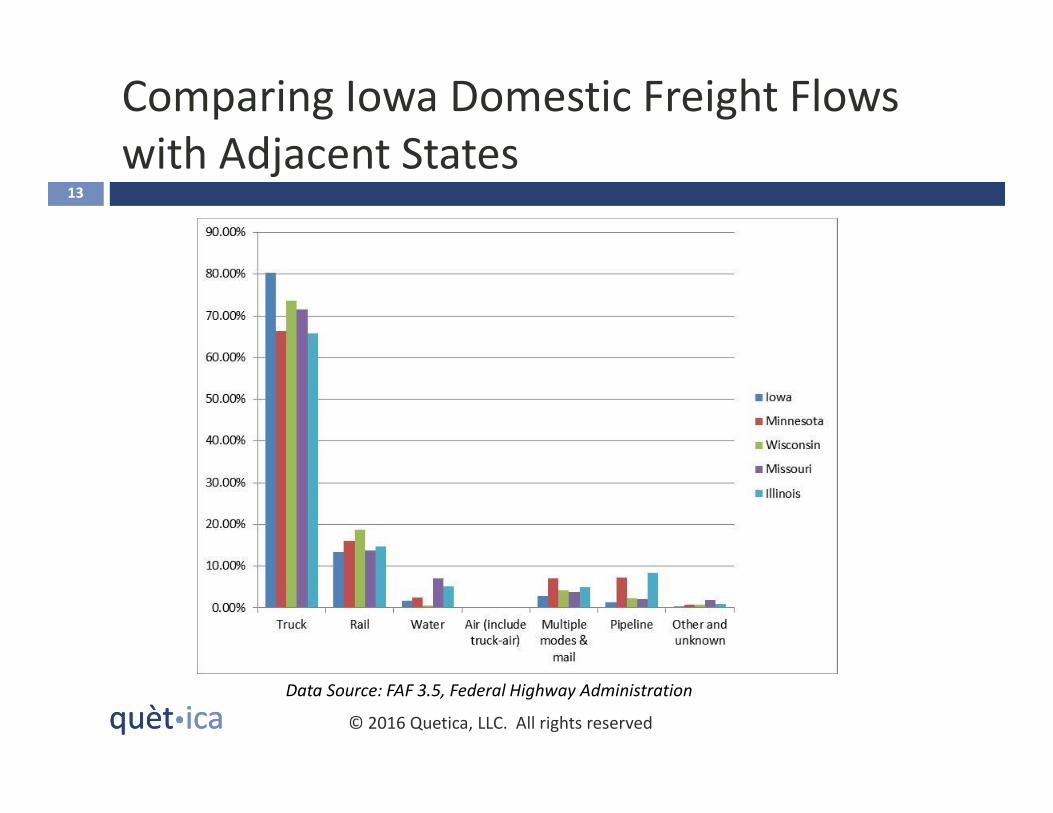
Comparing Iowa Domestic Freight Flows
with Adjacent States13
Data Source: FAF 3.5, Federal Highway Administration
© 2016 Quetica, LLC. All rights reserved
quèt�ica
Recommendation – Cross Dock Facility14
© 2016 Quetica, LLC. All rights reserved
quèt�icaquèt�ica
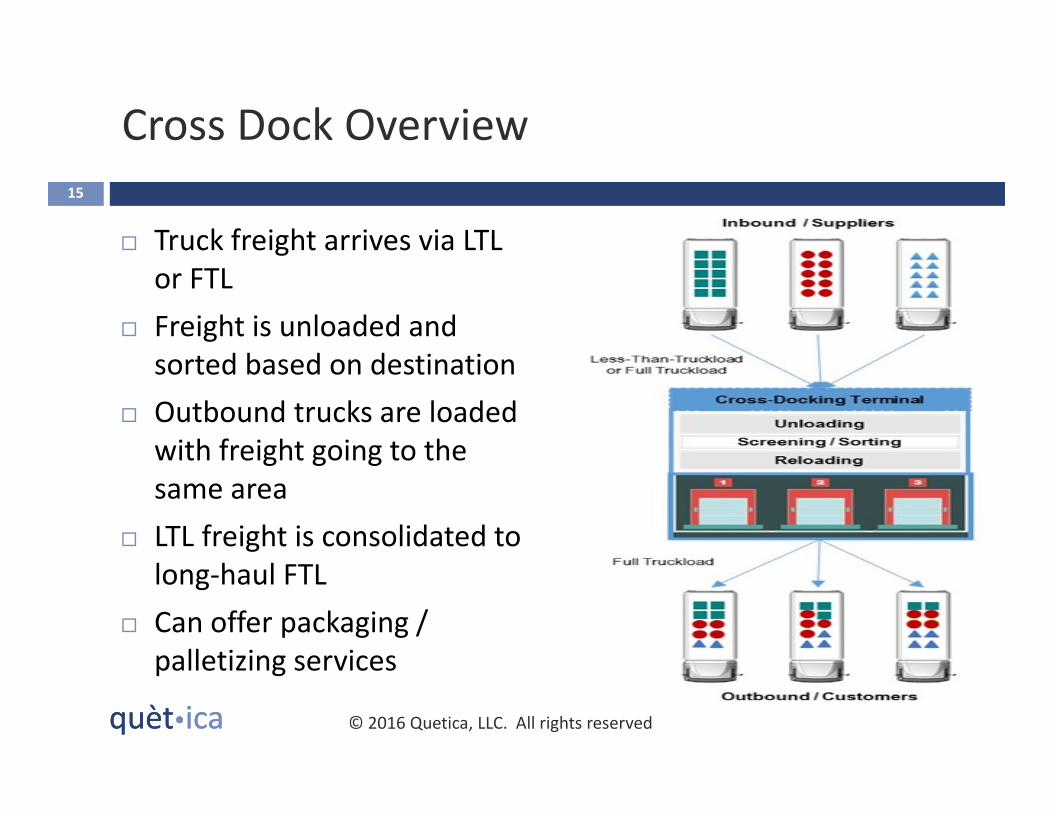
Cross Dock Overview
15
© 2016 Quetica, LLC. All rights reserved
� Truck freight arrives via LTL
or FTL
� Freight is unloaded and
sorted based on destination
� Outbound trucks are loaded
with freight going to the
same area
� LTL freight is consolidated to
long-haul FTL
� Can offer packaging /
palletizing services
quèt�icaquèt�ica
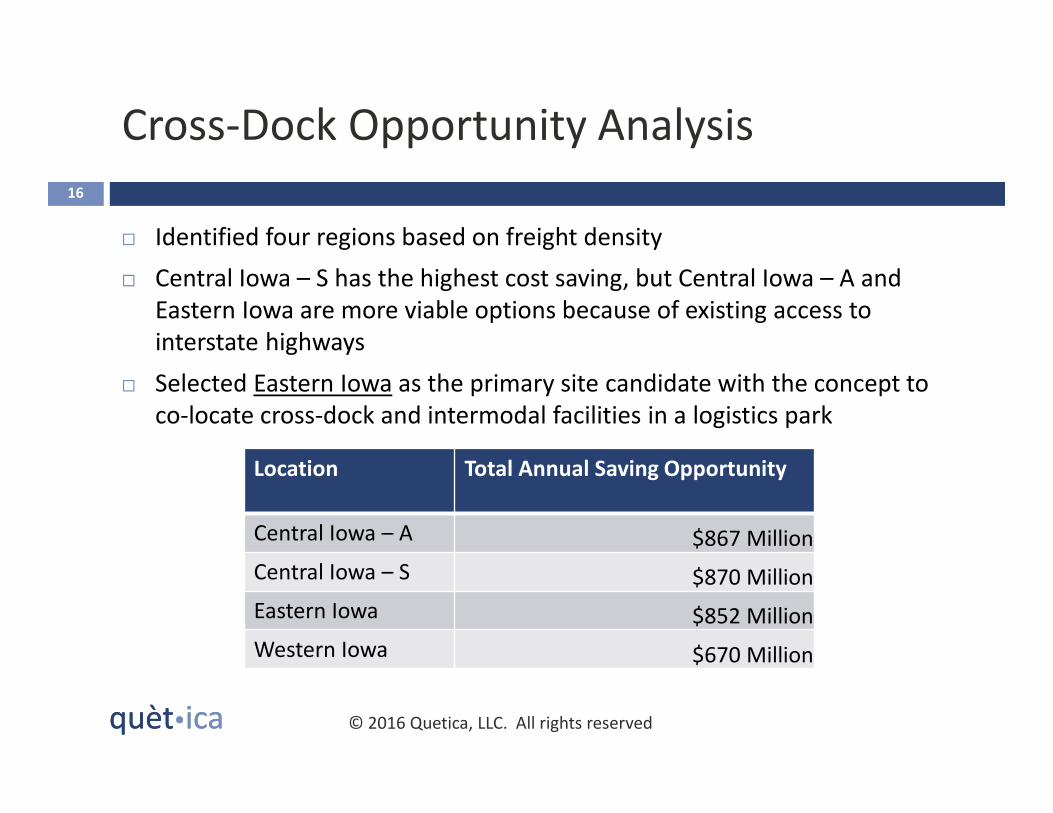
Cross-Dock Opportunity Analysis
16
� Identified four regions based on freight density
� Central Iowa – S has the highest cost saving, but Central Iowa – A and
Eastern Iowa are more viable options because of existing access to
interstate highways
� Selected Eastern Iowa as the primary site candidate with the concept to
co-locate cross-dock and intermodal facilities in a logistics park
Location Total Annual Saving Opportunity
Central Iowa – A $867 Million
Central Iowa – S $870 Million
Eastern Iowa $852 Million
Western Iowa $670 Million
© 2016 Quetica, LLC. All rights reserved
quèt�icaquèt�ica
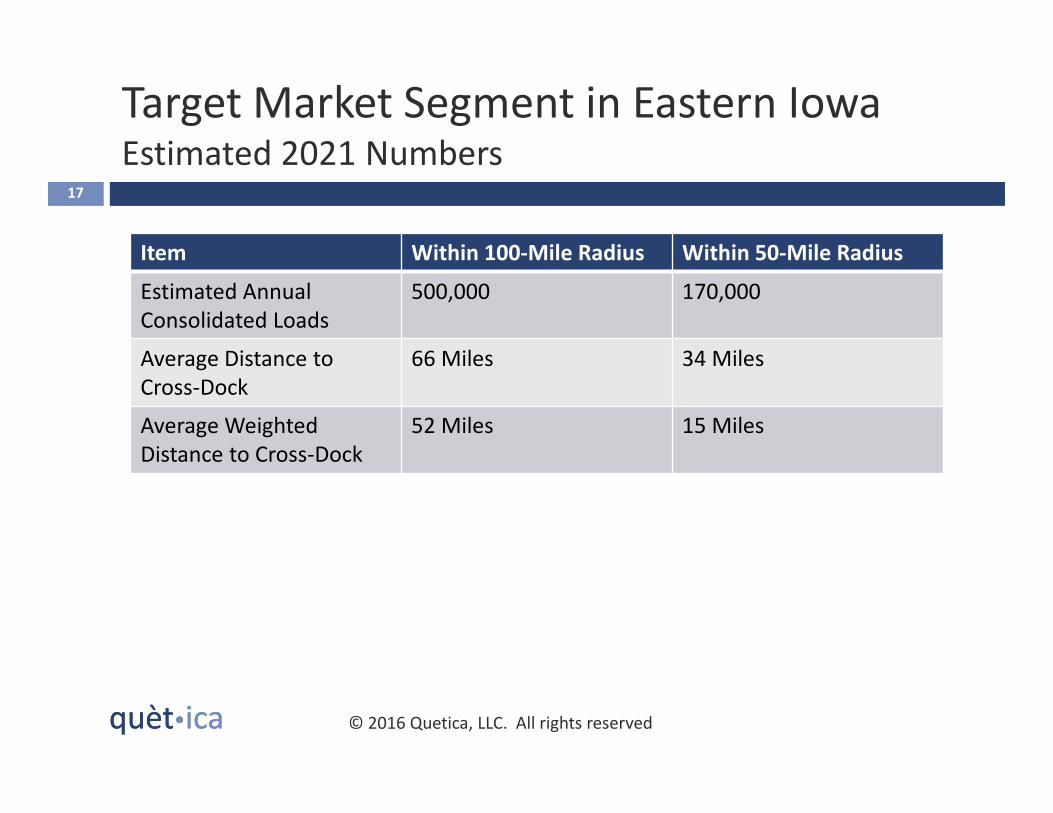
Target Market Segment in Eastern IowaEstimated 2021 Numbers
17
Item Within 100-Mile Radius Within 50-Mile Radius
Estimated Annual
Consolidated Loads
500,000 170,000
Average Distance to
Cross-Dock
66 Miles 34 Miles
Average Weighted
Distance to Cross-Dock
52 Miles 15 Miles
© 2016 Quetica, LLC. All rights reserved
quèt�icaquèt�ica
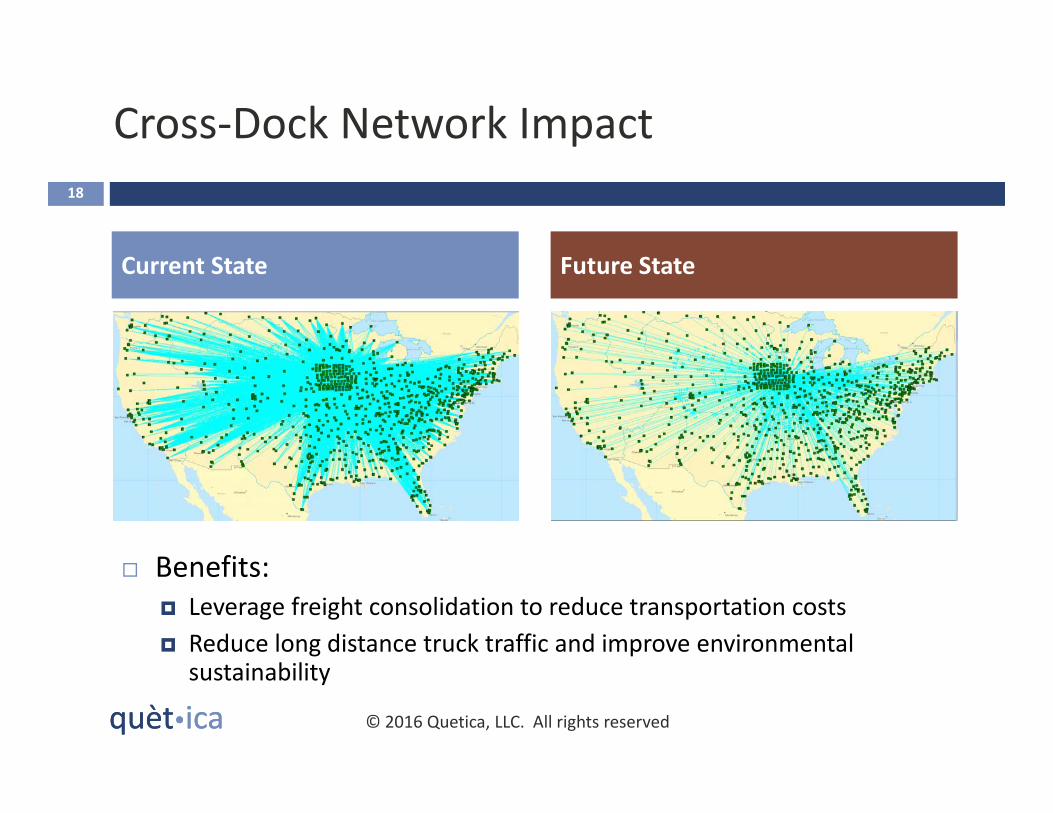
Cross-Dock Network Impact
18
© 2016 Quetica, LLC. All rights reserved
Current State Future State
� Benefits:
� Leverage freight consolidation to reduce transportation costs
� Reduce long distance truck traffic and improve environmental sustainability

quèt�ica
Recommendation - Intermodal Facility19
© 2016 Quetica, LLC. All rights reserved
quèt�icaquèt�ica
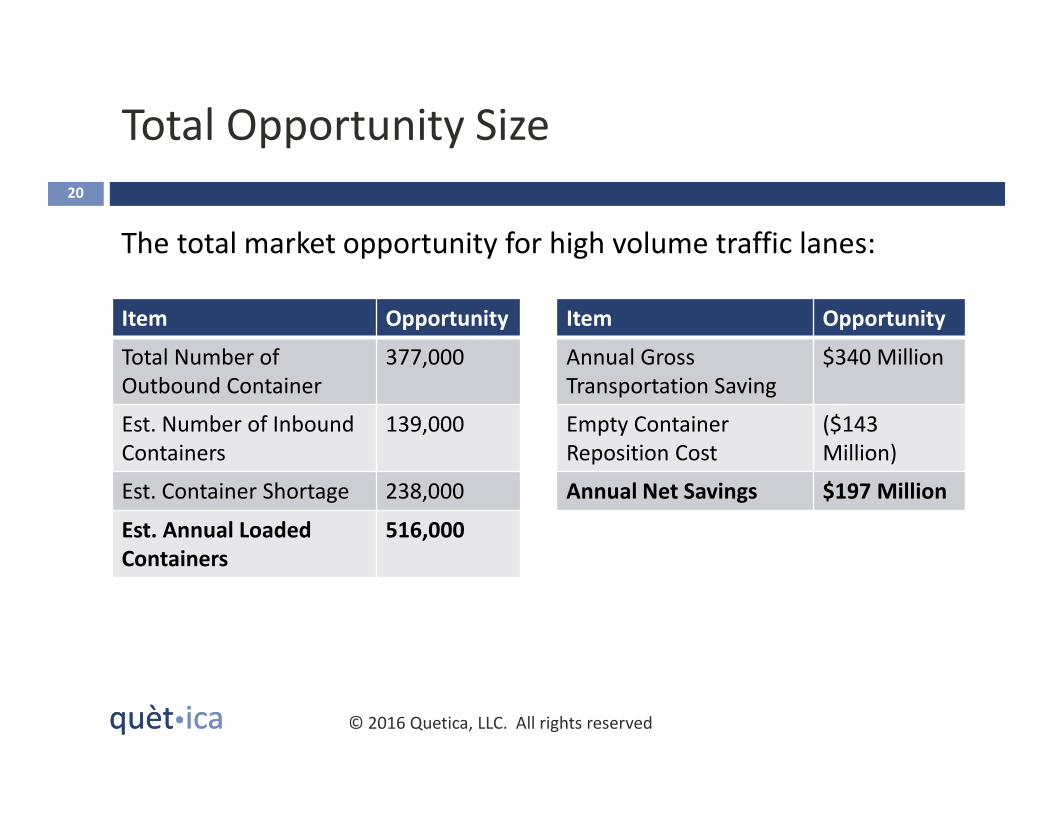
Total Opportunity Size
20
The total market opportunity for high volume traffic lanes:
Item Opportunity
Total Number of
Outbound Container
377,000
Est. Number of Inbound
Containers
139,000
Est. Container Shortage 238,000
Est. Annual Loaded
Containers
516,000
© 2016 Quetica, LLC. All rights reserved
Item Opportunity
Annual Gross
Transportation Saving
$340 Million
Empty Container
Reposition Cost
($143
Million)
Annual Net Savings $197 Million
quèt�icaquèt�ica
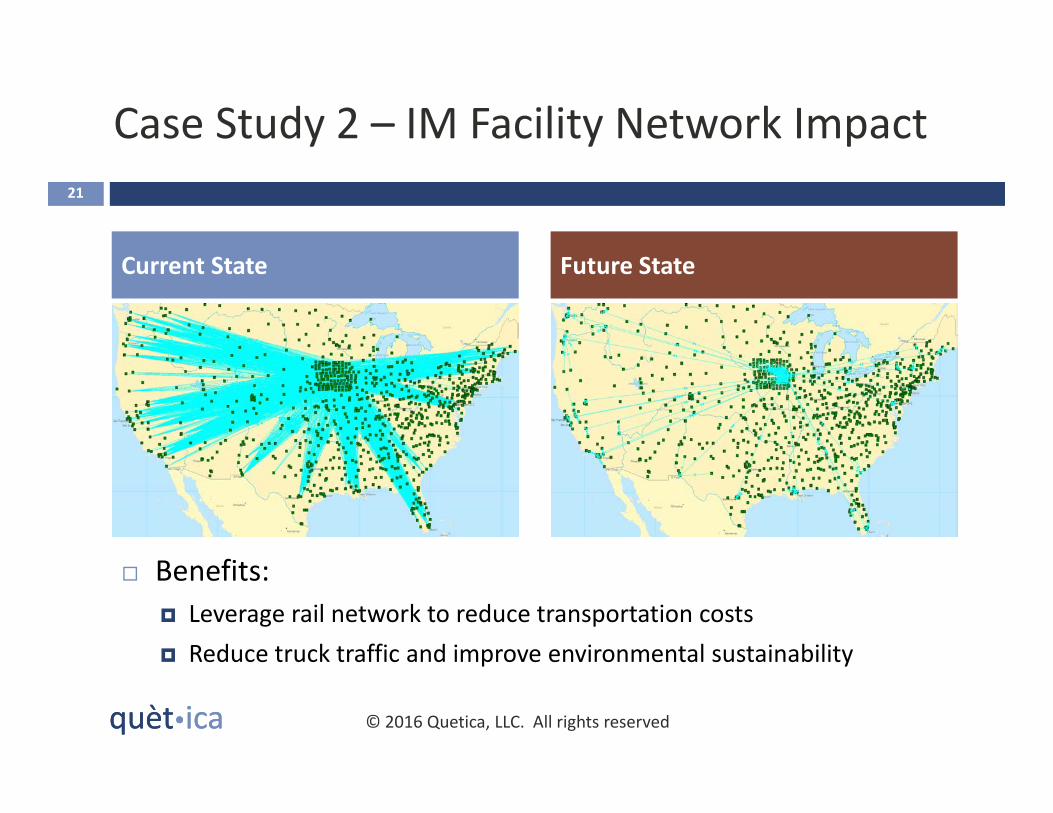
Case Study 2 – IM Facility Network Impact
21
© 2016 Quetica, LLC. All rights reserved
Current State Future State
� Benefits:
� Leverage rail network to reduce transportation costs
� Reduce truck traffic and improve environmental sustainability
quèt�icaquèt�ica
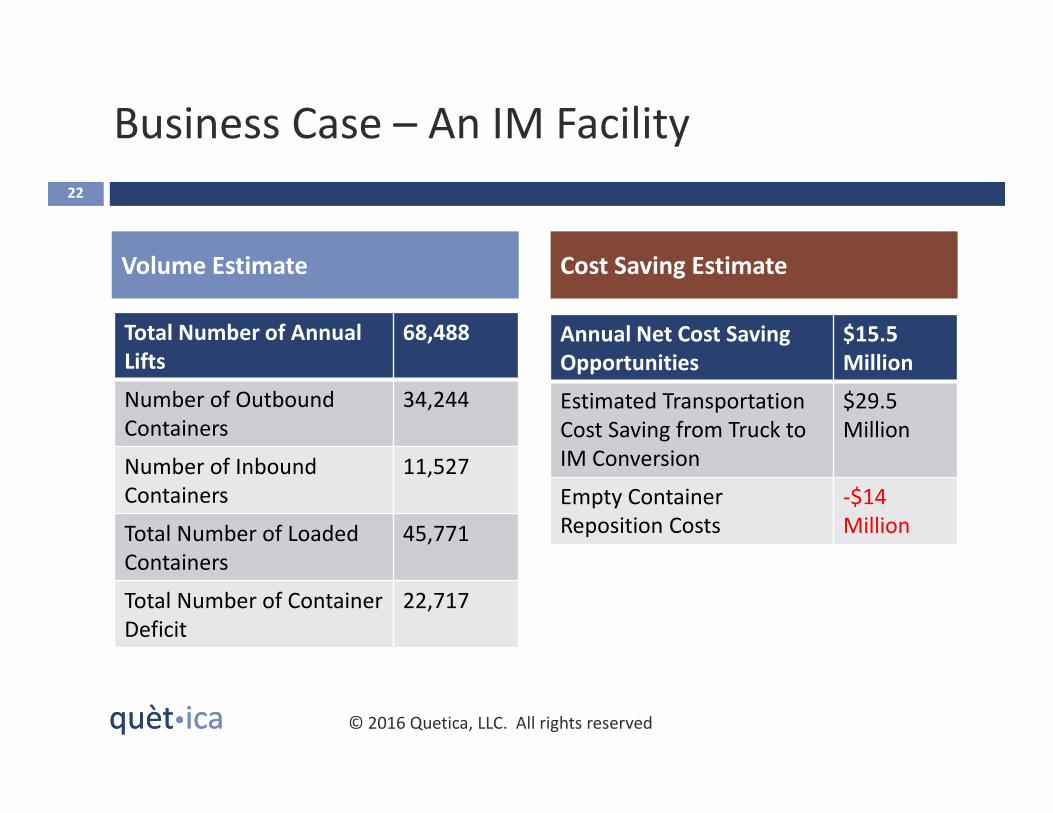
Business Case – An IM Facility
22
Volume Estimate Cost Saving Estimate
© 2016 Quetica, LLC. All rights reserved
Total Number of Annual
Lifts
68,488
Number of Outbound
Containers
34,244
Number of Inbound
Containers
11,527
Total Number of Loaded
Containers
45,771
Total Number of Container
Deficit
22,717
Annual Net Cost Saving
Opportunities
$15.5
Million
Estimated Transportation
Cost Saving from Truck to
IM Conversion
$29.5
Million
Empty Container
Reposition Costs
-$14
Million
quèt�ica
Recommendation - Transloading Facility23
quèt�icaquèt�ica
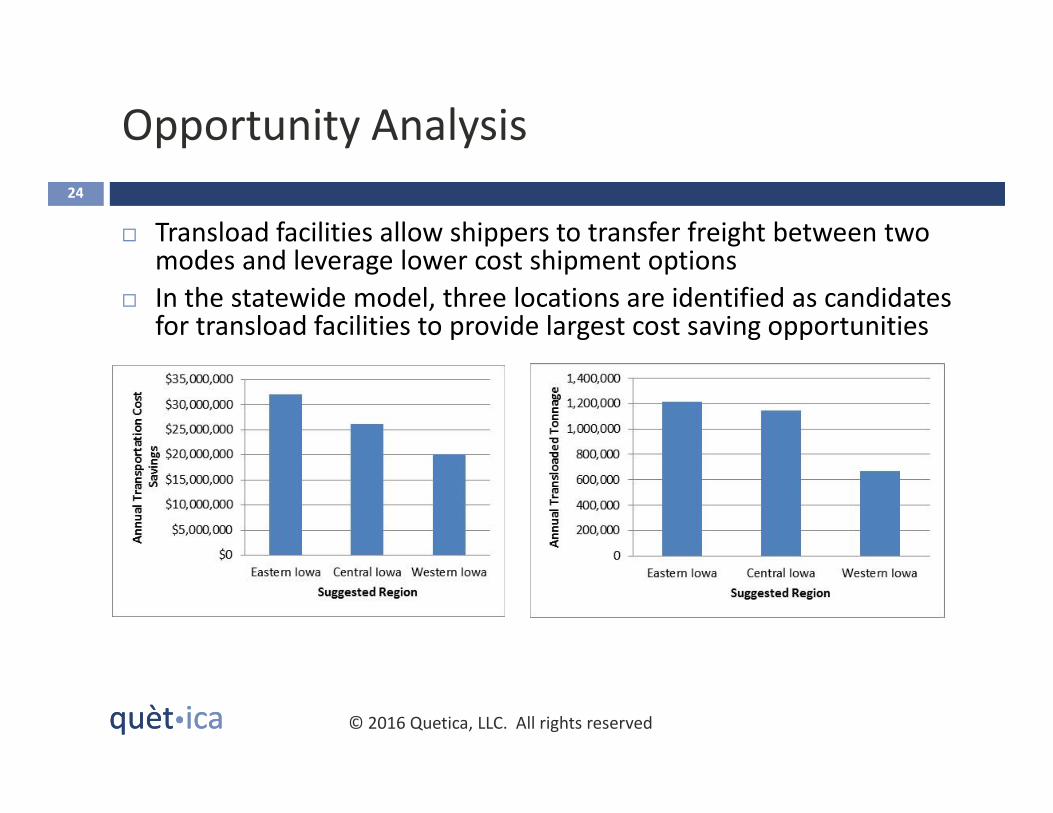
Opportunity Analysis
24
� Transload facilities allow shippers to transfer freight between two modes and leverage lower cost shipment options
� In the statewide model, three locations are identified as candidates for transload facilities to provide largest cost saving opportunities
© 2016 Quetica, LLC. All rights reserved
quèt�icaquèt�ica
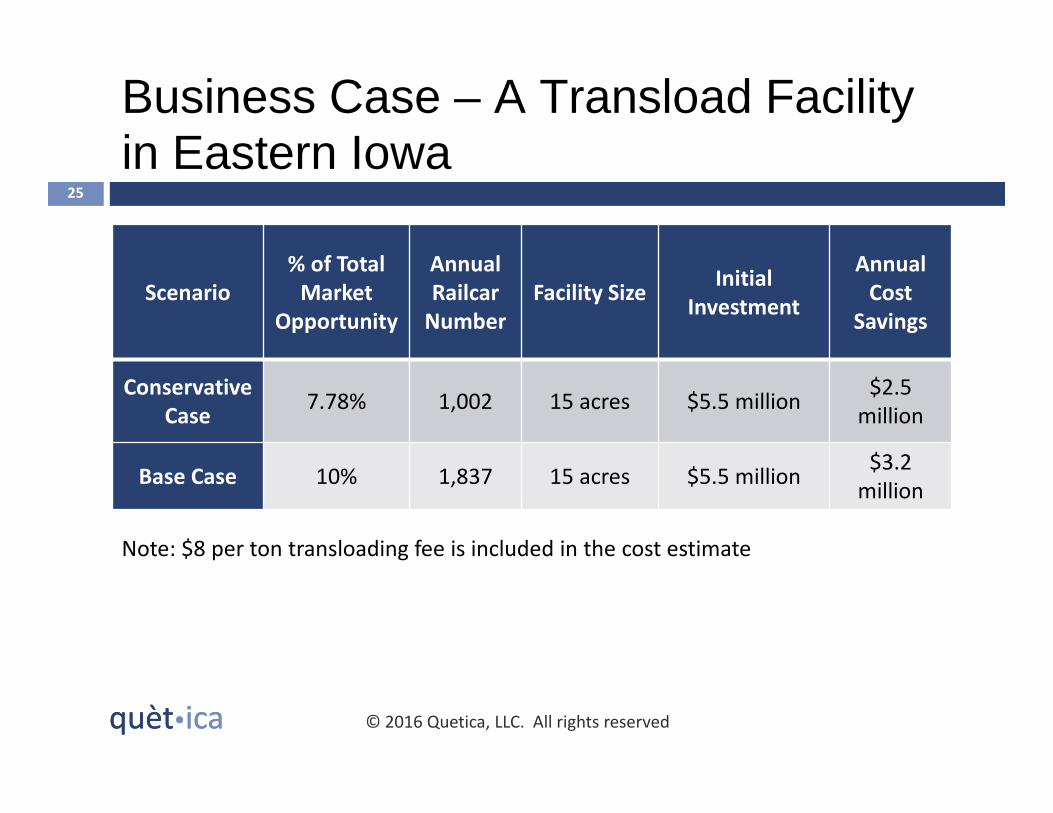
Business Case – A Transload Facility in Eastern Iowa
25
Scenario
% of Total
Market
Opportunity
Annual
Railcar
Number
Facility SizeInitial
Investment
Annual
Cost
Savings
Conservative
Case7.78% 1,002 15 acres $5.5 million
$2.5
million
Base Case 10% 1,837 15 acres $5.5 million$3.2
million
Note: $8 per ton transloading fee is included in the cost estimate
© 2016 Quetica, LLC. All rights reserved
quèt�icaquèt�ica
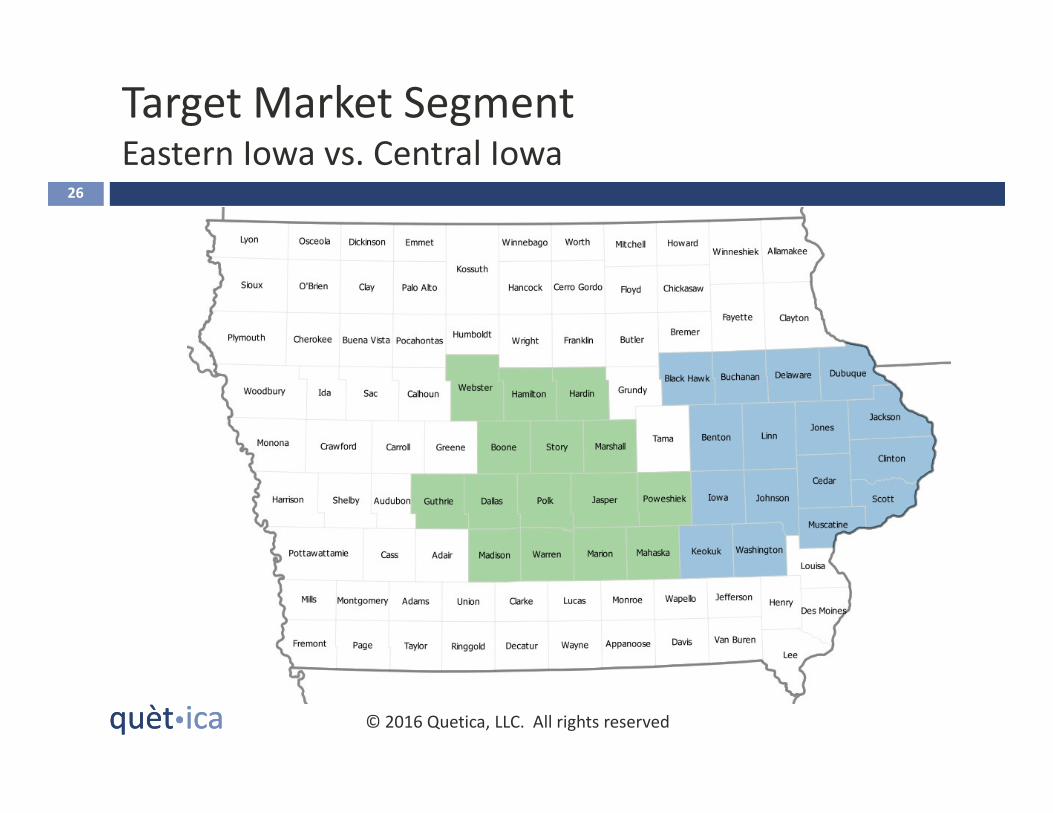
Target Market SegmentEastern Iowa vs. Central Iowa
26
© 2016 Quetica, LLC. All rights reserved
quèt�ica
Recommendation – Logistics Park27
quèt�icaquèt�ica
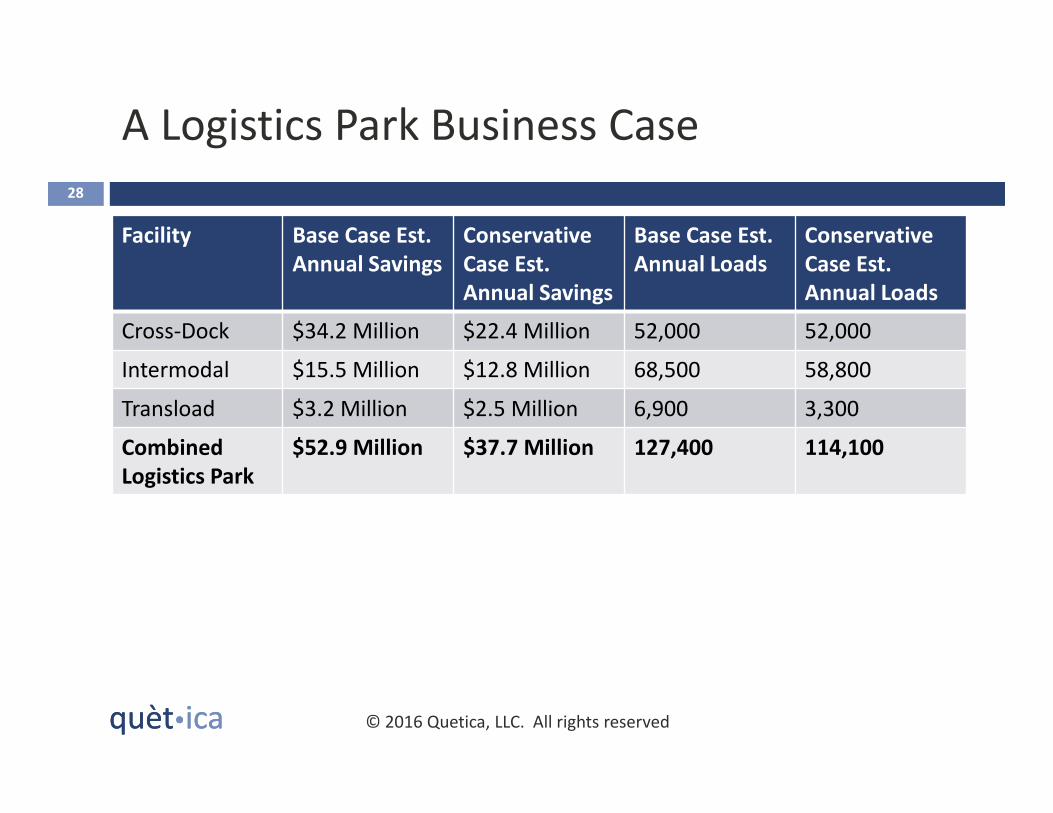
A Logistics Park Business Case
28
© 2016 Quetica, LLC. All rights reserved
Facility Base Case Est.
Annual Savings
Conservative
Case Est.
Annual Savings
Base Case Est.
Annual Loads
Conservative
Case Est.
Annual Loads
Cross-Dock $34.2 Million $22.4 Million 52,000 52,000
Intermodal $15.5 Million $12.8 Million 68,500 58,800
Transload $3.2 Million $2.5 Million 6,900 3,300
Combined
Logistics Park
$52.9 Million $37.7 Million 127,400 114,100
quèt�icaquèt�ica
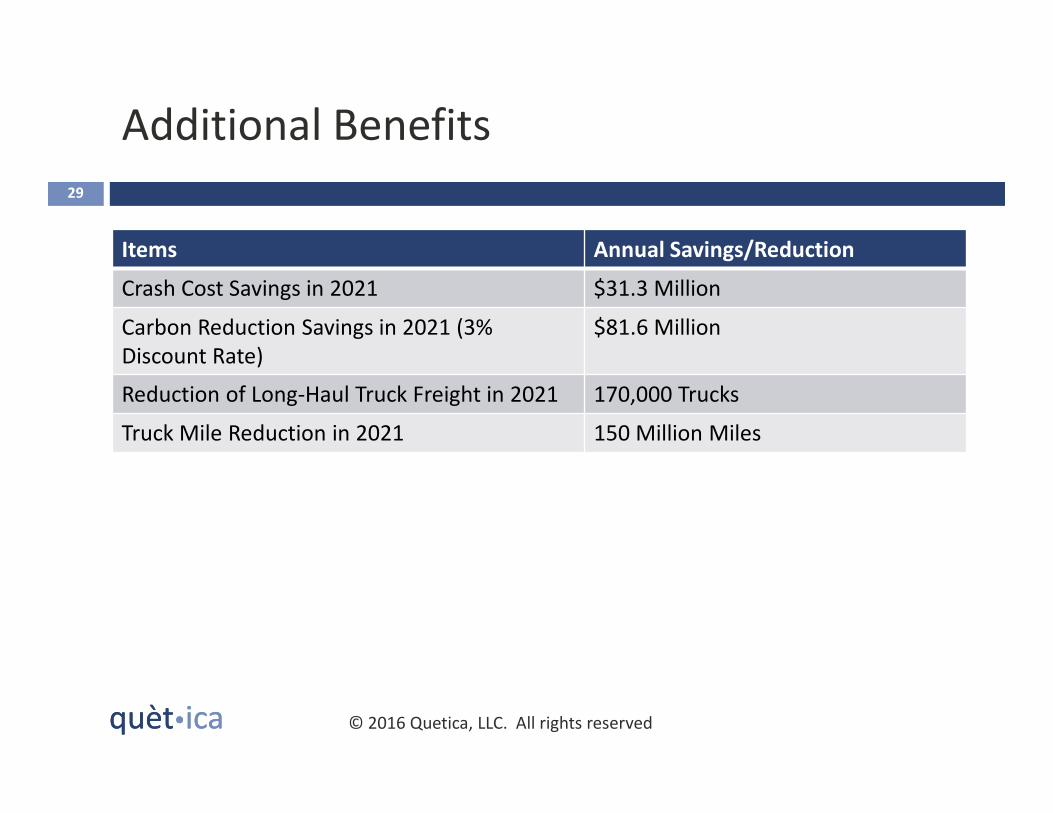
Additional Benefits
29
Items Annual Savings/Reduction
Crash Cost Savings in 2021 $31.3 Million
Carbon Reduction Savings in 2021 (3%
Discount Rate)
$81.6 Million
Reduction of Long-Haul Truck Freight in 2021 170,000 Trucks
Truck Mile Reduction in 2021 150 Million Miles
© 2016 Quetica, LLC. All rights reserved

quèt�ica
Next Steps30
© 2016 Quetica, LLC. All rights reserved
quèt�icaquèt�ica
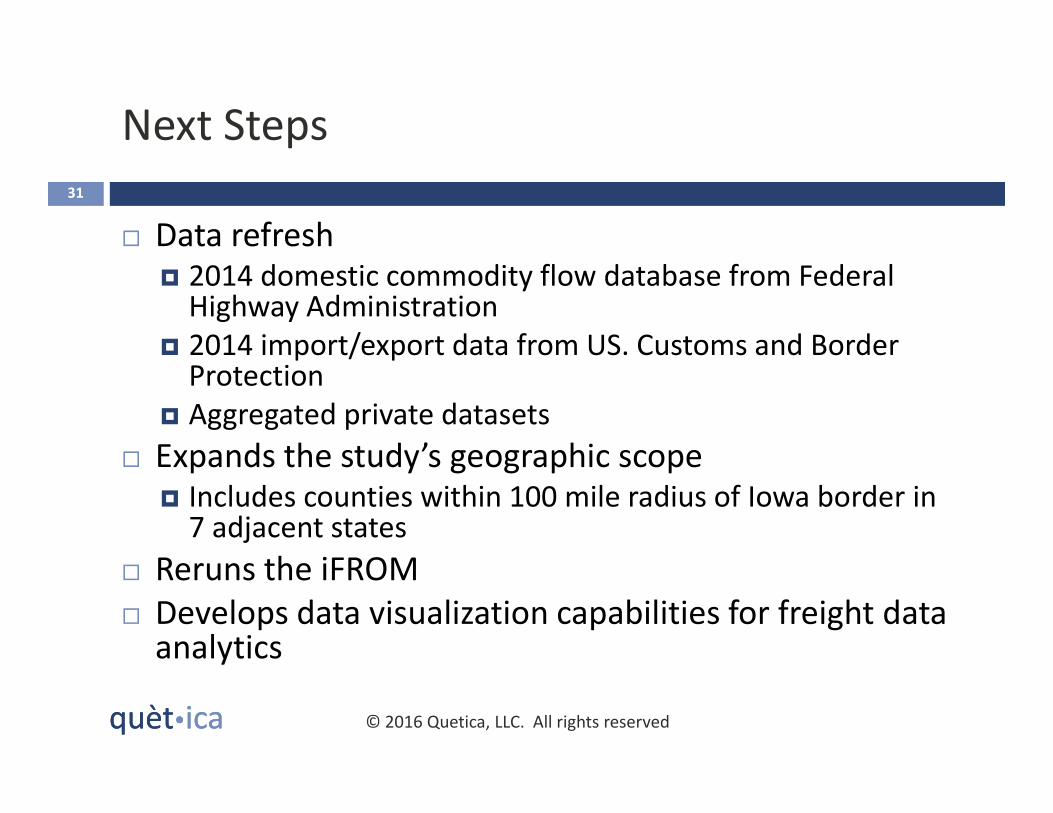
Next Steps
31
� Data refresh� 2014 domestic commodity flow database from Federal
Highway Administration
� 2014 import/export data from US. Customs and Border Protection
� Aggregated private datasets
� Expands the study’s geographic scope� Includes counties within 100 mile radius of Iowa border in
7 adjacent states
� Reruns the iFROM
� Develops data visualization capabilities for freight data analytics
© 2016 Quetica, LLC. All rights reserved
quèt�ica
Richard Langer, Weiwen Xie,
Managing Director Executive Director
Quetica, LLC Quetica, LLC
www.quetica.com www.quetica.com
651-964-4646 ext. 800 651-964-4646 ext. 803
[email protected] [email protected]
Questions32
© 2016 Quetica, LLC. All rights reserved