state of the state: btsa induction directors meeting november 18, 2009 ensuring educator excellence
TRANSCRIPT
State of the State:BTSA Induction Directors
Meeting
November 18, 2009
Ensuring Educator Excellence
2
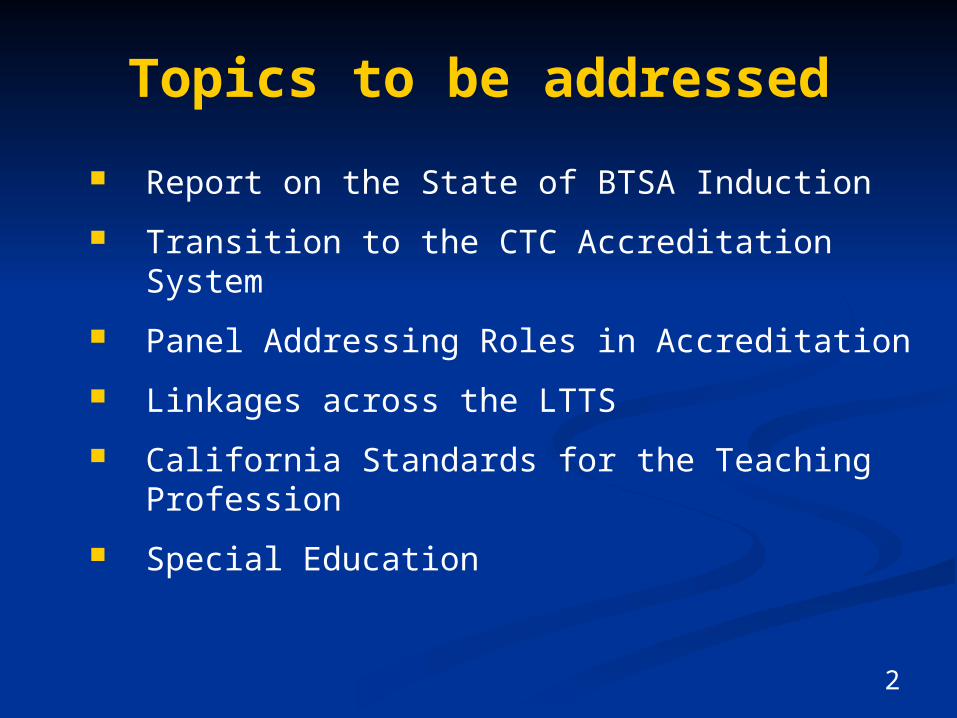
Topics to be addressed
Report on the State of BTSA Induction
Transition to the CTC Accreditation System
Panel Addressing Roles in Accreditation
Linkages across the LTTS
California Standards for the Teaching Profession
Special Education
3
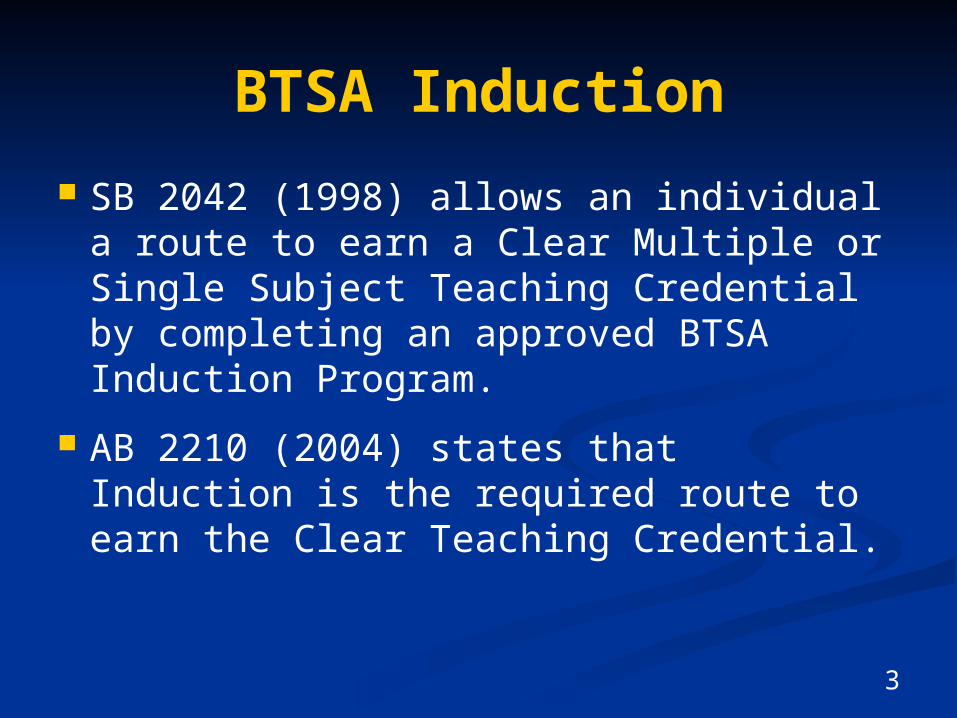
BTSA Induction
SB 2042 (1998) allows an individual a route to earn a Clear Multiple or Single Subject Teaching Credential by completing an approved BTSA Induction Program.
AB 2210 (2004) states that Induction is the required route to earn the Clear Teaching Credential.
4
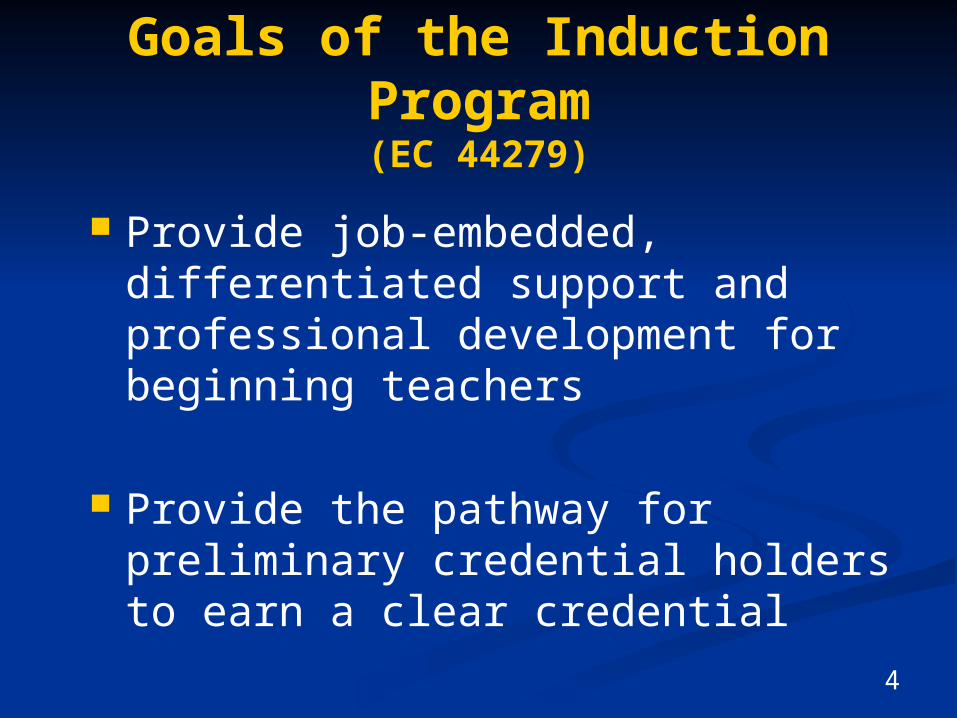
Goals of the Induction Program(EC 44279)
Provide job-embedded, differentiated support and professional development for beginning teachers
Provide the pathway for preliminary credential holders to earn a clear credential
A Statewide Look at BTSA Induction:
Selected findings from2008-2009
Statewide Consent Forms
6
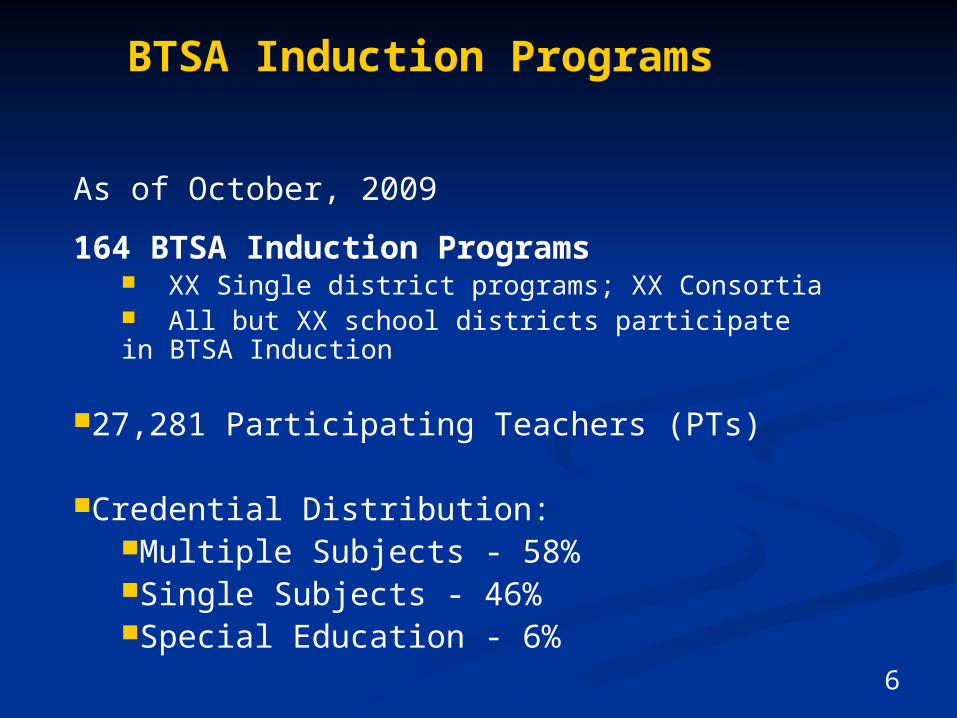
As of October, 2009
164 BTSA Induction Programs XX Single district programs; XX Consortia All but XX school districts participate in BTSA Induction
27,281 Participating Teachers (PTs)
Credential Distribution:Multiple Subjects - 58%Single Subjects - 46%Special Education - 6%
BTSA Induction Programs
7
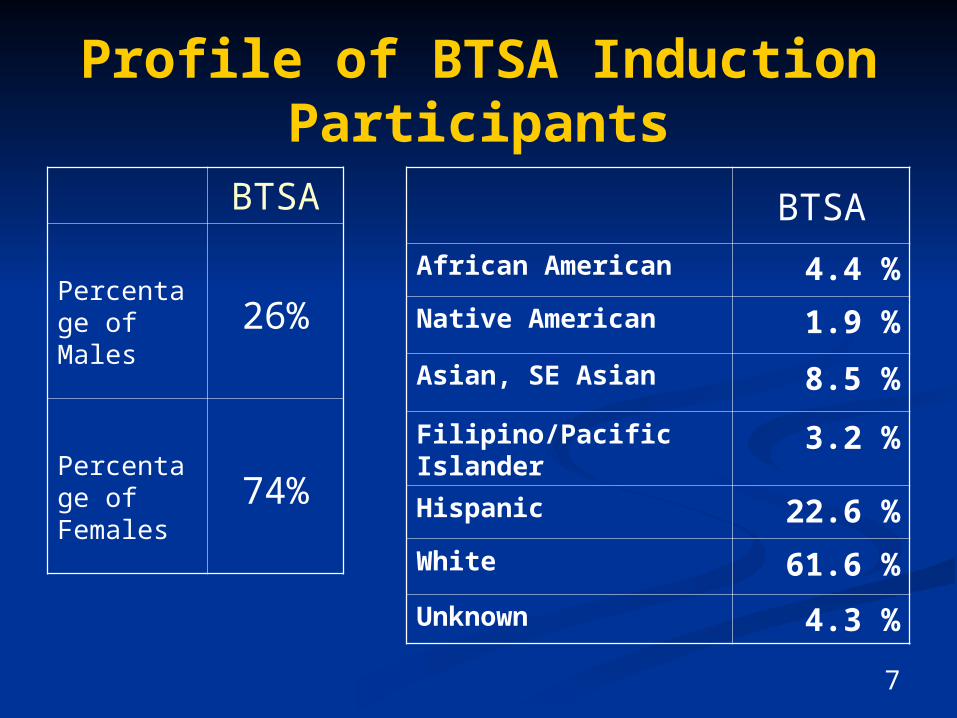
Profile of BTSA Induction Participants
BTSA
African American 4.4 %
Native American 1.9 %
Asian, SE Asian 8.5 %
Filipino/Pacific Islander 3.2 %
Hispanic 22.6 %
White 61.6 %
Unknown 4.3 %
BTSA
Percentage of Males 26%
Percentage of Females 74%
8
BTSA Induction Support Provider Profiles
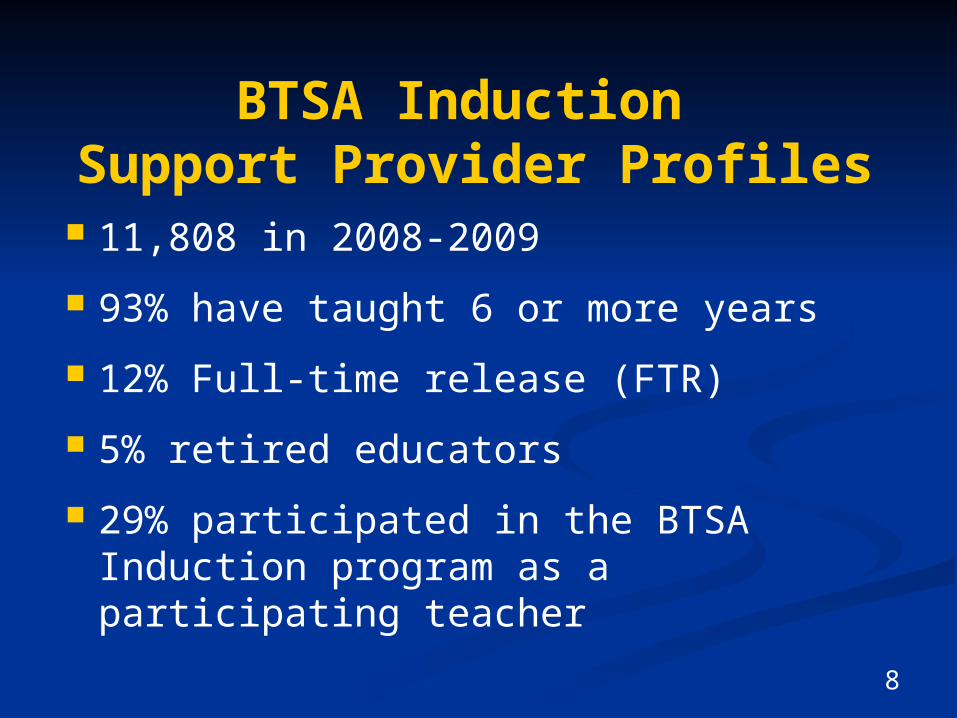
11,808 in 2008-2009
93% have taught 6 or more years
12% Full-time release (FTR)
5% retired educators
29% participated in the BTSA Induction program as a participating teacher
Selected findings from
2008-2009
Statewide Program Evaluation Surveys
Participating Teachers (PT) Support Providers (SP) Site Administrators (SA)
10
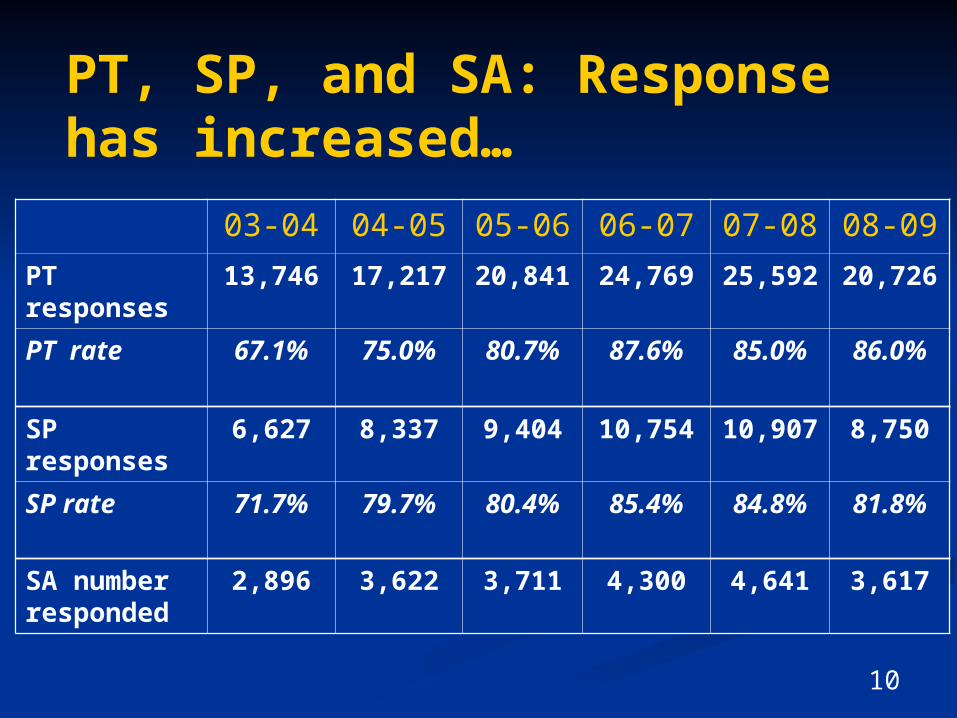
PT, SP, and SA: Response has increased…
03-04 04-05 05-06 06-07 07-08 08-09
PT responses
13,746 17,217 20,841 24,769 25,592 20,726
PT rate 67.1% 75.0% 80.7% 87.6% 85.0% 86.0%
SP responses
6,627 8,337 9,404 10,754 10,907 8,750
SP rate 71.7% 79.7% 80.4% 85.4% 84.8% 81.8%
SA number responded
2,896 3,622 3,711 4,300 4,641 3,617
11
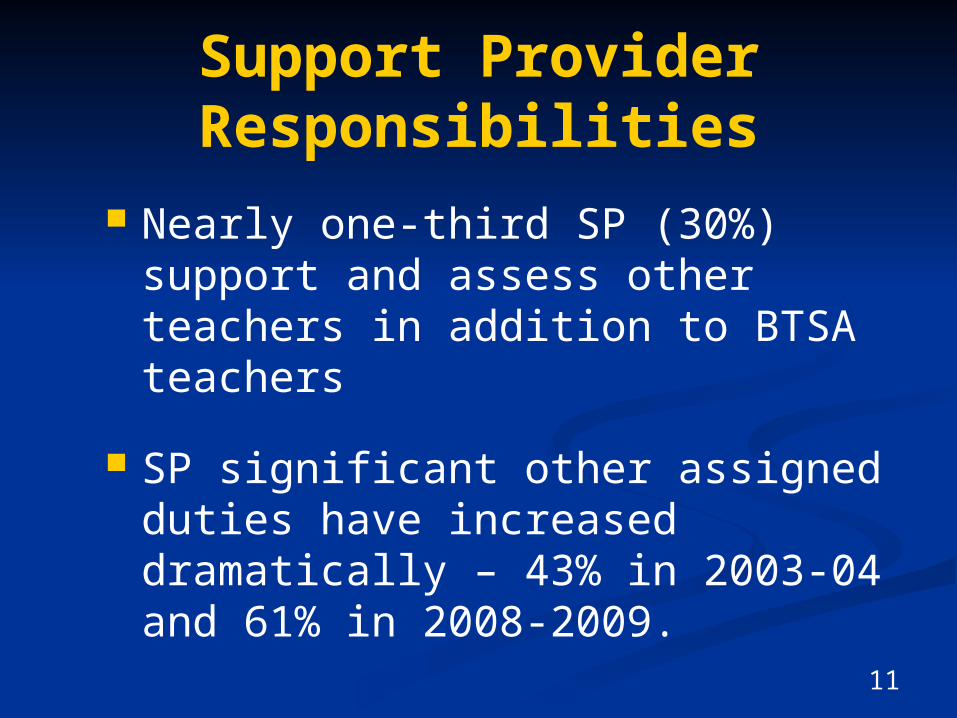
Support Provider Responsibilities
Nearly one-third SP (30%) support and assess other teachers in addition to BTSA teachers
SP significant other assigned duties have increased dramatically – 43% in 2003-04 and 61% in 2008-2009.
12
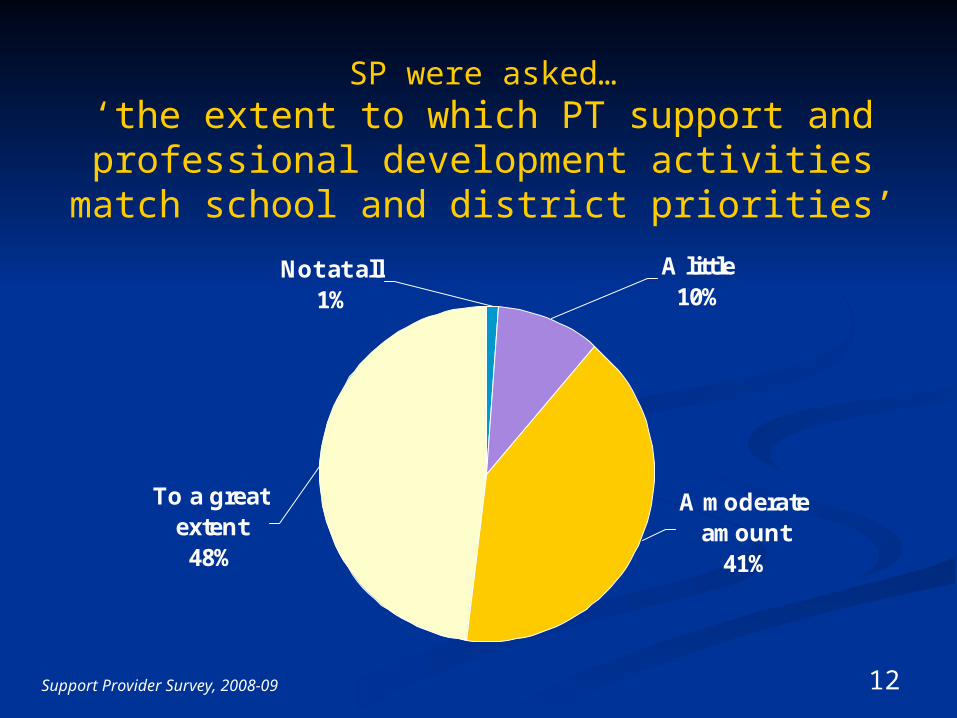
SP were asked…‘the extent to which PT support and professional development activities match school and district
priorities’
A moderate amount
41%
A little10%
Not at all1%
To a great extent48%
Support Provider Survey, 2008-09
13
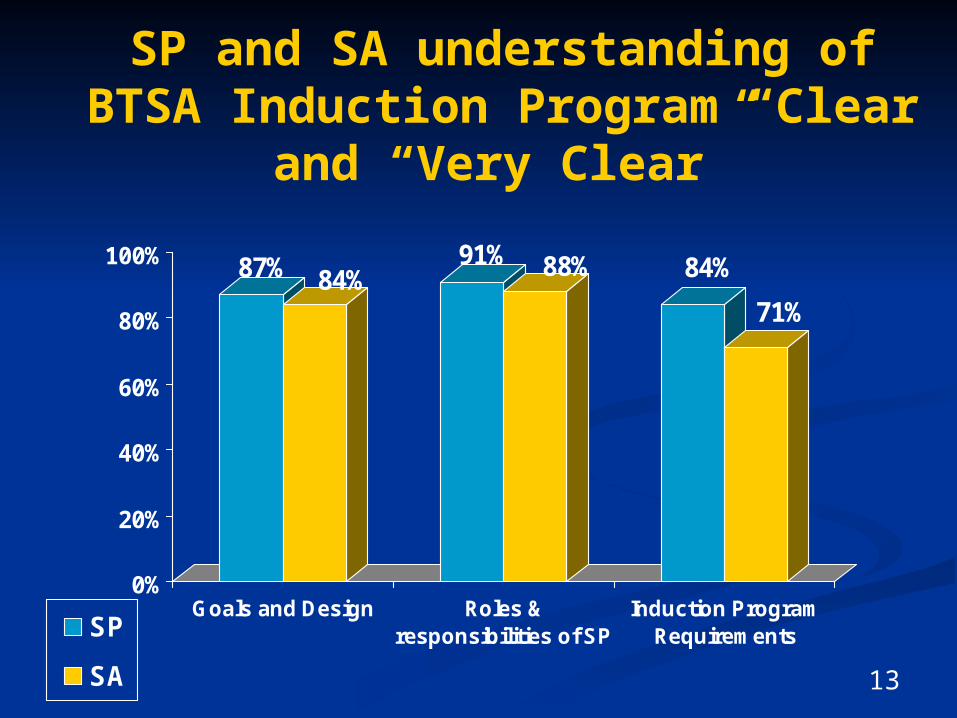
SP and SA understanding of BTSA Induction Program “Clear and “Very
Clear”
87% 84%91% 88% 84%
71%
0%
20%
40%
60%
80%
100%
Goals and Design Roles &responsibilities of SP
Induction ProgramRequirementsSP
SA
14
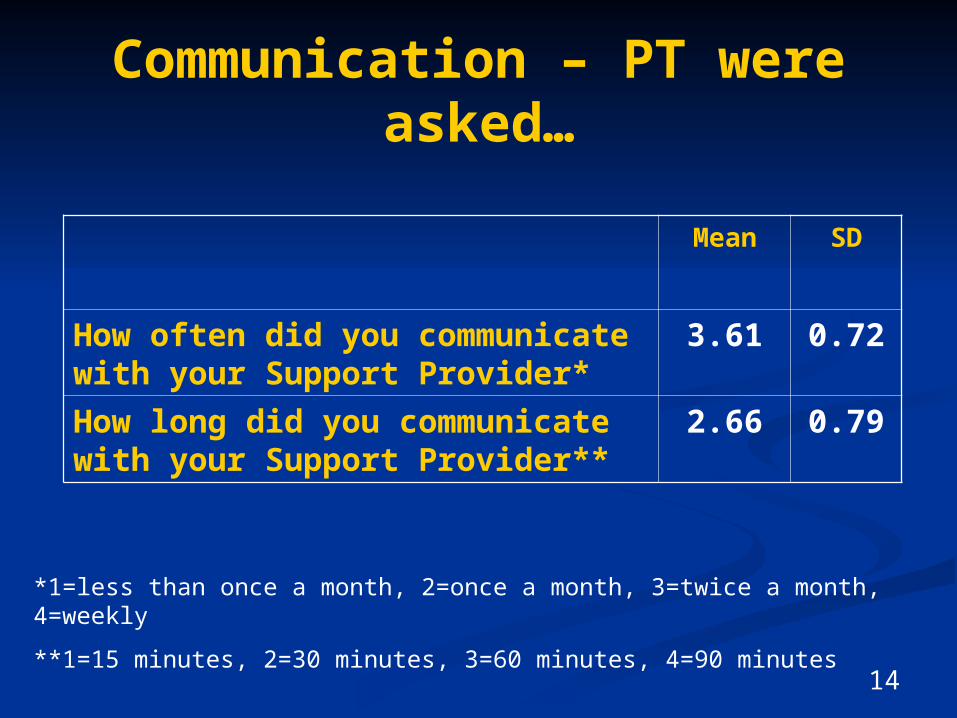
Communication – PT were asked…
Mean SD
How often did you communicate with your Support Provider*
3.61 0.72
How long did you communicate with your Support Provider**
2.66 0.79
*1=less than once a month, 2=once a month, 3=twice a month, 4=weekly
**1=15 minutes, 2=30 minutes, 3=60 minutes, 4=90 minutes
15
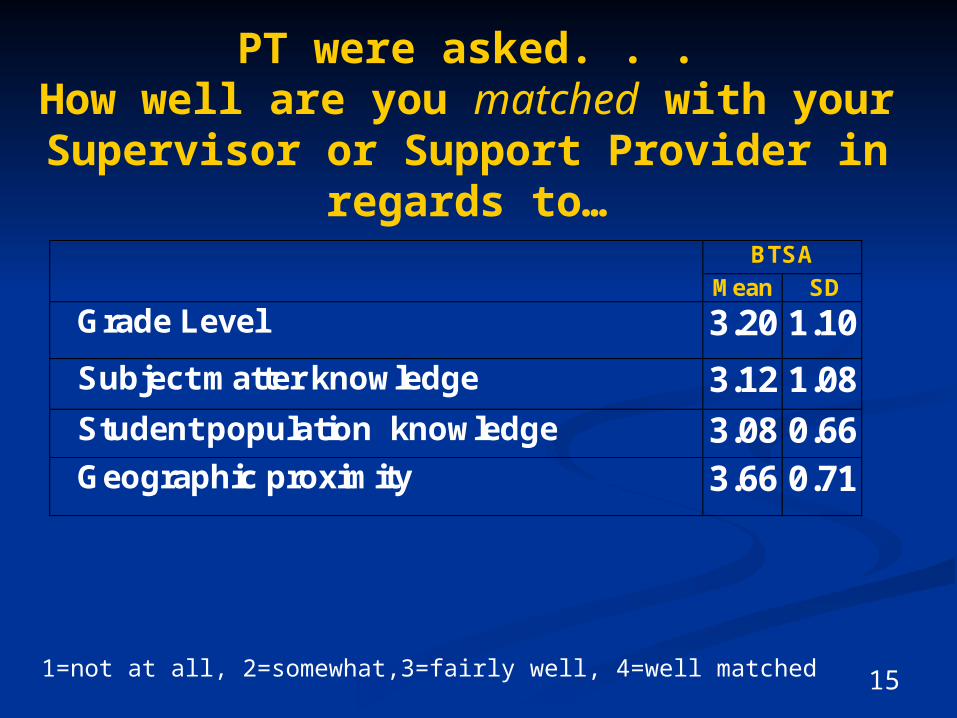
PT were asked. . .How well are you matched with your
Supervisor or Support Provider in regards to…
BTSA
Mean SD
Grade Level 3.20 1.10
Subject matter knowledge 3.12 1.08 Student population knowledge 3.08 0.66 Geographic proximity 3.66 0.71
1=not at all, 2=somewhat,3=fairly well, 4=well matched
16
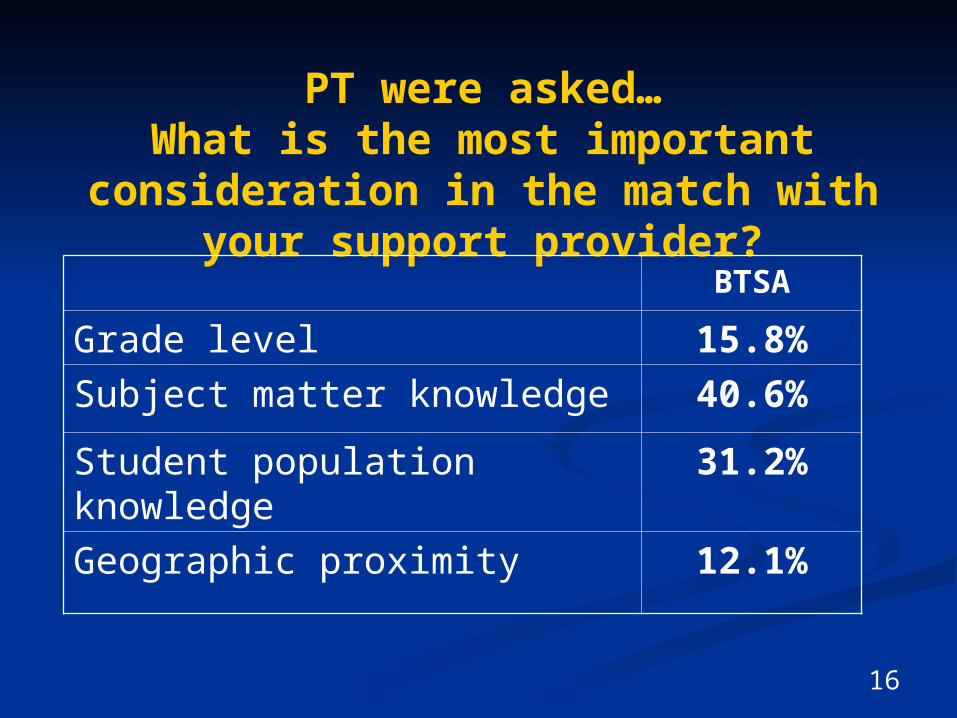
PT were asked…What is the most important consideration in the match with your support provider?
BTSA
Grade level 15.8%
Subject matter knowledge 40.6%
Student population knowledge 31.2%
Geographic proximity 12.1%
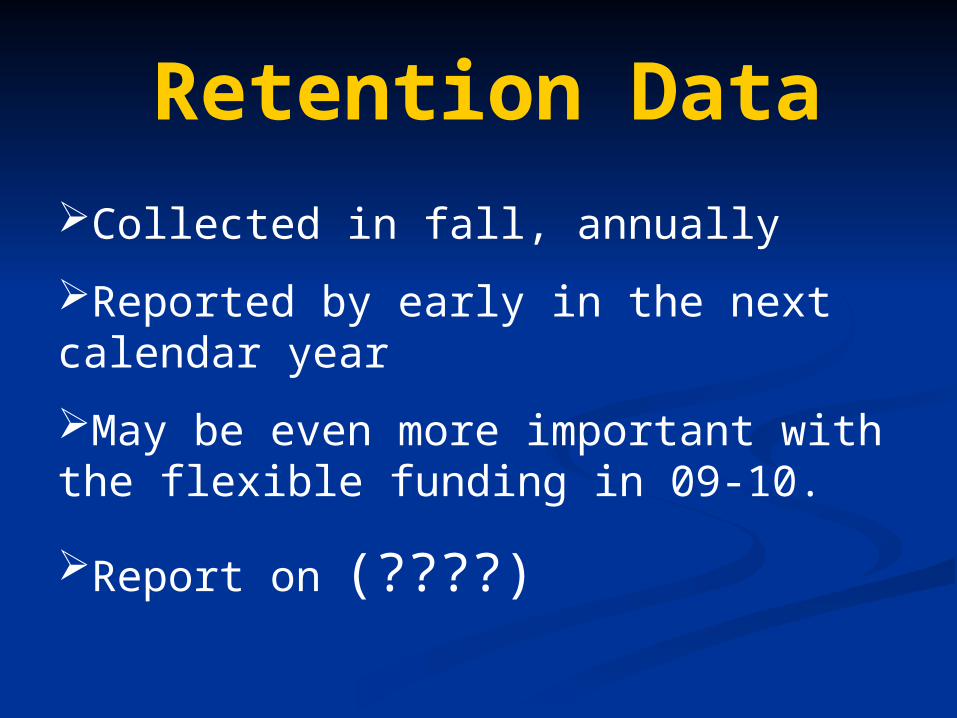
Retention Data
Collected in fall, annually
Reported by early in the next calendar year
May be even more important with the flexible funding in 09-10.
Report on (????)
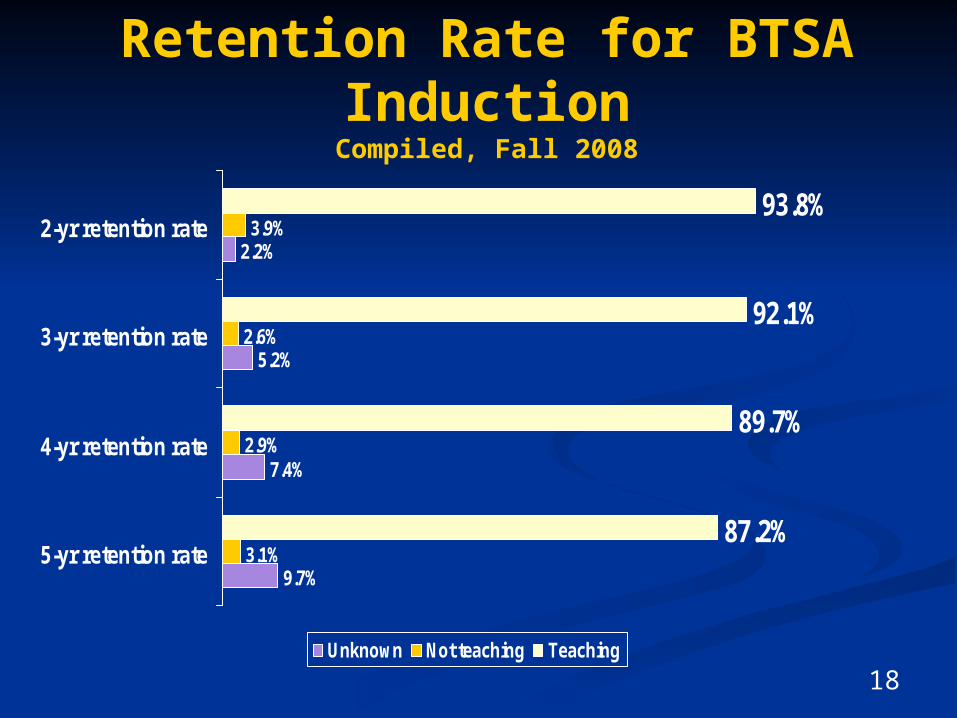
18
Retention Rate for BTSA InductionCompiled, Fall 2008
9.7%
7.4%
5.2%
2.2%
3.1%
2.9%
2.6%
3.9%
87.2%
89.7%
92.1%
93.8%
5-yr retention rate
4-yr retention rate
3-yr retention rate
2-yr retention rate
Unknown Not teaching Teaching