state of the (older) nation 2018 - cota australia · the vast majority (80%) told us that they feel...
TRANSCRIPT

STATE OF THE (OLDER) NATION 2018
A nationally representative survey prepared for the COTA Federation (Councils on the Ageing)
December 2018

REPORT PREPARED FOR
DISCLAIMER
This project was conducted in accordance with AS: ISO20252:2012 guidelines, to which Newgate Research is accredited.
Project reference number: NGR 1801008
This document is commercial-in-confidence; the recipient agrees to hold all information presented within as confidential and agrees not to use or disclose, or
allow the use or disclosure of the said information to unauthorised parties, directly or indirectly, without prior written consent. Our methodology is copyright to
Newgate Research, 2018.
2
ISSN 2652-8759

CONTENTS Page
EXECUTIVE SUMMARY 4
BACKGROUND TO THIS RESEARCH 10
HOW ARE OLDER AUSTRALIANS FEELING ABOUT LIFE? 14
Quality of Life 16
Vulnerability 24
Future Sentiment and Concerns 28
Feelings of Value 34
DIMENSIONS OF LIFE 37
Employment 38
Age Discrimination 44
Financial Security & Cost of Living 49
Health 56
Home and Aged Care 62
Housing 65
Later Life Planning 69
Consumer Complaints & Rights 74
Getting Around 80
KEY DIFFERENCES BY DEMOGRAPHICS 86
LOOKING TO THE FUTURE 93
Priority Issues for COTA to Address 94
Conclusions 101
APPENDIX 1033

EXECUTIVE SUMMARY
5
EXECUTIVE SUMMARY
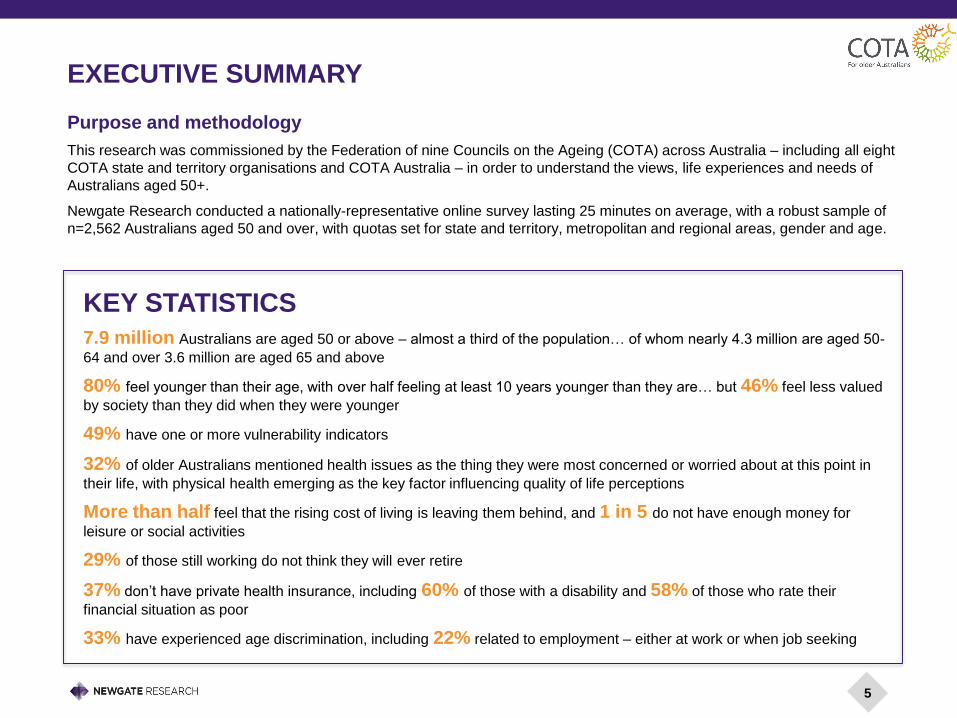
Purpose and methodology
This research was commissioned by the Federation of nine Councils on the Ageing (COTA) across Australia – including all eight
COTA state and territory organisations and COTA Australia – in order to understand the views, life experiences and needs of
Australians aged 50+.
Newgate Research conducted a nationally-representative online survey lasting 25 minutes on average, with a robust sample of
n=2,562 Australians aged 50 and over, with quotas set for state and territory, metropolitan and regional areas, gender and age.
7.9 million Australians are aged 50 or above – almost a third of the population… of whom nearly 4.3 million are aged 50-
64 and over 3.6 million are aged 65 and above
80% feel younger than their age, with over half feeling at least 10 years younger than they are… but 46% feel less valued
by society than they did when they were younger
49% have one or more vulnerability indicators
32% of older Australians mentioned health issues as the thing they were most concerned or worried about at this point in
their life, with physical health emerging as the key factor influencing quality of life perceptions
More than half feel that the rising cost of living is leaving them behind, and 1 in 5 do not have enough money for
leisure or social activities
29% of those still working do not think they will ever retire
37% don’t have private health insurance, including 60% of those with a disability and 58% of those who rate their
financial situation as poor
33% have experienced age discrimination, including 22% related to employment – either at work or when job seeking
KEY STATISTICS
Overall, the survey results tell a positive story about life for the majority of older Australians
The vast majority (80%) told us that they feel younger than their actual age, with more than half (51%) stating that they feel at least
ten years younger.
A high proportion (78%) rate their quality of life as good (7 or more out of 10), and seven in ten (70%) feel positively about what the
future holds for them in the next couple of years.
However, there are also some more concerning statistics
Three in four older Australians (74%) feel that they have much to offer society as an older person, gained through their life
experiences – but despite this, nearly half (46%) feel less valued by society than when they were younger. Furthermore, only a
quarter (27%) feel that things are getting better for Australians aged 50+, while 41% feel things are getting worse.
In considering these results, it is also critical that we understand and focus on the group that is not doing so well – for example, the
ones providing ratings at the lower end of the scales described above – and understand how their lives and experiences can be
improved. Within our analysis we have identified a segment of vulnerable older Australians whose experience isn’t as positive, and
who could be considered most at risk from socio-economic stress. Further explanation on this cohort is provided in the
Vulnerability chapter, and their story is woven throughout the report.
When it comes to demographic differences, the survey indicates that women aged 50+ are faring better than men when it comes
to their overall happiness, while men reported being in a better financial position. There are few notable differences by state or
territory – though at an overall level residents of the ACT reported being better off than those in other locations against a number
of measures, and conversely there are some indications that those in WA, SA and the NT are worse off in some regards. Age is
where we see most of the key differences amongst our sample: notably those at the higher end of the age spectrum are more
vulnerable than those at the lower end, but those in their 50s also reported more difficulties compared to those in older age
groups, in terms of finances, disposable income and living situations. In addition, non-working people who are renting are faring
significantly worse than the rest of their age groups – in particular the 50-64 year old non-working people who are renting.
A focus on health and finances will be the key to unlocking better outcomes for older
Australians
The use of statistical regression modelling to determine what drives quality of life perceptions reveals that physical health is far
and away the key factor affecting this measure (whether positively or negatively). Furthermore, we see that both health and
finances play a huge role in the differing views and experiences of older Australians.
6
EXECUTIVE SUMMARY (CONT’D)

7
Health is the number one concern for older Australians
When asked what they were most concerned or worried about at this point in their life, a third (32%) of older Australians
mentioned health issues (note this was an open-ended question, not from a list), which was the most commonly-mentioned topic
– with finances and the cost of living not far behind (27%). The top reason people gave for a poor (0-4) quality of life rating was
health problems (60% of the 7% who gave a poor rating); while ‘good health’ was the top reason given for a very high (9-10)
rating.
However, over half of Australians aged 50+ don’t do the Government-recommended amount of weekly exercise (30
minutes per day for those aged over 65), with just over a third (36%) doing less than one hour of exercise per week.
While the majority of older Australians (72%) rate their diets as healthy or very healthy, people who rated their diet as very
unhealthy are likely to be highly vulnerable, including being unemployed, having a low household income of less than
$30,000 per annum, and/or having a disability.
The large majority (88%) of those who accessed medical services were satisfied with them, and 72% had little or no difficulty
with medical service access. The highest barrier to service access was cost, with almost one third (31%) of those who
had difficulty in accessing medical services citing cost as the reason. Other key barriers included long waiting lists, the
travel distance required, and the cost of medicines.
Over a third (37%) of Australians aged 50+ don’t have private health insurance, including 60% of those with a disability and
58% of those who rate their financial situation as poor. This suggests that the majority of those with higher vulnerability, who
would greatly benefit from private health insurance for their medical needs, are unable to afford it.
When it comes to home and aged care, of the 9% of Australians aged 65+ who receive home or community care from an
external provider, 88% rated their satisfaction at 7 out of 10 or above, and around half (55%) were completely satisfied with
those services (rating them at 9-10). Of those who had tried to access home or aged care services in the past year (either for
themselves or someone else such as a family member), 20% reported difficulties in doing so, mainly due to cost (24%),
waiting lists (19%) and lack of suitable services (16%).
EXECUTIVE SUMMARY (CONT’D)

Mixed experiences on financial security and the cost of living
The situation regarding cost of living and financial security amongst older Australians is quite mixed. On the positive side, more
than half feel secure about their finances being able to meet their needs throughout the rest of their lives, and able to
afford leisure and social activities; and over half have little to no difficulty with financial terminology and concepts, suggesting that
they are comfortable with and knowledgeable of financial processes, accounts, and other items.
But more than half of older Australians feel that the rising cost of living is leaving them behind and one in five don’t have
any money to spend on leisure or social activities. Those who feel less financially secure were more likely to feel that they are
being left behind by the cost of living. One in five older Australians feel very insecure about their finances, and 12% of survey
participants were struggling with overdue bills due to payment difficulties.
Underemployment is evident: 38% of those surveyed are in paid employment (57% of those aged 50-64 and 15% of those
aged 65+). Of these, 28% want more paid work, especially those aged 50-64 (29%) but also those aged 65+ (21%). On average,
those wanting more work are currently paid for 25 hours or less per week, and are more likely to have high vulnerability indicators
(strongly characterised by low financial security), have children in the household, and/or be renting.
Those who were aware of recent Government initiatives and changes to welfare and investment policies (who were
notably in the minority for each initiative) tended to think the impacts of these would be negative. The exception was for
home downsizing incentives which were largely positively received.
Working older Australians today expect a retirement age of 65, four years older than the average retirement age of those already
retired (61). The study found that the expected age of retirement increases as household income level decreases: those earning
less than $30k expect to retire at 70, while those earning $100k or more expect to retire at 65. Further, 29% of working older
Australians do not expect to ever retire, and this was more likely among those who rated their financial situation poorly at 0-4
out of 10 (45%).
In addition, well over half (56%) of older Australians commit time to unpaid work, at an average of 10.5 hours per week
(NB this average includes those who don’t do any unpaid work or caring duties). This includes both community volunteering and
caring for family and friends. Seven per cent of older Australians spend the equivalent of a standard working week (35 hours)
providing this unpaid work, and these people are most likely to be in the 80+ age bracket, as well as having high vulnerability and
low household income.
8
EXECUTIVE SUMMARY (CONT’D)
One in three older Australians have experienced age discrimination of some kind
… and more than a fifth (22%) have experienced employment-related discrimination. This indicates that there is a real
need for the value of older people in the workforce to be better communicated and more appreciated in the workforce and by
employers. There is also a need for older people to have clear recourse to assistance in the event of discrimination, especially
when seeking employment, given that only 10% of those who reported experiencing this discrimination had tried to take
any action to address it.
Meanwhile, a quarter (24%) of older Australians feel their age is a factor in the service they receive as consumers –
and for most this is in a negative way; e.g. feeling ignored by sales staff. While there is a reasonable level of confidence to
lodge complaints or report problems when shopping (in-person, 91%, and online, 77%), only 54% of older Australians are
confident that they understand their rights as a consumer when shopping online, suggesting a need for education
around the distinct differences for this mode of purchasing.
There is overwhelming support for assisted dying
On the topic of assisted dying, overwhelming support is evident, at 84% - with results highly consistent across all states
and territories. Some differences were found by religion, where support was highest among those with no religion (95%), and
lowest among those who identified as Baptist (53%) or Catholic (74%). The large majority of survey participants were also
open to investigating it for themselves if they had a terminal illness or incurable condition.
Older Australians would like COTA to focus on improving finance and health services
In line with the financial and health-related themes which run throughout this report, 15% spontaneously (i.e. unprompted)
asked COTA to lobby for an increase to the pension; this included one in four (26%) of those currently receiving the
age pension. The vulnerable cohort we identified were especially likely to request this.
When prompted with a set of suggestions as to what COTA could lobby for, three quarters (73%) felt that improving the
affordability of services such as energy, internet or phone contracts would make a fair bit or even a great deal of
difference to them personally.
Meanwhile, around one in ten (11%) spontaneously asked for COTA to lobby for improvements to the quality, management
and affordability of the healthcare system, and a further one in ten (11%) for improvements to aged care specifically. When
prompted with some suggestions, two thirds (66%) felt that access to preventive health services would make a fair bit or a
great deal of difference to them personally.
9
EXECUTIVE SUMMARY (CONT’D)

BACKGROUND TO THIS RESEARCH
BACKGROUND & RESEARCH OBJECTIVES
11
Background to this research
The Councils on the Ageing (COTA)’s role is to promote,
improve and protect the wellbeing of older people in
Australia as citizens and consumers. COTA advances the
rights, interests and futures of Australians as we age.
In 2018, the Federation of the nine COTAs across
Australia commissioned Newgate Research to conduct
this nationally-representative survey to understand more
about the lives, views and requirements of Australians
aged 50 and over. The intention is that this State of the
(Older) Nation will be conducted annually to monitor
trends over time, and the impact of changes made to
improve the lives of older Australians.
The national objectives of the project are to –
expand the breadth of engagement with Australians
over 50 years across the country (both in terms of
demographics and topic/interest areas),
build on existing knowledge about older people around
Australia, highlighting similarities and differences
(using a mix of state-by-state; age cohorts; gender and
other socio-economic profiles), and
provide information around issues of interest to assist
in policy development and/or industry practices.
A second version of this survey was also conducted with
COTA members, supporters and Senior’s Card holders. The
results of the 13,961 responses have been provided to
COTA separately and are not included in this report.
To inform the survey design, Newgate conducted four
qualitative group discussions across Melbourne and
Busselton in Western Australia, as well as five cognitive
interviews to optimise survey content and design.
The survey covered a wide range of topics of importance
to older Australians, including:
Quality of life;
Financial security;
Health and access to medical services;
Home and aged care services;
Employment;
Age discrimination;
Consumer Rights and Complaints;
Life planning;
Mobility and transport; and
Housing.

PROJECT METHODOLOGY
A 25-minute online survey was conducted with n=2,562
Australians aged 50 and over across Australia.
The table to the right shows the final (unweighted) sample
breakdown for each state. The total sample size results in a
very robust maximum margin of error of +/-1.9% at the 95%
confidence level, with margins of error for each state and
territory being slightly higher.
The survey was conducted between 20th August and 14th
September 2018 with respondents drawn from a professional
online research panel.
To enhance its accuracy, the data set was weighted using
population data from the Australian Bureau of Statistics’
Census 2016 for age, gender, state and location (Capital/Non-
capital cities). The weighting structure is show in the Appendix.
All results presented throughout this report are weighted unless
specified otherwise.
The NT sample may not be considered reflective of the
Territory’s overall population, despite best efforts which
included using a number of online panels. Weighting was used
to correct for lower numbers of regional and older cohorts in the
NT sample; however there was very low representation from
Indigenous persons which should be borne in mind when
considering the results throughout the report.
Please see the Appendix for a summary of the benefits and
limitations of this methodology. Full data tables of results have
been provided to the COTA Federation separately
State / TerritorySample Size
(n=)
Margin of error
(95% Con. Interval)
NSW 524 +/- 4.3%
VIC 523 +/- 4.3%
QLD 409 +/- 4.8%
WA 307 +/- 5.6%
SA 296 +/- 5.7%
TAS 202 +/- 6.9%
ACT 199 +/- 6.9%
NT 102 +/- 9.7%
Total 2,562 +/- 1.9%
- 29% were born overseas
- 6% prefer to speak a language other than English at home
or with close family members
- 1% identify as Aboriginal or Torres Strait Islander
12

NOTES TO THE READER
This research was conducted in accordance with the international quality standard for market and social research (ISO
20252).
In preparing this report we have presented and interpreted information that we believe to be relevant to achieve the objectives
of this research project.
Where assumptions are made as a part of interpreting the results or where our professional opinion is expressed rather than
merely describing the findings, this is noted. Please ensure that you take these assumptions into account when using this
report as the basis for any decision-making.
Please note that percentages on single response questions may not total 100% due to rounding, and if the question was
multiple response the total may also exceed 100%.
Throughout the report, weighted results are shown. See the Appendix for more information about the weights used.
The actual questions asked in the survey are shown at the bottom of each page, along with the respondent base (typically all
respondents). Where questions accepted multiple responses, this is specified after the question; otherwise questions should
be assumed to have accepted a single response only.
Relevant statistically significant differences between sub-groups or questions are identified throughout the report at the 95%
confidence level, using up / down arrows.
We also conducted regression modelling to determine the underlying drivers of perceptions around quality of life. This is a
standard mathematical approach to survey data, allowing us to calculate the degree to which certain traits or attributes affect
an overarching variable, such as perception of quality of life.
Verbatim quotes from the research are included in the report to further support and provide evidence of the findings.
Throughout the report Australians aged 50 and over may on occasion also be referred to as ‘older Australians’; please note
that this term should be taken to refer to the 50+ age group as a whole, rather than just the older age groups in the study.
13

HOW ARE OLDER AUSTRALIANS FEELING ABOUT LIFE?
HOW THEY ARE FEELING – KEY FINDINGS
15
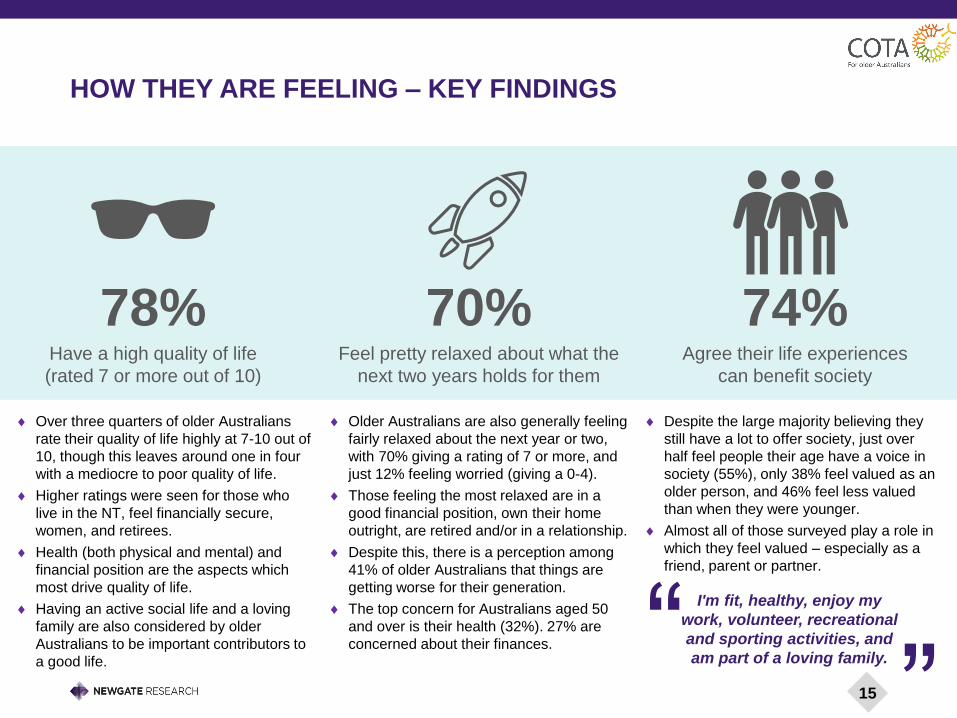
78%Have a high quality of life
(rated 7 or more out of 10)
70%Feel pretty relaxed about what the
next two years holds for them
74%Agree their life experiences
can benefit society
Over three quarters of older Australians
rate their quality of life highly at 7-10 out of
10, though this leaves around one in four
with a mediocre to poor quality of life.
Higher ratings were seen for those who
live in the NT, feel financially secure,
women, and retirees.
Health (both physical and mental) and
financial position are the aspects which
most drive quality of life.
Having an active social life and a loving
family are also considered by older
Australians to be important contributors to
a good life.
Older Australians are also generally feeling
fairly relaxed about the next year or two,
with 70% giving a rating of 7 or more, and
just 12% feeling worried (giving a 0-4).
Those feeling the most relaxed are in a
good financial position, own their home
outright, are retired and/or in a relationship.
Despite this, there is a perception among
41% of older Australians that things are
getting worse for their generation.
The top concern for Australians aged 50
and over is their health (32%). 27% are
concerned about their finances.
Despite the large majority believing they
still have a lot to offer society, just over
half feel people their age have a voice in
society (55%), only 38% feel valued as an
older person, and 46% feel less valued
than when they were younger.
Almost all of those surveyed play a role in
which they feel valued – especially as a
friend, parent or partner.
I'm fit, healthy, enjoy my
work, volunteer, recreational
and sporting activities, and
am part of a loving family.“”

QUALITY OF LIFE

51% 29% 12%
5% 3%
How old do you feel?
Q3. What is your actual age? What age do you feel?
Base: All respondents (n=2,562)
HOW OLD DO YOU FEELMost over 50s feel younger than their actual age (80%) while only 8% feel older
The older you get, the younger you feel
On average, the over 80s feel 13 years younger than they are, while 50-59 year olds feel 9 years younger on average.
Women are younger at heart
Women feel 12 years younger than their actual age, whereas men feel 10 years younger on average.
What helps you feel younger?
o Having good physical health: People rating their physical health at 8 or more out of 10 felt 14 years younger on average,
while those rating their physical health poorly at 0-4 felt just 2 years younger than their actual age
o Having a good quality of life: Those rating their quality of life as 7 or more out of 10 feel younger than those providing a
poor rating of 0-4 (13 years younger compared to just 1 year younger)
o Being financially secure: People rating their long term financial security highly, at 8 or more out of 10, feel younger than
those giving a rating or 4 or less (12 years younger, compared to 9 years younger), with a similar result for those rating their
current financial situation highly (12 years younger vs 8 years younger among those who rated their current situation poorly).
More than 10 years
younger
Up to 10 years
younger
Same age as I
am
Up to 10 years
older
More than 10
years older
17

Q6. How would you rate your overall quality of life at the moment? Scale: 0 = very poor, 10 = excellent.
Base: All respondents (n=2,562)
OVERALL QUALITY OF LIFE
The majority of older Australians feel they have a good quality of life, but 7% are struggling
7 14 19 33 17 9
Quality of life rating (%)
0 - 4 (Poor) 5 - 6 7 8 9 10 (Excellent)
Poor ratings of 0-4 were more
prevalent among those who:
Rate their financial situation poorly (0-4) 30%
Have a disability 20%
Are renting 19%
Are unemployed, on a disability pension,
not in paid employment or a student16%
Have children living in the household 13%
Single (unmarried, divorced or widowed) 11%
Younger (aged 50-59) 10%
Very high ratings of 9-10 were more
prevalent among those who:
Rate their financial situation highly (8-10) 45%
Live in the NT 38%
Own their home outright 33%
Are in their 70s 32%
Are fully/partially retired 30%
Are female 28%
More than three quarters of survey participants (78%) rated their quality of life highly, at 7 or more out of 10, including
a quarter who feel particularly positive (26% gave a 9 or 10). Meanwhile, just over one in five (22%) rated their quality of life
at the mediocre or poor end of the scale, with 7% giving a low rating of just 0-4.
Average
7.4
18

Q7. What makes you feel that way about your overall quality of life?
Base: All respondents (n=2,562) (Unprompted question, responses subsequently coded into themes.)
WHY DO THEY FEEL THIS WAY?
26
22
21
21
12
10
7
6
5
5
5
4
4
Good health/living healthy lifestyle
Loving family/friends/relationship
I am happy/doing great/enjoying life
Health problems/illness/Recovering from illness
Good financial position/situation
Financial issues/finance could be better
Leading active/busy life
Great place to live/Own house
Employed/have job
It's good being retired/no longer working
Able to travel
Feeling unhappy/stressed/depressed
Just could be better/room for improvement
Reasons for overall quality of life ratings – top unprompted mentions 4%+
Among all respondents, health was the number
one factor in their quality of life – either in a
positive or negative sense. A quarter (26%) cited
good health or a healthy lifestyle as a reason for
their overall quality of life rating, while one in five
(21%) cited health issues.
At the next level down, having a loving family,
friends or partner was a key factor mentioned by
around one in five (22%), while the same
proportion mentioned their financial situation –
either for positive reasons (12%) or due to
financial issues (10%).
Good health, loving relationships and financial security are key to a high quality of life, while
health problems are the strongest factor weighing down the results for older Australians
19
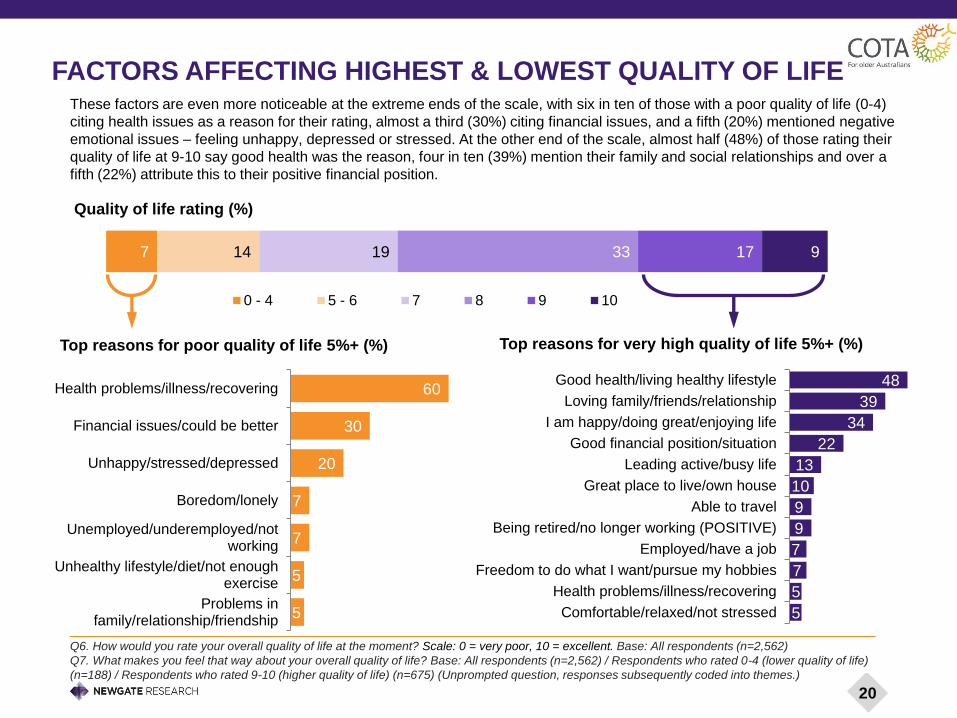
7 14 19 33 17 9
Quality of life rating (%)
0 - 4 5 - 6 7 8 9 10
60
30
20
7
7
5
5
Health problems/illness/recovering
Financial issues/could be better
Unhappy/stressed/depressed
Boredom/lonely
Unemployed/underemployed/notworking
Unhealthy lifestyle/diet/not enoughexercise
Problems infamily/relationship/friendship
Top reasons for poor quality of life 5%+ (%)
FACTORS AFFECTING HIGHEST & LOWEST QUALITY OF LIFE
48
39
34
22
13
10
9
9
7
7
5
5
Good health/living healthy lifestyle
Loving family/friends/relationship
I am happy/doing great/enjoying life
Good financial position/situation
Leading active/busy life
Great place to live/own house
Able to travel
Being retired/no longer working (POSITIVE)
Employed/have a job
Freedom to do what I want/pursue my hobbies
Health problems/illness/recovering
Comfortable/relaxed/not stressed
Top reasons for very high quality of life 5%+ (%)
These factors are even more noticeable at the extreme ends of the scale, with six in ten of those with a poor quality of life (0-4)
citing health issues as a reason for their rating, almost a third (30%) citing financial issues, and a fifth (20%) mentioned negative
emotional issues – feeling unhappy, depressed or stressed. At the other end of the scale, almost half (48%) of those rating their
quality of life at 9-10 say good health was the reason, four in ten (39%) mention their family and social relationships and over a
fifth (22%) attribute this to their positive financial position.
Q6. How would you rate your overall quality of life at the moment? Scale: 0 = very poor, 10 = excellent. Base: All respondents (n=2,562)
Q7. What makes you feel that way about your overall quality of life? Base: All respondents (n=2,562) / Respondents who rated 0-4 (lower quality of life)
(n=188) / Respondents who rated 9-10 (higher quality of life) (n=675) (Unprompted question, responses subsequently coded into themes.)
20

Q7. What makes you feel that way about your overall quality of life?
Base: All respondents (n=2,562)
QUALITY OF LIFE – IN THEIR OWN WORDS
My husband has terminal cancer and I
spend most of my time being his carer.
Have retired, on a good pension, play
golf 2 days a week, wife is all good, kids
and grandkids are all good and healthy.“ ”
I'm fit, healthy, enjoy my work, volunteer,
do recreational and sporting activities, and
am part of a loving family.“ ”I’m alone and live week to week.
I am a 50 year old unemployed single mum
and every single day is a financial struggle. I
have the most amazing children but I feel
bad that I can't support them adequately.
Working too long, in too much
debt, have no freedom.
Even though I am disabled and am limited in
what I can do I have a partner and family
that love me, have everything I need and
can pursue my hobbies, I have little or no
stress in my life most days.“”
I live in a beautiful quiet country
town. I have no mortgage and can
live comfortably on the pension.“ ”
My finances are stable and I'm
happily married to my second wife.“ ”I am old, tired and depressed.
21

RATINGS OF DIFFERENT ASPECTS OF LIFEThe highest rated of a range of aspects of life for older Australians were their living
environment, personal freedom and mental health
When asked to rate various aspects of their
lives on a scale where 0 meant very poor
and 10 meant excellent, Australians aged 50
and over were particularly positive about
their living environment and freedom of life
choices, and least positive about their
connection to the local and their financial
situation.
Over 70s gave higher scores for all
measures, as do those with high incomes.
The vulnerable group have lower scores for
all metrics.
There was very little difference in location
(either by state and territory or
metro/regional/rural) for any of these
measures.
Women are more likely to give higher ratings
(8-10) for their social interactions than men
(60% vs 50%) and their sense of connection
to the local community (39% vs 30%).
Physical health
Mental health
Ability to go
where you want
Living environment
Family life
Freedom to
make choicesConnection to local
community
Financial situation
Social relationships
Q11. How would you rate each of the following at this point in your life? Scale: 0 = very poor, 10 = excellent.
Base: All respondents (n=2,562)
70%
68%
68%
64%
55%55%
46%
44%
35%
Proportion rating aspects of their
lives highly (% rating 8-10)
22
Q6. How would you rate your overall quality of life at the moment? Scale: 0 = very poor, 10 = excellent. Base: All respondents (n=2,562)
Q11. How would you rate each of the following at this point in your life? Scale: 0 = very poor, 10 = excellent. Base: All respondents (n=2,562)
CONTRIBUTORS TO QUALITY OF LIFE
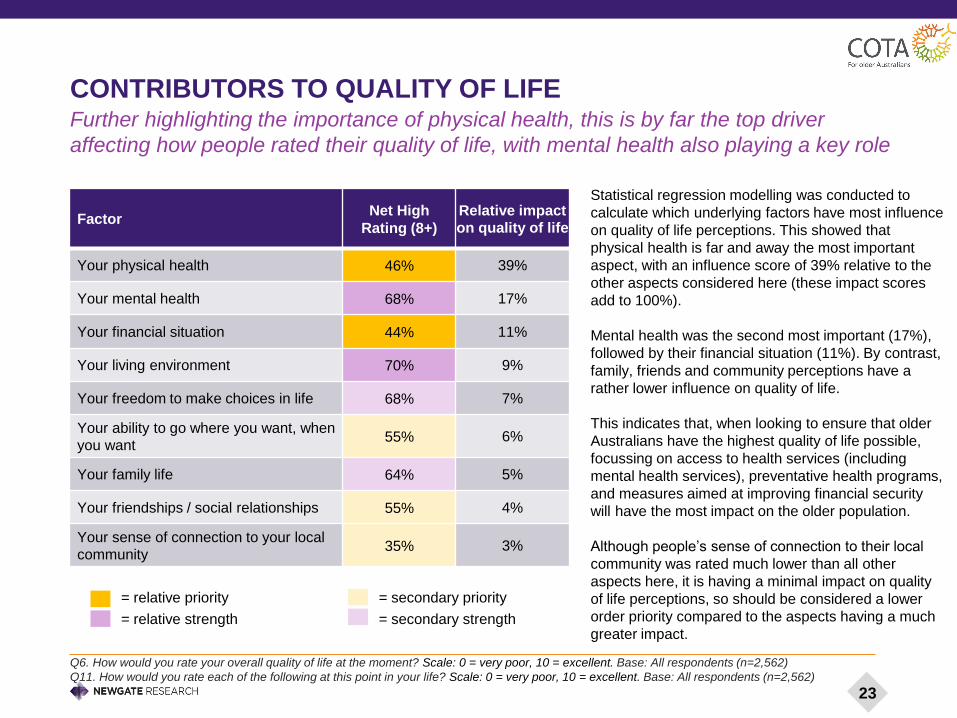
Statistical regression modelling was conducted to
calculate which underlying factors have most influence
on quality of life perceptions. This showed that
physical health is far and away the most important
aspect, with an influence score of 39% relative to the
other aspects considered here (these impact scores
add to 100%).
Mental health was the second most important (17%),
followed by their financial situation (11%). By contrast,
family, friends and community perceptions have a
rather lower influence on quality of life.
This indicates that, when looking to ensure that older
Australians have the highest quality of life possible,
focussing on access to health services (including
mental health services), preventative health programs,
and measures aimed at improving financial security
will have the most impact on the older population.
Although people’s sense of connection to their local
community was rated much lower than all other
aspects here, it is having a minimal impact on quality
of life perceptions, so should be considered a lower
order priority compared to the aspects having a much
greater impact.
Further highlighting the importance of physical health, this is by far the top driver
affecting how people rated their quality of life, with mental health also playing a key role
FactorNet High
Rating (8+)
Relative impact
on quality of life
Your physical health 46% 39%
Your mental health 68% 17%
Your financial situation 44% 11%
Your living environment 70% 9%
Your freedom to make choices in life 68% 7%
Your ability to go where you want, when
you want55% 6%
Your family life 64% 5%
Your friendships / social relationships 55% 4%
Your sense of connection to your local
community35% 3%
= relative priority
= relative strength
= secondary priority
= secondary strength
23
VULNERABILITY

Within analysis, we looked particularly at those older Australians who could be
considered more at risk
VULNERABILITY AMONGST OLDER AUSTRALIANS
25
Although the story thus far has shown that the majority of older Australians feel positive about their quality of life, it was important
to the COTAs to shed light on those whose experience isn’t as positive, and who could be considered most at risk from socio-
economic stress. In turn, we can therefore gain deeper insight into how to better meet the needs of these Australians.
To do this, we built on previous research regarding vulnerable consumers, including a major 2016 study by Newgate for the
Australian Energy Market Commission*. The AEMC survey found that Australians aged 50+ fall into two distinct segments: one
less vulnerable (noting that all segments of the community have some level of vulnerability) and one significantly more vulnerable,
and these segments were roughly the same size.
Within COTA’s survey, we also see that people with one or more indicators of higher vulnerability represent roughly half of all
survey participants – noting that we used slightly different criteria to build this segment given the different survey participants and
objectives.
The segmentation can be found on the next page.
* See: www.aemc.gov.au/markets-reviews-advice/2016-retail-competition-review

Just over one in two Australians aged 50+ are vulnerable – and their quality of life is lower
VULNERABILITY AMONGST OLDER AUSTRALIANS (CONT’D)
26
This vulnerability measure is composite of: DM7. Do any of the following apply to you? Base: All respondents (n=2,562), DM8. Have you personally
experienced any of these in the last year? Base: All respondents (n=2,562), and DM15. And what is the combined annual income of everyone in your
household, from all sources before tax or other deductions? Base: Respondents with more than one person in household (n=1,967)
Indicators used to identify vulnerability
Have a low income ($0 - $30k per capita) 37%
Living with disability 19%
Speak a language other than English at home 6%
Bereaved in the last year 2%
Indigenous 1%
Experienced domestic violence in the past year 1%
Experienced homelessness in the last year <1%
Lower vulnerability Higher vulnerability
49%have one or
more higher
vulnerability
indicators
* See: www.aemc.gov.au/markets-reviews-advice/2016-retail-competition-review
When devising this segmentation, we took into account the fact that although certain factors are associated with vulnerability, it
does not result in all individuals with those attributes being characterised as vulnerable.
Physical and mental health is not included given the subjective nature of these questions within the survey.
People who are renting were also not automatically included within this vulnerable grouping, given that some people who are
renting have relatively high incomes and rate their health and financial situation highly. Instead, two-thirds of all people who are
renting within our sample have fallen naturally within the above segmentation.

27
The higher vulnerability group is also more likely to:
• Be at the higher end of the age spectrum: 62% of those aged
80+, and 55% of those in their 70s vs 50% of those in their 60s
and 40% of those in their 50s
• Not have private health insurance 70%
• Live outside the capital cities 57%
• Be renting 68%
• Live in South Australia or Western Australia both 55%
As shown above, the more vulnerable group rated
their current quality of life significantly lower than
others – on average 6.9 out of 10, compared with
7.9 among those less vulnerable. Perhaps more
starkly, fewer than half gave this a high rating of 8
or more out of 10 (46%), compared with the
majority of others (71%).
These results highlight a group of older people
whose needs deserve particular attention.
Throughout this report we shine more light on the
perspectives of both the more and less
vulnerable. On pages 91 and 92 of the report we
also look specifically at the non-working people
who are renting category, split into those aged 50-
64 and those aged 65+.
Q6. How would you rate your overall quality of life at the moment? Scale: 0=very poor, 10=excellent.
Base: All respondents (Higher vulnerability: n=1,1199, Lower vulnerability: n=1,363)
3
12
9
20
17
22
37
29
22
12
12
5
Lower vulnerability
Higher vulnerability
Quality of life rating by those with lower vs higher vulnerability (%)
0 - 4 5 - 6 7 8 9 10
Net 8+ Ave.
46% 6.9
71% 7.9
VULNERABILITY AMONGST OLDER AUSTRALIANS (CONT’D)
The more vulnerable group rate their quality of life as significantly lower
FUTURE SENTIMENT AND CONCERNS
12 18 18 27 16 9
Feelings about their personal outlook over the next year or two (%)
0 - 4 (Worried) 5 - 6 7 8 9 10 (Very calm and relaxed)
Q9. How are you feeling about what the future holds for you personally over the next year or two? Scale: 0 = very worried, 10 = very calm and relaxed
Base: All respondents (n=2,562)
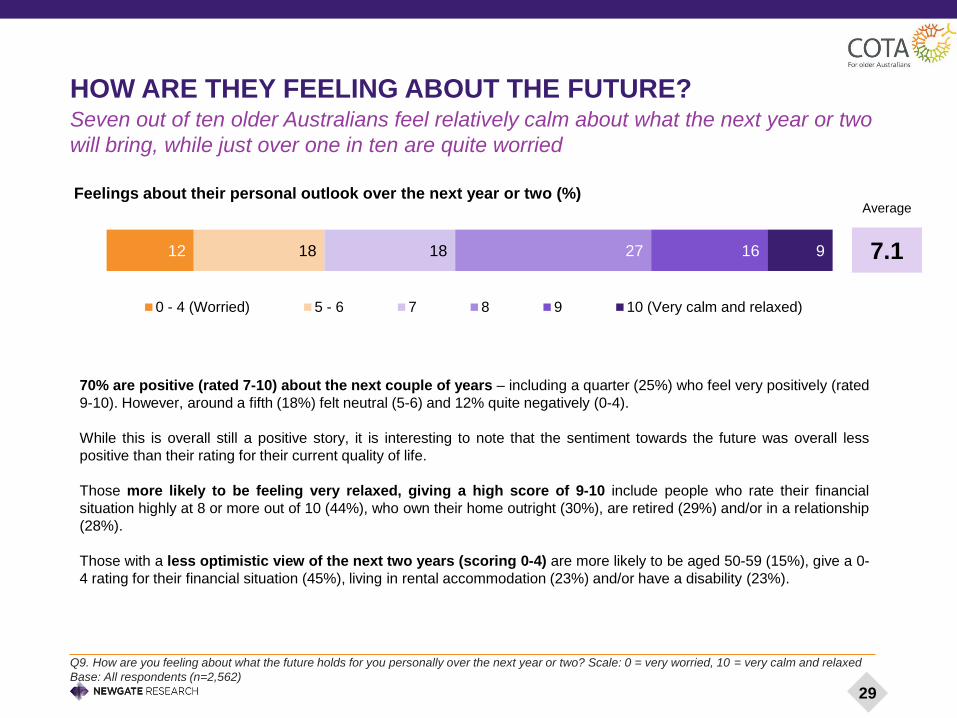
HOW ARE THEY FEELING ABOUT THE FUTURE?Seven out of ten older Australians feel relatively calm about what the next year or two
will bring, while just over one in ten are quite worried
70% are positive (rated 7-10) about the next couple of years – including a quarter (25%) who feel very positively (rated
9-10). However, around a fifth (18%) felt neutral (5-6) and 12% quite negatively (0-4).
While this is overall still a positive story, it is interesting to note that the sentiment towards the future was overall less
positive than their rating for their current quality of life.
Those more likely to be feeling very relaxed, giving a high score of 9-10 include people who rate their financial
situation highly at 8 or more out of 10 (44%), who own their home outright (30%), are retired (29%) and/or in a relationship
(28%).
Those with a less optimistic view of the next two years (scoring 0-4) are more likely to be aged 50-59 (15%), give a 0-
4 rating for their financial situation (45%), living in rental accommodation (23%) and/or have a disability (23%).
Average
7.1
29

Q10. What are the things you’re most concerned or worried about at this point in your life, if anything? Base: All respondents (n=2,562) (Unprompted
question, responses subsequently coded into themes.)
CONCERNS AND WORRIES
32
27
8
7
6
6
5
4
11
Health issues
Finance/cost of living
Partner/Other family member's health
Concerns about retirement/finances after retirement
Getting older/dying
Employment/jobs
Government control/politics
Children's career/future (specific children mentions)
Don’t know/None/All good/Taking life as it comes
Top concerns at this point in life – unprompted (4%+)
Health and financial concerns are the main issues concerning older Australians
Reflecting sentiment around quality of life, the top
concern for Australians aged 50 and over is their
health, with a third (32%) concerned about this.
Over a quarter (27%) are concerned about their
finances.
Also mentioned at much lower levels were
concerns about the health of other family
members (8%), their future after retirement, and
specifically having enough to live on (7%), getting
older or dying (6%), and employment (6%), with
politics (5%) and a range of concerns about their
children (4%) rounding out all mentions over 3%.
30

48
44
9
8
6
6
5
Finance/cost of living
Health issues
Employment/jobs
Getting older/dying
Partner/Other family member's health
Concerns about retirement/financesafter retirement
Housing/accommodation
Top concerns at this point in life ≥5% (NET: 0-4) (%)
27
23
13
8
6
6
6
5
Health issues
Don’t know/None/Taking life as it comes
Finance/cost of living
Partner/Other family member's health
Getting older/dying
Government control/politics
Children's career/future (specific childrenmentions)
Concerns about retirement/finances afterretirement
Top concerns at this point in life ≥5% (NET: 9-10) (%)
Q9. How are you feeling about what the future holds for you personally over the next year or two? Base: All respondents (n=2,562)
Q10. What are the things you’re most concerned or worried about at this point in your life, if anything? Base: Respondents who rated 0-4 (lower sentiment
about what the future holds (n=290) / Base: Respondents who rated 9-10 (higher sentiment about what the future holds (n=647)
Finance and the cost of living is the top concern for those feeling especially worried (0-4) about what the future holds, with almost
half (48%) concerned about this. Health issues are also a dominant concern (44%). At much lower levels they were concerned about
employment/jobs (9%) and housing (5%) – issues which did not feature at all in the top concerns of those feeling very relaxed about
the next two years.
For those feeling particularly relaxed about the future (a rating of 9 or 10), their top concerns are also health and finances, but in
reverse order – and at much lower levels than for the worried group.
Both groups raised concerns about getting older/dying, the health of partners or other family members, and post-retirement finances.
The twin issues of money and health top the list of concerns among those feeling the most
worried, while money issues are a much lower concern for those feeling the most relaxed
31
CONCERNS AND WORRIES (CONT’D)

Q10. What are the things you’re most concerned or worried about at this point in your life, if anything?
Base: All respondents (n=2,562)
IN THEIR OWN WORDS: CONCERNS AND WORRIES
I am worried about the fact that I
have no assets and I am not sure
how I will be cared for in later years.
Not really worried about anything much.
Always consider that at my age health can
suddenly fail but don't think much about
that while I am in current good health.“ ”
I am concerned about how I will
ever find a job to be able to support
my children and myself.
The lack of money. The house needs
fixing. I don't want to be here, but have
to wait til the son gets out of gaol.
My health; physical and mental.
Managing to survive on the Newstart
Allowance which is quite difficult
.
Not much really, I have so many
things to do yet and intend to.“ ”Can't think of anything that
concerns or worries me.“ ”
My health, and unexpected bills, hoping that my
car does not break down, or gets stolen or
crashed into. I need my car to get around. My
son has had 4 back operations and still in pain,
so is unable to work or continue with his studies.
I am worried about the cost of being
looked after when my health deteriorates.
What may happen in the world
for the younger generation.
How much my life and my daughter’s life
will be affected by the corrupted
politicians, bankers and big corporations.
32
Q12. Thinking more broadly, do you think things are generally getting better or worse for Australians aged 50+?
Base: All respondents (n=2,562)
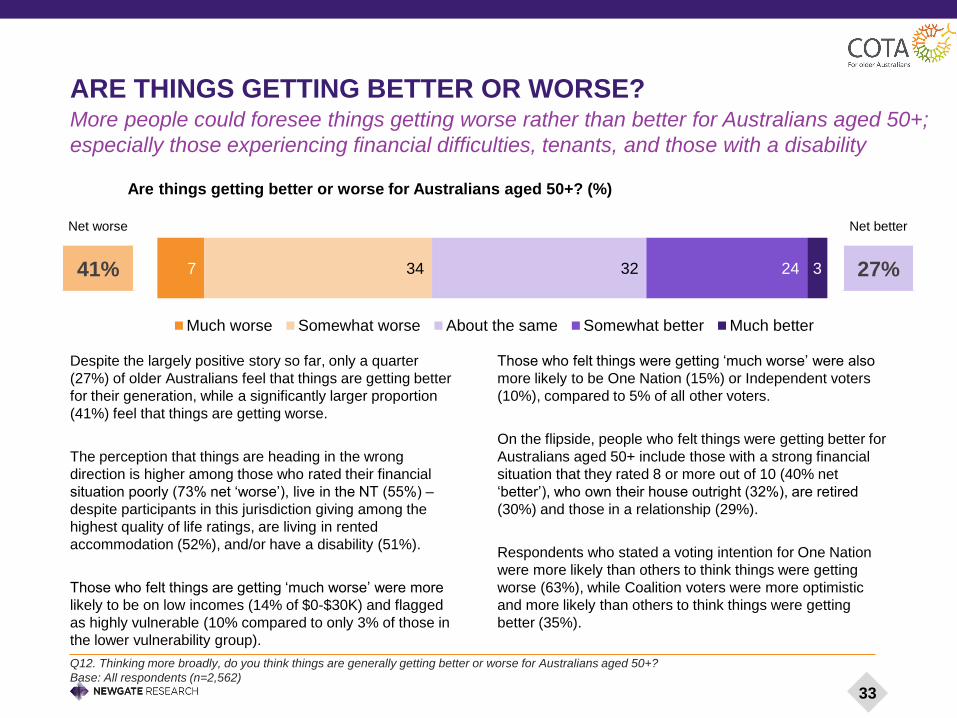
ARE THINGS GETTING BETTER OR WORSE?
7 34 32 24 3
Are things getting better or worse for Australians aged 50+? (%)
Much worse Somewhat worse About the same Somewhat better Much better
Despite the largely positive story so far, only a quarter
(27%) of older Australians feel that things are getting better
for their generation, while a significantly larger proportion
(41%) feel that things are getting worse.
The perception that things are heading in the wrong
direction is higher among those who rated their financial
situation poorly (73% net ‘worse’), live in the NT (55%) –
despite participants in this jurisdiction giving among the
highest quality of life ratings, are living in rented
accommodation (52%), and/or have a disability (51%).
Those who felt things are getting ‘much worse’ were more
likely to be on low incomes (14% of $0-$30K) and flagged
as highly vulnerable (10% compared to only 3% of those in
the lower vulnerability group).
Those who felt things were getting ‘much worse’ were also
more likely to be One Nation (15%) or Independent voters
(10%), compared to 5% of all other voters.
On the flipside, people who felt things were getting better for
Australians aged 50+ include those with a strong financial
situation that they rated 8 or more out of 10 (40% net
‘better’), who own their house outright (32%), are retired
(30%) and those in a relationship (29%).
Respondents who stated a voting intention for One Nation
were more likely than others to think things were getting
worse (63%), while Coalition voters were more optimistic
and more likely than others to think things were getting
better (35%).
More people could foresee things getting worse rather than better for Australians aged 50+;
especially those experiencing financial difficulties, tenants, and those with a disability
Net better
27%
Net worse
41%
33

FEELINGS OF VALUE
Q13. Do you agree or disagree with the following statements?
Base: All respondents (n=2,562)
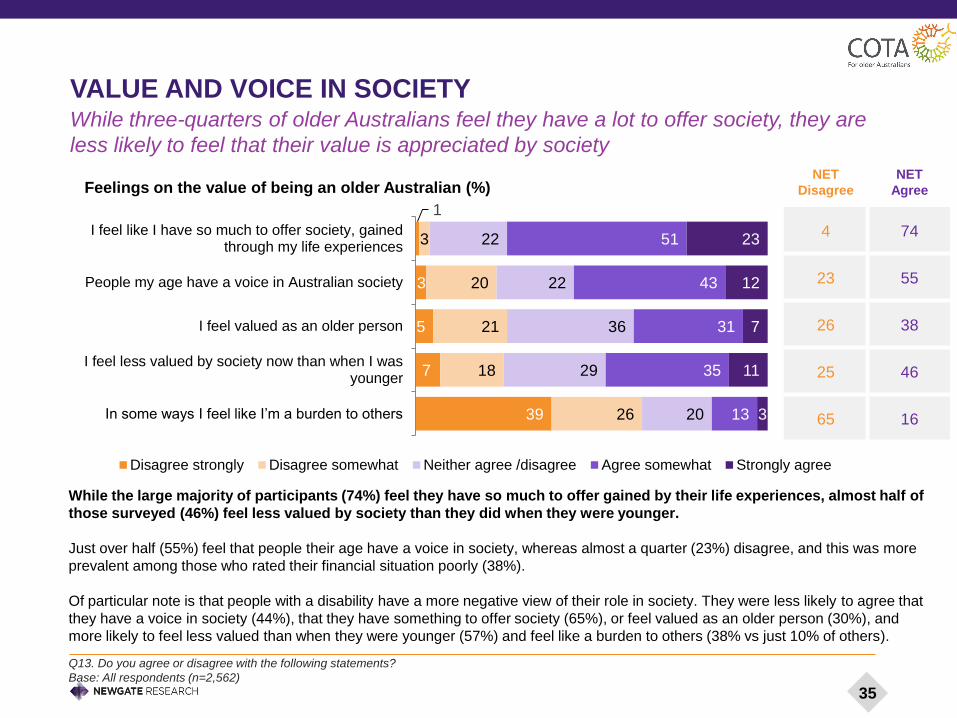
VALUE AND VOICE IN SOCIETY
39
7
5
3
1
26
18
21
20
3
20
29
36
22
22
13
35
31
43
51
3
11
7
12
23
In some ways I feel like I’m a burden to others
I feel less valued by society now than when I wasyounger
I feel valued as an older person
People my age have a voice in Australian society
I feel like I have so much to offer society, gainedthrough my life experiences
Feelings on the value of being an older Australian (%)
Disagree strongly Disagree somewhat Neither agree /disagree Agree somewhat Strongly agree
While the large majority of participants (74%) feel they have so much to offer gained by their life experiences, almost half of
those surveyed (46%) feel less valued by society than they did when they were younger.
Just over half (55%) feel that people their age have a voice in society, whereas almost a quarter (23%) disagree, and this was more
prevalent among those who rated their financial situation poorly (38%).
Of particular note is that people with a disability have a more negative view of their role in society. They were less likely to agree that
they have a voice in society (44%), that they have something to offer society (65%), or feel valued as an older person (30%), and
more likely to feel less valued than when they were younger (57%) and feel like a burden to others (38% vs just 10% of others).
While three-quarters of older Australians feel they have a lot to offer society, they are
less likely to feel that their value is appreciated by society
NET
Disagree
NET
Agree
4 74
23 55
26 38
25 46
65 16
35

Despite many feeling less valued by society than they did as a younger person, most older
Australians do feel valued in some way – especially as a friend, parent or partner
FEELING VALUED (CONT’D)
Q14. Do you feel valued as…? Base: All respondents (n=2,562)
Voting Intention
(NET Hard + Soft)Coalition Labor Greens One Nation
Minor party/
independent
Feel valued as a voter 19% 24% 18% 15% 12%
On average, participants selected four roles in which they feel valued. Notably, with just 19% of older Australians feeling valued
as a voter, this suggests older people need to be considered more and focussed upon in the political process. Those intending to
vote Labor at the next federal election felt the most valued in this way.
6% Don’t feel valued by any other people
I feel valued as …
A friend 72%
A parent 60%
A partner 57%
A grandparent 44%
A person with wisdom to share 39%
A volunteer in the community 26%
A voter 19%
An employee 18%
An ‘elder’ 15%
A carer 12%
An employer 3%
Some other way/s 2%
I don’t feel valued by other people at all 6%
36

DIMENSIONS OF LIFEEmployment
Age discrimination
Financial security and cost of living
Health
Home and aged care
Later life planning and assisted dying
Consumer complaints and rights
Getting around
Housing
EMPLOYMENT

EMPLOYMENT – KEY FINDINGS
10.4Average number of hours per
week spent in unpaid work
29%Working Australians aged 50+
who don’t expect they’ll ever retire
38%are in paid employment
Over half of Australians aged 50+
complete weekly unpaid work (56%).
On average they spend 10+ hours a
week engaging in various types of
unpaid work such as volunteering and
caring for grandchildren, their
parents, partners or other friends or
family members.
People with higher vulnerability and
lower household incomes are more
likely to spend time caring for a
partner than those with lower
vulnerability / higher incomes.
Those who think they’ll never retire are
more likely to:
Have rated their financial situation
poorly at 0-4 out of 10: 45%.
Have no superannuation: 42% vs 26%
of those with superannuation.
38% of older Australians are in paid
employment, with 15% of those over 65
either working full time (3%), part time
(8%) or self-employed (5%).
Those keen to have more hours per week
include people who gave their current
financial situation a poor rating (of 0-4/10),
those with an annual income of under
$30,000, those with children at home and
those with a disability.
28% would like more paid work, with those
in their 50s having the greatest desire for
more (31%).
“I can't afford to retire as my super wouldn’t cover
the years I could survive and live.” 39

RETIREMENT AGESFinancial security is a key driver for when people expect to retire
Q21. What is your current employment status? Base: All respondents (n=2,562)
Q22. At what age did you retire / partially retire from paid employment or self employment? Base: Respondents who are retired (n=1,214)
Q23. At what age, roughly, do you think you will fully retire? Base: Respondents who are employed (n=1,022). NB: Median hours shown here.
5 19
39
68
8492
95 81 61 32 16 8
50-54 55-59 60-64 65-69 70-74 75+
Australians aged 50+ who have retired (%)
Retired (fully/partially) Not retired
61Average retirement age
(Among those already retired)
66Average expected retirement age
(Among those still working)
29%of working Australians aged 50+
don’t think they’ll ever retire
With the age that Australians can access age pension payments
increasing from 65 to 67 over the next 5 years, Australians are working
later in life.
Already we are seeing this shift: those older Australians who have
already retired did so at the median age of 61, whereas those still
working don’t expect to retire until they are 66.
A key driver for remaining in employment seems to be income and
financial security. The table below shows how much later older
Australians on a lower household income expect to retire than those with
a higher income.
Household income Expected age of retirement
$0-$29,999 70
$30k-$59,999 68
$60k-$99,999 67
$100k+ 65
Never retiring is more likely among those who think things are
getting worse at 0-4 out of 10 (45%). Those without
superannuation are more likely to say they’ll never retire (42%
vs 26% of those with super).
40

The preferred average working week is 35 hours – in line with the median average
HOURS IN PAID EMPLOYMENT: UNDEREMPLOYMENT EVIDENT
Q24. In an average week, how many hours do you spend doing work you’re remunerated or paid for? Base: All respondents in paid employment (n=1,022)
Q25. Would you like more or less paid work? Base: All respondents in paid employment (n=1,022). NB: Median hours shown here.
For the 38% of older Australians in paid employment or self
employed, the average (median) working week is 35 hours.
Half of these workers (51%) are happy with the amount of paid
work they have. This group is paid for an average of 35 hours per
week, suggesting this is also the preferred average working
week.
Among those who are not happy with the amount of paid work they
have, there is a slight preference for more work, with 28%
interested in either a little or a lot more, compared with 21%
wanting a little or a lot less. Those wanting more work are paid for
25 hours a week on average, some 10 hours below the overall
preference of 35 hours – or roughly an extra day and a half.
417
47
24
93
22
46
25
5515
57
19
43
25
57
9 516
69
24
01 1
64
35
0
A lot less A little less About the same A little more A lot more
Would you like more or less paid work? (%)
50 to 54 55 to 59 60 to 64 65 to 69 70 to 74 75+
Average time worked
(Median per week)
50-54 55-59 60-64 65-69 70-74 75+
38hrs 38hrs 30hrs 29hrs 18hrs 10hrs
Who would like more work? This was more prevalent
among those who:
• Gave their financial situation a poor rating (of 0-4/10): 56%
• Have an annual income of under $30,000: 48%
• Have one or more higher vulnerability indicators: 43%
• Have children in the household: 43%
• Have a disability: 41%
• Are renting: 35%
• Live in Western Australia: 34%
• Are in their 50s: 31%
41

0% 10% 20% 30% 40%
Volunteer work in the community
Providing childcare forgrandchildren/great grandchildren for
other reasons
Providing childcare forgrandchildren/great grandchildren
while their parents are at work
Caring for your parent/s due to age,illness or disability
Caring for your partner due to age,illness or disability
Caring for any of your children, ofany age, due to illness or disability
Caring for a non-immediate familymember or non-family member
Engage in unpaid work in average week (%)
50 to 54 55 to 59 60 to 64 65 to 69 70 to 74 75+
Three in ten older Australians give up some of their time each week to volunteer, while
many more act as carers
NON-PAID WORK AND RESPONSIBILITIES
Q26. In an average week, how many hours do you spend doing the following?
Base: All respondents (n=2,562)
The majority (56%) of older Australians complete some sort
of unpaid work each week. On average, those engaging in
voluntary work spend 6.2 hours per week doing so.
The most common is completing volunteer work (30%), which
those aged 70-79 were the most likely to be doing (40%).
Providing childcare to grandchildren/great-grandchildren (either
while their parents are at work or for other reasons) was the next
most common type of unpaid work (27%). These people reported
spending a total of 18.8 hours of their time per week providing
this care.Those in their 60s are most likely to provide
childcare for grandchildren (17% so that their parents can
work, and 21% for other reasons).
One in ten (11%) are caring for their parents due to age, illness or
disability, and they spend on average 11.3 hours per week doing
so. This activity is more common among the younger aged group
(50-59, at 18%) and those with a household income over $100k
(17%).
Those who provide care for a partner are more likely to be aged
80+ (21%; more than double the 9% among all older Australians),
have higher vulnerability (13%) and have a low household
income of under $60k (13%). On average, those caring for their
partner spend 34.7 hours per week doing so.
42
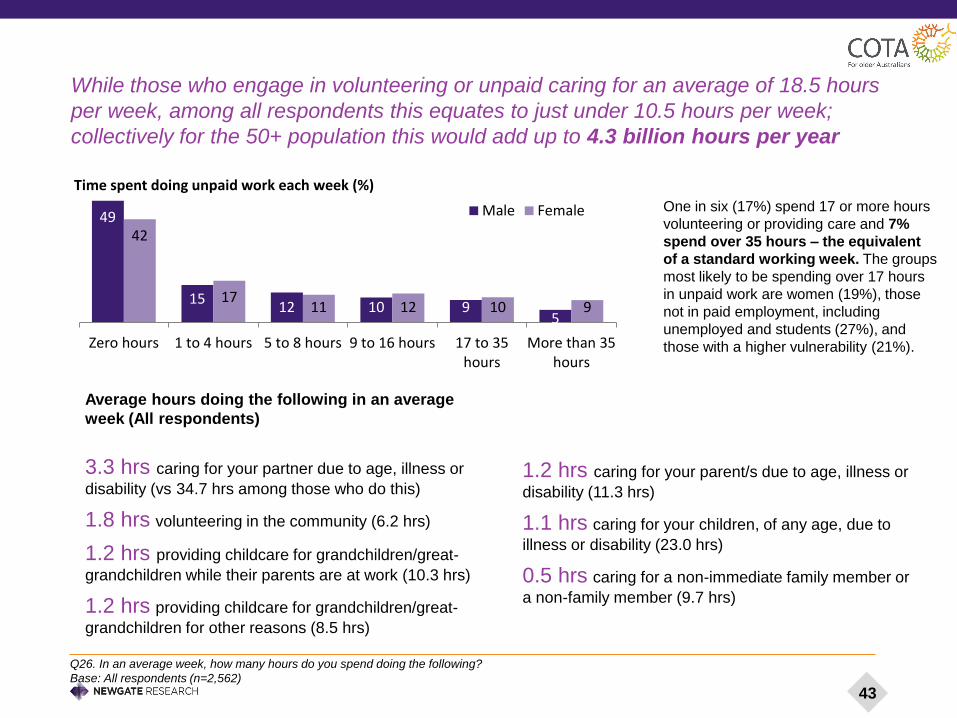
While those who engage in volunteering or unpaid caring for an average of 18.5 hours
per week, among all respondents this equates to just under 10.5 hours per week;
collectively for the 50+ population this would add up to 4.3 billion hours per year
Q26. In an average week, how many hours do you spend doing the following?
Base: All respondents (n=2,562)
Average hours doing the following in an average
week (All respondents)
3.3 hrs caring for your partner due to age, illness or
disability (vs 34.7 hrs among those who do this)
1.8 hrs volunteering in the community (6.2 hrs)
1.2 hrs providing childcare for grandchildren/great-
grandchildren while their parents are at work (10.3 hrs)
1.2 hrs providing childcare for grandchildren/great-
grandchildren for other reasons (8.5 hrs)
1.2 hrs caring for your parent/s due to age, illness or
disability (11.3 hrs)
1.1 hrs caring for your children, of any age, due to
illness or disability (23.0 hrs)
0.5 hrs caring for a non-immediate family member or
a non-family member (9.7 hrs)
One in six (17%) spend 17 or more hours
volunteering or providing care and 7%
spend over 35 hours – the equivalent
of a standard working week. The groups
most likely to be spending over 17 hours
in unpaid work are women (19%), those
not in paid employment, including
unemployed and students (27%), and
those with a higher vulnerability (21%).
49
1512 10 9
5
42
1711 12 10 9
Zero hours 1 to 4 hours 5 to 8 hours 9 to 16 hours 17 to 35hours
More than 35hours
Time spent doing unpaid work each week (%)
Male Female
43

AGE DISCRIMINATION

AGE DISCRIMINATION – KEY FINDINGS
45
22%Have experienced employment-
related age discrimination
33%Have experienced some form of
age discrimination
By age group, those aged 50-59 were most likely to have
experienced age-related employment discrimination (29%),
falling in each ten-year age bracket to just 11% among those
aged 80+. Such discrimination may be growing, or these
results could reflect a recency bias, younger age groups may
be more likely to work than the older generations, or people
may just be more aware of discrimination now.
Only 18% of those discriminated against in their workplace
took any action, but often this was to resign or leave the role.
A fifth (19%) of those who said they had suffered workplace
discrimination were forced to retire. On average this was five
years earlier than they had planned.
The most frequent type of age discrimination was
related to employment – either when already
employed, or when looking for work. One in ten survey
participants had experienced age discrimination in
their workplace and almost two in ten (18%) while
seeking employment – a net total of 22%, noting that
these experiences are not mutually exclusive.
The more vulnerable group identified in this research
was significantly more likely to have experienced
some form of age discrimination (37%), particularly
those with a disability (39%) and those in rental
accommodation (39%).
Q55. Since turning 50, have you experienced a sense of discrimination specifically because of
your age in any of the following situations? Base: All respondents (n=2,562)
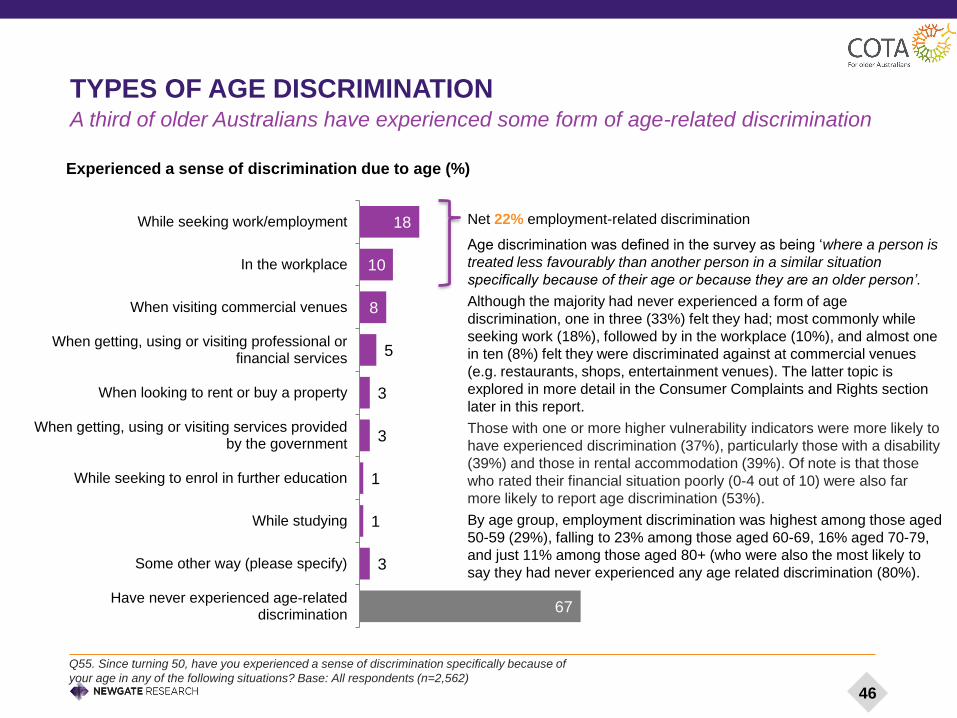
TYPES OF AGE DISCRIMINATIONA third of older Australians have experienced some form of age-related discrimination
18
10
8
5
3
3
1
1
3
67
While seeking work/employment
In the workplace
When visiting commercial venues
When getting, using or visiting professional orfinancial services
When looking to rent or buy a property
When getting, using or visiting services providedby the government
While seeking to enrol in further education
While studying
Some other way (please specify)
Have never experienced age-relateddiscrimination
Experienced a sense of discrimination due to age (%)
Net 22% employment-related discrimination
Age discrimination was defined in the survey as being ‘where a person is
treated less favourably than another person in a similar situation
specifically because of their age or because they are an older person’.
Although the majority had never experienced a form of age
discrimination, one in three (33%) felt they had; most commonly while
seeking work (18%), followed by in the workplace (10%), and almost one
in ten (8%) felt they were discriminated against at commercial venues
(e.g. restaurants, shops, entertainment venues). The latter topic is
explored in more detail in the Consumer Complaints and Rights section
later in this report.
Those with one or more higher vulnerability indicators were more likely to
have experienced discrimination (37%), particularly those with a disability
(39%) and those in rental accommodation (39%). Of note is that those
who rated their financial situation poorly (0-4 out of 10) were also far
more likely to report age discrimination (53%).
By age group, employment discrimination was highest among those aged
50-59 (29%), falling to 23% among those aged 60-69, 16% aged 70-79,
and just 11% among those aged 80+ (who were also the most likely to
say they had never experienced any age related discrimination (80%).
46

32
30
29
21
19
18
16
14
9
7
2
9
Told I was too qualified
I was sidelined, patronised or not treated as…
Refused employment
Told I was too old
Forced to retire/semi-retire before I had planned to
Dismissed or selected for redundancy
I was obliged to take a lesser role than I’m …
Denied access to training / retraining opportunities
Denied a promotion
Forced to cut back on the hours I worked
Denied some other benefit
Other
Type of employment-related age discrimination (%)
Q56. You mentioned you’ve experienced discrimination related to work because of your age. What
did this involve? Base: All respondents who have experienced age discrimination (n=586)
Q57. You mentioned that you were forced to retire/semi-retire before you had planned to. How
much earlier was this? Base: All respondents who were forced to retire earlier than planned due to
discrimination (n=107) NB: Median hours shown here.
TYPES OF EMPLOYMENT-RELATED AGE DISCRIMINATIONThose who had experienced employment-related discrimination were most commonly
told they were too qualified, sidelined or patronised, or refused employment
5 yearsis the average number of years early
those who were forced into early
retirement had retired
When we look in more detail at the 22% of older
Australians who felt discriminated against while
looking for work or at their place of work, we see
that a third (32%) were told they were too qualified,
and similar proportions were treated unfavourably
at their place of work (sidelined, patronised or not
treated as capable) due to their age (30%), or
simply refused employment (29%).
Over a fifth (21%) were told they were ‘too old’,
while just under that number (19%) had been
forced into early retirement or semi-retirement –
this was on average 5 years before they had
planned to, which would represent a reasonably
large amount of foregone wages and
superannuation.
Looking more specifically at the 50-64 age group
(pre-retirement age) vs the 65+ age group, these
figures are even starker. One in four of those aged
between 50 and 64 years say they were
discriminated against when looking for work (vs
11% 65+), while one in three aged 65+ who
experienced work-related discrimination say they
were forced to retire or semi-retire before they had
planned (compared to 13% under 65).
Of those aged 65+ who were forced to retire early,
70% said they had to retire 1-5 years earlier than
planned, while 28% said retirement was forced
more than five years early than planned.
47

Q58. Did you take any action in response to this discrimination? Base: All respondents who have experienced age discrimination (n=586)
Q59. Were you satisfied with the outcome? Base: All respondents who took action against workplace discrimination (n=58)
ACTION TAKENOnly one in ten had taken action, and they were not typically happy with the result
Those who had experienced discrimination within their
workplace were significantly more likely to have taken
action than those seeking employment (18% vs 6%
respectively) – possibly because they had a more obvious
place to start i.e. their employer.
Although a relatively small sample, their actions included:
- Referring it to management or HR;
- Lodging an official complaint/report;
- Contacting their union;
- Speaking to an Anti-Discrimination or Equal Opportunity
Commission; or
- Taking legal action.
However, it was also fairly common to have quit or retired
early due to their treatment.
33
13
Dissatisfied with outcome Satisfied with outcome
Unresolved/Not sure
54% Who took action
against employment-
related discrimination
were not satisfied
with outcome
Only 10% of those who had
experienced employment-related
discrimination took any action
I reported it to the Human Services department but
didn’t get any action because HR and the supervisor
were friends.
I complained and was offered an apology but it triggered
my decision to retire - enough already!
48

FINANCIAL SECURITY & COST OF LIVING
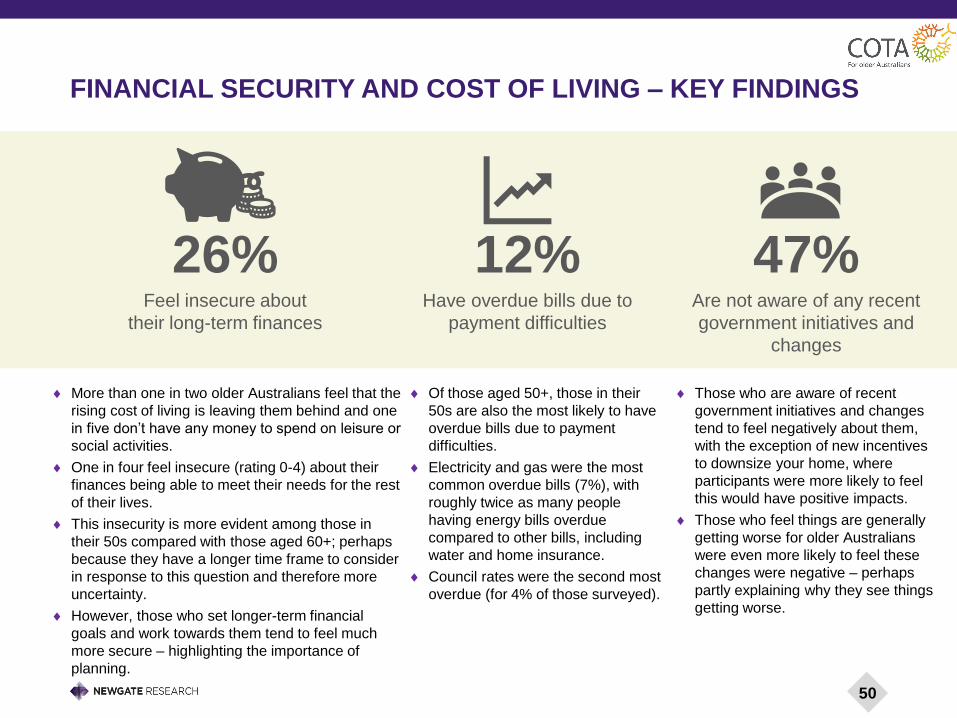
FINANCIAL SECURITY AND COST OF LIVING – KEY FINDINGS
26%Feel insecure about
their long-term finances
12%Have overdue bills due to
payment difficulties
47%Are not aware of any recent
government initiatives and
changes
More than one in two older Australians feel that the
rising cost of living is leaving them behind and one
in five don’t have any money to spend on leisure or
social activities.
One in four feel insecure (rating 0-4) about their
finances being able to meet their needs for the rest
of their lives.
This insecurity is more evident among those in
their 50s compared with those aged 60+; perhaps
because they have a longer time frame to consider
in response to this question and therefore more
uncertainty.
However, those who set longer-term financial
goals and work towards them tend to feel much
more secure – highlighting the importance of
planning.
Of those aged 50+, those in their
50s are also the most likely to have
overdue bills due to payment
difficulties.
Electricity and gas were the most
common overdue bills (7%), with
roughly twice as many people
having energy bills overdue
compared to other bills, including
water and home insurance.
Council rates were the second most
overdue (for 4% of those surveyed).
Those who are aware of recent
government initiatives and changes
tend to feel negatively about them,
with the exception of new incentives
to downsize your home, where
participants were more likely to feel
this would have positive impacts.
Those who feel things are generally
getting worse for older Australians
were even more likely to feel these
changes were negative – perhaps
partly explaining why they see things
getting worse.
50

Older Australians have mixed levels of financial security – just over half feel quite
secure about their finances being able to meet their needs for the rest of their lives
LONG-TERM FINANCIAL SECURITY AND BUDGETING
Base: All respondents (n=2,562)
Q36. A household budget is used to decide what share of your household income will be used for spending, saving or paying bil ls. Does your household
have a budget? Q40. How secure do you feel about your finances (income from all sources and savings) being able to meet your needs throughout the
rest of your life? Scale: 0 = very insecure, 10 = very secure.
When asked how secure they feel about their finances being able to meet their
needs for the rest of their lives, over half of those surveyed (53%) gave quite a
high rating of 7 or more out of 10. However, this leaves quite a large proportion
who don’t feel very secure; 47% gave a 6 or below, including one in four (26%)
who gave just a 0-4. This is in line with the findings outlined earlier where the
top concerns for older Australians are finances and the cost of living.
Financial insecurity is greatest among those: who are renting (45%), on
household incomes of <$30k (43% gave a 0-4), with a disability (38%), singles
(35%), live in regional areas (30%), are in their 50s (33%), are female (29%),
and those with higher vulnerability (35% vs 17% of those less vulnerable).
Further, this insecurity is most evident among those without any of the later life
planning mechanisms in place such as a will, superannuation, a funeral plan
etc. (46% vs 24% of those who had at least one of these).
Comparatively, those in their 70s and 80s were most likely to feel secure about
their finances, with 59% and 69% respectively giving a rating of 7 or more on
this measure, along with residents of the ACT (70%). Those who set longer-
term financial goals and strive to achieve them also provided higher ratings
here (61% vs 36% of those who don’t), highlighting the importance of planning
in having a sense of security.
26 22 33 19
Long term financial security (%)
0-4 (Insecure) 5-6 7-8 9-10 (Very secure)
50% have a household budget to guide their
spending, and this is more common among many
of those who indicated higher levels of financial
insecurity:
• Women (54% vs 46% of men)
• Those who rated their financial situation as a 7
or below (55% vs 45% who rated their situation
at 8 or more)
• Those with a household income of <$30k (56%
vs just 41% of those with income of $100k+)
• People with a disability (56% vs 49% of those
without a disability)
• People who are renting (55% vs 49% of home
owners)
• And generally those in the higher vulnerability
group (55% vs 45% of those less vulnerable)
Net 7+
53%
51

Q35. Do you agree or disagree with the following? Base: All respondents (n=2,562)
COST OF LIVING PERCEPTIONS
25
8
7
8
31
18
15
13
23
26
26
15
18
36
36
42
3
12
16
24
It’s difficult for me to understand financial terminology and concepts
It’s difficult for me to understand the changing rules around retirement income and superannuation
The cost of living is increasing at a rate that is leavingme behind
Once I’ve covered my basic living needs, I have money left over to spend on leisure and social activities
Feelings on financial security, cost of living and knowledge (%)
Disagree strongly Disagree somewhat Neither agree nor disagree Agree somewhat Strongly agree
More than one in two older Australians feel that the rising cost of living is leaving them
behind and one in five don’t have any money to spend on leisure or social activities
NET
Disagree
NET
Agree
20 65
22 53
26 48
56 21
Although the majority of survey participants do have money to spend on leisure and social activities after covering their basic living
needs (65%), for the one in five (20%) who don’t, a degree of social isolation is evident. For example, these people were five times
more likely to rate their social relationships poorly (0-4 out of 10) than those who do have money left over (25% vs 5%).
Women were more likely to disagree that they have money left over to spend on leisure and social activities than men (23% vs
18%), as were younger respondents (24% of 50-59 year olds vs 20% of 60-79 and just 11% of those aged 80+).
Half of older Australians felt that the cost of living is increasing at a rate that is leaving them behind (53%), and this was more
prevalent among women (55% vs 50% of men), people who are renting (71%) and those living with a disability (65%).
Only 21% find it difficult to understand financial terminology and concepts, but around half (48%) find it hard to understand the
changing rules around retirement income and superannuation. Those more likely to have difficulties understanding changing
rules around superannuation include those still in the workforce (54% vs retirees 43%), those in their 50s (56%), and/or residents of
the Northern Territory (63%).
52

Many are unaware of any recent changes, with quite negative sentiment towards most
GOVERNMENT INITIATIVES & CHANGES
Q38. Are you aware of any recent Government changes to any of the following? Base: All respondents (n=2,562)
Q39. What effect do you think these changes will have on the financial outlook of retirement (or on future retirees)? Base: Aware of each item (see chart)
731 34
25 5
47
Newstartunemployment
allowance
AustralianGovernment Aged
Pension
Superannuationrules
Incentives todownsize your home
Investment SharesIndexation
None
Awareness of Government changes (%)
60
60
57
44
15
29
21
21
33
31
7
11
11
12
43
4
8
11
11
10
Investment Shares Indexation (n=132)
Australian Government Aged Pension (n=796)
Superannuation rules (n=931)
Newstart unemployment allowance (n=204)
Incentives to downsize your home (n=669)
Impact perception of Government changes (%)
Negative No change Positive Don't know
Almost half of all participants (47%) were not aware of any recent
changes to the range of government mechanisms shown here.
This was higher among those who rated their sense of financial
security poorly at just 0-4 out of 10 (59% unaware).
For those aware of changes, feelings were largely negative, with
the exception of incentives for downsizing, which 43% felt
positively about. By comparison, more than half felt that changes
in superannuation rules, the aged pension, and the investment
shares indexation would have a negative effect on the financial
outlook for retirees (respectively 57%, 60%, and 60%). Many
(44%) also expected negative impacts from Newstart changes.
Those who feel things are generally getting worse for older
Australians were even more likely to feel these changes were
negative. For example, they were more likely to anticipate
negative impacts from changes to the aged pension (74%), and
superannuation (66%).
These results suggest there would be benefits in promoting the
home downsizing incentives, and better explaining other changes
to improve perceptions, as well as the general outlook for retirees.
53

Older Australians are largely risk averse when it comes to money
FINANCIAL SAVVINESS
Q37. Do you agree or disagree with the following? Base: All respondents (n=2,562)
1
15
32
4
5
36
32
13
11
31
17
28
47
17
17
41
35
1
3
15
Before I buy something I carefully consider whether Ican afford it
I find it more satisfying to spend money than to save itfor the longer term
I am prepared to risk losing some of my own moneywhen making an investment
I set longer term financial goals and strive to achievethem
Do you agree or disagree with the following? (%)
Disagree strongly Disagree somewhat Neither agree nor disagree Agree somewhat Strongly agree
NET
Disagree
NET
Agree
17 56
63 20
51 18
7 82
Notably, while over half (56%) said they set longer term
financial goals and strive to achieve them, those who rated
their financial situation highly (8 or more out of 10) were even
more likely to agree with this (67%), and they were also more
than twice as likely than others to say they were prepared to
risk losing some money in making investments (28% vs 13%
who rated their financial situation below 8 out of 10).
This was even clearer among participants with higher
household incomes of $100k+, with agreement for these two
statements at 73% and 35% respectively, suggesting that
long term planning and a degree of risk taking may have paid
off for them.
Overall, Australians aged 50+ are financially considered and
conservative, with most of the survey participants carefully
considering the affordability of an item before buying it (82% net
agreement). This majority was consistent across the metro/ regional
divide, age, gender, and employment status, though people with low
household incomes (up to $30k) were perhaps understandably most
likely to strongly agree with the statement (47%).
Women are especially risk averse, with 70% not prepared to risk
money to make an investment (vs 56% of men) and 53% saying
they don’t find it more satisfying to spend money than to save it (vs
48% of men).
54

OVERDUE BILLS DUE TO PAYMENT DIFFICULTIES
12%have overdue bills due
to payment difficulties
Top overdue bills…
7% electricity or gas
4% council rates
3% some other unpaid bill/s
3% Internet connections
3% water and sewerage
3% mobile phones
3% home, contents
and/or car insurance
5% weren’t sure if they had any overdue bills
Those who were more likely to have overdue bills due to payment difficulties included:
• Those in their 50s, at 17% vs 11% of those in their 60s and 7% of those aged 70+
• people who are renting (25% vs 9% of home owners)
• Those living with a disability (20%)
• Singles and those who are separated but not divorced (24% and 28% respectively)
• Those with children living in the household (20%).
Notably, 21% of those who had no overdue bills still rated their financial situation quite
low, at 5 or less out of 10, illustrating that overdue bills is just one indicator of financial
stress.
Q41. Does your household currently have any bills from this list that are overdue specifically because you are having difficulty paying them? Base: All
respondents (n=2,562)
55

HEALTH

HEALTHCARE – KEY FINDINGS
57
37%Don’t have any private health
insurance
12%Unable to access at least one
healthcare service, despite wanting to
51%Do less than the recommended
weekly amount of exercise*
While 61% reported some form of private
health insurance, those without are more
likely to be;
o People who are renting (69%)
o Those on an income <$30k/yr (64%)
o Singles (51%)
o People in regional areas (46% do not
have private health insurance) vs
those in capital cities (31%)
o Queenslanders (43%)
o More vulnerable groups (53% vs 22%
of those less vulnerable)
Dental services were the most difficult
to access, with 6% unable to access the
services they wanted to in the last year.
Other services participants were unable
to access included GPs at a medical
centre, non-elective surgery, optical
services and physiotherapy (all 2%).
More vulnerable people were more likely
to have been unable to access the
medical services they needed.
The main barriers to accessing medical
services were the costs of services or
medicines (31%) and long waiting lists
(26%).
Over half say they’re getting no more
than 2 hours a week – below the
recommended 30 minutes of exercise per
day for older adults.
Those getting the least amount of weekly
exercise include those with a disability,
those aged 80+, and those more
vulnerable.
* https://www.healthdirect.gov.au/physical-
activity-guidelines-for-older-adults

Q49. Do you have private health insurance?
Base: All respondents (n=2,562)
PRIVATE HEALTH INSURANCEAlmost two in five Australians aged 50+ don’t have private health insurance
7 7 7 8 9
54
2843
6374
37 64 49 28 15
1 1 1 1 1
Total $0-$30k $30k-$60k $60k-$100k $100k+
Annual Household Income
Have Private Health Insurance? (%)
Yes – Hospital Cover only
Yes – Hospital and General/Ancillary/Extras cover
No, I don’t have private health insurance
Not sure
61% have
some Private
Health
Insurance
cover
Older Australians on a low household income (<$30k) are over 4 times less likely to have Private Health Insurance cover
than those with a household income of over $100k (64% compared to 15%).
58
Those more likely to have Private Health Insurance:
• Live in the ACT – 82%
• High financial security (7-10) – 75%
• Live in NT – 73%
• Live in WA – 70%
• In paid employment – 68%
• Men – 64%
• Aged 70 to 79 – 67%
• Retired – 64%
Those more likely not to have Private Health Insurance:
• Have a disability – 60%
• Low financial security – 58%
• Unemployed/not in paid employment/student – 53%
• Have higher vulnerability – 53%
• Women – 39%
• Live in QLD – 43%
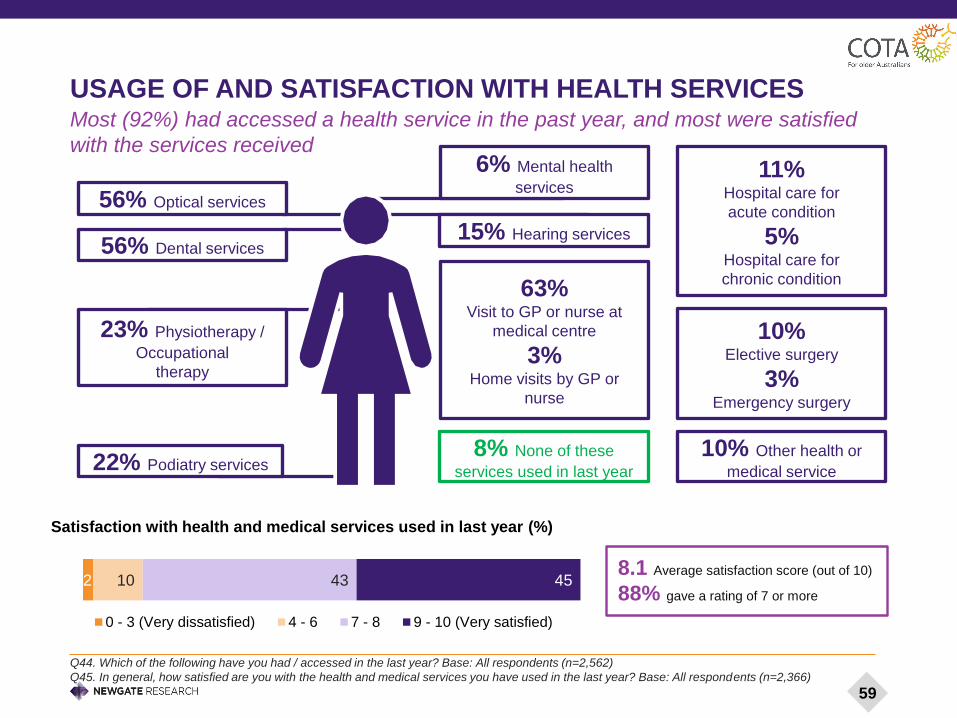
USAGE OF AND SATISFACTION WITH HEALTH SERVICESMost (92%) had accessed a health service in the past year, and most were satisfied
with the services received6% Mental health
services
15% Hearing services
10% Elective surgery
3% Emergency surgery
22% Podiatry services
23% Physiotherapy /
Occupational
therapy
56% Optical services
56% Dental services
63% Visit to GP or nurse at
medical centre
3% Home visits by GP or
nurse
10% Other health or
medical service
11% Hospital care for
acute condition
5% Hospital care for
chronic condition
8% None of these
services used in last year
Q44. Which of the following have you had / accessed in the last year? Base: All respondents (n=2,562)
Q45. In general, how satisfied are you with the health and medical services you have used in the last year? Base: All respondents (n=2,366)
2 10 43 45
Satisfaction with health and medical services used in last year (%)
0 - 3 (Very dissatisfied) 4 - 6 7 - 8 9 - 10 (Very satisfied)
8.1 Average satisfaction score (out of 10)
88% gave a rating of 7 or more
59
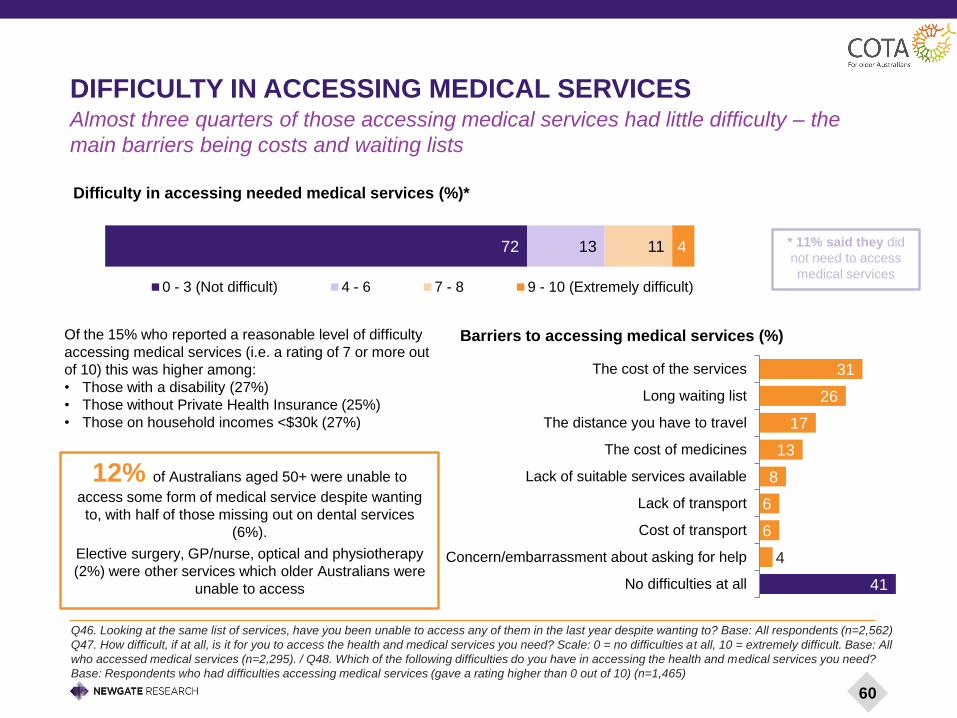
31
26
17
13
8
6
6
4
41
The cost of the services
Long waiting list
The distance you have to travel
The cost of medicines
Lack of suitable services available
Lack of transport
Cost of transport
Concern/embarrassment about asking for help
No difficulties at all
Barriers to accessing medical services (%)
DIFFICULTY IN ACCESSING MEDICAL SERVICESAlmost three quarters of those accessing medical services had little difficulty – the
main barriers being costs and waiting lists
72 13 11 4
Difficulty in accessing needed medical services (%)*
0 - 3 (Not difficult) 4 - 6 7 - 8 9 - 10 (Extremely difficult)
12% of Australians aged 50+ were unable to
access some form of medical service despite wanting
to, with half of those missing out on dental services
(6%).
Elective surgery, GP/nurse, optical and physiotherapy
(2%) were other services which older Australians were
unable to access
Q46. Looking at the same list of services, have you been unable to access any of them in the last year despite wanting to? Base: All respondents (n=2,562)
Q47. How difficult, if at all, is it for you to access the health and medical services you need? Scale: 0 = no difficulties at all, 10 = extremely difficult. Base: All
who accessed medical services (n=2,295). / Q48. Which of the following difficulties do you have in accessing the health and medical services you need?
Base: Respondents who had difficulties accessing medical services (gave a rating higher than 0 out of 10) (n=1,465)
* 11% said they did
not need to access
medical services
Of the 15% who reported a reasonable level of difficulty
accessing medical services (i.e. a rating of 7 or more out
of 10) this was higher among:
• Those with a disability (27%)
• Those without Private Health Insurance (25%)
• Those on household incomes <$30k (27%)
60

Q42. How much time do you spend exercising each week on average (this includes going for a walk and swimming)? Base: All respondents (n=2,562)
Q43. How would you rate your diet at the moment, in terms of how healthy it is? Scale: 0 = very unhealthy, 10 = very healthy. Base: All respondents
(n=2,562)
EXERCISE, DIET AND HEALTH
Survey participants reported mixed levels of activity. The recommended amount of exercise is at least 30 minutes of moderate
intensity physical activity on most if not all days – well above the amount more than half of those surveyed said they’re getting, with
51% reporting no more than two hours a week and 35% getting less than an hour. Over 80s are the least active, with 61% getting no
more than two hours per week and 44% less than an hour. Others reporting more sedentary lifestyles with less than an hour of
exercise per week were: people who are renting (47%), those without private health insurance (45%), those with a disability (51%),
and those with household incomes of <$30k per annum (44%).
Around half report at least two hours a week, while a significant one in four (24%) said they do at least five hours. Those reporting
higher levels of activity included respondents living in the ACT (65% do 2+ hours per week vs 49% in other states/territories), men
(52% vs 46% of women), those with high financial security (59%) and retirees (52%).
More than a third of older Australians get less than an hour of exercise a week
9 20 50 22
Diet rating (%)
0 - 4 (Unhealthy) 5 - 6 7 - 8 9 - 10 (Very healthy)
13 13 10 16 25 24
Amount of weekly exercise (%)
None Up to 30 mins 31 - 59 mins 1 - 2 hours 2 - 5 hours >5 hours
The majority believe their diet is pretty healthy, with half rating it as 7-8 out of 10 and a further 22% rating it 9-10 (net 72% or 7.1 on
average). Meanwhile one in ten (9%) rated their diet at an unhealthy 0-4. This was significantly higher among those who are: aged 50-
59 (13%, falling to just 3% of those aged 70+), renting (16%), unemployed/studying (16%), living with a disability (15%), or have
children under 17 in the household (14%), single (12%), or on a household income of <$30k per annum (14% - around double those
on higher incomes).
49% complete 2+ hours exercise / wk
7.1 Average rating of diet (out of 10)
61
HOME AND AGED CARE

A fifth of people aged 50+ wanting to access aged care services experienced difficulties
EASE OF ACCESSING SERVICES
Q52. Which of the following have you wanted to access for yourself or a family member in the last year but couldn’t? Base: All respondents (n=2,562)
Q53. How difficult, if at all, is it for you to access the aged care services you need? Scale: 0 = no difficulties at all, 10 = extremely difficult. Base: All
respondents (n=2,562), charted re-based to those who had tried to access services (n=710). / Q54. Which of the following difficulties do you have in
accessing the aged care services you need? Base: All respondents who had difficulty (1-10) accessing aged care services (n=481)
Of the 20% who had difficulties in accessing
aged care services, the top 3 difficulties were:
24% The cost of services
19% Long waiting lists
16% Lack of suitable services available
60 20 13 7
Difficulty in accessing aged care services for self or family member (%)*
0 - 3 (Not difficult) 4 - 6 7 - 8 9 - 10 (Extremely difficult)
* 71% had not tried to access aged care services at all. Chart based on those who did.
Wanted to access the following services in the last
year for themselves or a family member but couldn’t:
8% Home-based care/support services
6% Community-based care services
3% Residential aged care
3% Respite care
63

6
1
9
0
1
3
4
79
My spouse/partner acts as my carer
Another family member acts as mycarer
Home care / community care servicesfrom an external provider
Residential aged care
Respite care
Other
None – though I do feel I need some home care/support
None – I live independently without needing care or support
Aged 65+ and received the following types of home care or support services (%)
In the last year, most survey participants aged 65+ didn’t need or receive home care
services or support, but those who did were largely satisfied
USAGE AND SATISFACTION WITH HOME CARE SERVICES
Of the 9% of Australians aged 65+ who had
received home or community care from
external services in the last year, around half
(55%) were completely satisfied with those
services (rated 9-10).
A further 36% gave a satisfaction rating of 7
or 8 – equating to most being at least
somewhat satisfied (88% gave a 7 or higher).
Just 12% gave a satisfaction rating of 6 or
below.
Note, the sampling method and online survey
approach did not yield sufficient numbers of
people receiving home care, residential aged
care or respite care to understand
satisfaction with these services.
Q50. In the last year, have you received any of the following types of home care or support services? Base: Aged 65+ (n=1,134)
Q51. In general, how satisfied are you with the [service] you have used in the last year? Scale: 0 = completely dissatisfied, 10 = completely satisfied.
Base: Respondents who received home care/community care services from an external provider and are 65+ years of age (n=94)
Ex
tern
al c
are
se
rvic
e –
12
%
No
ho
me
ca
re/s
up
po
rt
req
uir
ed
–8
3%
Fa
mil
y p
rovid
es
ho
me c
are
–7
%
64

HOUSING
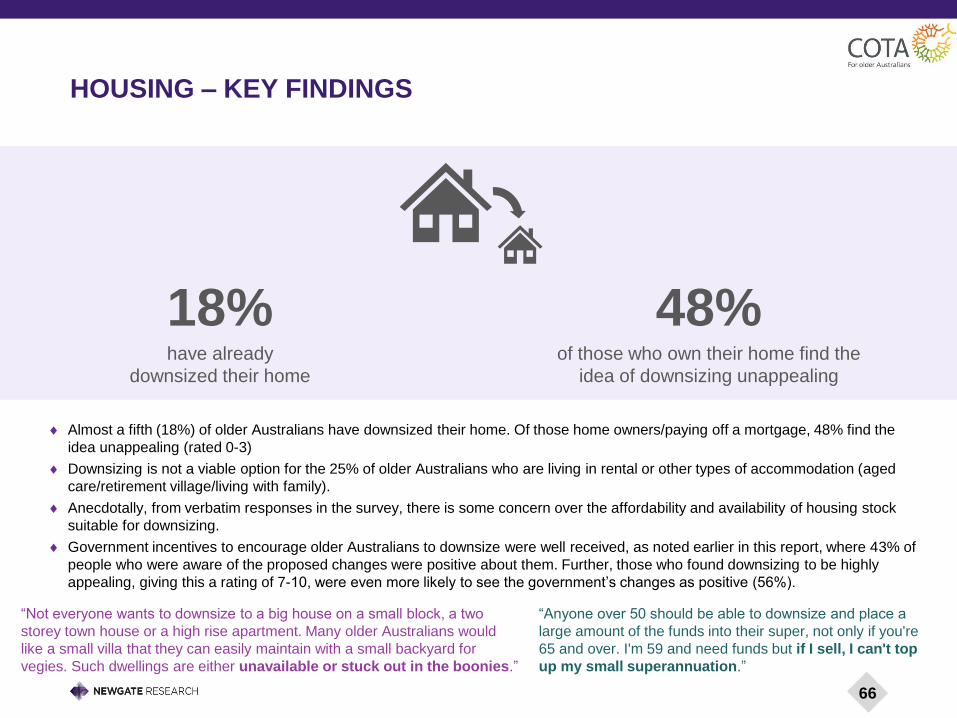
HOUSING – KEY FINDINGS
66
18%have already
downsized their home
48%of those who own their home find the
idea of downsizing unappealing
Almost a fifth (18%) of older Australians have downsized their home. Of those home owners/paying off a mortgage, 48% find the
idea unappealing (rated 0-3)
Downsizing is not a viable option for the 25% of older Australians who are living in rental or other types of accommodation (aged
care/retirement village/living with family).
Anecdotally, from verbatim responses in the survey, there is some concern over the affordability and availability of housing stock
suitable for downsizing.
Government incentives to encourage older Australians to downsize were well received, as noted earlier in this report, where 43% of
people who were aware of the proposed changes were positive about them. Further, those who found downsizing to be highly
appealing, giving this a rating of 7-10, were even more likely to see the government’s changes as positive (56%).
“Anyone over 50 should be able to downsize and place a
large amount of the funds into their super, not only if you're
65 and over. I'm 59 and need funds but if I sell, I can't top
up my small superannuation.”
“Not everyone wants to downsize to a big house on a small block, a two
storey town house or a high rise apartment. Many older Australians would
like a small villa that they can easily maintain with a small backyard for
vegies. Such dwellings are either unavailable or stuck out in the boonies.”

The idea of downsizing is of limited appeal to older Australians
HOME OWNERSHIP AND DOWNSIZING
67
Survey participants were most likely to own their home
outright (55%), similar to ABS figures. This increases
with age – at 37% for those in their 50s, rising to 72%
of those aged 70+.
18% of older Australians have already downsized their home
51% of those living in a flat or apartment and 37% of those in a
semi-detached/terraced house had already downsized
Own the home
outright55%
Paying off a
mortgage20%
Renting (or paying board)19%
Other6%
Home ownership (%)
48 21 18 13
How appealing to you is the idea of downsizing to a smaller home in the next five years? (%)
0-3 (Not appealing) 4-6 7-8 9-10 (Extremely appealing)
Q15. Which of the following best describes the home you live in? Base: All (n=2,562)
Q20. “Downsizing” generally means selling the family home in favour of a smaller house, or even an apartment. How appealing to you is the idea of downsizing
to a smaller home in the next five years? Scale: 0 = not at all, 10 = extremely. Base: Respondents who own home or are paying a mortgage (n=1,984)
For those who own outright or are paying off a mortgage and haven’t yet
downsized, there is a lack of attraction to the idea, with almost half (48%)
rating the appeal of downsizing as a 3 or below out of 10, while just a
quarter (25%) gave this a rating of 7 or more.
Downsizing appeals least to those in smaller houses/apartment/residences
(60% rated 0-3) and to those already retired (51%), while there were no
standout groups for whom this held a high level of appeal.
Of our sample, 2% were living in a retirement village/resort and
less than 1% were in an aged care residence.

Q17. How affordable are your current living arrangements? Scale: 0 = not at all affordable, 10 = completely affordable. Base: All respondents (n=2,562)
Q18. How secure do you feel in your current living arrangements? Scale: 0 = not at all secure, 10 = completely secure. Base: All respondents (n=2,562))
Q19. How comfortable do you feel living in the area where you live? Scale: 0 = not at all comfortable, 10 = completely secure. Base: All respondents (n=2,562)
CURRENT LIVING ARRANGEMENTS
6
4
2
20
13
9
35
33
31
39
50
57
How affordable areyour current living
arrangements?
How secure do you feelin your current living
arrangements?
How comfortable doyou feel living in the
area where you live?
Ratings of current living arrangements (%)
0 - 3 4 - 6 7 - 8 9 - 10
The majority of older Australians surveyed are
content with their home and living arrangements,
with around half rating the comfort and security
very highly (with 57% and 50% respectively giving
ratings of 9 or 10 out of 10) and only 2% giving a
very low (0-3) score.
There is more variation in affordability and while
39% rated this aspect very highly at 9-10, a
quarter (25%) gave a relatively low rating of 0-6.
Residents in Tasmania were more likely to rate
the affordability and security of their living
arrangements highly (50% giving rating of 9-10 for
affordability and 62% for security).
Over 70s and those with a high household income
(more than $100k) were more likely to give higher
scores to all three aspects of their living
conditions.
On the other side, those in their 50s and more
vulnerable people were more likely to give ratings
of 0-6 for all of these measures.
Widespread contentment with living conditions, though affordability is an issue for
more vulnerable older Australians
68
LATER LIFE PLANNING
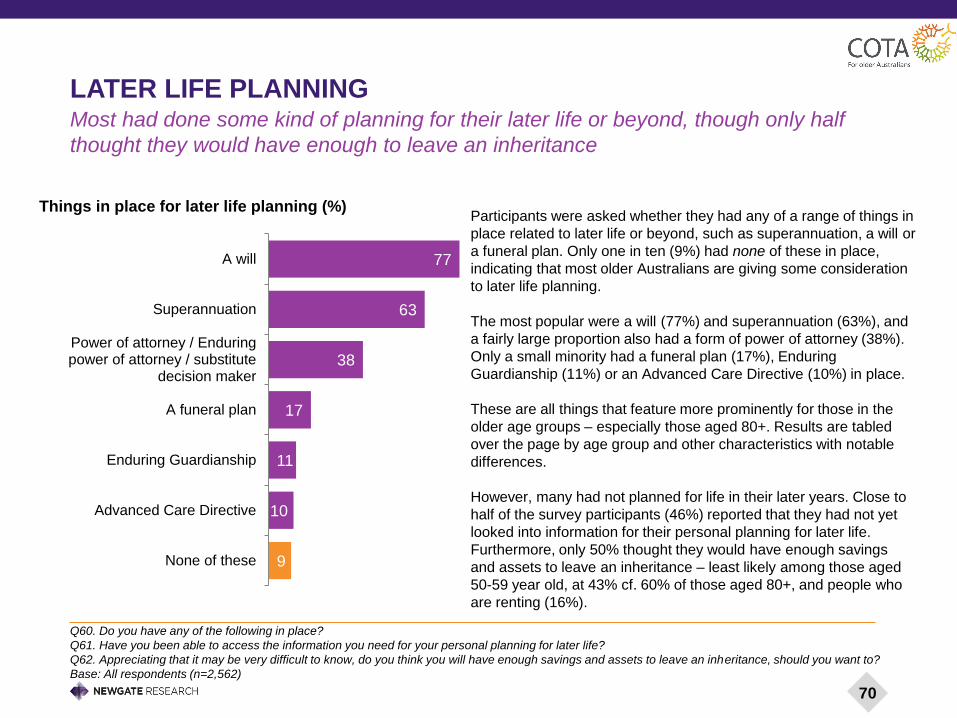
Q60. Do you have any of the following in place?
Q61. Have you been able to access the information you need for your personal planning for later life?
Q62. Appreciating that it may be very difficult to know, do you think you will have enough savings and assets to leave an inheritance, should you want to?
Base: All respondents (n=2,562)
LATER LIFE PLANNING
Participants were asked whether they had any of a range of things in
place related to later life or beyond, such as superannuation, a will or
a funeral plan. Only one in ten (9%) had none of these in place,
indicating that most older Australians are giving some consideration
to later life planning.
The most popular were a will (77%) and superannuation (63%), and
a fairly large proportion also had a form of power of attorney (38%).
Only a small minority had a funeral plan (17%), Enduring
Guardianship (11%) or an Advanced Care Directive (10%) in place.
These are all things that feature more prominently for those in the
older age groups – especially those aged 80+. Results are tabled
over the page by age group and other characteristics with notable
differences.
However, many had not planned for life in their later years. Close to
half of the survey participants (46%) reported that they had not yet
looked into information for their personal planning for later life.
Furthermore, only 50% thought they would have enough savings
and assets to leave an inheritance – least likely among those aged
50-59 year old, at 43% cf. 60% of those aged 80+, and people who
are renting (16%).
Most had done some kind of planning for their later life or beyond, though only half
thought they would have enough to leave an inheritance
77
63
38
17
11
10
9
A will
Superannuation
Power of attorney / Enduringpower of attorney / substitute
decision maker
A funeral plan
Enduring Guardianship
Advanced Care Directive
None of these
Things in place for later life planning (%)
70
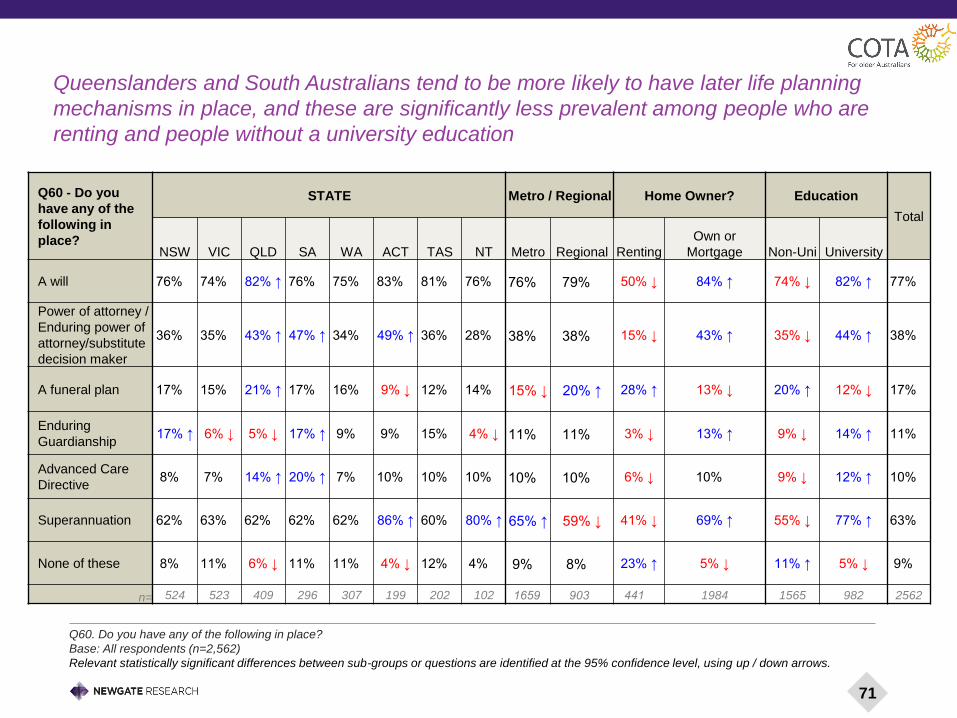
Queenslanders and South Australians tend to be more likely to have later life planning
mechanisms in place, and these are significantly less prevalent among people who are
renting and people without a university education
71
Q60 - Do you
have any of the
following in
place?
STATE Metro / Regional Home Owner? Education
Total
NSW VIC QLD SA WA ACT TAS NT Metro Regional Renting
Own or
Mortgage Non-Uni University
A will 76% 74% 82% ↑ 76% 75% 83% 81% 76% 76% 79% 50% ↓ 84% ↑ 74% ↓ 82% ↑ 77%
Power of attorney /
Enduring power of
attorney/substitute
decision maker
36% 35% 43% ↑ 47% ↑ 34% 49% ↑ 36% 28% 38% 38% 15% ↓ 43% ↑ 35% ↓ 44% ↑ 38%
A funeral plan 17% 15% 21% ↑ 17% 16% 9% ↓ 12% 14% 15% ↓ 20% ↑ 28% ↑ 13% ↓ 20% ↑ 12% ↓ 17%
Enduring
Guardianship17% ↑ 6% ↓ 5% ↓ 17% ↑ 9% 9% 15% 4% ↓ 11% 11% 3% ↓ 13% ↑ 9% ↓ 14% ↑ 11%
Advanced Care
Directive8% 7% 14% ↑ 20% ↑ 7% 10% 10% 10% 10% 10% 6% ↓ 10% 9% ↓ 12% ↑ 10%
Superannuation 62% 63% 62% 62% 62% 86% ↑ 60% 80% ↑ 65% ↑ 59% ↓ 41% ↓ 69% ↑ 55% ↓ 77% ↑ 63%
None of these 8% 11% 6% ↓ 11% 11% 4% ↓ 12% 4% 9% 8% 23% ↑ 5% ↓ 11% ↑ 5% ↓ 9%
n= 524 523 409 296 307 199 202 102 1659 903 441 1984 1565 982 2562
Q60. Do you have any of the following in place?
Base: All respondents (n=2,562)
Relevant statistically significant differences between sub-groups or questions are identified at the 95% confidence level, using up / down arrows.
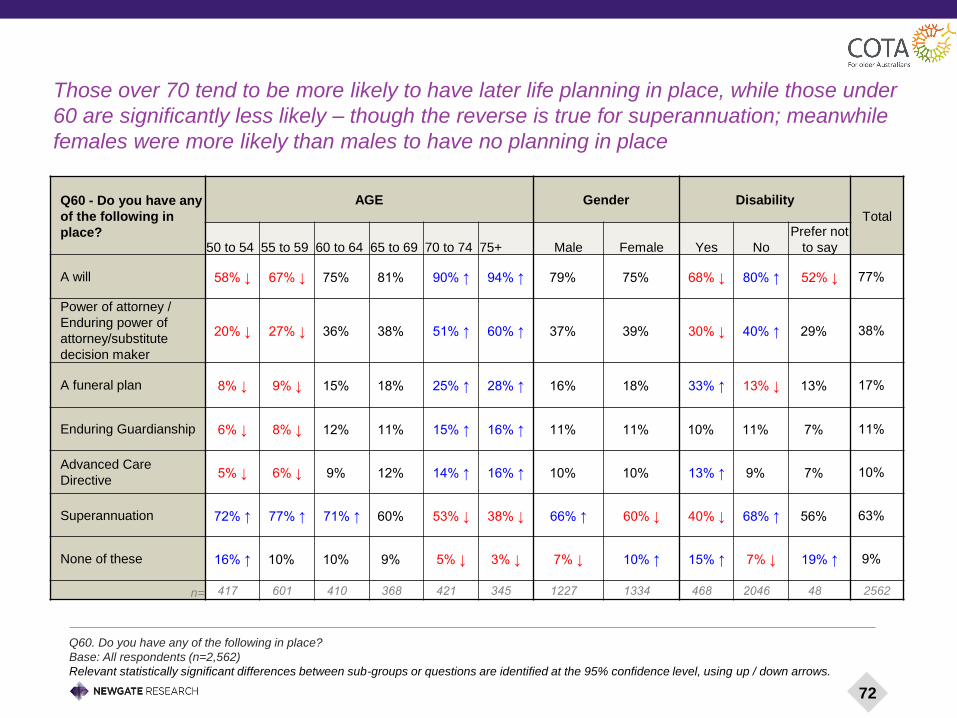
Those over 70 tend to be more likely to have later life planning in place, while those under
60 are significantly less likely – though the reverse is true for superannuation; meanwhile
females were more likely than males to have no planning in place
72
Q60 - Do you have any
of the following in
place?
AGE Gender Disability
Total
50 to 54 55 to 59 60 to 64 65 to 69 70 to 74 75+ Male Female Yes No
Prefer not
to say
A will 58% ↓ 67% ↓ 75% 81% 90% ↑ 94% ↑ 79% 75% 68% ↓ 80% ↑ 52% ↓ 77%
Power of attorney /
Enduring power of
attorney/substitute
decision maker
20% ↓ 27% ↓ 36% 38% 51% ↑ 60% ↑ 37% 39% 30% ↓ 40% ↑ 29% 38%
A funeral plan 8% ↓ 9% ↓ 15% 18% 25% ↑ 28% ↑ 16% 18% 33% ↑ 13% ↓ 13% 17%
Enduring Guardianship 6% ↓ 8% ↓ 12% 11% 15% ↑ 16% ↑ 11% 11% 10% 11% 7% 11%
Advanced Care
Directive5% ↓ 6% ↓ 9% 12% 14% ↑ 16% ↑ 10% 10% 13% ↑ 9% 7% 10%
Superannuation 72% ↑ 77% ↑ 71% ↑ 60% 53% ↓ 38% ↓ 66% ↑ 60% ↓ 40% ↓ 68% ↑ 56% 63%
None of these 16% ↑ 10% 10% 9% 5% ↓ 3% ↓ 7% ↓ 10% ↑ 15% ↑ 7% ↓ 19% ↑ 9%
n= 417 601 410 368 421 345 1227 1334 468 2046 48 2562
Q60. Do you have any of the following in place?
Base: All respondents (n=2,562)
Relevant statistically significant differences between sub-groups or questions are identified at the 95% confidence level, using up / down arrows.
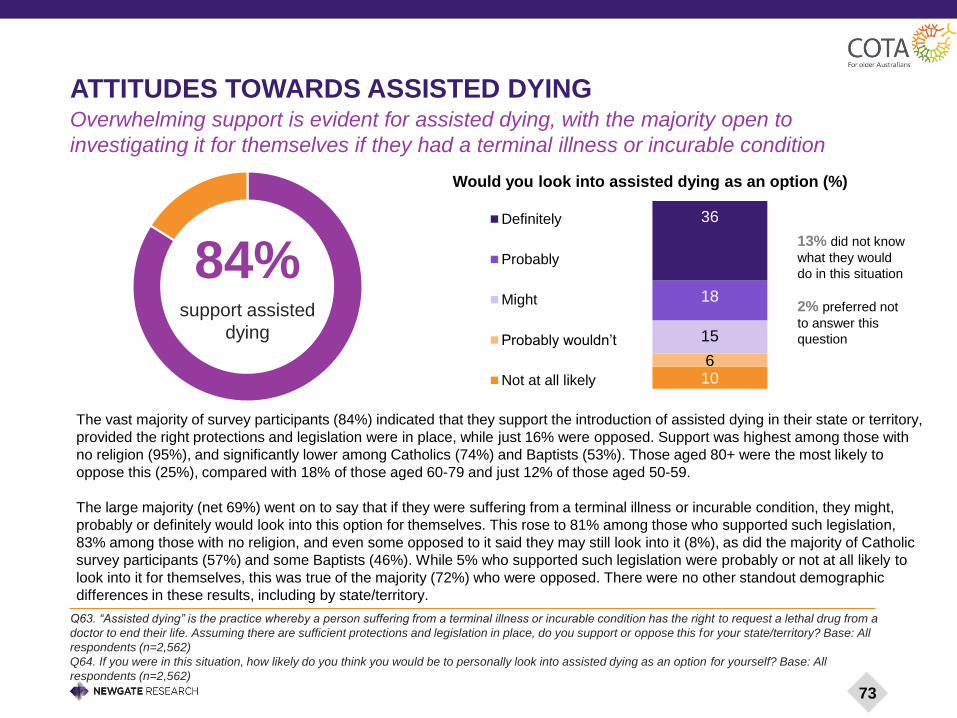
106
15
18
36
Would you look into assisted dying as an option (%)
Definitely
Probably
Might
Probably wouldn’t
Not at all likely
Q63. “Assisted dying” is the practice whereby a person suffering from a terminal illness or incurable condition has the right to request a lethal drug from a
doctor to end their life. Assuming there are sufficient protections and legislation in place, do you support or oppose this for your state/territory? Base: All
respondents (n=2,562)
Q64. If you were in this situation, how likely do you think you would be to personally look into assisted dying as an option for yourself? Base: All
respondents (n=2,562)
ATTITUDES TOWARDS ASSISTED DYING
The vast majority of survey participants (84%) indicated that they support the introduction of assisted dying in their state or territory,
provided the right protections and legislation were in place, while just 16% were opposed. Support was highest among those with
no religion (95%), and significantly lower among Catholics (74%) and Baptists (53%). Those aged 80+ were the most likely to
oppose this (25%), compared with 18% of those aged 60-79 and just 12% of those aged 50-59.
The large majority (net 69%) went on to say that if they were suffering from a terminal illness or incurable condition, they might,
probably or definitely would look into this option for themselves. This rose to 81% among those who supported such legislation,
83% among those with no religion, and even some opposed to it said they may still look into it (8%), as did the majority of Catholic
survey participants (57%) and some Baptists (46%). While 5% who supported such legislation were probably or not at all likely to
look into it for themselves, this was true of the majority (72%) who were opposed. There were no other standout demographic
differences in these results, including by state/territory.
Overwhelming support is evident for assisted dying, with the majority open to
investigating it for themselves if they had a terminal illness or incurable condition
84%support assisted
dying
13% did not know
what they would
do in this situation
2% preferred not
to answer this
question
73
CONSUMER COMPLAINTS & RIGHTS

CONFIDENCE IN MAKING COMPLAINTS
14
3
9
6
77
91
Online shopping
In person shopping
Confidence in lodging a complaint or reporting a problem when shopping (%)
Not sure No, don't feel confident Yes, feel confident
Most older Australians (91%) are confident in
lodging a complaint or reporting a problem when
shopping in-store, and only 6% saying they are
not confident.
There was less confidence in complaining about
issues when shopping online – three quarters
(77%) felt confident, but almost one in 10 (9%)
did not and a further 14% were unsure. This may
be worth further investigation, as it could indicate
that this cohort is not shopping online that much,
or they may not have run into issues, or it could
be linked to the recency of the online shopping
era.
The large majority are confident to lodge complaints or report problems when shopping,
but less so online than in-person
Q27. Do you feel confident to lodge a complaint or report any problems that may arise when shopping for products or services either online or in person?
Online shopping Base: All respondents (n=2,562)
Q33. Do you feel you know enough about your rights as a consumer, for example, regarding unfair contracts or selling practices, misleading offers,
product guarantees, safety guarantees, for...? Online shopping Base: All respondents (n=2,562)
Those who do not feel confident in
lodging complaints when shopping
in-person are more likely to have a
low household income (11%), and/or
to be from the vulnerable cohort
identified earlier (7%).
These same cohorts were also less
likely to feel confident when
shopping online than other groups
(low household income 15%,
vulnerable 12%)
Interestingly, the 50-59 year old
age group was also significantly
less likely to feel confident lodging
complaints in person (87%), while
the 70-79 year old group was the
most confident (95%).
With online shopping there were
no notable differences by age, nor
by gender or location for either of
these two shopping mediums.
75

KNOWLEDGE OF CONSUMER RIGHTS
Exactly three-quarters (75%) were confident of their consumer rights when shopping in person, though 15% were not. However,
when it comes to online shopping just over half (54%) feel confident, more than a quarter (27%) do not feel confident and a fifth
(20%) weren’t sure. This suggests that older Australians would benefit from an increased understanding of their consumer rights to
avoid being taken advantage of when shopping online in particular. In turn this would be likely to build their confidence to make
complaints and report problems.
Concerningly, those who rated their financial situation as poor (0-4) were significantly more likely than others to say they didn’t know
enough about their rights when it came to in-person shopping (24%) and online shopping (35%). While there were no age or gender
differences for online shopping in this regard, when it comes to in-person shopping males were more likely than females to feel
confident (78%), while females were more likely than males to feel unsure (12%). As with making complaints, the younger group
(50-59) was the most likely to lack confidence in their rights when shopping in person (20%).
While there was a reasonable level of understanding of consumer rights when shopping
in person, a large proportion were not confident about their rights online
20
10
27
15
54
75
Online shopping
In person shopping
Confidence in knowledge about rights as a consumer (%)
Not sure No, don't feel confident Yes, feel confident
Q33. Do you feel you know enough about your rights as a consumer, for example, regarding unfair contracts or selling practices, misleading offers, product
guarantees, safety guarantees, for...? Online shopping Base: All respondents (n=2,562)
76

66
5
Had bad experience Not had bad experience Not sure
Three in ten had a bad experience when shopping in the last 12 months, and most of
those had sought some assistance
DEALING WITH ISSUES AND COMPLAINTS
29%have had bad
experiences in
purchasing any goods or
services over the past 12
months
Of the 29% who had a bad experience purchasing any
goods or services in the last year, 25% didn’t seek
assistance to raise, report or resolve the issue. Most
chose to deal with the issue themselves.
Meanwhile the large majority (74%) did seek assistance
to raise, report or resolve the issue, with the majority
(92%) contacting the company where the product/service
came from.
While most (70%) were satisfied with how the issue was
resolved, 27% were either not satisfied (15%), or had not
yet had the issue resolved (13%).
Q28. Have you had any bad experiences in purchasing any goods or services over the past 12 months? Base: All respondents (n=2,562)
Q29. Did you seek assistance to raise, report or resolve the issue? Base: Respondents who had had bad experiences in purchasing goods and services
over the past 12 months (n=766)
Q30. What did you do to raise, report or resolve the issue? Base: Respondents who had sought assistance to raise, report or resolve the issue (n=568)
Q31. Were you satisfied with how the issue was resolved? Base: Respondents who had sought assistance to raise, report or resolve the issue (n=568)
Q32. Why did you not seek assistance to raise, report or resolve the issue? Base: Respondents who had not sought assistance to raise, report or resolve
the issue (n=188)
77

56
20
As a consumer, do you feel like you are treated differently than when you were younger? (%)
Yes No Not sure
24%feel that they are treated
differently as a consumer
than when they were
younger
A quarter of older consumers feel their age is a factor in the service they receive – and
for most this is in a negative way
EXPERIENCE AS A CONSUMER
Q34. As an older consumer (i.e. aged 50+) do you feel you are treated differently than you were when you were younger? If so, how?
Base: All respondents (n=2,562)
For the quarter of older consumers who felt they were
treated differently now than when they were younger, this
was mostly in a negative way – they felt ignored by sales
staff in favour of younger customers, and technology and
fashion were singled out as particular areas where they felt
they were treated differently.
Over half (56%) did not feel they were treated differently,
while 20% weren’t sure.
Females were significantly more likely than males to feel
they were being treated differently (27% vs 21%), as were
people with a disability (31%).
Those who had earlier rated themselves as being in a
strong financial position were much more likely to not feel
they were treated differently (62%) – perhaps suggesting
that some customer service staff are giving better service to
people who seem to be in a better position to pay.
78

IN THEIR OWN WORDS: EXPERIENCE AS A CONSUMER
Q34. As an older consumer (i.e. aged 50+) do you feel you are treated differently than you were when you were younger? If so, how?
Base: All respondents (n=2,562)
I can walk around a shop and
be ignored.
Some people try to rip off older
customers.
Sales staff are not as interested
in serving in many areas,
especially technology where they
treat you as stupid, and clothes
where they see you as not
interested in fashion.
In a lot of ways we are invisible;
younger sales people ignore you,
some places treat you like cattle
Sometimes ignored by sales
staff in favour of younger
customers.Treated with respect and
friendliness.“ ”
79

GETTING AROUND
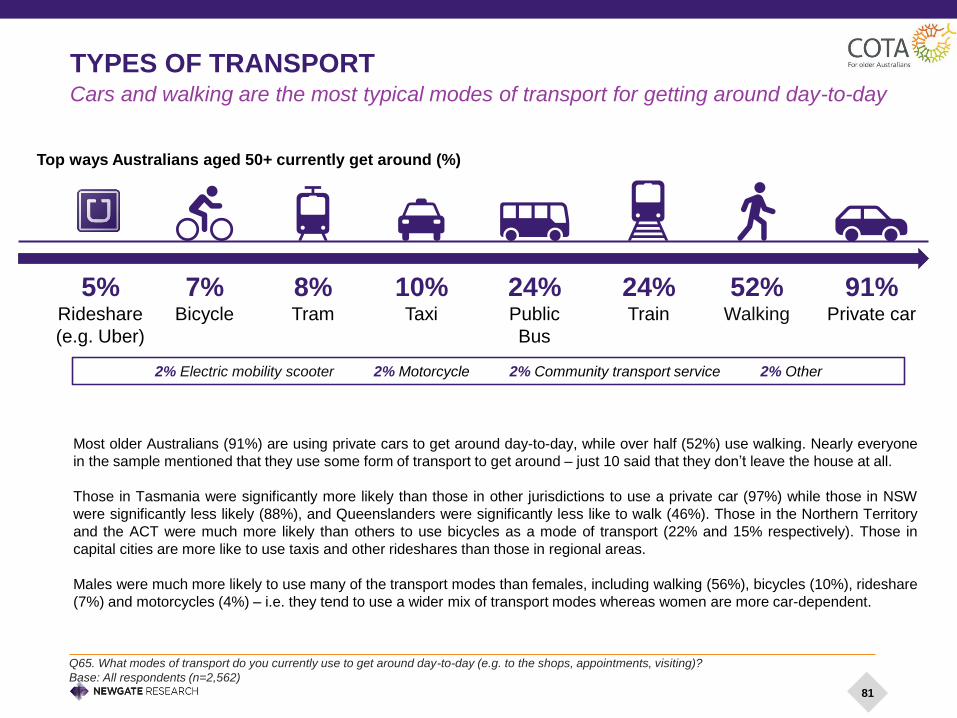
81
2% Electric mobility scooter 2% Motorcycle 2% Community transport service 2% Other
TYPES OF TRANSPORT Cars and walking are the most typical modes of transport for getting around day-to-day
Top ways Australians aged 50+ currently get around (%)
5% Rideshare
(e.g. Uber)
8% Tram
7% Bicycle
24% Train
52% Walking
91% Private car
10% Taxi
24% Public
Bus
Most older Australians (91%) are using private cars to get around day-to-day, while over half (52%) use walking. Nearly everyone
in the sample mentioned that they use some form of transport to get around – just 10 said that they don’t leave the house at all.
Those in Tasmania were significantly more likely than those in other jurisdictions to use a private car (97%) while those in NSW
were significantly less likely (88%), and Queenslanders were significantly less like to walk (46%). Those in the Northern Territory
and the ACT were much more likely than others to use bicycles as a mode of transport (22% and 15% respectively). Those in
capital cities are more like to use taxis and other rideshares than those in regional areas.
Males were much more likely to use many of the transport modes than females, including walking (56%), bicycles (10%), rideshare
(7%) and motorcycles (4%) – i.e. they tend to use a wider mix of transport modes whereas women are more car-dependent.
Q65. What modes of transport do you currently use to get around day-to-day (e.g. to the shops, appointments, visiting)?
Base: All respondents (n=2,562)
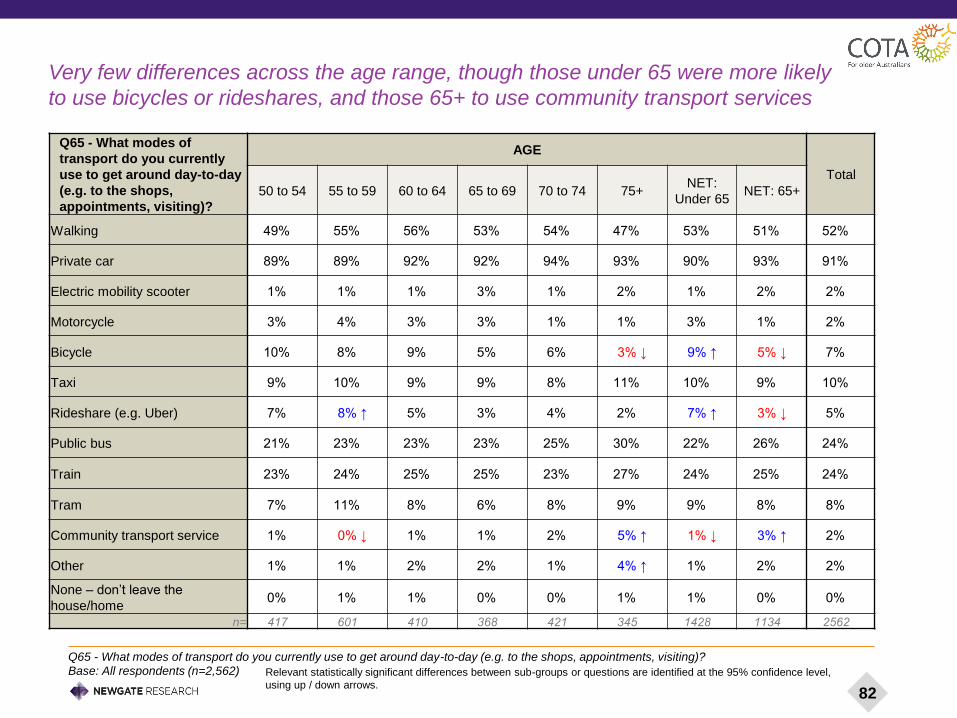
Very few differences across the age range, though those under 65 were more likely
to use bicycles or rideshares, and those 65+ to use community transport services
82
Q65 - What modes of
transport do you currently
use to get around day-to-day
(e.g. to the shops,
appointments, visiting)?
AGE
Total
50 to 54 55 to 59 60 to 64 65 to 69 70 to 74 75+NET:
Under 65NET: 65+
Walking 49% 55% 56% 53% 54% 47% 53% 51% 52%
Private car 89% 89% 92% 92% 94% 93% 90% 93% 91%
Electric mobility scooter 1% 1% 1% 3% 1% 2% 1% 2% 2%
Motorcycle 3% 4% 3% 3% 1% 1% 3% 1% 2%
Bicycle 10% 8% 9% 5% 6% 3% ↓ 9% ↑ 5% ↓ 7%
Taxi 9% 10% 9% 9% 8% 11% 10% 9% 10%
Rideshare (e.g. Uber) 7% 8% ↑ 5% 3% 4% 2% 7% ↑ 3% ↓ 5%
Public bus 21% 23% 23% 23% 25% 30% 22% 26% 24%
Train 23% 24% 25% 25% 23% 27% 24% 25% 24%
Tram 7% 11% 8% 6% 8% 9% 9% 8% 8%
Community transport service 1% 0% ↓ 1% 1% 2% 5% ↑ 1% ↓ 3% ↑ 2%
Other 1% 1% 2% 2% 1% 4% ↑ 1% 2% 2%
None – don’t leave the
house/home0% 1% 1% 0% 0% 1% 1% 0% 0%
n= 417 601 410 368 421 345 1428 1134 2562
Q65 - What modes of transport do you currently use to get around day-to-day (e.g. to the shops, appointments, visiting)?
Base: All respondents (n=2,562) Relevant statistically significant differences between sub-groups or questions are identified at the 95% confidence level,
using up / down arrows.

31
7
25
18
34
45
11
30
Amongst non-users (n=1,442)
Amongst public transport users (n=838)
Public transport satisfaction rating (%)
0 - 3 4 - 6 7 - 8 9 - 10 Don't know
83
PUBLIC TRANSPORT 35% of older Australians use some form of public transport (i.e. bus, train or tram)
The heaviest users of public transport (in which we include
bus, train and tram but not taxi, rideshare and community
transport) are those in the most heavily-populated states of
New South Wales (40% use public transport) and Victoria
(40%).
Use of public transport is also higher in capital cities where
there tend to be substantially more services (48% vs 15% in
regional areas).
Men are also more likely to be public transport users than
women (39% vs 33%).
The lowest patronage of public transport by older Australians
is in Queensland (27%), Tasmania (11%) and the Northern
Territory (11%).
Those with a disability have lower usage of public transport,
with 29% using one of the three modes considered. Those
with a disability are more likely to use community transport
services (6% vs 1%) than those without a disability.
Q65. What modes of transport do you currently use to get around day-to-day (e.g. to the shops, appointments, visiting)? Base: All respondents (n=2,562)
Q67. Even if you don’t use it, how do you rate public transport in your area in terms of enabling you to get around? Base: All respondents (n=2,562)
Satisfaction with the public transport service was polarised between those who use the services, and those who don’t: 75% of
users rated their service highly (7-10 out of 10) compared with just 44% of those who don’t use public transport.
Among those who use the services, satisfaction was highest in Western Australia (83% rating 7-10), within capital cities
(78%) and amongst people who have retired – either fully or partially (79%).

84
PREFERRED TYPES OF TRANSPORT
The survey also sought to understand whether participants would prefer to use a different form of transport from the one they
currently use. While the results were in a similar order as current modes, we saw that fewer people would like to use many of the
modes – significantly fewer in the case of both private cars (83%, down from 91% currently using cars) and walking (45% vs 52%)
but there was no sizeable shift in favour of an alternative form of transport.
Notably, 10% of those who don’t use public transport would like to be able to use it, and 30% of those who don’t use a car would
prefer to use one, while 19% of those who don’t currently use a car would prefer to use a taxi.
Those in capital cities were around twice as likely as those in regional areas to want to use public transport (41% wanted to use a
train, bus, tram or community transport service, vs 21% respectively).
Car was also a notable preference for those in Tasmania (91%).
Q65. What modes of transport do you currently use to get around day-to-day (e.g. to the shops, appointments, visiting)? Base: All respondents (n=2,562)
Q66. What modes of transport would you prefer to use to get around day-to-day? Base: All respondents (n=2,562)
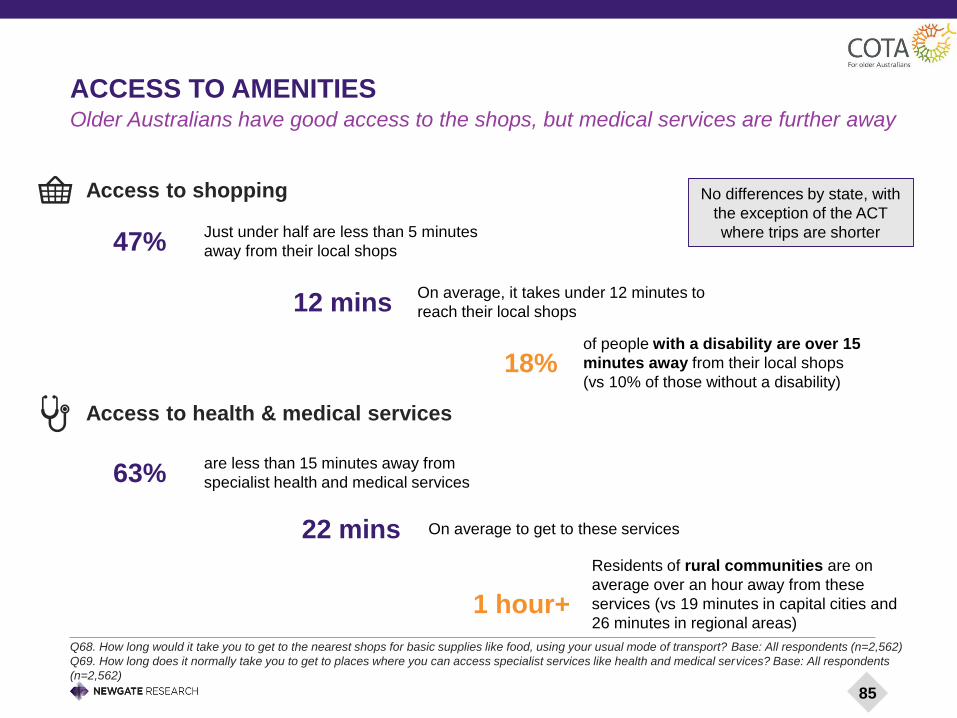
Q68. How long would it take you to get to the nearest shops for basic supplies like food, using your usual mode of transport? Base: All respondents (n=2,562)
Q69. How long does it normally take you to get to places where you can access specialist services like health and medical services? Base: All respondents
(n=2,562)
ACCESS TO AMENITIESOlder Australians have good access to the shops, but medical services are further away
47%Just under half are less than 5 minutes
away from their local shops
Access to shopping
Access to health & medical services
12 minsOn average, it takes under 12 minutes to
reach their local shops
18%of people with a disability are over 15
minutes away from their local shops
(vs 10% of those without a disability)
63%are less than 15 minutes away from
specialist health and medical services
22 mins On average to get to these services
1 hour+
Residents of rural communities are on
average over an hour away from these
services (vs 19 minutes in capital cities and
26 minutes in regional areas)
No differences by state, with
the exception of the ACT
where trips are shorter
85

A SUMMARY OF KEY DIFFERENCES BY DEMOGRAPHICSSignificant differences noted throughout
this report are summarised here by
gender, state/territory and age group.
We also look at non-working people who
are renting as a particularly vulnerable
group.

KEY DIFFERENCES BY GENDER
87
The survey found few gender differences. However, there are some indications that women may be faring better than
men when it comes to their overall happiness, while men reported being in a better financial position.
On the positive side, women…
… feel 12 years younger than their actual age, on average (whereas men feel 10 years younger on average);
… are more likely than men to give higher ratings for their quality of life (28% rating this at 9 or 10 out of 10);
… are more likely than men to give higher ratings (8-10) for their social interactions (60% vs 50%) and their sense
of connection to their local community (39% vs 30%).
But, women are also more likely to…
… be spending over 17 hours in unpaid work on average per week (19% vs 14% of men);
… have greater financial insecurity (29% rated their financial situation as 0-4 vs 23% of men);
… disagree that they have money to spend on leisure and social activities (23% vs 18% of men);
... feel they were being treated differently as a consumer now that they are older (27% vs 21%); and
… have a household budget (54% vs 46% of men).
Women are also less likely to have private health insurance (39% vs 64% of men), and they are especially risk
averse: 70% are not prepared to risk money to make an investment (vs 56% of men).
Meanwhile, men are more likely to…
… have private health insurance (64%);
… report higher levels of physical activity (52% do 2+ hours per week vs 46% of women);
… feel confident about their rights as a consumer when it comes to in-person shopping (78% vs 72% of women);
… be public transport users than women (39% vs 33%).

KEY DIFFERENCES BY STATE & TERRITORY
88
There are very few differences by state or territory – though at an overall level residents of the ACT reported being
better off than those in other locations against a number of measures, and conversely there are some indications that
those in WA, SA and the NT are worse off in some regards. These differences have been noted throughout this report
and are summarised here:
When it comes to the vulnerable segment identified within this report, we see higher vulnerability amongst those living
in SA and WA than in other locations (both 55%, compared to 49% overall). Those living in WA were also more likely to
say that they wanted more paid work than those in other states and territories (34% vs 28% overall); and when it
comes to potential policy changes (explored in the next chapter of this report), Western Australians were also more
likely to state that, in a number of cases, these changes would make a great deal of difference to them personally.
Meanwhile, on a number of measures, residents of the ACT are better off than those in other locations. For example,
residents of the ACT were most likely to feel secure about their finances (70% giving a rating of 7 or more on this
measure vs 53% at the total level), and more likely to have private health insurance (82% - followed by NT at 73%,
and WA at 70%). ACT residents also reported higher levels of physical activity (65% do 2+ hours per week vs 49% in
other states/territories).
Residents in Tasmania were more likely to rate the affordability and security of their living arrangements highly (50%
giving a rating of 9-10 for affordability and 62% for security).
Those living in the NT were more likely to rate their quality of life highly, at 9 or 10 out of 10 (38%, compared to 26%
overall). However, these participants were also more likely to feel that things are heading in the wrong direction for
people aged 50+ (55%), and they were more likely than those in other locations to report difficulties understanding
changing rules around superannuation (63%). It is worth reiterating that, as noted elsewhere, our NT sample may not
be considered reflective of the NT population overall, so these results should be interpreted with this in mind.
There was very little difference in location for any of the quality of life measures at Q11, nor were there any notable
differences in financial and health statuses other than those few already mentioned above – though it is worth noting
that Queenslanders are more likely to be without private health insurance (43%) than other groups.
While there are a number of differences when it comes to getting around (listed in detail in that chapter of this report),
this can be largely attributed to geography, climate and available transport methods, and we did not note any
significant differences in terms of people’s future transport preferences or access to amenities.
Support for assisted dying legislation (at 84% overall) was highly consistent across all states and territories. There
were also no notable differences by location when it came to consumer complaints and rights.
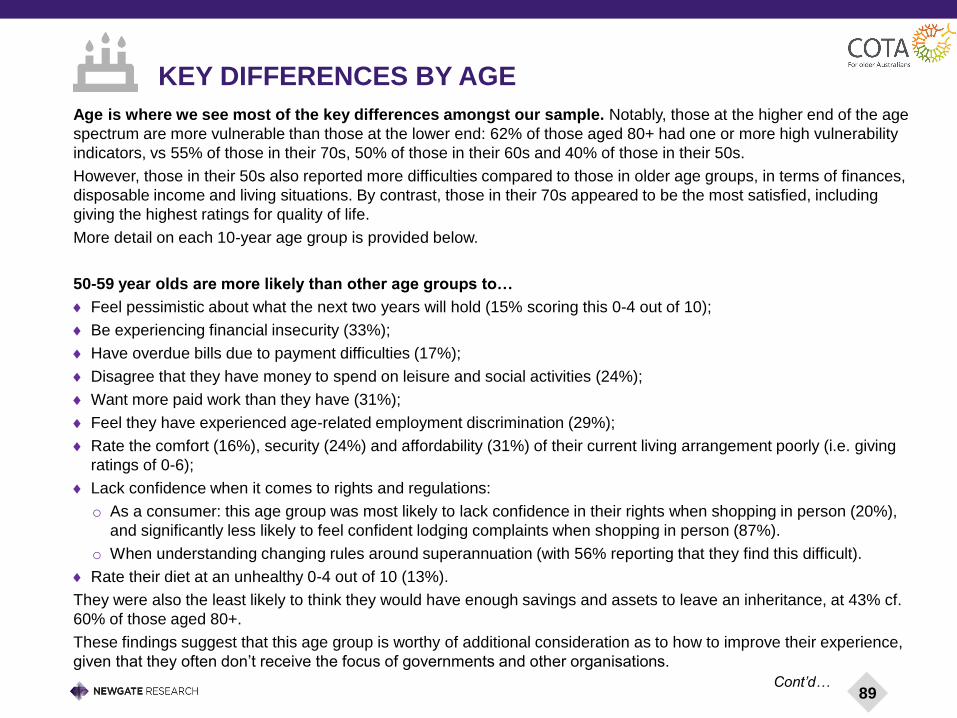
KEY DIFFERENCES BY AGE
89
Age is where we see most of the key differences amongst our sample. Notably, those at the higher end of the age
spectrum are more vulnerable than those at the lower end: 62% of those aged 80+ had one or more high vulnerability
indicators, vs 55% of those in their 70s, 50% of those in their 60s and 40% of those in their 50s.
However, those in their 50s also reported more difficulties compared to those in older age groups, in terms of finances,
disposable income and living situations. By contrast, those in their 70s appeared to be the most satisfied, including
giving the highest ratings for quality of life.
More detail on each 10-year age group is provided below.
50-59 year olds are more likely than other age groups to…
Feel pessimistic about what the next two years will hold (15% scoring this 0-4 out of 10);
Be experiencing financial insecurity (33%);
Have overdue bills due to payment difficulties (17%);
Disagree that they have money to spend on leisure and social activities (24%);
Want more paid work than they have (31%);
Feel they have experienced age-related employment discrimination (29%);
Rate the comfort (16%), security (24%) and affordability (31%) of their current living arrangement poorly (i.e. giving
ratings of 0-6);
Lack confidence when it comes to rights and regulations:
o As a consumer: this age group was most likely to lack confidence in their rights when shopping in person (20%),
and significantly less likely to feel confident lodging complaints when shopping in person (87%).
o When understanding changing rules around superannuation (with 56% reporting that they find this difficult).
Rate their diet at an unhealthy 0-4 out of 10 (13%).
They were also the least likely to think they would have enough savings and assets to leave an inheritance, at 43% cf.
60% of those aged 80+.
These findings suggest that this age group is worthy of additional consideration as to how to improve their experience,
given that they often don’t receive the focus of governments and other organisations.
Cont’d…
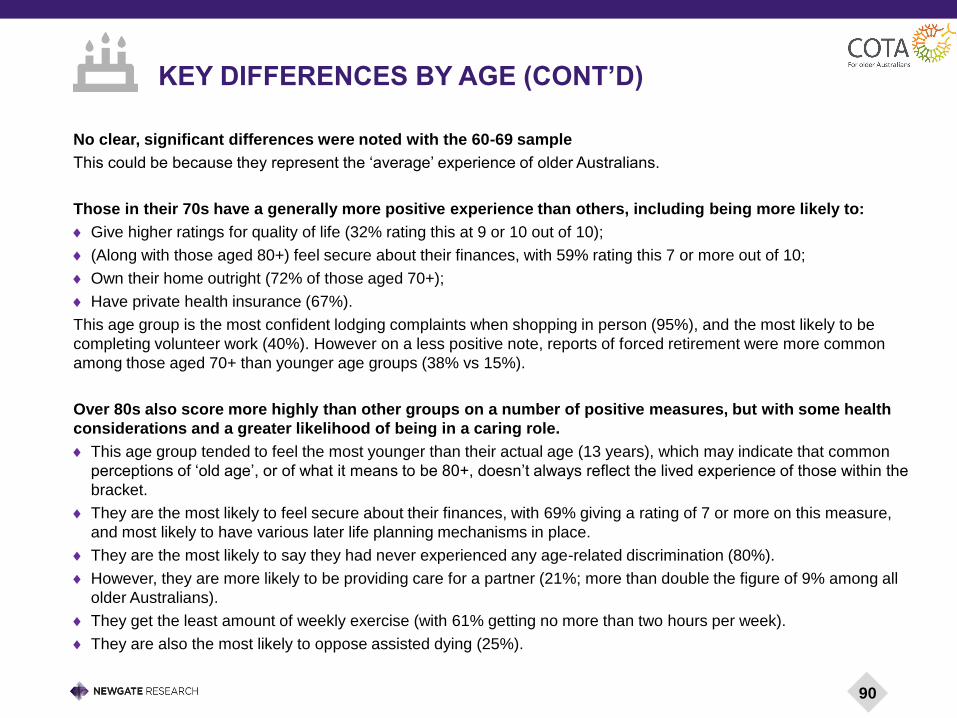
90
No clear, significant differences were noted with the 60-69 sample
This could be because they represent the ‘average’ experience of older Australians.
Those in their 70s have a generally more positive experience than others, including being more likely to:
Give higher ratings for quality of life (32% rating this at 9 or 10 out of 10);
(Along with those aged 80+) feel secure about their finances, with 59% rating this 7 or more out of 10;
Own their home outright (72% of those aged 70+);
Have private health insurance (67%).
This age group is the most confident lodging complaints when shopping in person (95%), and the most likely to be
completing volunteer work (40%). However on a less positive note, reports of forced retirement were more common
among those aged 70+ than younger age groups (38% vs 15%).
Over 80s also score more highly than other groups on a number of positive measures, but with some health
considerations and a greater likelihood of being in a caring role.
This age group tended to feel the most younger than their actual age (13 years), which may indicate that common
perceptions of ‘old age’, or of what it means to be 80+, doesn’t always reflect the lived experience of those within the
bracket.
They are the most likely to feel secure about their finances, with 69% giving a rating of 7 or more on this measure,
and most likely to have various later life planning mechanisms in place.
They are the most likely to say they had never experienced any age-related discrimination (80%).
However, they are more likely to be providing care for a partner (21%; more than double the figure of 9% among all
older Australians).
They get the least amount of weekly exercise (with 61% getting no more than two hours per week).
They are also the most likely to oppose assisted dying (25%).
KEY DIFFERENCES BY AGE (CONT’D)

The non-working people who are renting can be considered a particularly vulnerable audience, given their
potentially limited income and lack of security in terms of their living arrangements.
More than nine in ten (92%) of those who are not working, renting and under 65 fall into the category of higher
vulnerability that was first identified on page 25 of this report, compared to 43% of the age group overall. Meanwhile,
over three-quarters (78%) of the 65+ non-working people who are renting fall into this category, compared to 53% of
the rest of that age group.
As the table overleaf shows, both the under and over 65 non-working people who are renting are significantly more
likely than the rest of their age groups to:
- Rate their quality of life as poor (0-3 out of 10);
- Rate the affordability and security of their current living arrangements as poor (0-3 out of 10);
- Strongly agree that the cost of living is leaving them behind;
- Strongly disagree that they have money left over for leisure and social activities (which, as we have seen, has some
implications for their social connectedness);
- Have overdue bills due to payment difficulties;
- Feel that improving the affordability of services would make a great deal of difference to them.
Furthermore, while both the under and over 65 non-working people who are renting are experiencing higher
levels of financial and emotional stress, this is particularly prevalent in the under 65 age group. For all the
statements listed in the paragraph above, the under 65 non-working people who are renting are significantly more likely
to rate them in this way than the over 65 group (as well as significantly more than their age groups as a whole). This
may be due to the fact that the older group feel some greater level of security due to the age pension or support
networks available to them; it could also be that 16% of the younger group have children aged 0-17 at home, compared
to just 6% of the older group. Once again, it seems to indicate that a number of those in the 50-64 age group are
particularly struggling and in need of further consideration and assistance.
NON-WORKING PEOPLE WHO ARE RENTING
91

Comparing non-working people who are renting to the broader population
65+, not working, renting Rest of 65+ <65, not working, renting Rest of <65
Higher Vulnerability 78% ↑ 53% ↓ 92% ↑ 36% ↓
Q6 - Quality of life rating 0-3 11% ↑ 2% ↓ 24% ↑ 4% ↓
Q40 - Financial security 0-3 33% ↑ 12% ↓ 52% ↑ 21% ↓
Q17 – Affordability of current living
arrangements 0-315% ↑ 2% ↓ 19% ↑ 6% ↓
Q18 – Feel secure in current living 0-3 8% ↑ 1% ↓ 15% ↑ 5% ↓
Q35 – Cost of Living is increasing a rate that
is leaving me behind – Strongly Agree27% ↑ 14% ↓ 37% ↑ 14% ↓
Q35 – I have money left over for leisure and
social activities – Strongly Disagree19% ↑ 4% ↓ 25% ↑ 7% ↓
Q41 – Bills overdue because of difficulties in
paying them
At least one bill - 15% At least one bill – 6% At least one bill - 32% At least one bill – 14%
incl. incl. incl. incl.
Electricity & Gas – 9% Electricity & Gas – 3% Electricity & Gas – 25% Electricity & Gas – 7%
Internet – 5% Internet – 2% Internet – 10% Internet – 3%
Mobile – 5% Mobile – 2% Mobile – 8% Mobile – 4%
Telephone – 4% Telephone – 1% Telephone – 7% Telephone – 3%
Rent or Mortgage – 5% Rent or Mortgage – 1% Rent or Mortgage – 6% Rent or Mortgage – 3%
Q73 – Improving affordability of services for
older Australians would make a difference to
you personally (A great deal of difference)
57% ↑ 35% ↓ 63% ↑ 39% ↓
Base: All respondents (n=2,562)
Relevant statistically significant differences between sub-groups or questions are identified at the 95% confidence level,
using up / down arrows – these differences should be read within the 65+ columns and within the <65 columns but not
across the two 92
LOOKING TO THE FUTURE
PRIORITY ISSUES FOR COTA TO ADDRESS

Increasing the pension was the most common change older Australians wanted COTA
to lobby the Government for
CHANGES TO ACHIEVE BETTER OUTCOMES
Q72. Reflecting on what’s most important to you and all of the topics covered in this survey, what changes would you really like COTA to lobby the government for, in order to achieve better outcomes for all Australians aged 50+? Base: All respondents (n=2,562) (Unprompted question, responses subsequently coded into themes.)
When we asked people to say (unprompted) what was important
to them in order to achieve better outcomes for all Australians
aged 50+, a fifth (20%) said they didn’t know or that there wasn’t
anything they wanted.
Their verbatim responses (examples shown overleaf) were
manually coded into themes, and in line with the finance theme
running throughout this report, 15% said they would like COTA to
lobby for an increase to the pension. In addition, 4% wanted
financial support and incentives, and 4% mentioned the cost of
living.
Meanwhile, 11% wanted COTA to lobby for improvements to a
quality, better managed and more affordable healthcare system,
and 11% wanted improvements to aged care specifically.
Coalition voters were much more likely to mention
superannuation as an issue (12%) than voters of other parties.
Those more vulnerable were more likely to request lobbying for a
better pension (18%) and less likely to mention superannuation
rules (4%).
There were almost no location-based differences, but it is worth
noting that Tasmanians were twice as likely to ask COTA to
lobby for improvements to the healthcare system as those in
other states and territories (20% vs 11%). The younger cohort
(50-59) were more likely to mention superannuation (12%),
employment opportunities (9%) and changes to the pension age
(8%) than older age groups, while 70-79 year olds were much
more likely to seek an increased pension (21% vs 15%).
15
11
11
9
5
5
5
5
20
Increase the pension paymentamount
Address healthcare costs
Better residential aged carefacilities (nursing homes) / in-…
Stop changing superannuationeligibility rules
Provide discounted utilities
Provide more employmentopportunities
Reduce/stop increasing age atwhich pension can be accessed
Affordable/better housing
Don’t know/None/ All good
Changes they’d like COTA to lobby the Government for – unprompted (5%+)
95

Q72. Reflecting on what’s most important to you and all of the topics covered in this survey, what changes would you really l ike COTA to lobby the
government for, in order to achieve better outcomes for all Australians aged 50+? Base: All respondents (n=2,568)
IN THEIR OWN WORDS – CHANGES TO ACHIEVE BETTER OUTCOMES
Increase the Age Pension,
including rent assistance. Get the
NDIS properly rolled out in all
areas.
Leave superannuation alone and
stop changing the rules.
Public Health System needs to
improve so that older Australians who
cannot afford Private Health
Insurance are not kept waiting when
they have to visit a Public Hospital for
treatment.
More aged care facilities
of a higher standard.
.
As a carer for elderly parents and having just had
my father in law go through the process of having
to be placed into an aged care facility etc., there's a
real need for the Department of Human Services to
be more accessible.
Lower rates for medical health
insurance - it is far too expensive
for a pensioner.
Access to Specialist Health Care
in rural areas, not just cities.
Help for those who are self funded
retirees. Instead of being helped we
seem to constantly have less and less
help.
Retirement age needs to be
lower. Asking a manual laborer to
work until they are 67 is
ridiculous.
Being given a fair go when it
comes to employment.
96

COTA also put forward some specific suggestions on what it could lobby for on behalf
of older Australians, to understand how much difference these changes might make
IMPACT OF PROPOSED POLICY CHANGES
Q73. Here are some potential things COTA could lobby for on behalf of Australians aged 50+. For each one, please indicate how much of a difference you
feel it would make to your life personally, if it was achieved? Base: All respondents (n=2,562)
24
27
32
34
12
23
9
6
26
21
15
11
30
19
24
21
29
24
23
22
29
28
34
33
21
28
30
33
28
30
33
40
Improving financial literacy skills among older Australians, by enablingbetter access to information about such things
Removing stamp duty on houses built using design standards whichensure they are accessible to older people and those with disabilities
Providing older people who are experiencing abuse with effective toolsand services to live free from abuse
Ensuring specific crisis accommodation is available for single olderwomen facing homelessness
Ensuring footpaths are accessible and flat
Creating meaningful employment for older Australians, includingtackling ageism and age discrimination in the workforce
Improving access to services that might keep people out of hospital –like fitness programs, dietary advice, community health programs, etc.
Improving affordability of services for older Australians (like energy,internet or phone contracts)
Expected difference proposed change would make to them personally (%)
No difference A small difference A fair bit of difference A great deal of difference
As the chart shows, the changes that would make the most difference to survey participants were improving the affordability of
services like energy, the internet etc. (which 73% felt would make a fair bit or a great deal of difference to them), followed by
improving access to health services that might keep people out of hospitals (66%). However, every item on the list would make
at least a fair difference to at least half of those surveyed, and should therefore be considered to hold merit for COTA to pursue.
NET
A fair bit / a great
deal of difference
73%
66%
58%
57%
55%
53%
53%
50%
97
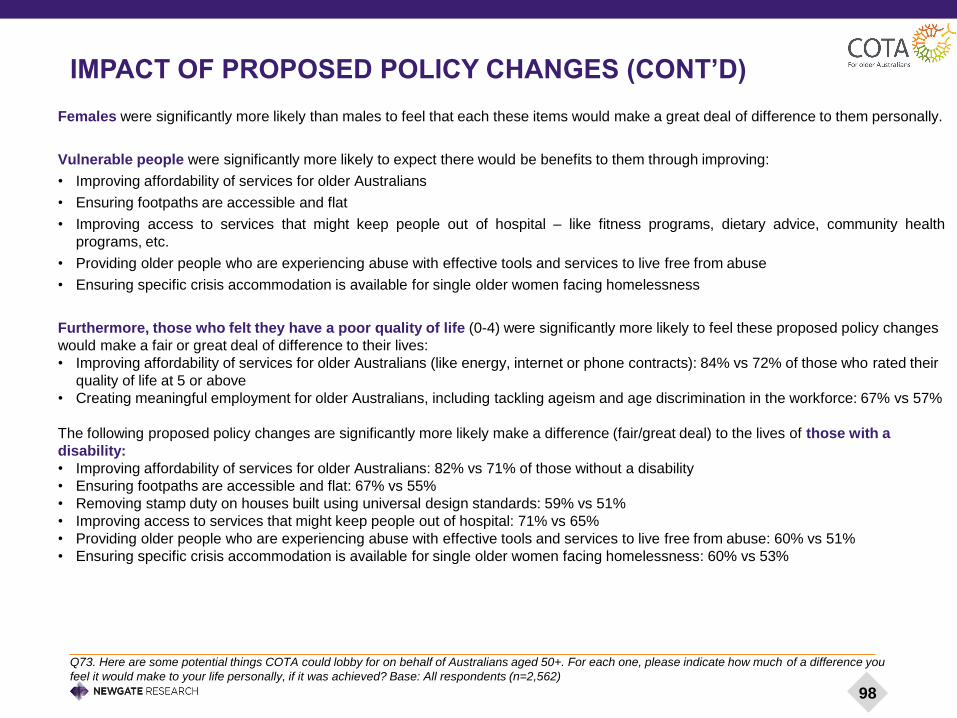
IMPACT OF PROPOSED POLICY CHANGES (CONT’D)
Q73. Here are some potential things COTA could lobby for on behalf of Australians aged 50+. For each one, please indicate how much of a difference you
feel it would make to your life personally, if it was achieved? Base: All respondents (n=2,562)
Females were significantly more likely than males to feel that each these items would make a great deal of difference to them personally.
Vulnerable people were significantly more likely to expect there would be benefits to them through improving:
• Improving affordability of services for older Australians
• Ensuring footpaths are accessible and flat
• Improving access to services that might keep people out of hospital – like fitness programs, dietary advice, community health
programs, etc.
• Providing older people who are experiencing abuse with effective tools and services to live free from abuse
• Ensuring specific crisis accommodation is available for single older women facing homelessness
Furthermore, those who felt they have a poor quality of life (0-4) were significantly more likely to feel these proposed policy changes
would make a fair or great deal of difference to their lives:
• Improving affordability of services for older Australians (like energy, internet or phone contracts): 84% vs 72% of those who rated their
quality of life at 5 or above
• Creating meaningful employment for older Australians, including tackling ageism and age discrimination in the workforce: 67% vs 57%
The following proposed policy changes are significantly more likely make a difference (fair/great deal) to the lives of those with a
disability:
• Improving affordability of services for older Australians: 82% vs 71% of those without a disability
• Ensuring footpaths are accessible and flat: 67% vs 55%
• Removing stamp duty on houses built using universal design standards: 59% vs 51%
• Improving access to services that might keep people out of hospital: 71% vs 65%
• Providing older people who are experiencing abuse with effective tools and services to live free from abuse: 60% vs 51%
• Ensuring specific crisis accommodation is available for single older women facing homelessness: 60% vs 53%
98

IMPACT OF PROPOSED POLICY CHANGES (CONT’D)
Q73. Here are some potential things COTA could lobby for on behalf of Australians aged 50+. For each one, please indicate how much of a difference you
feel it would make to your life personally, if it was achieved? Base: All respondents (n=2,562)
At a state based level there were only a few differences. However, at an overall level it is worth noting that those living in
WA were significantly more likely than those in other states and territories to state that these five items would make a great
deal of difference to them personally:
• They were more likely to say that improving the affordability of services would make a great deal of difference to them
(49%), while those in the ACT were notably more likely to say it would only make a small difference (29%).
• They were more likely than those in other states and territories to feel that ensuring footpaths are accessible and flat
would make a great deal of difference to them (37%), while those in QLD were much less likely to feel that way (22%) –
which is in keeping with the earlier finding that Queenslanders are much less likely to list walking as one of their usual or
preferred modes of transport.
• They were more likely to say that providing older people who are experiencing abuse with effective tools and services to
live free from abuse would make a great deal of difference to them (40%)
• They felt that ensuring specific crisis accommodation is available for single older women facing homelessness would
make a great deal of difference to them (40%)
• And finally, they were more likely to say that removing stamp duty on houses built to universal design standards would
make a great deal of difference to them (39%).
Meanwhile, those living in the ACT and Tasmania were much less likely than those in other areas to feel that creating
meaningful employment for older Australians including tackling ageism and age discrimination would make a great deal of
difference to them (ACT 20%, Tasmania 21%).
99
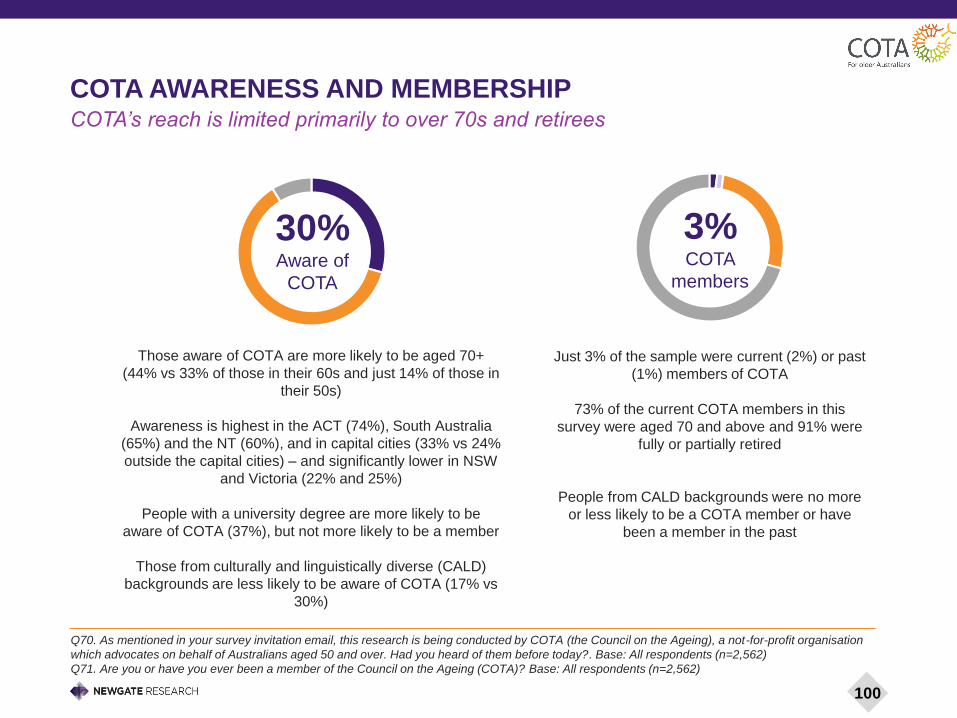
COTA AWARENESS AND MEMBERSHIP
Q70. As mentioned in your survey invitation email, this research is being conducted by COTA (the Council on the Ageing), a not-for-profit organisation
which advocates on behalf of Australians aged 50 and over. Had you heard of them before today?. Base: All respondents (n=2,562)
Q71. Are you or have you ever been a member of the Council on the Ageing (COTA)? Base: All respondents (n=2,562)
Those aware of COTA are more likely to be aged 70+
(44% vs 33% of those in their 60s and just 14% of those in
their 50s)
Awareness is highest in the ACT (74%), South Australia
(65%) and the NT (60%), and in capital cities (33% vs 24%
outside the capital cities) – and significantly lower in NSW
and Victoria (22% and 25%)
People with a university degree are more likely to be
aware of COTA (37%), but not more likely to be a member
Those from culturally and linguistically diverse (CALD)
backgrounds are less likely to be aware of COTA (17% vs
30%)
3%COTA
members
30%Aware of
COTA
COTA’s reach is limited primarily to over 70s and retirees
Just 3% of the sample were current (2%) or past
(1%) members of COTA
73% of the current COTA members in this
survey were aged 70 and above and 91% were
fully or partially retired
People from CALD backgrounds were no more
or less likely to be a COTA member or have
been a member in the past
100

CONCLUSIONS

CONCLUSIONS
While there is an overall positive aspect to many of these findings, when we focus on the group of older Australians who
are not doing so well at the moment, we see numerous challenges related to finances, health, age discrimination and a
general lack of trust in Government and the future.
With a federal election approaching, the feedback from older people suggests that health (preventive health, oral/dental
health and healthcare services), financial security and age discrimination are areas of importance to older Australians.
Better outcomes in these areas will help to unlock an improved quality of life for all older people.
Other areas to address include improved pension amounts, better access to pensions, and programs to help prepare
people for their financial future. Attention is needed for older people with a disability on low incomes, to ensure they have
access to healthcare, given their particular likelihood not to have private health insurance.
With Australians feeling younger and being likely to enjoy longer lives, savings and healthcare gaps are likely to become
greater issues.
COTA will use this research to develop a targeted policy package that focuses on touchstone issues identified in this
report.
102

APPENDIX
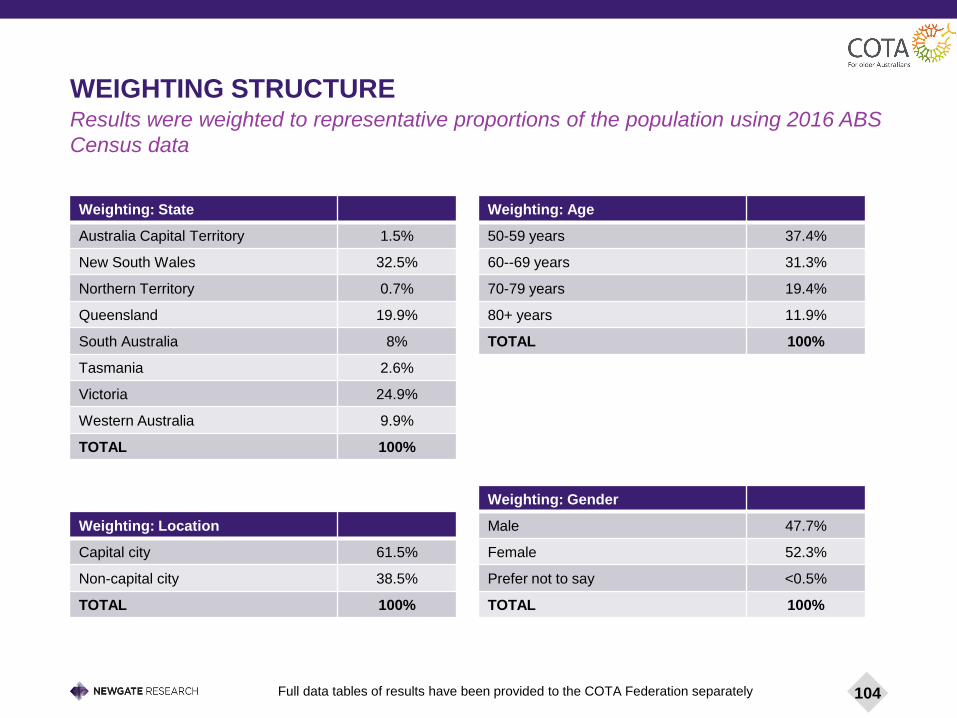
Weighting: Age
50-59 years 37.4%
60--69 years 31.3%
70-79 years 19.4%
80+ years 11.9%
TOTAL 100%
Weighting: State
Australia Capital Territory 1.5%
New South Wales 32.5%
Northern Territory 0.7%
Queensland 19.9%
South Australia 8%
Tasmania 2.6%
Victoria 24.9%
Western Australia 9.9%
TOTAL 100%
Results were weighted to representative proportions of the population using 2016 ABS
Census data
WEIGHTING STRUCTURE
Weighting: Gender
Male 47.7%
Female 52.3%
Prefer not to say <0.5%
TOTAL 100%
Weighting: Location
Capital city 61.5%
Non-capital city 38.5%
TOTAL 100%
104Full data tables of results have been provided to the COTA Federation separately
BENEFITS AND LIMITATIONS OF THIS METHODOLOGY
Online panels provide a cost-effective source of eligible survey participants. They are convenient for participants to
complete, as they can choose the time and location of completion (unlike telephone surveys), the survey can also
be completed on-the-go through mobile phone and tablet compatibility, and it can be completed in parts rather than
all in one go.
Online surveys are also quicker for participants to complete, enabling us to ask more questions and cover more
topics of potential relevance, which was suitable for COTA’s objectives for this study. Online questionnaires offer a
wide range of design options, which can assist participant comprehension and engagement and/or increase the
range of analysis options available.
While panels are limited to only people who have registered, and are therefore self-selecting, they are carefully
managed to be largely demographically reflective of the general population. However there are still some limitations
in panels regarding aspects such as: access to a computer/computer literacy, age (skewing younger), and those
who speak a language other than English at home.
We note the fact that the survey was conducted in English only meant it could not be completed by certain
Australians. We also note that any survey of this nature can only be completed by those who are fully able to
express their views and experiences, so for example not those who are particularly unwell or have cognitive
impairments.
105

CONTACT DETAILS – THE COTA FEDERATION
COTA ACT
Hughes Community Centre, 2 Wisdom St, Hughes ACT 2605
Phone: (02) 6282 3777
Email: [email protected]
Website: http://www.cotaact.org.au
COTA NSW
Level 11, 31 Market Street, Sydney NSW 2000
Phone: (02) 9286 3860
Regional Free Call: 1800 449 102
Email: [email protected]
Website: http://www.cotansw.com.au
COTA NT
GPO Box 852, Darwin NT 0801
Phone: (08) 8941 1004
Email: [email protected]
Website: http://www.cotant.org.au
COTA QLD
PO Box 15525, City East QLD 4002
Phone: (07) 3316 2999
Email: [email protected]
Website: http://www.cotaqld.org.au
106
COTA SA
PO Box 1583, ADELAIDE SA 5001
Phone: (08) 8232 0422
Free Call: 1800 182 324
Email: [email protected]
Website: https://www.cotasa.org.au
COTA TAS
‘Westella’, 181 Elizabeth Street, Hobart TAS 7000
Phone: (03) 6231 3265
Email: [email protected]
Website: http://www.cotatas.org.au
COTA VIC
Level 4, 533 Little Lonsdale Street, Melbourne VIC 3000
Phone: (03) 9655 2100
Email: [email protected]
Internet URL: http://www.cotavic.org.au
COTA WA
PO Box 923, Victoria Park WA 6979
Phone: (08) 9472 0104
Email: [email protected]
Internet URL: http://www.cotawa.org.au
COTA AUSTRALIA, Suite 9, 16 National Circuit, Barton ACT 2600 Phone: (02) 6154 9740 Email: [email protected]
Website: https://www.cota.org.au
107
Melbourne
+61 3 9611 1850
Level 10, 120 Collins Street
Melbourne VIC 3000
Sydney
+61 2 9232 9550
Level 18, 167 Macquarie Street
Sydney NSW 2000
Perth
+61406 244 356
Level 7, 191 St Georges Terrace
Perth WA 6000
Canberra
+61 2 9232 9500
John McEwen House
7 National Circuit
Barton ACT 2600
Brisbane
+61 7 3009 9000
Level 14, 110 Eagle Street
Brisbane QLD 4000
CONTACT DETAILS –NEWGATE RESEARCH