state of the economy july august 2012 final of the economy july august... · state of the economy...
TRANSCRIPT
1
STATE OF THE ECONOMY REPORT FOR JULY – AUGUST 2012
BY THE MINISTER OF FINANCE HON. T. BITI (MP)
Listen to the speech in full: Click here
INTRODUCTION
1. This Report gives an update on fiscal and other macro-economic
developments as at end of August 2012.
2. Since the announcement of the Mid-Year Fiscal Policy Review on 18 July
2012, the economy remains depressed, with funding challenges for both
the private and public sectors, irrespective of the prevailing stable
macroeconomic environment and some output improvements in sectors
such as mining.
3. On the positive side, inflation for July and August remained contained at
around 4%, which is below the annual average target of 5%.
4. Public finances, however, had revenue performance challenges. In July
and August, collections were US$257.4 million and about US$269.2 million
against revised targets of US$271.2 million and US$280.7 million.
2
5. This revenue under-performance implies underfunding of some planned
Budget projects and programmes.
6. In the financial sector, deposits grew by 3% from US$3.59 billion in June
to US$3.64 billion by July 2012. However, liquidity remained a challenge
against high demand for affordable credit. Lending increased from 80% in
June to about 87% of total deposits, but remained primarily short-term
with lending rates still high ranging up to 30%.
7. Exports and imports maintained an upward trend, cumulatively reaching
US$2.16 billion and US$5.1 billion respectively by end of August 2012.
This gives a half year trade gap of about US$3 billion, reflecting faster
imports growth during the period under review.
Major Challenges
8. In summary, the primary challenges still gripping the economy are:
Revenue underperformance;
Consequent underfunding of various urgent Government
programmes such as agriculture, infrastructure, census and
other social services;
Lack of liquidity, constraining banks to adequately fund
productive sectors;
Low foreign investment
Hence Low capacity utilisation and high levels of employment;
3
The continued high debt overhang blocking any new financing;
and
Perceived Uncertainties and delays over the Constitution
Making Process.
DEVELOPMENTS IN PRODUCTIVE SECTORS
Agriculture
Tobacco
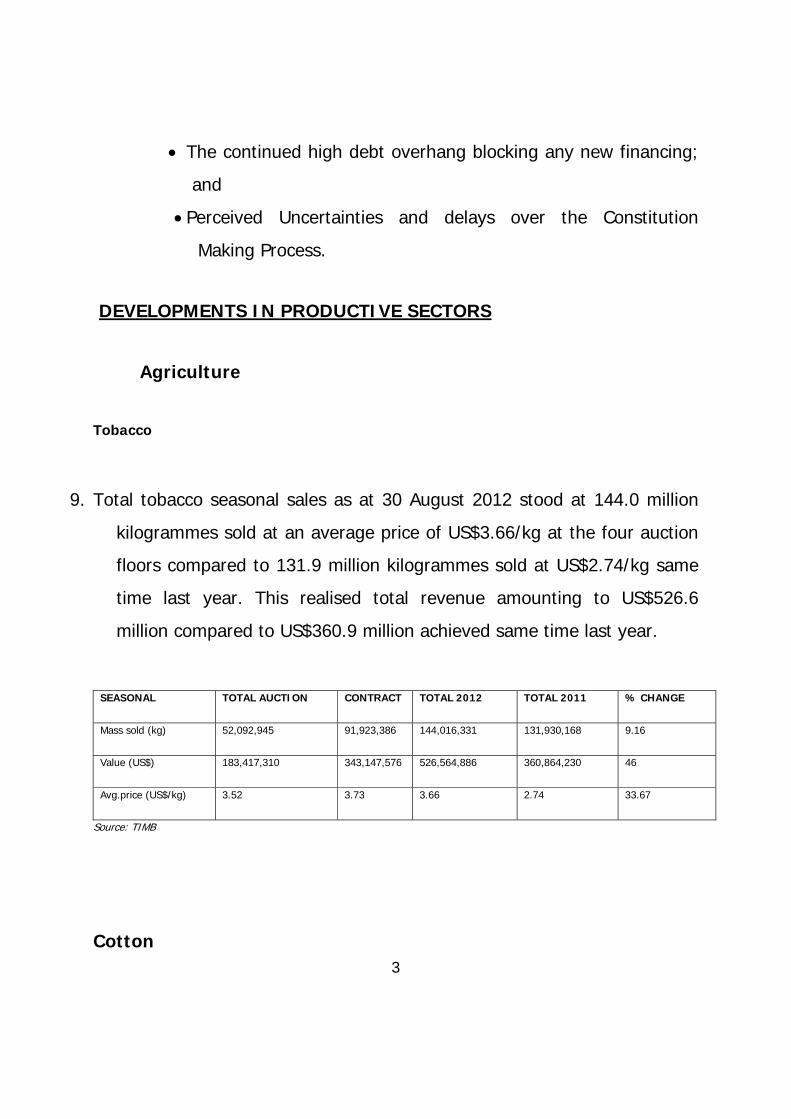
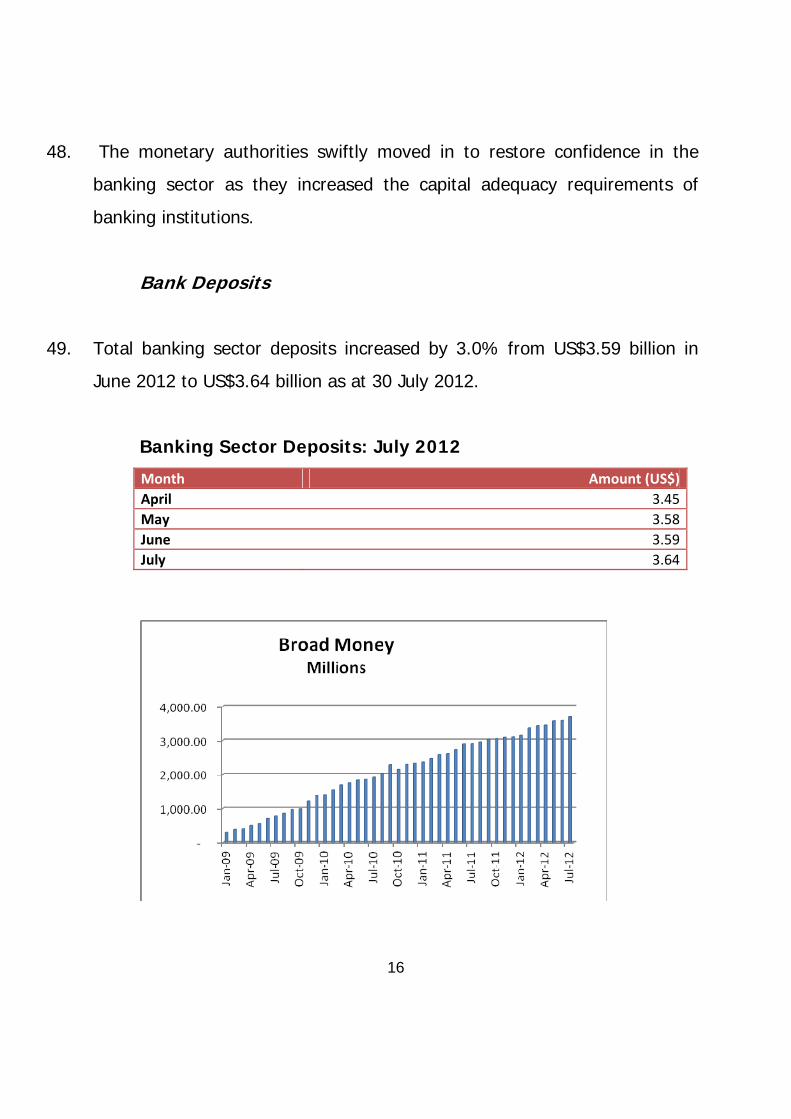
9. Total tobacco seasonal sales as at 30 August 2012 stood at 144.0 million
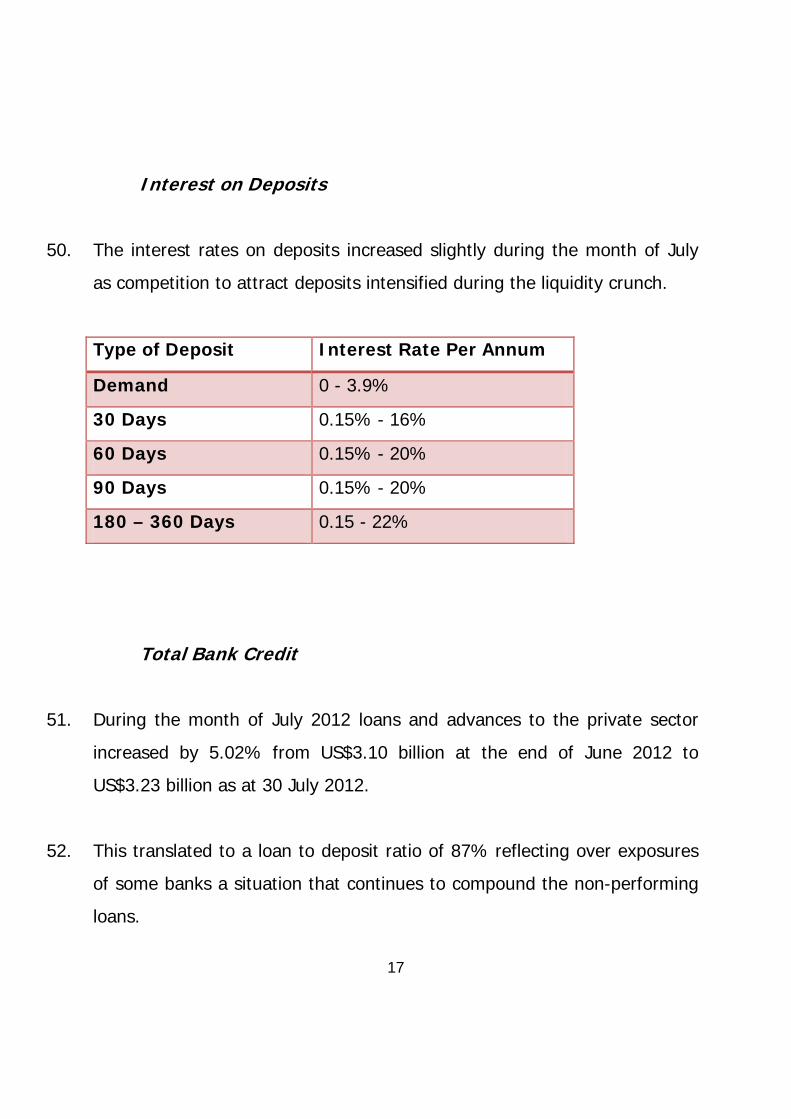
kilogrammes sold at an average price of US$3.66/kg at the four auction
floors compared to 131.9 million kilogrammes sold at US$2.74/kg same
time last year. This realised total revenue amounting to US$526.6
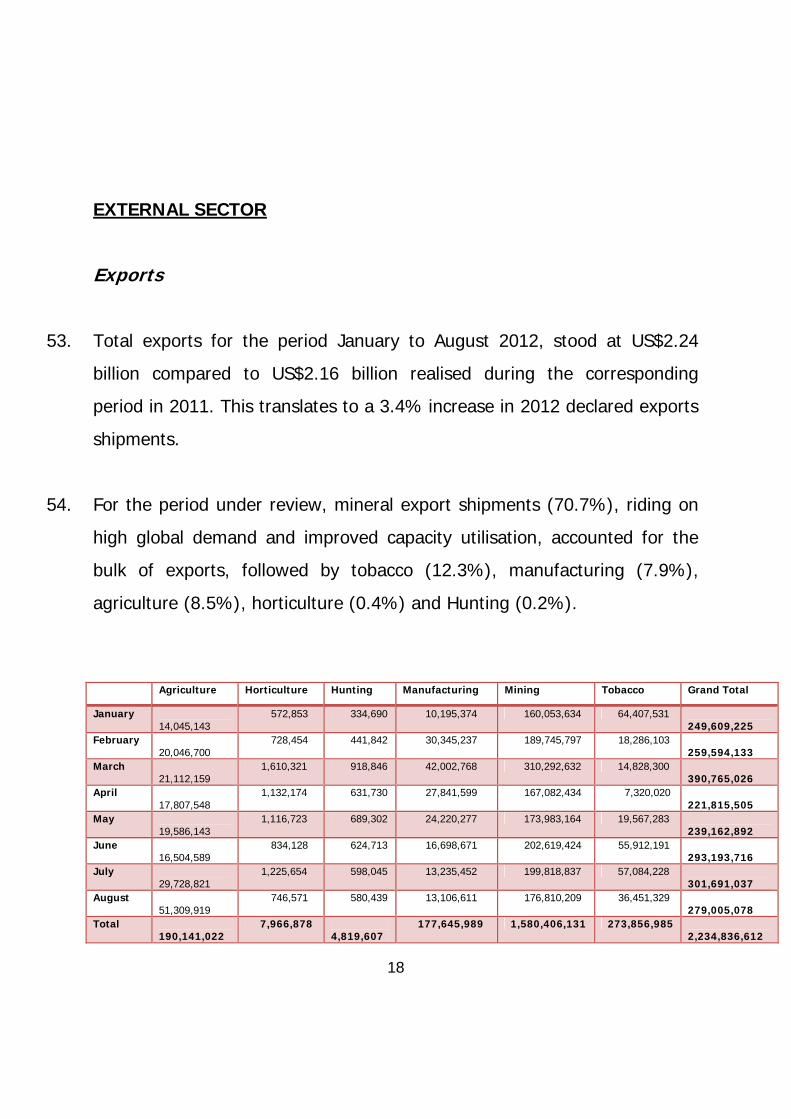
million compared to US$360.9 million achieved same time last year.
SEASONAL TOTAL AUCTION CONTRACT TOTAL 2012 TOTAL 2011 % CHANGE
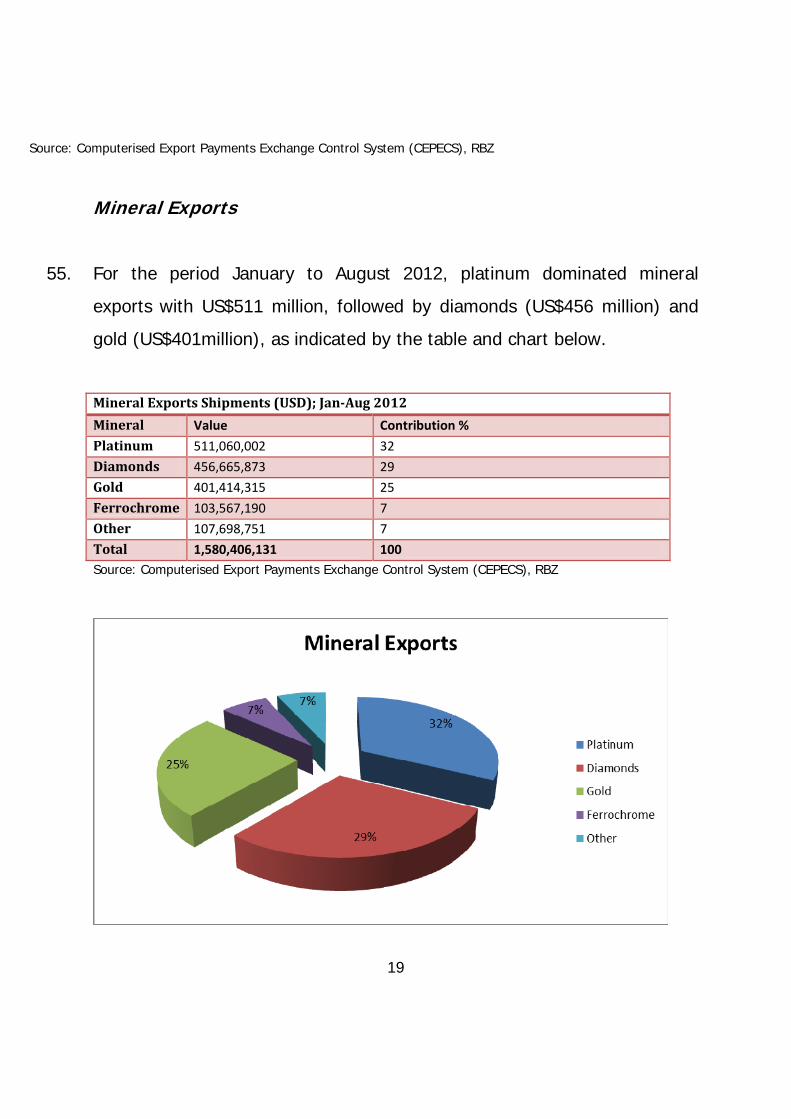
Mass sold (kg) 52,092,945 91,923,386 144,016,331 131,930,168 9.16
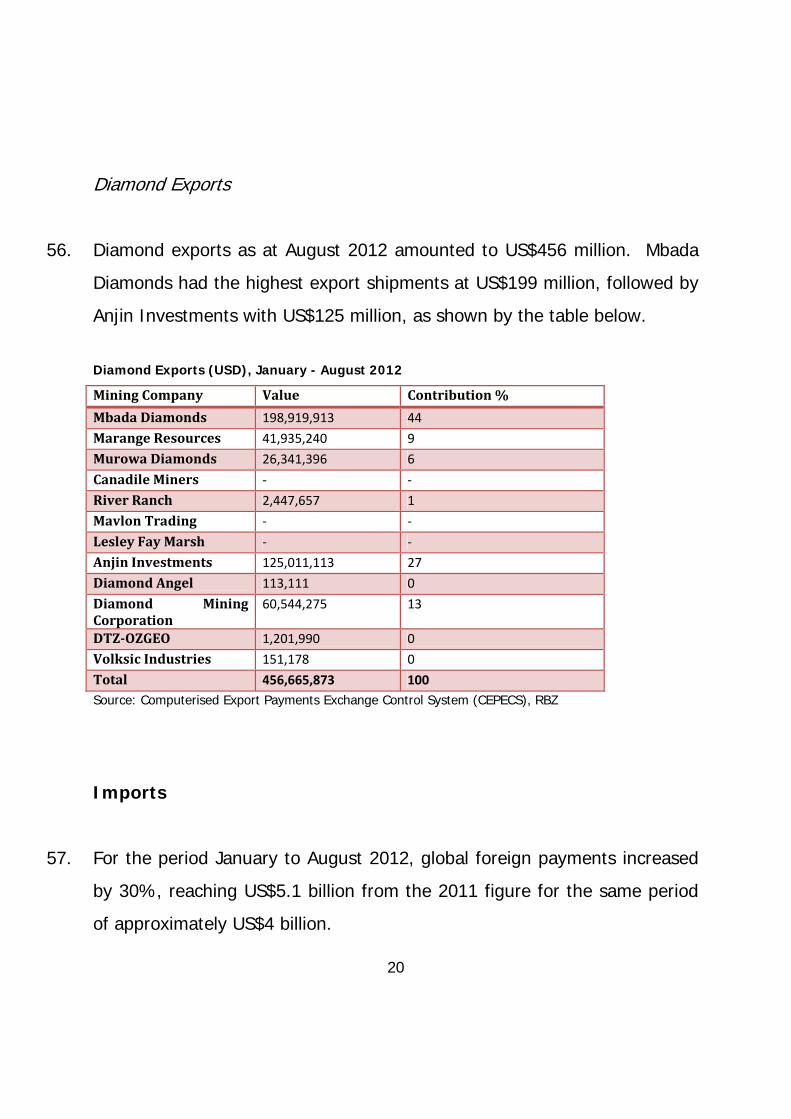
Value (US$) 183,417,310 343,147,576 526,564,886 360,864,230 46
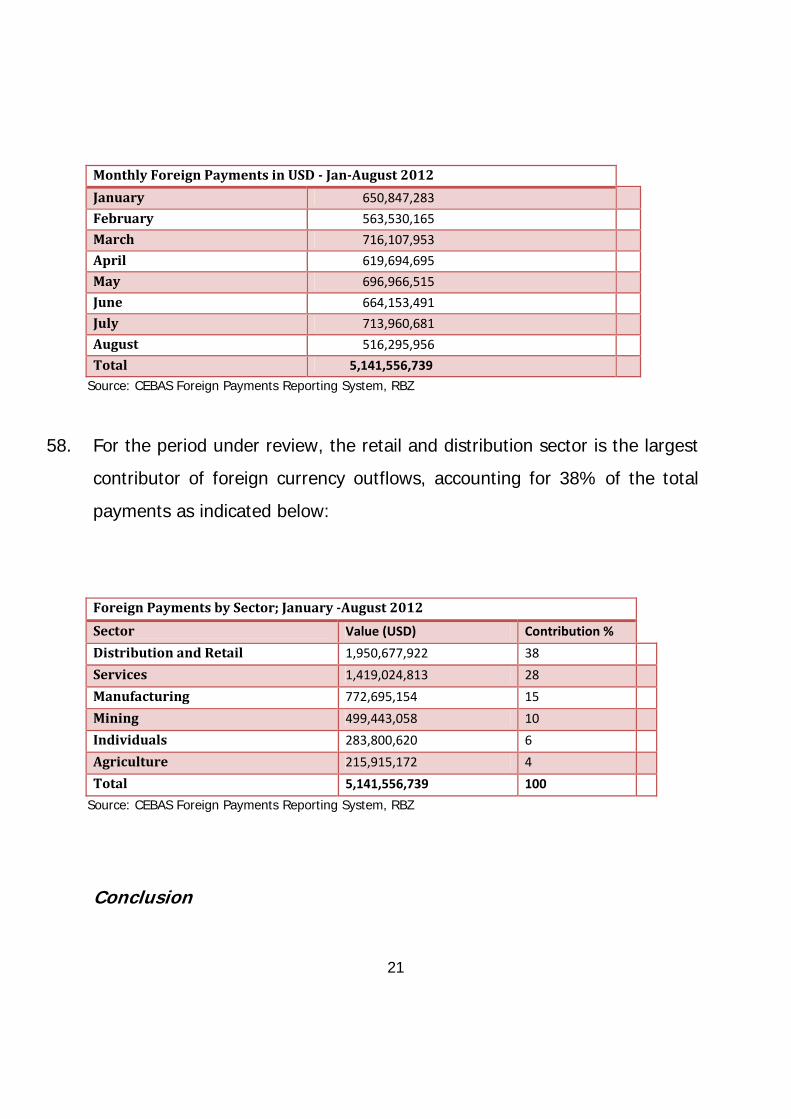
Avg.price (US$/kg) 3.52 3.73 3.66 2.74 33.67
Source: TIMB
Cotton

4
10. As at 17 August 2012, an estimated 304 112 tonnes of seed cotton had
been delivered countrywide. The intake has surpassed the expected
total intake by 9%. Buyers are paying prices ranging from US$0.30 –
US$0.40/kg as reflected below:
Contractor / Buyer Average Prices Offered
Cottco US$0.35/kg
SinoZim US$0.35/kg
Alliance US$0.35/kg
Cargill US$0.35/kg
Grafax US$0.35 – US$0.40/kg
Romsdale US$0.30 – US$0.35/kg
Olam US$0.30 – US$0.35/kg
Viridis US$0.35/kg
Fahad US$0.33/kg
SouthernCotton US$0.35/kg
Cotzim US$0.30/kg
Insing US$0.35/kg
Parrogate US$0.30 – US$0.35/kg
Jinmac US$0.35/kg
Source: Agricultural Marketing Authority (AMA)
5
Grain Deliveries to GMB
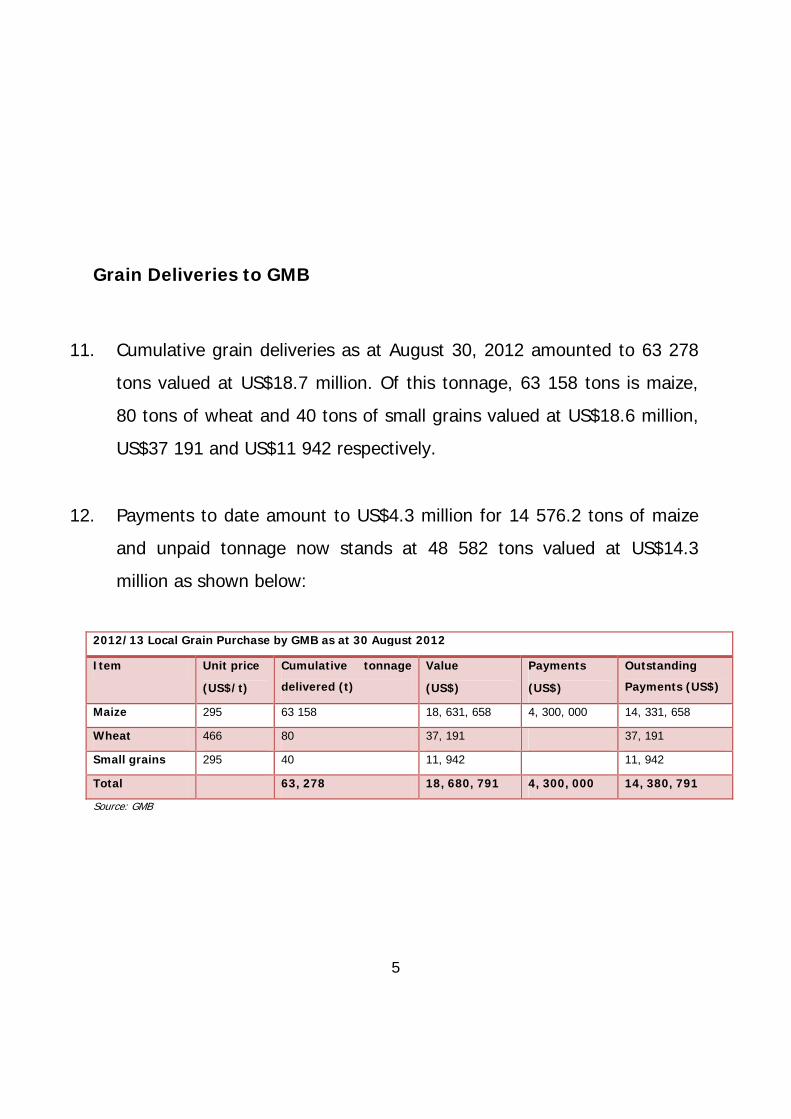
11. Cumulative grain deliveries as at August 30, 2012 amounted to 63 278
tons valued at US$18.7 million. Of this tonnage, 63 158 tons is maize,
80 tons of wheat and 40 tons of small grains valued at US$18.6 million,
US$37 191 and US$11 942 respectively.
12. Payments to date amount to US$4.3 million for 14 576.2 tons of maize
and unpaid tonnage now stands at 48 582 tons valued at US$14.3
million as shown below:
2012/13 Local Grain Purchase by GMB as at 30 August 2012
Item Unit price
(US$/t)
Cumulative tonnage
delivered (t)
Value
(US$)
Payments
(US$)
Outstanding
Payments (US$)
Maize 295 63 158 18, 631, 658 4, 300, 000 14, 331, 658
Wheat 466 80 37, 191 37, 191
Small grains 295 40 11, 942 11, 942
Total 63, 278 18, 680, 791 4, 300, 000 14, 380, 791
Source: GMB
6
Mining
Gold Production
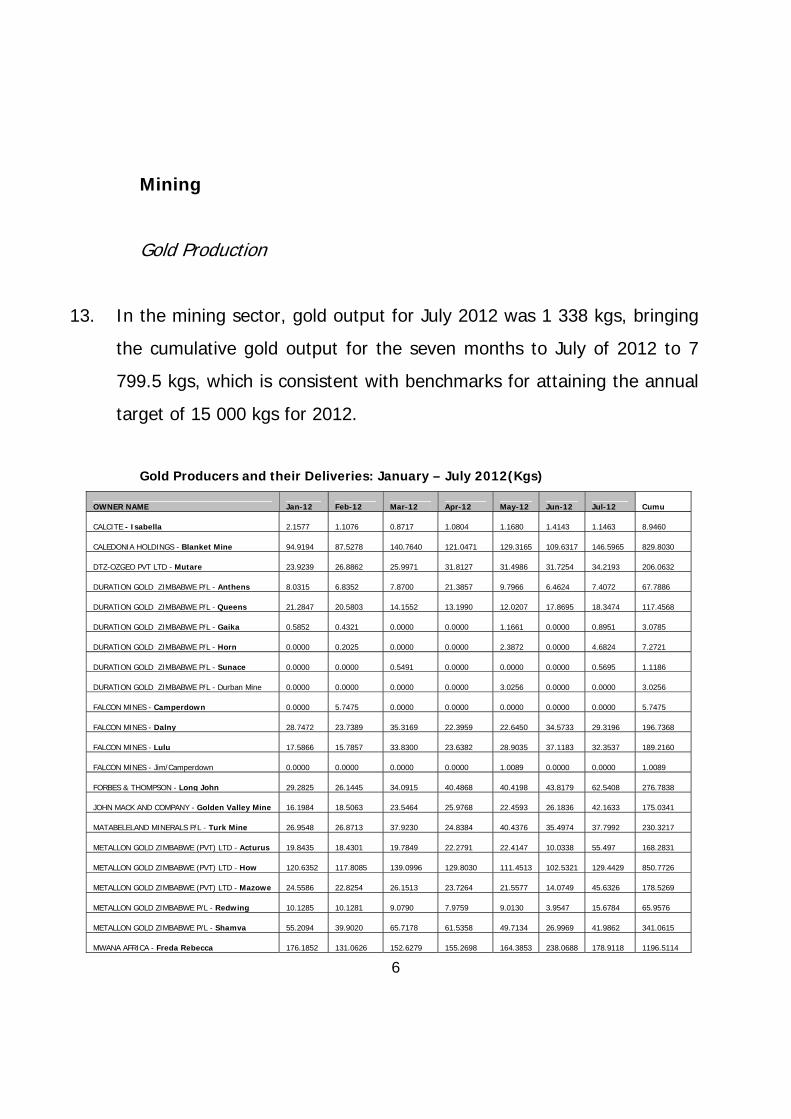
13. In the mining sector, gold output for July 2012 was 1 338 kgs, bringing
the cumulative gold output for the seven months to July of 2012 to 7
799.5 kgs, which is consistent with benchmarks for attaining the annual
target of 15 000 kgs for 2012.
Gold Producers and their Deliveries: January – July 2012(Kgs)
OWNER NAME Jan-12 Feb-12 Mar-12 Apr-12 May-12 Jun-12 Jul-12 Cumu
CALCITE - Isabella 2.1577 1.1076 0.8717 1.0804 1.1680 1.4143 1.1463 8.9460
CALEDONIA HOLDINGS - Blanket Mine 94.9194 87.5278 140.7640 121.0471 129.3165 109.6317 146.5965 829.8030
DTZ-OZGEO PVT LTD - Mutare 23.9239 26.8862 25.9971 31.8127 31.4986 31.7254 34.2193 206.0632
DURATION GOLD ZIMBABWE P/L - Anthens 8.0315 6.8352 7.8700 21.3857 9.7966 6.4624 7.4072 67.7886
DURATION GOLD ZIMBABWE P/L - Queens 21.2847 20.5803 14.1552 13.1990 12.0207 17.8695 18.3474 117.4568
DURATION GOLD ZIMBABWE P/L - Gaika 0.5852 0.4321 0.0000 0.0000 1.1661 0.0000 0.8951 3.0785
DURATION GOLD ZIMBABWE P/L - Horn 0.0000 0.2025 0.0000 0.0000 2.3872 0.0000 4.6824 7.2721
DURATION GOLD ZIMBABWE P/L - Sunace 0.0000 0.0000 0.5491 0.0000 0.0000 0.0000 0.5695 1.1186
DURATION GOLD ZIMBABWE P/L - Durban Mine 0.0000 0.0000 0.0000 0.0000 3.0256 0.0000 0.0000 3.0256
FALCON MINES - Camperdown 0.0000 5.7475 0.0000 0.0000 0.0000 0.0000 0.0000 5.7475
FALCON MINES - Dalny 28.7472 23.7389 35.3169 22.3959 22.6450 34.5733 29.3196 196.7368
FALCON MINES - Lulu 17.5866 15.7857 33.8300 23.6382 28.9035 37.1183 32.3537 189.2160
FALCON MINES - Jim/Camperdown 0.0000 0.0000 0.0000 0.0000 1.0089 0.0000 0.0000 1.0089
FORBES & THOMPSON - Long John 29.2825 26.1445 34.0915 40.4868 40.4198 43.8179 62.5408 276.7838
JOHN MACK AND COMPANY - Golden Valley Mine 16.1984 18.5063 23.5464 25.9768 22.4593 26.1836 42.1633 175.0341
MATABELELAND MINERALS P/L - Turk Mine 26.9548 26.8713 37.9230 24.8384 40.4376 35.4974 37.7992 230.3217
METALLON GOLD ZIMBABWE (PVT) LTD - Acturus 19.8435 18.4301 19.7849 22.2791 22.4147 10.0338 55.497 168.2831
METALLON GOLD ZIMBABWE (PVT) LTD - How 120.6352 117.8085 139.0996 129.8030 111.4513 102.5321 129.4429 850.7726
METALLON GOLD ZIMBABWE (PVT) LTD - Mazowe 24.5586 22.8254 26.1513 23.7264 21.5577 14.0749 45.6326 178.5269
METALLON GOLD ZIMBABWE P/L - Redwing 10.1285 10.1281 9.0790 7.9759 9.0130 3.9547 15.6784 65.9576
METALLON GOLD ZIMBABWE P/L - Shamva 55.2094 39.9020 65.7178 61.5358 49.7134 26.9969 41.9862 341.0615
MWANA AFRICA - Freda Rebecca 176.1852 131.0626 152.6279 155.2698 164.3853 238.0688 178.9118 1196.5114
7
OWNER NAME Jan-12 Feb-12 Mar-12 Apr-12 May-12 Jun-12 Jul-12 Cumu
OLYMPUS GOLD MINES - Old Nic 7.3594 6.0431 4.8400 8.6195 8.6908 5.4517 4.6641 45.6686
PAN AFRICAN MINING P/L - Ayrshire (Last Shot) 14.6815 12.4052 24.5346 20.9174 24.4991 52.6530 35.4543 185.1451
PAN AFRICAN MINING P/L - Muriel 6.1270 4.1176 5.6241 7.7561 4.8259 9.7094 8.4407 46.6008
PAN REEF MINING COMPANY PVT LTD - Indarama 2.4583 4.0068 1.8794 6.5328 10.5898 2.1850 6.1897 33.8418
RIO TINTO ZIMBABWE LTD - Renco 47.5654 49.7189 66.6829 27.0943 47.7304 56.4038 72.7191 367.9148
STEWART F A (PVT) LTD - Jessie 9.7951 8.6817 7.6511 11.0975 8.4367 5.2962 9.7991 60.7574
STEWART F A (PVT) LTD - Londan Wall 0.0000 0.0000 0.0000 0.0000 0.3712 0.2120 0.0000 0.5832
ZMDC - Jena Mines (pvt) ltd. 28.0028 35.2626 28.5304 29.3366 22.7709 20.0569 24.8240 188.7842
ZMDC - Sabi Consolidated Mines (pvt)ltd 20.6139 14.8623 19.8457 21.0651 14.3887 15.9101 7.8210 114.5068
other Small producers 240.3243 192.3611 218.4952
253.4884 208.4410 239.1026 282.9456 1635.1582
Total 1053.16 927.9819 1145.4588
858.8703 867.0923 907.8331 1055.1012 7799.4752
Source: Fidelity Printers
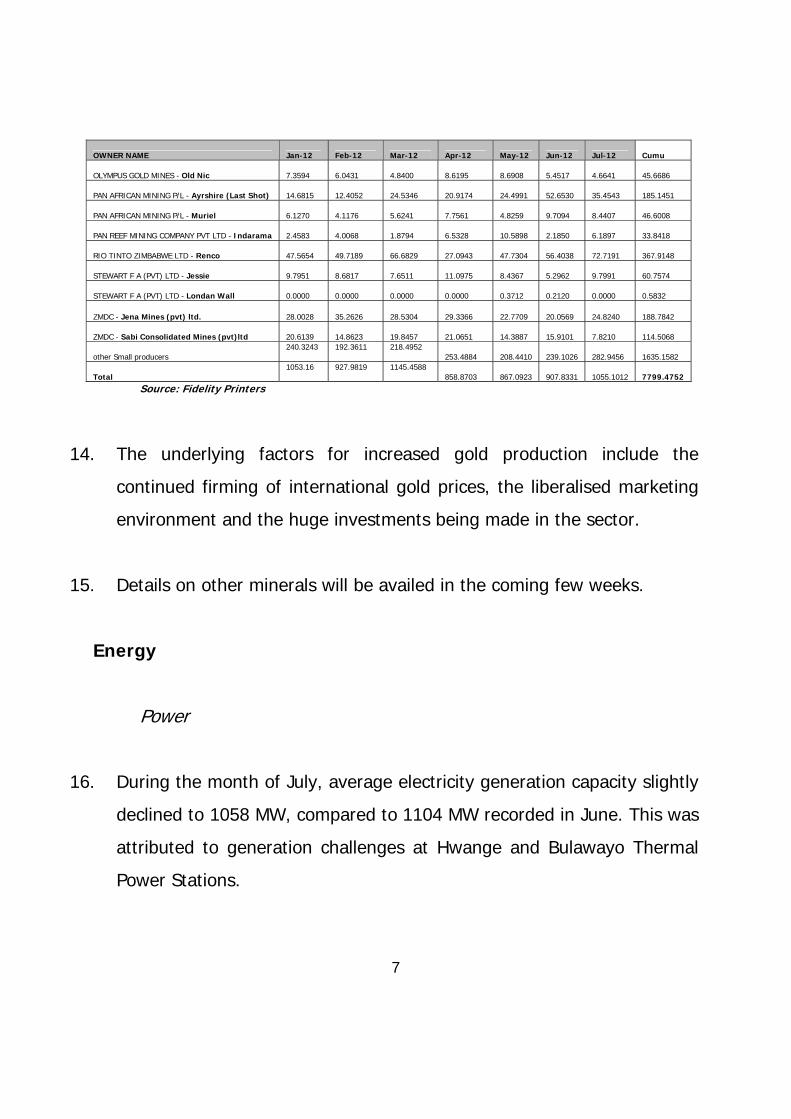
14. The underlying factors for increased gold production include the
continued firming of international gold prices, the liberalised marketing
environment and the huge investments being made in the sector.
15. Details on other minerals will be availed in the coming few weeks.
Energy
Power
16. During the month of July, average electricity generation capacity slightly
declined to 1058 MW, compared to 1104 MW recorded in June. This was
attributed to generation challenges at Hwange and Bulawayo Thermal
Power Stations.
8
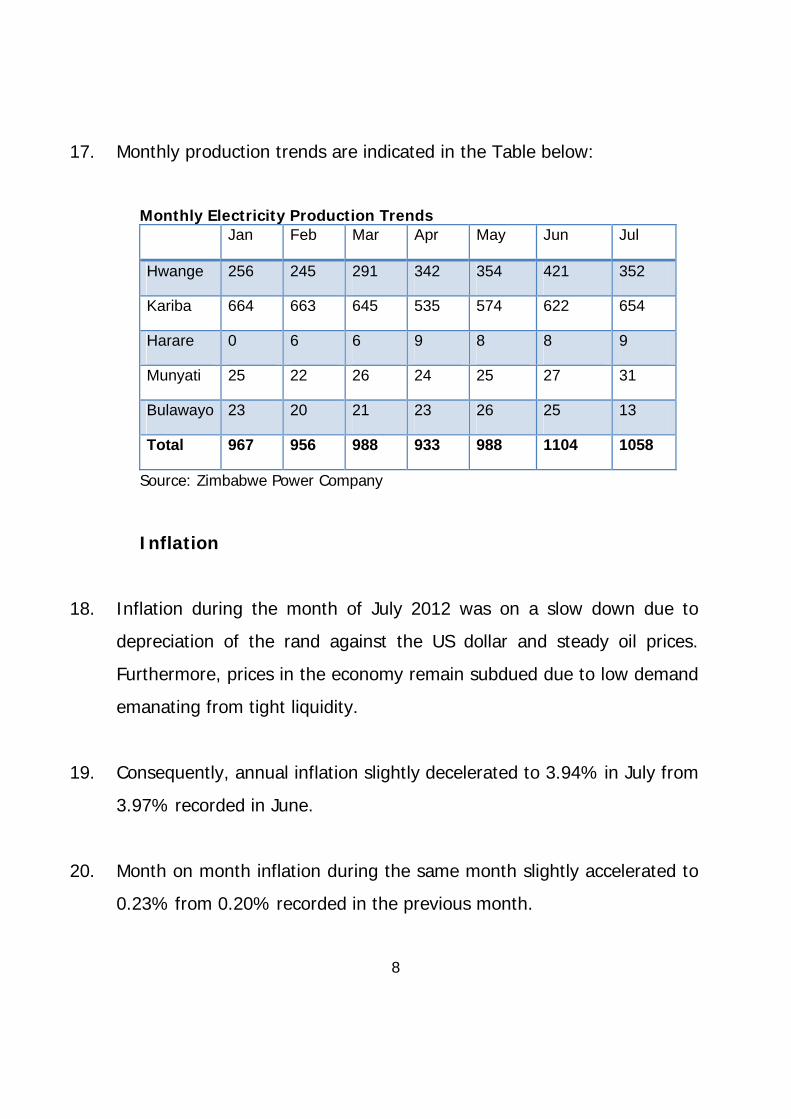
17. Monthly production trends are indicated in the Table below:
Monthly Electricity Production Trends Jan Feb Mar Apr May Jun Jul
Hwange 256 245 291 342 354 421 352
Kariba 664 663 645 535 574 622 654
Harare 0 6 6 9 8 8 9
Munyati 25 22 26 24 25 27 31
Bulawayo 23 20 21 23 26 25 13
Total 967 956 988 933 988 1104 1058
Source: Zimbabwe Power Company
Inflation
18. Inflation during the month of July 2012 was on a slow down due to
depreciation of the rand against the US dollar and steady oil prices.
Furthermore, prices in the economy remain subdued due to low demand
emanating from tight liquidity.
19. Consequently, annual inflation slightly decelerated to 3.94% in July from
3.97% recorded in June.
20. Month on month inflation during the same month slightly accelerated to
0.23% from 0.20% recorded in the previous month.
9
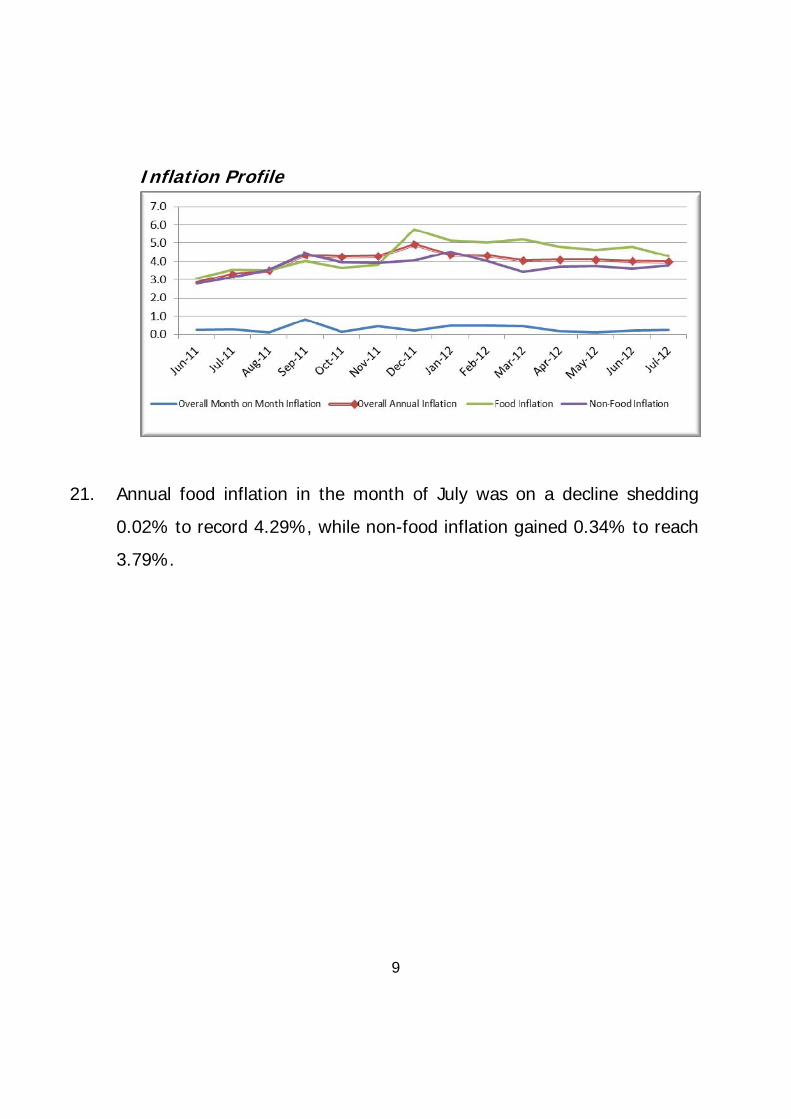
Inflation Profile
21. Annual food inflation in the month of July was on a decline shedding
0.02% to record 4.29%, while non-food inflation gained 0.34% to reach
3.79%.
10
GOVERNMENT FINANCES
Revenues: July - August 2012
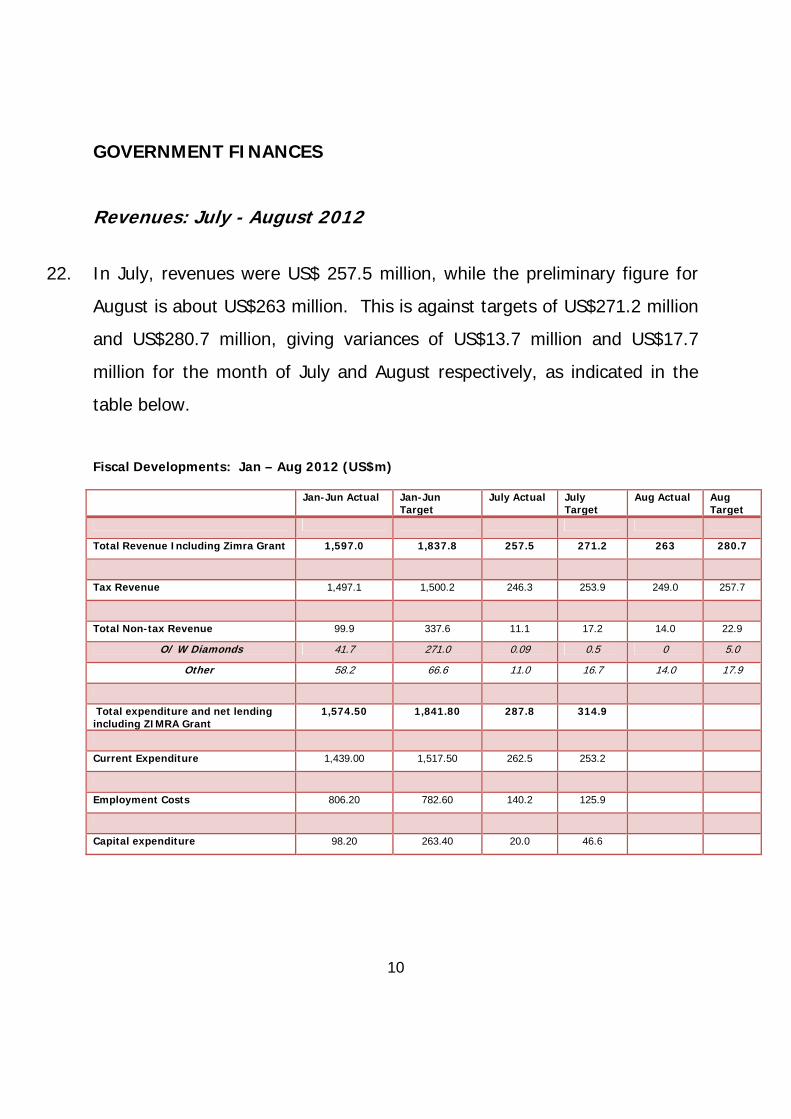
22. In July, revenues were US$ 257.5 million, while the preliminary figure for
August is about US$263 million. This is against targets of US$271.2 million
and US$280.7 million, giving variances of US$13.7 million and US$17.7
million for the month of July and August respectively, as indicated in the
table below.
Fiscal Developments: Jan – Aug 2012 (US$m)
Jan-Jun Actual Jan-Jun Target
July Actual July Target
Aug Actual Aug Target
Total Revenue Including Zimra Grant 1,597.0 1,837.8 257.5 271.2 263 280.7
Tax Revenue 1,497.1 1,500.2 246.3 253.9 249.0 257.7
Total Non-tax Revenue 99.9 337.6 11.1 17.2 14.0 22.9
O/ W Diamonds 41.7 271.0 0.09 0.5 0 5.0
Other 58.2 66.6 11.0 16.7 14.0 17.9
Total expenditure and net lending including ZIMRA Grant
1,574.50 1,841.80 287.8 314.9
Current Expenditure 1,439.00 1,517.50 262.5 253.2
Employment Costs 806.20 782.60 140.2 125.9
Capital expenditure 98.20 263.40 20.0 46.6
11
Expenditures
23. The under-performance of revenues continues to affect Government
capacity to support and implement critical planned programmes and
projects.
24. During the last week of July, the only funding availed was with respect to
the following areas:
Payments to Inputs Suppliers (US$5 million);
Livestock Drought Mitigation (US$2 million);
Tokwe Mukorsi (US$3 million);
War Veterans’ School Fees (US$6.2 million);
Population Census (US$8.5 million);
Roads Rehabilitation and Upgrading (US$5 million).
25. See also Annex 1 on Progress in the Implementation of Various Projects
Payments to Inputs Suppliers
26. An amount of US$5 million was disbursed towards payments to inputs
suppliers.
27. Notwithstanding this, Government still owes agricultural input suppliers
some US$51.4 million arising from support facilities for the past season.
12
28. Further to the above debt, the GMB has incurred outstanding payments to
farmers for grain delivered from the past season (US$4.4 million) as well as
the current season (US$14.4 million).
29. Treasury will continue to prioritise the settlement of outstanding amounts
for grain delivered and input supplies in order to capacitate these key
agriculture players for the coming season.
Livestock Drought Mitigation
30. Resources amounting to US$3 million were availed during the week
towards the livestock drought mitigation programme targeting regions
where livestock is under threat from the impact of drought.
31. The above amount is against the Ministry of Agriculture’s overall
requirement of US$98.2 million.
Tokwe Mukorsi
32. Outstanding certificates for work done at the Tokwe Mukorsi Dam project
currently stand at US$13.3 million. Non-payment of certificates due to
contractors slows down implementation of projects.
13
33. During the past week, Treasury was only able to avail a sum of US$3
million, leaving a balance of US$10.3 million.
War Veterans Benefits
34. Treasury disbursed an amount of US$6.2 million towards school fees for
the third school term of 2012.
35. This is in line with the undertaking made in 2011 that funding for school
fees for our war veterans’ children be disbursed at least 7 days before
commencement of a given term.
The 2012 Population Census
36. The 2012 Population Census had a funding requirement of around US$40
million. By the time the exercise commenced, Treasury had availed about
US$16.1 million. On the other hand, out of the US$12.6 million pledged by
development partners, only US$3.4 million had actually been disbursed.
37. During the past week, Treasury availed to ZIMSTAT US$8.5 million,
bringing the total disbursements to US$24.6 million.
38. Clearly, there is still a funding gap of at least US$10 million with regards to
enumerators’ expenses which ZIMSTAT has been able to pay only partially.
14
Roads Rehabilitation and Upgrading
39. We have on-going roads rehabilitation and upgrading under which huge
amounts of money are required. Only US$5 million was disbursed last
week towards the Harare – Mutare road dualisation project.
40. The limited budgetary support for road rehabilitation and maintenance
programmes across the country will affect the condition of most of the
roads, particularly as we approach the next rainy season.
41. Notable progress is being witnessed on the private sector funded Plumtree
– Bulawayo – Harare – Mutare road upgrading, especially the stretch
between Plumtree and Bulawayo. This is under the US$206 million facility.
Preparations for the 2012 Thirteenth Cheque
42. Over the past three years, the strategy has been to set aside resources
from monthly revenue receipts in readiness for the thirteenth cheque.
43. However, given the persistent revenue underperformance, it has not been
possible so far to set aside any resources to cater for the US$150 million
that will be required to pay for the 2012 bonus. The plan had been to set
15
aside at least US$7.5 million per week over the next three months, starting
in August 2012.
44. The above budgetary under-performance is cause for serious concern.
45. Mindful of this, the Ministry of Finance has enlisted the support of the
ZIMRA Board in addressing any possible leakages, especially those relating
to our ports of entry. Furthermore, the Ministry has engaged the Ministry
of Mines and Mining Development with a view of assessing both
outstanding and future diamond revenue remittances to the fiscus.
46. Overall, it is critical that as Government we focus efforts towards resource
mobilisation, including re-engagement of the international community and
in particular the implementation of the Zimbabwe Accelerated Arrears
Clearance and Debt Strategy (ZAADS). The objective is to be able to
access funding from offshore as reliance on our domestic revenues will not
sustain our critical developmental requirements.
FINANCIAL SECTOR
47. The liquidity crisis which gripped the economy, heightened in the month of
July as yet another bank, Royal Banking Corporation was closed further
exacerbating confidence crisis in the financial sector.
16
48. The monetary authorities swiftly moved in to restore confidence in the
banking sector as they increased the capital adequacy requirements of
banking institutions.
Bank Deposits
49. Total banking sector deposits increased by 3.0% from US$3.59 billion in
June 2012 to US$3.64 billion as at 30 July 2012.
Banking Sector Deposits: July 2012
Month Amount (US$)
April 3.45
May 3.58
June 3.59
July 3.64
17
Interest on Deposits
50. The interest rates on deposits increased slightly during the month of July
as competition to attract deposits intensified during the liquidity crunch.
Type of Deposit Interest Rate Per Annum
Demand 0 - 3.9%
30 Days 0.15% - 16%
60 Days 0.15% - 20%
90 Days 0.15% - 20%
180 – 360 Days 0.15 - 22%
Total Bank Credit
51. During the month of July 2012 loans and advances to the private sector
increased by 5.02% from US$3.10 billion at the end of June 2012 to
US$3.23 billion as at 30 July 2012.
52. This translated to a loan to deposit ratio of 87% reflecting over exposures
of some banks a situation that continues to compound the non-performing
loans.
18
EXTERNAL SECTOR
Exports
53. Total exports for the period January to August 2012, stood at US$2.24
billion compared to US$2.16 billion realised during the corresponding
period in 2011. This translates to a 3.4% increase in 2012 declared exports
shipments.
54. For the period under review, mineral export shipments (70.7%), riding on
high global demand and improved capacity utilisation, accounted for the
bulk of exports, followed by tobacco (12.3%), manufacturing (7.9%),
agriculture (8.5%), horticulture (0.4%) and Hunting (0.2%).
Agriculture Horticulture Hunting Manufacturing Mining Tobacco Grand Total
January 14,045,143
572,853 334,690 10,195,374 160,053,634 64,407,531 249,609,225
February 20,046,700
728,454 441,842 30,345,237 189,745,797 18,286,103 259,594,133
March 21,112,159
1,610,321 918,846 42,002,768 310,292,632 14,828,300 390,765,026
April 17,807,548
1,132,174 631,730 27,841,599 167,082,434 7,320,020 221,815,505
May 19,586,143
1,116,723 689,302 24,220,277 173,983,164 19,567,283 239,162,892
June 16,504,589
834,128 624,713 16,698,671 202,619,424 55,912,191 293,193,716
July 29,728,821
1,225,654 598,045 13,235,452 199,818,837 57,084,228 301,691,037
August 51,309,919
746,571 580,439 13,106,611 176,810,209 36,451,329 279,005,078
Total 190,141,022
7,966,878 4,819,607
177,645,989 1,580,406,131 273,856,985 2,234,836,612
19
Source: Computerised Export Payments Exchange Control System (CEPECS), RBZ
Mineral Exports
55. For the period January to August 2012, platinum dominated mineral
exports with US$511 million, followed by diamonds (US$456 million) and
gold (US$401million), as indicated by the table and chart below.
MineralExportsShipments(USD);Jan‐Aug2012
Mineral Value Contribution %
Platinum 511,060,002 32
Diamonds 456,665,873 29
Gold 401,414,315 25
Ferrochrome 103,567,190 7
Other 107,698,751 7
Total 1,580,406,131 100
Source: Computerised Export Payments Exchange Control System (CEPECS), RBZ
20
Diamond Exports
56. Diamond exports as at August 2012 amounted to US$456 million. Mbada
Diamonds had the highest export shipments at US$199 million, followed by
Anjin Investments with US$125 million, as shown by the table below.
Diamond Exports (USD), January - August 2012
MiningCompany Value Contribution%
MbadaDiamonds 198,919,913 44
MarangeResources 41,935,240 9
MurowaDiamonds 26,341,396 6
CanadileMiners ‐ ‐
RiverRanch 2,447,657 1
MavlonTrading ‐ ‐
LesleyFayMarsh ‐ ‐
AnjinInvestments 125,011,113 27
DiamondAngel 113,111 0
Diamond MiningCorporation
60,544,275 13
DTZ‐OZGEO 1,201,990 0
VolksicIndustries 151,178 0
Total 456,665,873 100
Source: Computerised Export Payments Exchange Control System (CEPECS), RBZ
Imports
57. For the period January to August 2012, global foreign payments increased
by 30%, reaching US$5.1 billion from the 2011 figure for the same period
of approximately US$4 billion.
21
MonthlyForeignPaymentsinUSD‐Jan‐August2012
January 650,847,283
February 563,530,165
March 716,107,953
April 619,694,695
May 696,966,515
June 664,153,491
July 713,960,681
August 516,295,956
Total 5,141,556,739 Source: CEBAS Foreign Payments Reporting System, RBZ
58. For the period under review, the retail and distribution sector is the largest
contributor of foreign currency outflows, accounting for 38% of the total
payments as indicated below:
ForeignPaymentsbySector;January‐August2012
Sector Value (USD) Contribution %
DistributionandRetail 1,950,677,922 38
Services 1,419,024,813 28
Manufacturing 772,695,154 15
Mining 499,443,058 10
Individuals 283,800,620 6
Agriculture 215,915,172 4
Total 5,141,556,739 100
Source: CEBAS Foreign Payments Reporting System, RBZ
Conclusion
22
59. The above developments will be monitored and I shall, as usual, be issuing
monthly updates.
Hon. T. Biti, MP Minister of Finance 4 August 2012
23
Annex 1:
Progress on Projects Implementation
National University of Science Technology (NUST) Projects
Central Library
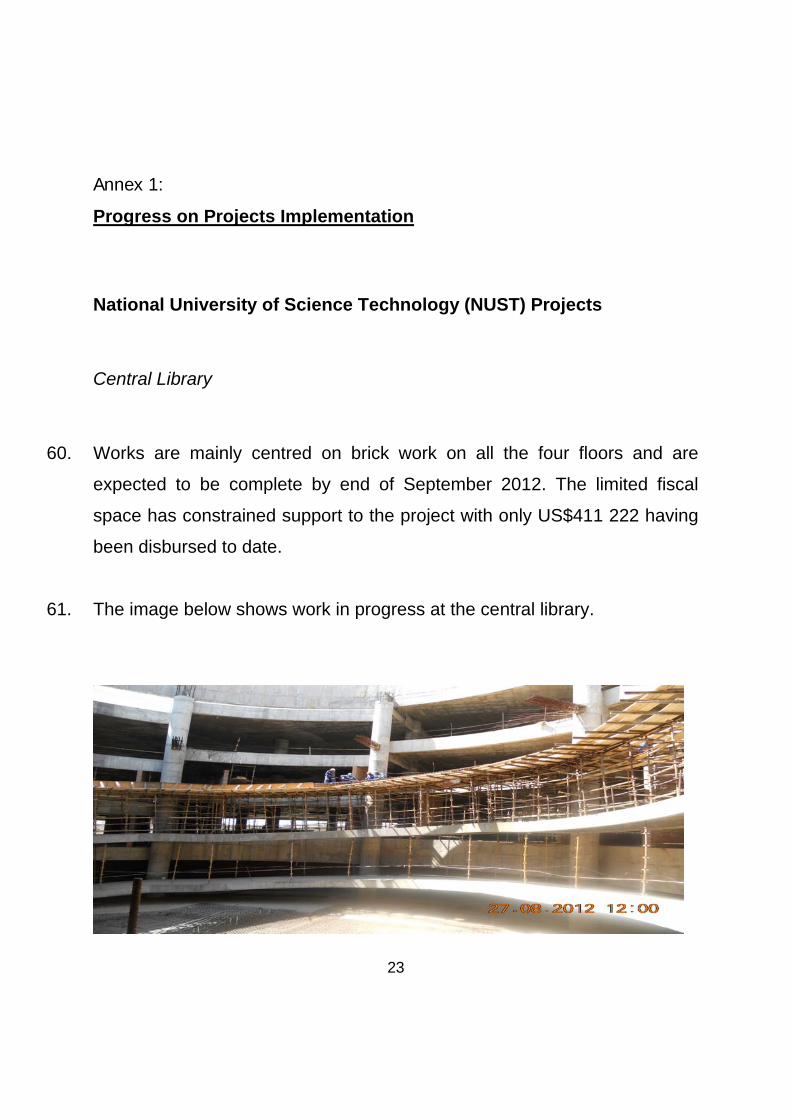
60. Works are mainly centred on brick work on all the four floors and are
expected to be complete by end of September 2012. The limited fiscal
space has constrained support to the project with only US$411 222 having
been disbursed to date.
61. The image below shows work in progress at the central library.

24
Halls of Residence
62. An amount of US$2 million was allocated for the completion of two blocks
with a capacity to accommodate 56 students in 2012.
63. To date US$786 790 has been disbursed. The contractor is on site working
on the remaining works which include painting, glazing, tilling, balustrading,
plumbing and electrical works.
The project is expected to be complete by end of the year.
Chemistry Building
64. The project scope includes equipping 27 laboratories, 10 preparation
rooms and 12 instrument equipment rooms at a cost of US$8.9 million.
65. The sum of US$392 354 has been disbursed to date. Notable progress was
observed on the second floor where works completed include plastering,
flooring, fitting of ceilings, fitting of cupboards, gas pipe work installation in
all the 12 laboratories as well as electrical works.
25
J.M.NKOMO AIRPORT UPGRADING
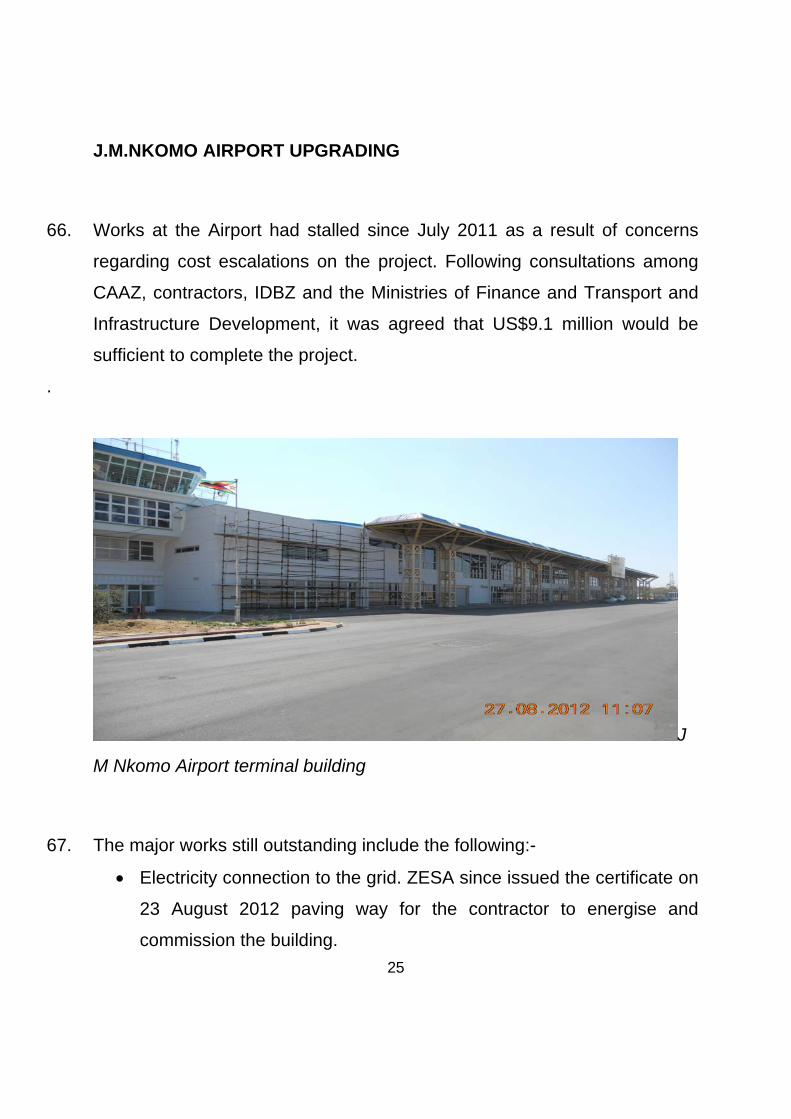
66. Works at the Airport had stalled since July 2011 as a result of concerns
regarding cost escalations on the project. Following consultations among
CAAZ, contractors, IDBZ and the Ministries of Finance and Transport and
Infrastructure Development, it was agreed that US$9.1 million would be
sufficient to complete the project.
.
J
M Nkomo Airport terminal building
67. The major works still outstanding include the following:-
Electricity connection to the grid. ZESA since issued the certificate on
23 August 2012 paving way for the contractor to energise and
commission the building.
26
Water tank and pump installation including reticulation within the
building,
Completion of 4 guard houses,
bumper rails, air-conditioning units , V I P canopy , Immigration
counters, flagpoles for airside and land side,
Airside floodlights, painting, balustrading ,
Furnishing of the building
Minor works include testing and commissioning of the baggage
conveyor belts, plumbing testing and commissioning, road markings,
addressing snags identified in the kitchen, lifts and internal signage.
68. The outstanding works were expected to take eight weeks to complete,
enabling commissioning on 2nd November 2012.
LUPANE COMPOSITE OFFICES
69. There are four, two storey buildings divided into blocks A, B, C and D.
70. A decision was made to concentrate resources and complete blocks A & B
so as to house critical Government departments.
71. Block B has been tiled and partitioned. The outstanding works relates to
electric fittings (switches and plugs), balustrading, painting and roof
covering for the walkway connecting blocks A & B. With regards to Block
A, partitioning and electrical works are in progress. Works at Blocks C and
D are also underway centering on tiling, partitioning and electrical fittings.
27
72. Civil works being carried out at the complex include the fountain and
access roads. The construction of the substation in order to provide
electricity to the offices is also outstanding.
73. The composite offices are expected to be complete beginning November
2012, provided the sub-contractors such as Kuchi for the electricals and
Tega Steel for the walkway roof covering perform.
MTSHABEZI PIPELINE WATER PROJECT
74. Since June 2012, there has been notable progress particularly with regard
to the installation of the three water pump sets and delivery of switchgears.
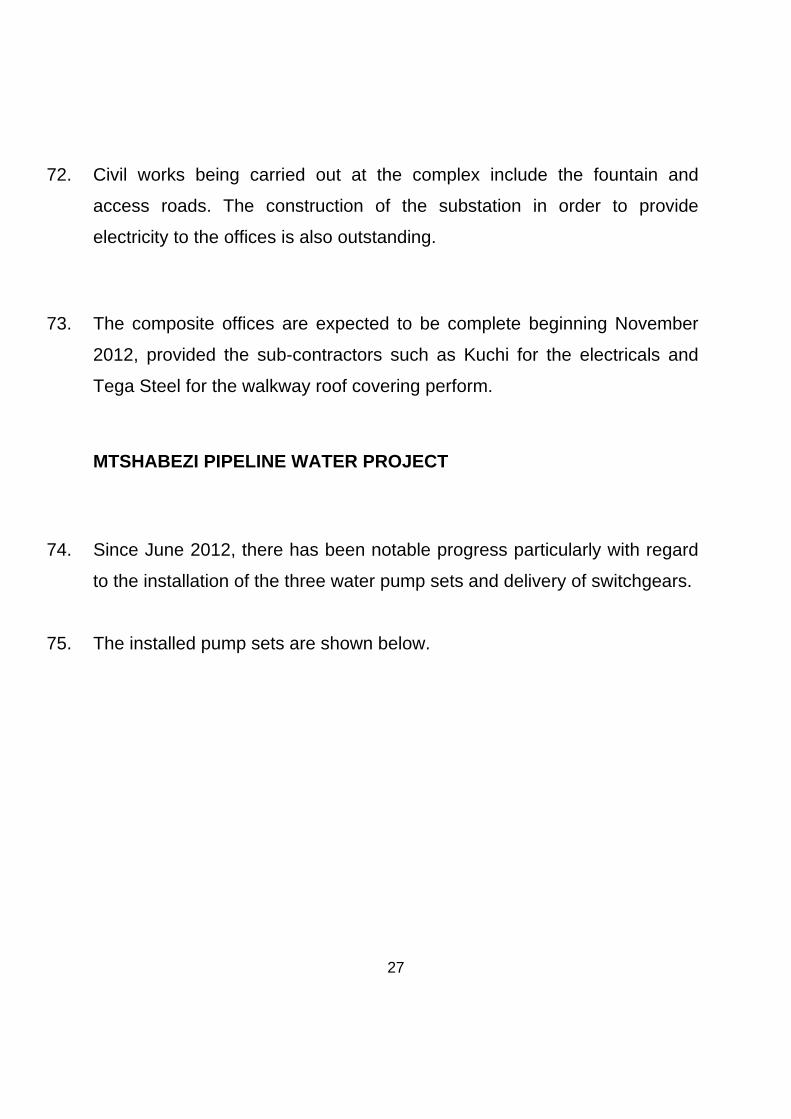
75. The installed pump sets are shown below.
28
Mtshabezi Pump House
76. The Contractor is currently on site undertaking preparatory works for the
laying of the steel pipes which are yet to be fully supplied by Morewear
engineering.
77. In terms of overall progress, the pump house, the three water reservoirs
and pvc pipe laying has all been completed.
78. In addition, the Rural District Council has already identified 7 water points
that the local community residing along the pipe line will use to access raw
water.
29
79. Construction of a 62 km electrical line from Gwanda has commenced and
is expected to be completed by September 30, 2012. However, ZINWA has
procured an 800KVA generator to temporarily power the pump house.
There is need to process payment amounting to US$1 million for the three
pump sets. The project is expected to be complete by 30 September 2012.
LUPANE STATE UNIVERSITY
Faculty Of Agriculture
80. The contractor is currently on site together with other subcontractors
working on the Faculty of Agriculture which consist of the main and
academic blocks.
81. Major works at the Academic block are complete with only final painting
coat still outstanding as well as electricity connection to the building. ZESA
has submitted a quotation of US$4 million for the substation and
transformer. The contract for the electricity connection is still to be
adjudicated.
82. With regards to the Main block, works are at an advanced stage with wall
skimming, painting, installation of roof trusses and office partitioning still
outstanding. In addition, toilet basins and water taps fitting will be carried as
the last task to avoid breakages.
30
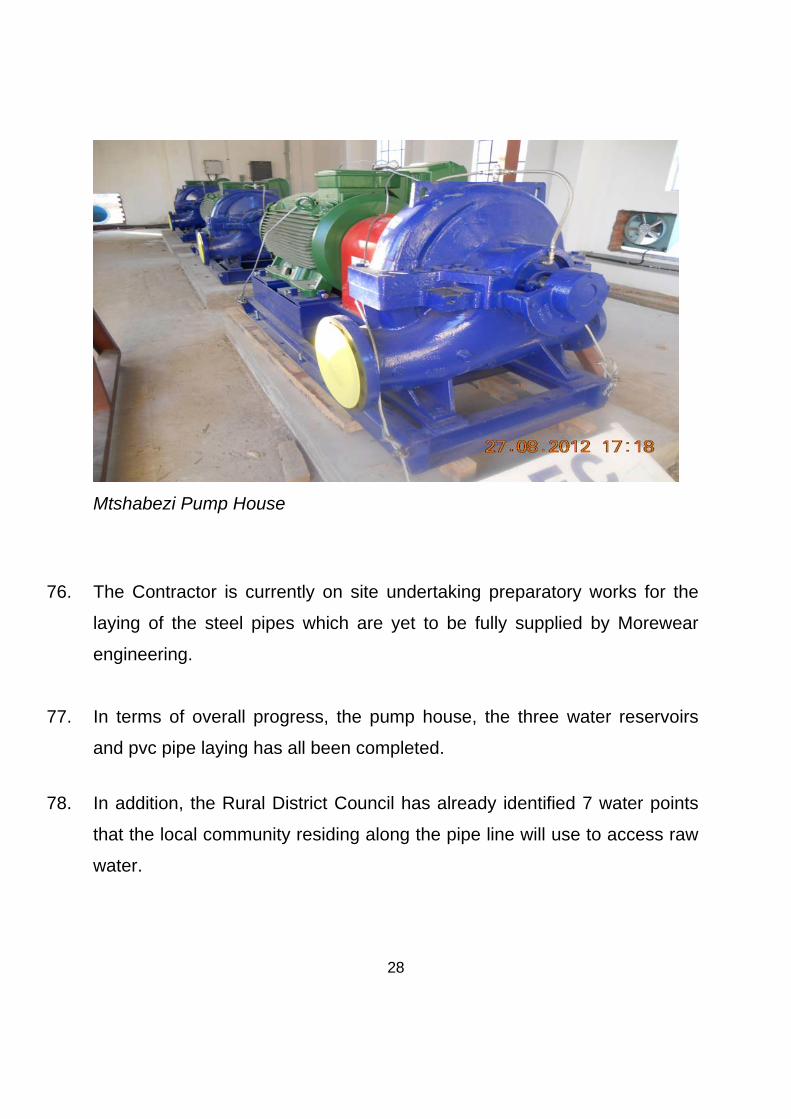
83. Whilst the main contractor has shown capacity and commitment to
implement the project within time, the two subcontractors namely ZECO
Holdings (a subcontractor for roof trusses) and Morewear Engineering (for
the supply and installation of the 55 000 cubic metre water tank) have
stalled progress on the project due to lack of capacity.
84. The significant progress made is shown by the image below.
L
Lupane State University Faculty of Agriculture
Hall of Residencies
31
85. The male hostel block is now ready for first floor decking whilst the female
hostel is now at ground stabilisation. With regards to the dining and kitchen,
foundations have been laid following stabilisation and blinding. In addition,
the two warden’s houses are at wall plate level.
86. Water remains a major challenge hindering implementation of the project.
LUPANE WATER SUPPLY
87. Following the completion of the Bubi Lupane Dam, work is now
concentrated on the construction of a water treatment plant, pump station,
2280m3 reinforced concrete reservoir, laying of 7.5km of the conveyance
system as well as reticulation extension within the town.
The contractor, Multiforce is on site and construction of 2 x 500m3
sedimentation tanks are complete whilst four filter tanks are at various
stages of completion.
88. All the pipes have been delivered to site and trenching has been done
whilst three staff houses have been roofed. The construction of the
treatment plant is expected to be complete by end of December 2012.
89. Outstanding works include construction of a soak way, pump house, office
block, staff toilets at the water treatment plant, completing the filter tanks
pipe laying.

32
90. The major challenge on the project relates to the centralisation of
procurement where catchments can now only procure up to a maximum of
US$4 000, down from US$10 000. Any procurement above US$4 000 is
now referred to the head office. This has slowed procurement of materials,
critical for the implementation of the project.
Listen to the speech in full: Click here