state land leasing program - new york … dec - division of mineral resources 21 nineteenth annual...
TRANSCRIPT
NYS DEC - Division of Mineral Resources 21 Nineteenth Annual Report
New York State Oil, Gas and Mineral Resources, 2002
STATE LAND LEASING PROGRAM
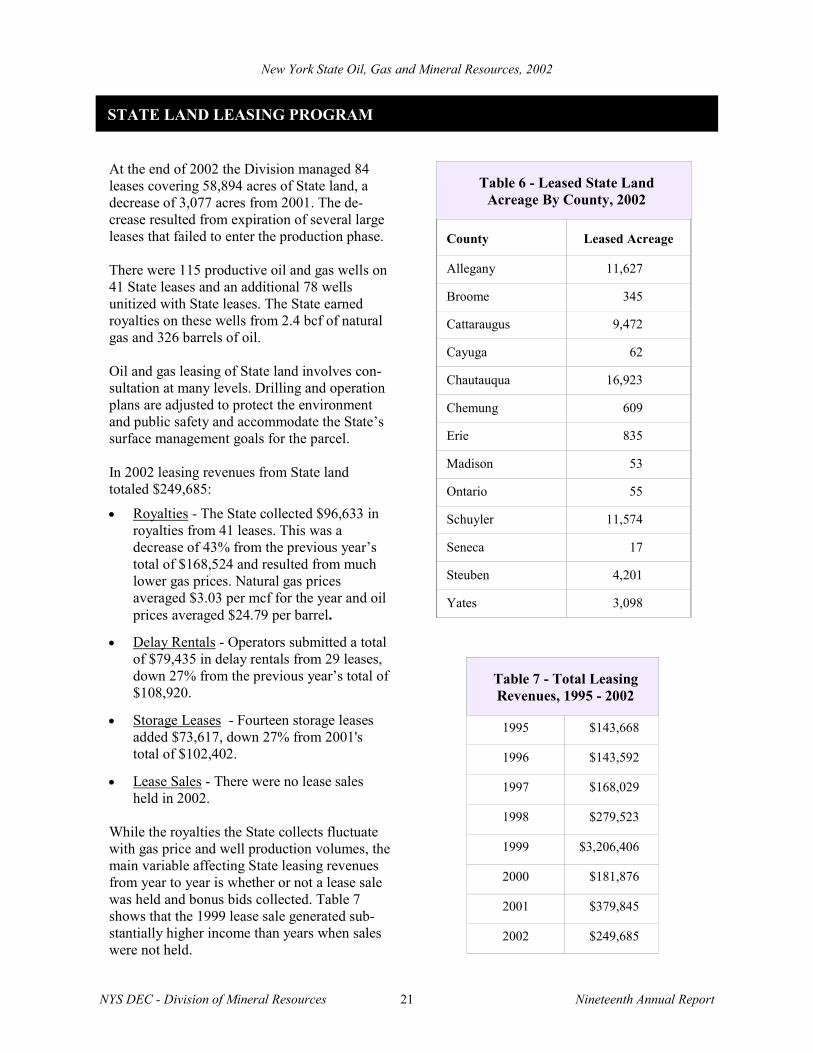
At the end of 2002 the Division managed 84 leases covering 58,894 acres of State land, a decrease of 3,077 acres from 2001. The de- crease resulted from expiration of several large leases that failed to enter the production phase. There were 115 productive oil and gas wells on 41 State leases and an additional 78 wells unitized with State leases. The State earned royalties on these wells from 2.4 bcf of natural gas and 326 barrels of oil. Oil and gas leasing of State land involves con-sultation at many levels. Drilling and operation plans are adjusted to protect the environment and public safety and accommodate the State’s surface management goals for the parcel. In 2002 leasing revenues from State land totaled $249,685:
• Royalties - The State collected $96,633 in royalties from 41 leases. This was a decrease of 43% from the previous year’s total of $168,524 and resulted from much lower gas prices. Natural gas prices averaged $3.03 per mcf for the year and oil prices averaged $24.79 per barrel.
• Delay Rentals - Operators submitted a total of $79,435 in delay rentals from 29 leases, down 27% from the previous year’s total of $108,920.
• Storage Leases - Fourteen storage leases added $73,617, down 27% from 2001's total of $102,402.
• Lease Sales - There were no lease sales held in 2002.
While the royalties the State collects fluctuate with gas price and well production volumes, the main variable affecting State leasing revenues from year to year is whether or not a lease sale was held and bonus bids collected. Table 7 shows that the 1999 lease sale generated sub-stantially higher income than years when sales were not held.
Table 6 - Leased State Land Acreage By County, 2002
County
Leased Acreage
Allegany 11,627
Broome 345
Cattaraugus 9,472
Chautauqua 16,923
Chemung 609
Erie 835
Ontario 55
Schuyler 11,574
Steuben 4,201
Yates 3,098
Cayuga 62
Seneca 17
Madison 53
Table 7 - Total Leasing Revenues, 1995 - 2002
1997 $168,029
1998 $279,523
1999 $3,206,406
2000 $181,876
2001 $379,845
2002 $249,685
1996 $143,592
1995 $143,668

NYS DEC - Division of Mineral Resources 22 Nineteenth Annual Report
New York State Oil, Gas and Mineral Resources, 2002
ABANDONED WELLS
Residential Area - Pipeline company employees detected natural gas emanating from two residential lawns in the Village of Rushville, Ontario and Yates County. Explosive gas levels were also found in-side a garage. Division staff uncovered two natural gas wells in the vicinity. Gas in the soil declined when the wells were vented under DEC direction. Roughly 24 gas wells were drilled in the village in the 1900's and need to be plugged when funds are available. The backhoe is exca-vating a leaking well next to a building.
School - During construction of a new bus garage at the Bolivar-Richburg High School in Allegany County, several buried abandoned wells were uncovered. Since no well records were available, the school had to bring in a small service rig (red equipment in foreground) to check the condition of the wells. All the wells had to be plugged before construction could re-sume. This is not the first school well inci-dent that the Division has handled. For example, in nearby Wyoming County DEC plugged a gas well that was leaking brine in the parking lot of Wyoming County Central School in 1991.
The Division estimates that over 75,000 oil and gas wells have been drilled in New York State since the 1820s.
Most of the wells were drilled before New York established a regulatory program and many were never plugged. Every year the Division of Mineral Resources deals with a “new” group of problem abandoned wells in a wide variety of settings. Here is a selection of abandoned wells from 2002.
NYS DEC - Division of Mineral Resources 23 Nineteenth Annual Report
New York State Oil, Gas and Mineral Resources, 2002
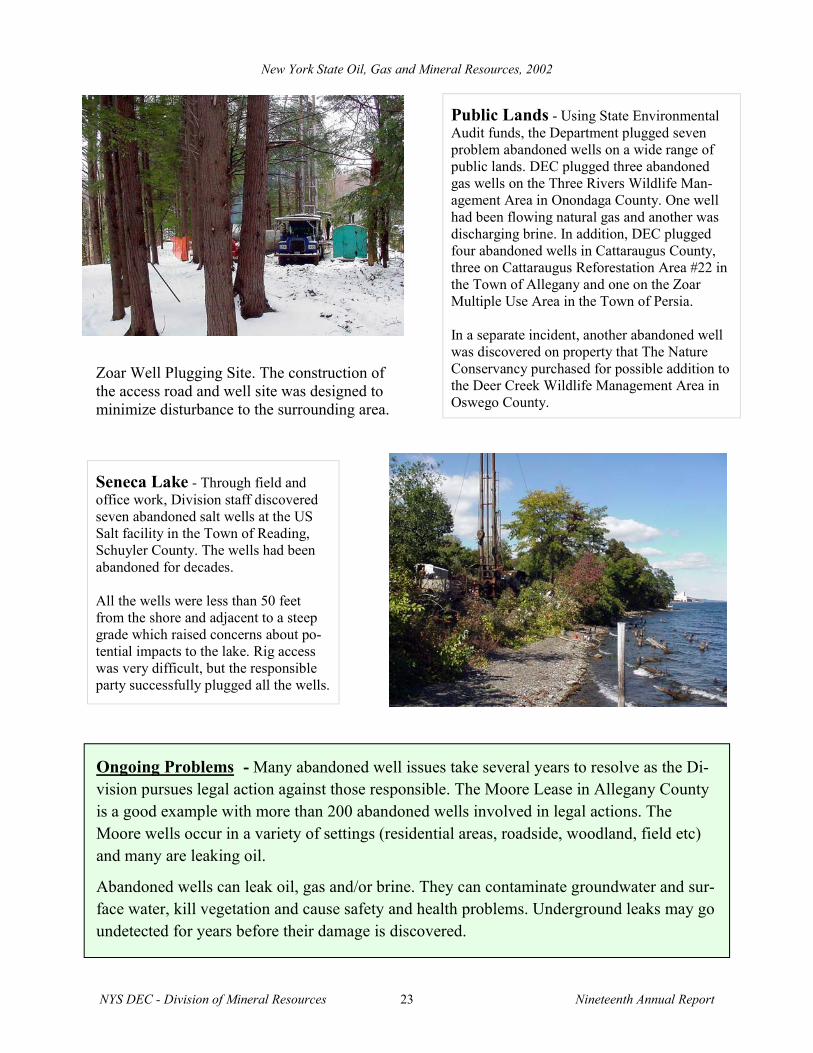
Zoar Well Plugging Site. The construction of the access road and well site was designed to minimize disturbance to the surrounding area.
Public Lands - Using State Environmental Audit funds, the Department plugged seven problem abandoned wells on a wide range of public lands. DEC plugged three abandoned gas wells on the Three Rivers Wildlife Man-agement Area in Onondaga County. One well had been flowing natural gas and another was discharging brine. In addition, DEC plugged four abandoned wells in Cattaraugus County, three on Cattaraugus Reforestation Area #22 in the Town of Allegany and one on the Zoar Multiple Use Area in the Town of Persia. In a separate incident, another abandoned well was discovered on property that The Nature Conservancy purchased for possible addition to the Deer Creek Wildlife Management Area in Oswego County.
Seneca Lake - Through field and office work, Division staff discovered seven abandoned salt wells at the US Salt facility in the Town of Reading, Schuyler County. The wells had been abandoned for decades. All the wells were less than 50 feet from the shore and adjacent to a steep grade which raised concerns about po-tential impacts to the lake. Rig access was very difficult, but the responsible party successfully plugged all the wells.
Ongoing Problems - Many abandoned well issues take several years to resolve as the Di-vision pursues legal action against those responsible. The Moore Lease in Allegany County is a good example with more than 200 abandoned wells involved in legal actions. The Moore wells occur in a variety of settings (residential areas, roadside, woodland, field etc) and many are leaking oil.
Abandoned wells can leak oil, gas and/or brine. They can contaminate groundwater and sur-face water, kill vegetation and cause safety and health problems. Underground leaks may go undetected for years before their damage is discovered.

NYS DEC - Division of Mineral Resources 24 Nineteenth Annual Report
New York State Oil, Gas and Mineral Resources, 2002
Priority Plugging List Historically, abandoned wells have been discov-ered at playgrounds and parking lots, inside buildings, in wetlands, underwater in creeks and ponds, in wooded and brushy areas and in resi-dential yards. Every year DEC staff discover additional abandoned wells during scheduled inspections or while investigating complaints. DEC staff evaluate the environmental and pub-lic safety threats posed by each well and place the most serious cases on the Priority Plugging List to be plugged whenever funds become available. Currently, there are 634 wells in 18 counties on the Priority Plugging List. Allegany and Catta-raugus County have a considerable number of abandoned old oilfield wells on the Priority Plugging List, but problem oil and gas wells of all ages are on the list. To date, only a small percentage of Priority Plugging List wells have ever been removed from the list. Wells removed from the list were plugged and abandoned with monies from the Oil and Gas Account and Environmental Audit Funds. Environmental Audit Process The Environmental Audit Program requires that each State Agency annually report any environ-mental problems associated with the lands and facilities they manage. Many agencies such as DEC, Parks, Urban Development, DOT and Mental Health have recently plugged leaking or abandoned wells identified in the Enviromental Audit (see page 23 for DEC plugging on State lands). However, many abandoned wells located on State lands are still not being reported, such as those found on DOT right-of-ways. In February Division staff made a presentation at a State Agency Environmental Audit Work-shop. Division staff explained the need to report abandoned wells and showed the workshop at-tendees examples of abandoned wells and the wide variety of settings where they can be found.
This Priority Plugging List well in the City of Rome, Oneida County was discharging brine at a rate of five gallons per minute into a wetland adjacent to Brandy Brook and had already killed over an acre of vegetation in 1998.
The mostly wooden structure is an older style of drilling rig known as a cable tool rig. It is being used to plug a well in a DOT right-of-way next to a stream.
The Division issued 177 Well Plug-ging Permits in 2002. All wells must be plugged and abandoned at the end of their productive life. The Division ensures that the proposed plugging procedures will protect ground and surface water and the site will be properly reclaimed and revegetated.
Plugging Permits
NYS DEC - Division of Mineral Resources 25 Nineteenth Annual Report
New York State Oil, Gas and Mineral Resources, 2002
COMPUTERIZED SERVICES
Web Site Statistics Public use of the Division’s website increased dramatically from the previous year. The aver-age number of user sessions rose 39% from 2001 to 278 sessions per day in 2002. The length of the average user session increased from 11 minutes in 2001 to 16 minutes in 2002 for an increase of 46%. In addition, the number of page views rose by 10% and unique visitors rose by 17% compared to 2001. As one of the Divi-sion’s primary tools for distribut-ing information, the website includes extensive informa-tion on both the Oil and Gas and the Mined Land Recla-mation Programs. The Division has further improvements planned for the website to increase its usefulness to the public, industry and local governments. Electronic Reporting and Annual Reports Approximately 14,500 wells need to be reported annually and the reports are due on March 31 for the preceding calendar year. The steadily increasing menu of electronic reporting options continues to make the process easier. In 2002 operators submitted electronic reports covering 4,650 wells and 11.5 BCF of gas, or 31% of the State’s total of 36.8 BCF of natural gas. In January the Division mailed 950 well owners a preprinted form showing all of their registered wells. For the past three years, well owners have also been able to file their reports using popular
spreadsheet formats and software files. In 2002 XML filings were added as a new electronic option. Computer filing is easier for many well owners and also reduces the chance of data en-try errors. The Division intends to further expand the elec-tronic reporting system so it is available to more operators. Electronic Field Inspection Module In the summer of 2002 Mined Land Reclama-tion staff began testing a new PDA- based electronic field-inspection technique. Prior to going out in the field, staff loaded a PDA with existing data on regional mines and a program that facilitates recording inspection information (site conditions, permit compliance status, etc.). After returning to the office, staff then electronically uploaded the information to the Division's database. As of the end of 2002, this project continued in the beta testing phase with Mined Land staff putting it through field trials and Central Office Staff making additional enhancements to the program. When the new system is fully implemented, it will significantly reduce the amount of time staff must spend recording inspection data and transferring it to the Division’s database. It will also reduce the chance of data entry errors and improve access to inspection data. Eventually the electronic inspection module will be used routinely by both the Mined Land Reclamation and Oil and Gas Pro- grams during every field inspection.
http://www.dec.state.ny.us/website/dmn

NYS DEC - Division of Mineral Resources 26 Nineteenth Annual Report
New York State Oil, Gas and Mineral Resources, 2002
UNDERGROUND GAS STORAGE
Twenty-three natural gas and three liquefied petroleum gas underground storage facilities operated in ten counties in the western and cen-tral parts of New York during 2002. Natural Gas Storage Table 8 summarizes the 2002 year-end status of underground natural gas storage in New York and Table 9 details activity during the year at each storage field. Storage operators injected 65.8 billion cubic feet of natural gas into storage during 2002 and delivered 67.4 billion cubic feet. New York’s storage reservoirs were 78% full at the end of the reporting year and year-end working gas in storage represented 57% of working capacity. More than 900 storage field wells were used during the year for injection, withdrawal or monitoring. Central New York Oil and Gas (CNYOG) com-menced natural gas storage operations at Stage-coach Field in Tioga County in January 2002. The addition of Stagecoach Field increased maximum daily deliverability of natural gas from storage by 500 million cubic feet, or 35%, to 1.927 billion cubic feet per day. Twenty-two of New York’s underground natu-ral gas storage facilities are in depleted reser-voirs and one is in a solution-mined cavern. More gas is stored in the Oriskany sandstone formation than in any other rock unit in New York. Used for storage at 10 fields including Stagecoach, the Oriskany accounted for 65% of total statewide capacity, 65% of working stor-age capacity and 61% of total maximum daily deliverability. The largest single storage field with respect to capacity, Dominion Transmis-sion’s Woodhull Field in Steuben County, can hold up to 35.9 billion cubic feet of gas in the Oriskany formation. Permit Applications – In December Wyckoff Storage Corporation submitted an application to develop a new underground natural gas storage field in a depleted gas production field in Steu-
ben County. Earlier in the year, staff continued review of an application previously submitted by Seneca Lake Storage Inc. for a proposed salt cavern storage project in Schuyler County. Staff also reviewed a proposal by National Fuel Gas Supply Company to extend the boundary of its Beech Hill natural gas storage field in Allegany County. All three proposals remained under ac-tive review at the end of 2002. Liquefied Petroleum Gas Storage New York’s three liquefied petroleum gas (LPG) underground storage facilities are in Cortland, Steuben and Schuyler Counties. The facilities store propane, butane and other liquid hydrocarbons for delivery to market as needed. Operators reported that at year-end 2002, 30,632,000 gallons of LPG were in storage. The volume stored at year-end represents 21 percent of total storage capacity. Liquefied petroleum gas is stored in caverns excavated in the shales of the Genesee Group or solution mined out of the Salina Group salt for-mations, which are the same formations used by New York’s five solution mining facilities.
A well at the Woodhull Storage Field in Steuben County. The reservoir has the largest storage capacity in New York.

NYS DEC - Division of Mineral Resources 27 Nineteenth Annual Report
New York State Oil, Gas and Mineral Resources, 2002
Onondaga
Oriskany
Medina
Salt Cavern
Total Number Fields 2 10 10 1 23 Wells
50 327 525 3 905 Acreage Reservoir 2,473 30,841 42,630 4 75,948 Total
7,112 62,051 102,946 4 172,113 Total Storage Gas Capacity (bcf) 10.700 134.754 59.280 2.340 207.074 Year-End (bcf)
8.287 107.423 44.990 1.399 162.099
Working Gas Capacity (bcf) 6.863 68.627 27.973 1.450 104.913 Year-End (bcf)
4.450 41.296 13.683 0.509 59.938
Max Daily Deliverability (mmcf/day)
100
1,171
511
145
1,927
Table 8 - 2002 Summary and Year-End Status Underground Natural Gas Storage
Stagecoach Gas Field, which started operation in 2002, is the easternmost un-derground natural gas storage field in the US. The field uses innovative hori-zontal wells to increase gas flow. Well CNYOG W-4 is in the foreground and well W-8 and an equipment building are in the background.

NYS DEC - Division of Mineral Resources 28 Nineteenth Annual Report
New York State Oil, Gas and Mineral Resources, 2002
Total Number
Wells
Total Storage Capacity
(bcf)
Gas to Storage
(bcf)
Gas from Storage
(bcf)
Designed Max. Deliverability (mmcf/day)
Dominion Transmission, Inc.
Woodhull Field
51 35.904 11.648 13.489 357
Central NY Oil and Gas
Stagecoach Field
18 13.750 13.239 1.796 500
Columbia Gas Trans. Corp.
Dundee Field 134 11.000 3.104 3.789 77
Greenwood Field 7 3.600 0.056 0.031 5
N. Greenwood Field
2 3.200 0.339 0.433 9
Honeoye Storage Corp.
Honeoye Field
39 10.780 3.242 3.877 55
National Fuel Gas Supply
Beech Hill Field 51 23.000 4.541 5.114 66
Bennington Field 64 5.000 1.930 2.283 75
Colden Field 166 16.220 6.894 9.688 110
Collins Field 47 5.880 1.395 1.964 50
Derby Field 14 0.250 0.168 0.135 5
E. Independence Field 11 6.400 1.848 2.352 15
Holland Field 26 2.600 0.571 0.861 25
Lawtons Field 32 2.470 0.560 0.981 21
Limestone Field 14 19.800 0.957 0.001 37
Nashville Field 71 8.530 1.887 2.898 110
Perrysburg Field 40 3.850 0.574 1.173 35
Sheridan Field 26 3.700 0.799 0.912 25
Tuscarora Field 8 6.300 3.012 3.972 57
W. Independence Field 31 11.800 3.201 3.683 49
Zoar Field
38 2.200 1.193 1.102 40
NYS Electric & Gas
Seneca Lake Field
3 2.340 0.757 1.348 145
Steuben Gas Storage Co.
Adrian Reef Field
12 8.500 3.867 5.501 60
Totals 905 207.074 65.781 67.384 1,927
Table 9 - Summary Storage Field Activity, 2002

!!!!!!!!!
!
!
!
!!!
!
!!
!!!
!!!
!
!
!!
!!
!!!!!!!!!!
!!!!
!
!!
!!
!
!
!
!!!!!!
!!!!!
!!! !!!
!!!!!!!!!!!!!!!!!!!!!!!!!!!!
!
!!!!!
! !!!!
!!!!
!!!!!!!!
!!! !!
!
!
!!
!
!!!!!!!!!!
!!!!!!!!!!!!!!!!
!!!!!!!!!!!
!
!
!
! !!
!
!!!
!!!!!!
!! !!!!!
!
!!!!!!!
!!
! !!!!!!!!!!
!!!!!
!
!
!!!!!!!!!!!!!!!!!!
!
!
!!!!!!
!!!!!!!
!
!!!!
!!!!!!
!!!
!!
!
!!!!!!!!!
!!!!
!
!!!!!!!
!!!!!!!
!!!!!!!!!!!!!!!!
!!!!!!!!
!
!!!!!!!!
!!!!!!
!!!!!!!!
!!
!!
!!
!!!!!!!!!!!!
!!!!!!!!!!!!!!
!
!!!!!!!
!
!!!!!!!!!!!!
!
!
!!!!!!!!!!
!!! !!
!!!!!!!
!!!!!!!!!!!! !!!!!
!!!!!!!!!!!!!!!!
!!!!!!!!!!!! !!!!!!!!!!!!!!!!!!!!!!!!! !!!!!!! !!!
!!!!!!!
!
!
!!!!!!!
!!!!
!!!!!!!!!!!!!!!!!
!!!!!!!!!!
! !! !!!!!!
!
! !
!!!!!!
!
!
!
!
!!
!
!
!!!!!
!
!!!!
!!!!
!!!!!
!
! !!!!!
!!!!!
!!!
!!!!
!
!
!
!
!
!!!!
!
!
!
!!
!!!
!
!
!!!!!
!!
!!!!!!!!!!
!
!
!!! !
!!
!
!!
!
!
!
!!
!
!
!!!
!
!
!!!
! !!!!
!
!!
!!
!!
!!
!!
!!
!
!
!
!
!
!
!
!
!
!!
!
!!
!
!
!!
!
!!
!!
!
!
!
!!
!
!!
!
!
!
!
!
!
!
!
!
!
!
!
!
!
!
!
!
!
!
!!
!
!
!!
!
!
!
!
!!
!
!
!!!
!
!
!
!
!
!
!
! !
!
!
!! !
!!
!
!
!
!
!
!
!
!
!
!
!
!
!
!
!
!
!!!!
!
!!
!
!
!
! !
!
!!
!
!
!
!
!
!
!
!
!
!
!!
!!
!
!
!
!
!
!
!
!
!
!
!
!
!
!!!!
!
!
!!
!
!
!!!
!
!
!
! !
!
!!!
!
!
!!
!
!!
!
!
!!
!
!
!
!
!! !!
!!
!
!!
!
!
!
!
!
!
!
!!
!
!
!
!
!!
!
!
!
!
!
!
!
! !
!!
!!
!
!
!!
!!
!
! !! !
!
!
!
!
!
!!
!
!
!
!
!
!
!!
!
!
!
!
!
!
!
!
!
!!!
!
!
!
!!
!
!
!
!
!
!
!!
!
!
!
!
!
!
!
!
!
!
!
!
!!!
!
!
!
!
!!
!
!
!
!!
!
!
!
!
!
!
!
!!
!
!
!!
!
!!
!!
!
!
!
!
!
!
!!
! !
!
!!
!!
!
!
!!
!
!
!
!
!
!
!
!
!
!
!
Map 3 - Underground Gas Storage andSolution Salt Mining Fields, 2002
Sheridan
Nashville
Perrysburg
Lawtons
Collins
Zoar
Derby
Colden
Holland
Bennington
Limestone
Dale Wyoming Village
Morton Salt
Honeoye
Wayne-Dundee
Well Type! Brine
! LPG
! Storage
S Beech Hill
W Independence/Beech HillE IndependenceN Greenwood
BPSI LPGAdrian Reef
Woodhull
Tuscarora
NYLPG
Texas Eastern LPG
NYSEG
CargillUS Salt
New Avoca
CYNOG
Greenwood
Gilbert
NYS D
EC D
ivision of Mineral Resources
Nineteenth Annual Report29
New
York State Oil, G
as and Mineral Resources, 2002

NYS DEC - Division of Mineral Resources 30 Nineteenth Annual Report
New York State Oil, Gas and Mineral Resources, 2002
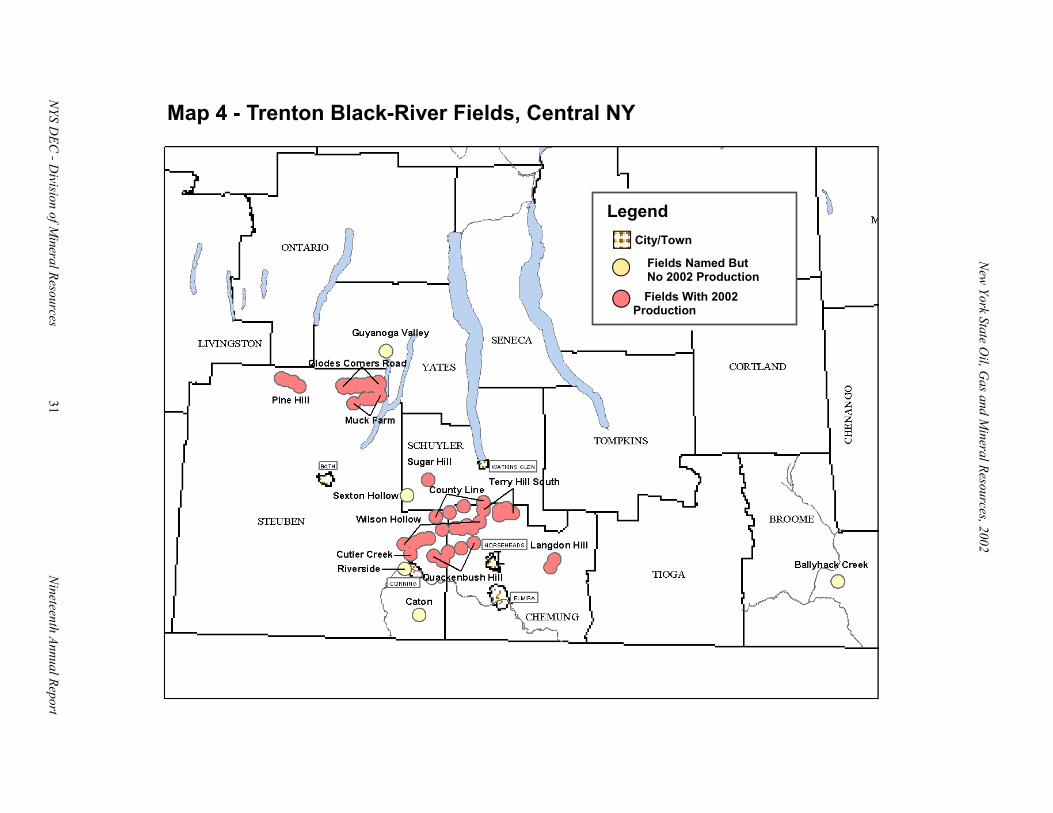
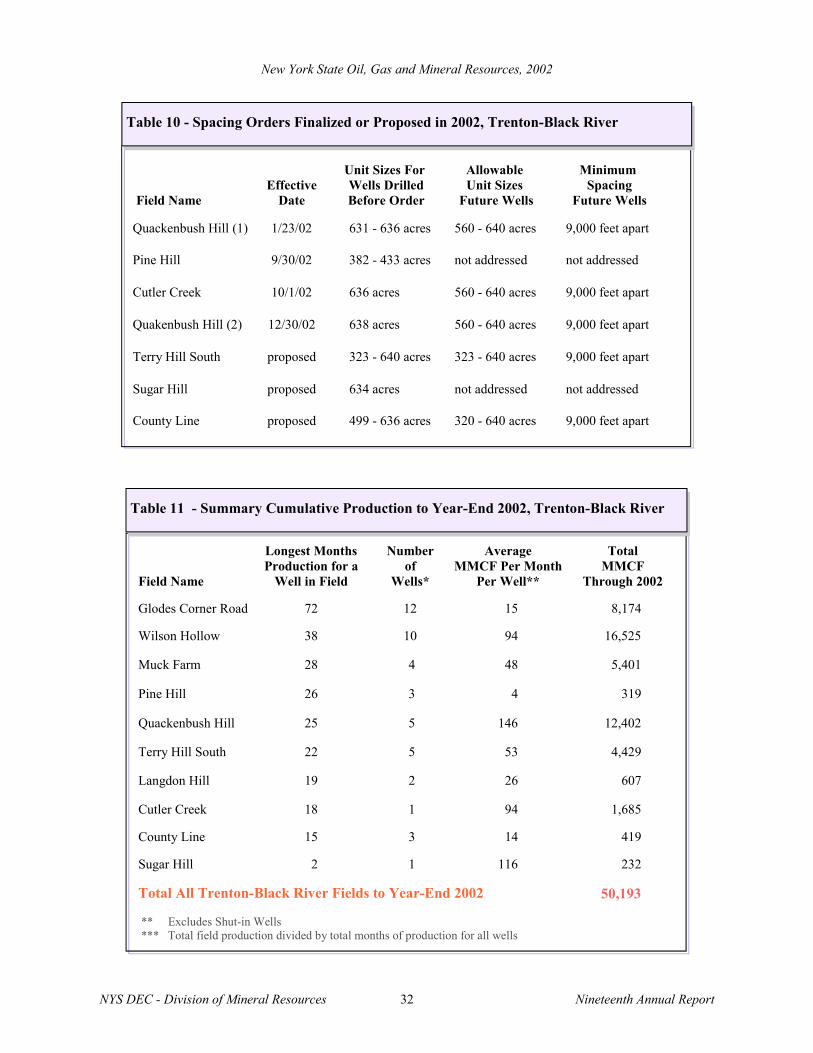
Development History 2002 Trenton-Black River drilling resulted in discovery of three new fields. All such discover-ies require hearings unless the field is 100% leased or controlled by the operator. Early developers of the Trenton-Black River natural gas resource in New York included Pennsylvania General Energy (PGE), Fairman Drilling Company (Fairman), East Resources and Columbia Natural Resources (CNR). During 2002 PGE conducted the first three-dimensional seismic survey in New York spe-cifically designed to delineate Trenton-Black River reservoirs. The survey was conducted in the vicinity of Wilson Hollow, Quackenbush Hill and Cutler Creek fields. Starting in late 2002, Fortuna Energy (Fortuna) acquired assets from Fairman, East Resources, PGE and CNR to become New York’s top Tren-ton-Black River producer. Fortuna presently operates every field discussed on this page ex-cept for the Pine Hill and Glodes Corners fields operated by CNR. 2002 Spacing and Integration Orders Commissioner Erin Crotty signed four Trenton-Black River Orders during 2002 (see Table 10 on page 32). The Orders established field-wide spacing rules and integrated interests within ten spacing units in three fields in Steuben and Che-mung Counties. The Orders for Quackenbush Hill field cover five spacing units; Pine Hill field includes four units and Cutler Creek field includes a single unit. The Orders govern roy-alty interest distribution within the established units. Except for Pine Hill field, the Orders also establish procedures for permitting future wells and integrating future units in the affected fields. Procedures for future permitting and inte-gration were not required for Pine Hill field be-cause the operator demonstrated that the field
TRENTON-BLACK RIVER PRODUCTION AND FIELD SPACING
has been fully developed. If Pine Hill field is extended by future drilling, further proceedings will be required to establish and integrate units for the extension wells. The Commissioner’s Orders discussed above were issued after the Department held pubic hearings as required by law. Prior to each hear-ing, Department staff and the field’s operator agreed upon field-specific proposed spacing and integration rules. These proposals were memori-alized in executed stipulations for each field. Additional stipulations were executed during 2002 for Terry Hill South, Sugar Hill and County Line fields. Terry Hill South field is comprised of eight proposed units in Chemung and Schuyler Counties. One proposed unit en-tirely within Schuyler County makes up Sugar Hill field. County Line field acreage includes five proposed units in Chemung, Schuyler and Steuben Counties. After a Commissioner’s Order is issued, exten-sion units where compulsory integration is nec-essary are established by Order of the Director of the Division of Mineral Resources. One such Order, for a 638-acre unit added to Wilson Hol-low field (the Parker Unit), was issued during 2002. Final Commissioner’s Orders which es-tablished the procedures for extending Wilson Hollow field had been issued during 2001. Cumulative Production Through year-end 2002, New York’s Trenton-Black River wells produced a total of 50,193 mmcf of gas. Table 11 on page 32 shows the Glodes Corner Road field as having the greatest number of months in production. This table also shows that wells in Quakenbush field had the largest average production per month, followed by Sugar Hill field. Table 12 gives detailed in-formation on each well’s cumulative gas pro-duction. This table is organized by highest total field production with Wilson Hollow listed first and Quakenbush Hill field second.
NYS D
EC - Division of M
ineral Resources 31
Nineteenth Annual Report
New
York State Oil, G
as and Mineral Resources, 2002
Map 4 - Trenton Black-River Fields, Central NY
Legend City/Town
Fields Named But No 2002 Production
Fields With 2002 Production
NYS DEC - Division of Mineral Resources 32 Nineteenth Annual Report
New York State Oil, Gas and Mineral Resources, 2002
Field Name
Longest Months Production for a
Well in Field
Number of
Wells*
Average MMCF Per Month
Per Well**
Total MMCF
Through 2002
Glodes Corner Road 72 12 15 8,174
Wilson Hollow 38 10 94 16,525
Muck Farm 28 4 48 5,401
Pine Hill 26 3 4 319
Quackenbush Hill 25 5 146 12,402
Terry Hill South 22 5 53 4,429
Langdon Hill 19 2 26 607
Cutler Creek 18 1 94 1,685
County Line 15 3 14 419
Sugar Hill 2 1 116 232
Total All Trenton-Black River Fields to Year-End 2002
** Excludes Shut-in Wells *** Total field production divided by total months of production for all wells
Field Name
Effective
Date
Unit Sizes For Wells Drilled Before Order
Allowable Unit Sizes
Future Wells
Minimum Spacing
Future Wells
Quackenbush Hill (1) 1/23/02 631 - 636 acres 560 - 640 acres 9,000 feet apart
Pine Hill 9/30/02 382 - 433 acres not addressed not addressed
Cutler Creek 10/1/02 636 acres 560 - 640 acres 9,000 feet apart
Quakenbush Hill (2) 12/30/02 638 acres 560 - 640 acres 9,000 feet apart
Terry Hill South proposed 323 - 640 acres 323 - 640 acres 9,000 feet apart
Sugar Hill proposed 634 acres not addressed not addressed
County Line proposed 499 - 636 acres 320 - 640 acres 9,000 feet apart
Table 11 - Summary Cumulative Production to Year-End 2002, Trenton-Black River
Table 10 - Spacing Orders Finalized or Proposed in 2002, Trenton-Black River
50,193

NYS DEC - Division of Mineral Resources 33 Nineteenth Annual Report
New York State Oil, Gas and Mineral Resources, 2002
Table 12 - Detailed Cumulative Production to Year-End 2002, Trenton-Black River
Months Total Production Field and Wells API Number In Production MMCF
Wilson Hollow Field Howe 31101228140100 30 4,066 Jimerson 31101227710000 38 2,986 VanVleet 31101228520000 22 1,333 Fratercangelo 31101228840100 15 1,908 Rice 31101228250000 27 438 Parker 31015228910000 11 2,870 Hardy 31015229190100 11 983 Chemung SRA #1 31015229600000 7 863 Root 31015229750000 3 629 Lederer 31015229020100 11 449 Quackenbush Hill Field Lovell 31015228310000 25 8,386 Rhodes 31015228530000 19 2,277 Hartman 31101228920100 16 1,062 Henkel 31101228710100 18 164 Gregory 31015229180100 7 513 Glodes Corner Rd. Field Levandowski 31101216880000 50 994 Covert 1 31010216890100 50 993 Smith 31101217050000 48 905 Gray 31101215920000 72 828 Fox 31101217060000 49 840 Pizura 31101216920000 50 744 Bergstresser 31101217100000 40 828 Covert 2 31101227680000 24 715 Radigan 31101217030100 34 492 Ballam-Carter 31101227690000 24 605 Evangelos 31101194970000 59 175 Kozak 31101217120000 38 55 Egresi 31101227720000 0 shut-in
Field Total 16,525
Field Total 12,402
Field Total 8,174

NYS DEC - Division of Mineral Resources 34 Nineteenth Annual Report
New York State Oil, Gas and Mineral Resources, 2002
Months Total Production Field and Wells API Number In Production MMCF
Muck Farm Field Snyder 31101227550000 28 2,084 McAllister 31101227480000 28 1,904 Smith 31101227470000 28 877 Faber 31101227450000 28 536 Terry Hill South Field Kimball 31015228570000 17 1,450 Lant 1 31015228620000 22 1,233 Broz 31015228260000 17 654 Clauss 31015228890100 15 463 Kienzle 31015228800100 13 629 Gublo 31015229100000 0 shut-in Cutler Creek Field Corning Game Club 31101228850000 18 1,685 Langdon Hill Field Monahan 31015228380000 19 589 Usack 31015229330000 4 18 County Line Field Whiteman 31015228390000 15 170 Purvis 31097228930000 6 155 Roy 31015229010000 10 94 Youmans 31101229760000 0 shut-in Pine Hill Field Wolcott 31101227600100 26 155 Peck 31101227660000 26 122 S&D Farms 1 31101227580100 26 42 S&D Farms 1B 31101227590200 0 shut-in
Field Total 5,401
Field Total 4,429
Field Total 1,685
Field Total 607
Field Total 419
Field Total 319

NYS DEC - Division of Mineral Resources 35 Nineteenth Annual Report
New York State Oil, Gas and Mineral Resources, 2002
Landowners typically receive royalties
of 1/8 or 12.5% of the value of produc-
tion from a well draining their land.
Some landowners in the Trenton-Black
River trend are collecting royalties of
$100,000 or more per year.
Months Total Production Field and Wells API Number In Production MMCF
Riverside Field Pace 31101229580000 0 shut-in Guyanoga Valley Field Walters 31123227750100 0 shut-in Sexton Hollow Field Grand Prix 1 31097228300000 0 shut-in Ballyhack Creek Field Beagell 2 A 31007229950100 0 shut-in* Total All Trenton-Black River Fields to Year-End 2002 50,193
Sugar Hill Field SRA 2 31097228410000 2 232
Field Total 232
* Field began producing in 2003
Field Total 0
Field Total 0
Field Total 0
Field Total 0

NYS DEC - Division of Mineral Resources 36 Nineteenth Annual Report
New York State Oil, Gas and Mineral Resources, 2002
Five solution mining facilities in New York (see Map 3 on page 29) produced 2.17 billion gallons of saturated brine, or about 2.5 million metric tons of salt, in 2002. Operators of these five facilities injected 2.23 billion gallons of fresh and recycled plant process water into bedded salt zones of the Upper Silurian Salina Group to recover the brine. Brine withdrawals for 2002 represent a slight decrease compared to 2001's figure of 2.20 billion gallons. The value of New York’s 2002 solution salt mining production is estimated at $100 million. The 147 operating wells reported in 2002 in-clude injection wells, withdrawal wells, wells equipped for both injection and withdrawal, and standby wells. Table 13 gives the number of operating and plugged wells at each facility. U.S. Salt, Cargill, and Morton produced brine to supply on-site evaporation plants which manu-
facture and package table salt, water condition-ing salt, and salt for other uses. Texas Brine and Occidental Chemical supplied chemical manu-facturing plants in Niagara Falls via 60-mile-long brine pipelines. During 2002 the Department reviewed and ap-proved Morton Salt’s proposal to add 514 acres to its solution mining field in Wyoming County. Department staff also required Akzo Nobel to plug seven abandoned wells originally drilled in the early 1900s on the shores of Seneca Lake in Schuyler County. In 2002 solution mining facilities accounted for approximately 50% of New York’s total mined salt production, with the remainder extracted by conventional underground mining. According to U.S. Geological Survey statistics, New York typically ranks third among the states in total annual salt production volume.
SOLUTION MINING
Operator
County
Town Year Started
Operating Wells
Plugged Wells
U.S. Salt
Schuyler Reading 1893 11 61
Cargill
Schuyler Dix 1898 17 13
Morton Wyoming Castile & Gainesville
1884 21 24
Texas Brine Wyoming Middlebury (Dale Field)
1970 53 90
Texas Brine Wyoming Middlebury (Wyo. Vil. Field)
1984 45 ____
23 ___
Total 147 211
Status of Solution Salt Mining in New York, 2002
Table 13

NYS DEC - Division of Mineral Resources 37 Nineteenth Annual Report
New York State Oil, Gas and Mineral Resources, 2002
To find out more details about wells in your area, see the Ap-pendices starting on page 55:
• Drilling Permits Issued 2002
• Wells Completed in 2002
• Gas & Oil Production by Town, Field and Formation