state diagrams / system sequence diagrams (ssds)
TRANSCRIPT

Lesson 9State Diagrams / System Sequence Diagrams (SSDs)

2
Agenda
Weekly Schedule-SLATE Assignment No 2 Rubric Posted Quiz No 3 next week
Solutions to ICE’s posted on SLATE Today
State charts – continued... I-C-E-06
▪ Two ways of modelling Summarize Requirements Gathering Process
▪ Car Rental System – Case Study Introduce System Sequence Diagrams (SSDs) Quiz No 2 ICE-07
© Sheridan College

3
The Big Picture
© Sheridan College

4© Sheridan College
Typical Amazon Package Tracking Status Report

5
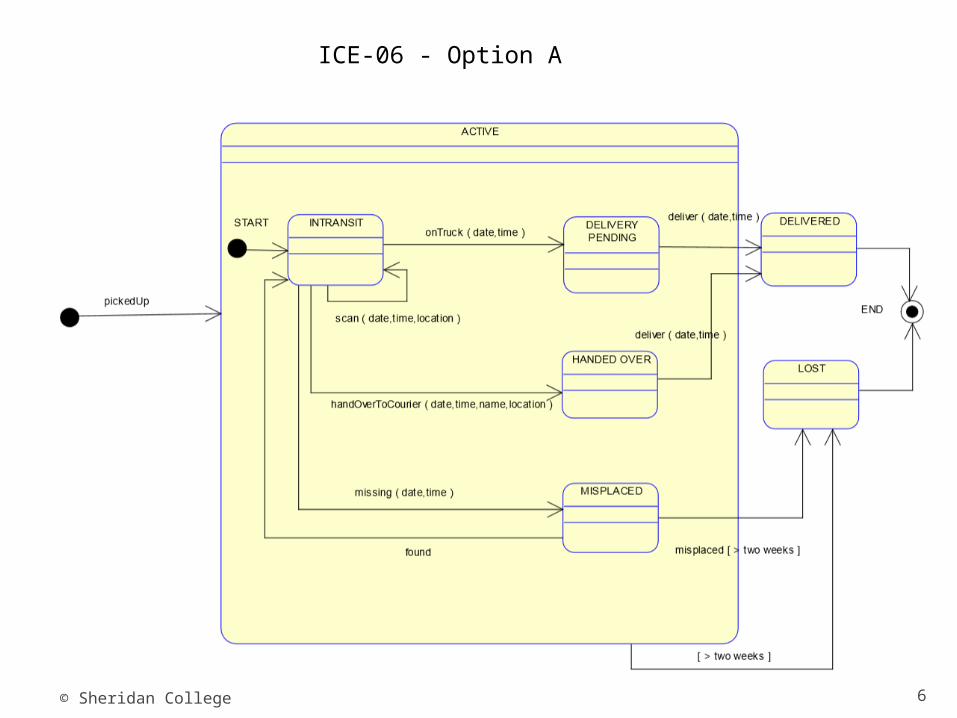
Review I-C-E-06
Two Versions – check SLATE
© Sheridan College
6© Sheridan College
ICE-06 - Option A

7© Sheridan College
ICE06-Option B

State Transition Diagrams - Review
© Sheridan College 8
What is a State Diagram? Purpose: To model the various states
that a system, user, or object can be in, including initial and final states.
From a business perspective, tracking the state of an object provides users with important status information on key elements.

9
State Transition Diagrams
State:Some behavior of a system that is observable and that lasts for some period of time.
A state is when a system is:
• Doing something – e.g., heating oven, mixing ingredients, accelerating engine,
• Waiting for something to happen – Waiting for user to enter password, waiting for sensor reading.
Transition: (Virtually) instantaneous change in state (behavior).
© Sheridan College

10
Here’s a simple example State Transition Diagram for a washing
machine.
State
Transition
Condition
Action
© Sheridan College

© Sheridan College 11
Typical Washing Machine User Interface

12
A condition is typically some kind of event, e.g.:• Signal• Arrival of an object (data/material),• Etc…
Condition
Action
An action is the appropriate output or response to the event, e.g.:• Signal or message• Transfer of an object,• Calculation,• Etc…
© Sheridan College

Something we might be more familiar with!
© Sheridan College 13

A Typical Grocery POS[1]
© Sheridan College 14
Login ScreenUser:PW:

A Typical Grocery POS[2]
© Sheridan College 15
Ready to Scan next Order

A Typical Grocery POS[3]
© Sheridan College 16

A Typical Grocery POS[4]
© Sheridan College 17
Logging OFF

State Tables [1]
© Sheridan College 18
State Transition Diagrams often don’t show all possible combinations of states and events.
Often they overlook things that can’t or shouldn’t happen.
A state table overcomes that limitation by combining every known state with every event[condition] combination that can occur.
You can then specify the correct action or next state.
If you find a combination of state, event, and condition for which the attendant action and subsequent state are not specified, congratulations. You have found a bug!

State Tables [2]
© Sheridan College 19
To design a set of functional tests from a state transition diagram, the rules are simple: Visit every state. Cover every transition. Ensure that no states are unreachable or
unleavable.

20
Summarize:Rules for Developing Statecharts
[1] Select the classes that will require statecharts
[2] List all the status conditions for each group
[3] Specify transitions that cause object to leave the identified state
[4] Sequence state-transition combinations in correct order
© Sheridan College

21
Rules for Developing Statecharts (continued)
[5] Identify concurrent paths.
[6] Look for additional transitions
[7] Expand each transition as appropriate
[8] Review and test each statechart
© Sheridan College

Review Exercise – POS (model of the state of a Point of Sale device)
© Sheridan College 22
L o g g in g Ou t
Ch a rg in g
S c a n n in g
Wa itin gL o g g in g In
E n d
S ta rt
Cu s to me r P a y s [ In v a lid ] / "D is p la y E rro r Me s s a g e "
P a s s wo rd E n try [ In v a lid ] / "D is p la y E rro r Me s s a g e "
Cu s to me r P a y s [ V a lid ] / "Is s u e Re c e ip t"
S c a n [ Ite m(s ) ] / "D is p la y S u b to ta ls "
P a s s wo rd [ V a lid ] / "Op e n R e g is te r"
S c a n [ L a s t Ite m ] / "D is p la y T o ta l"
E n d o f S h ift / "C lo s e Re g is te r"
Cu s to me r Wa n ts to C h e c k Ou t
In itia l S ta te

23© Sheridan College
The Big Picture

24
Identifying Inputs and Outputs—the System Sequence Diagram
System sequence diagram (SSD)
Describes flow of information
Identifies interaction between actors and system
Message oriented
© Sheridan College
25
SSD Notation
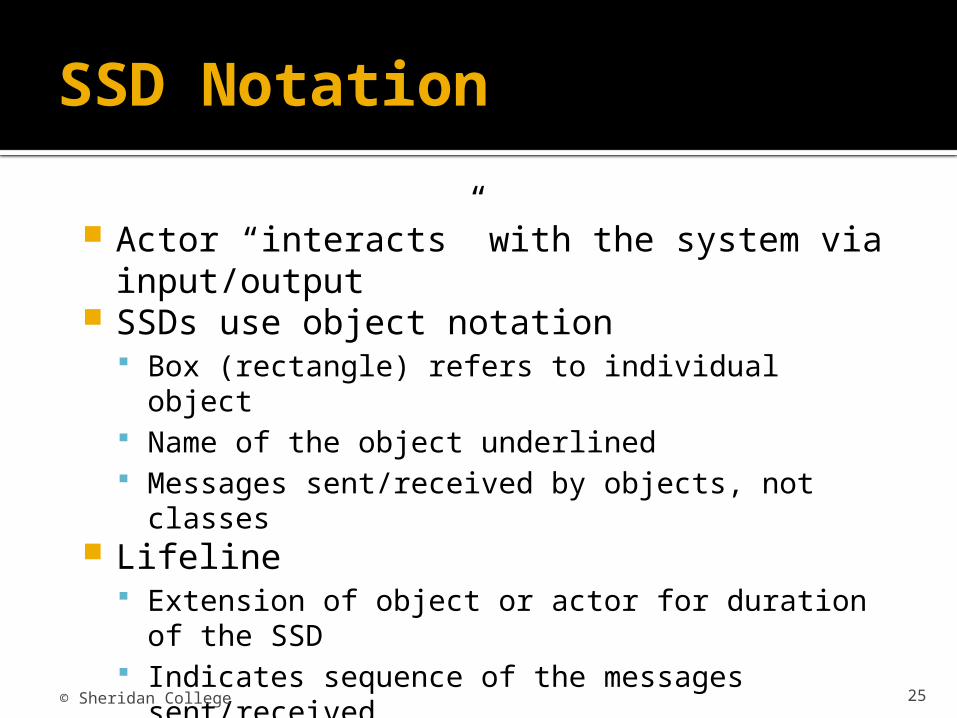
Actor “interacts” with the system via input/output
SSDs use object notation Box (rectangle) refers to individual object Name of the object underlined Messages sent/received by objects, not classes
Lifeline Extension of object or actor for duration of the
SSD Indicates sequence of the messages
sent/received
© Sheridan College

26
Sample System Sequence Diagram
© Sheridan College
27
SSD Notation (continued)
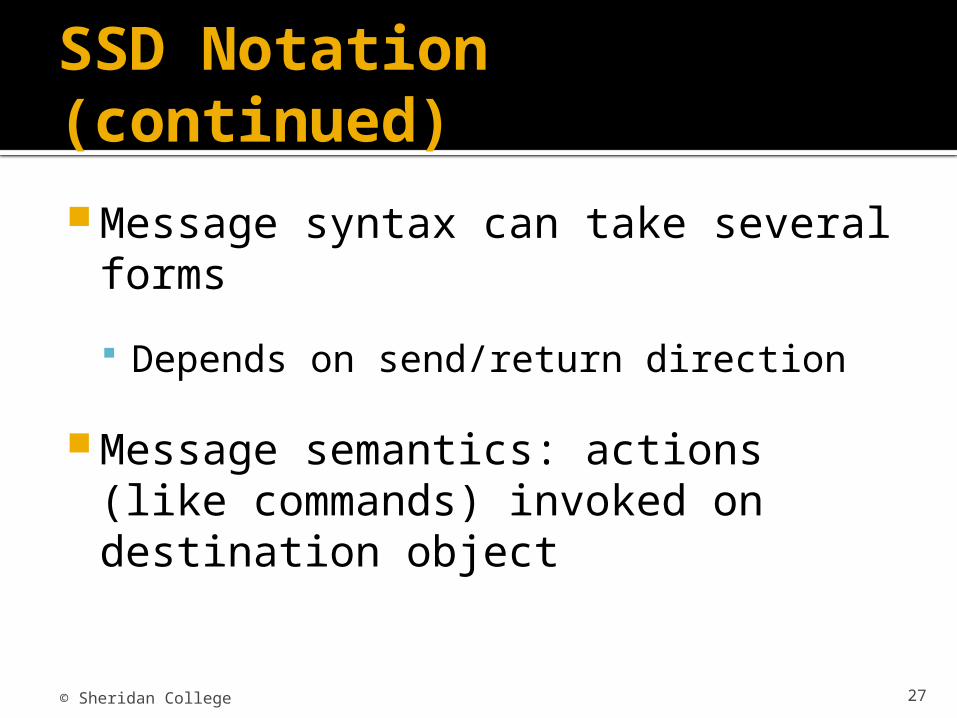
Message syntax can take several forms
Depends on send/return direction
Message semantics: actions (like commands) invoked on destination object
© Sheridan College

28© Sheridan College

29
SSD Message Syntax
*[true/false condition] return-value := message-name (parameter-list)
Any part of the message can be omitted. In brief, the notation componentsdo the following:
■ An asterisk (*) indicates repeating or looping of the message.■ Brackets [ ] indicate a true/false condition. This is a test for that messageonly. If it evaluates to true, the message is sent. If it evaluates to false, themessage isn’t sent.■ Message-name is the description of the requested service. It is omitted ondashed-line return messages, which only show the return data parameters.■ Parameter-list (with parentheses on initiating messages and withoutparentheses on return messages) shows the data that are passed with themessage.■ Return-value on the same line as the message (requires :=) is used todescribe data being returned from the destination object to the source objectin response to the message.
© Sheridan College

30© Sheridan College
31
Developing a System Sequence Diagram
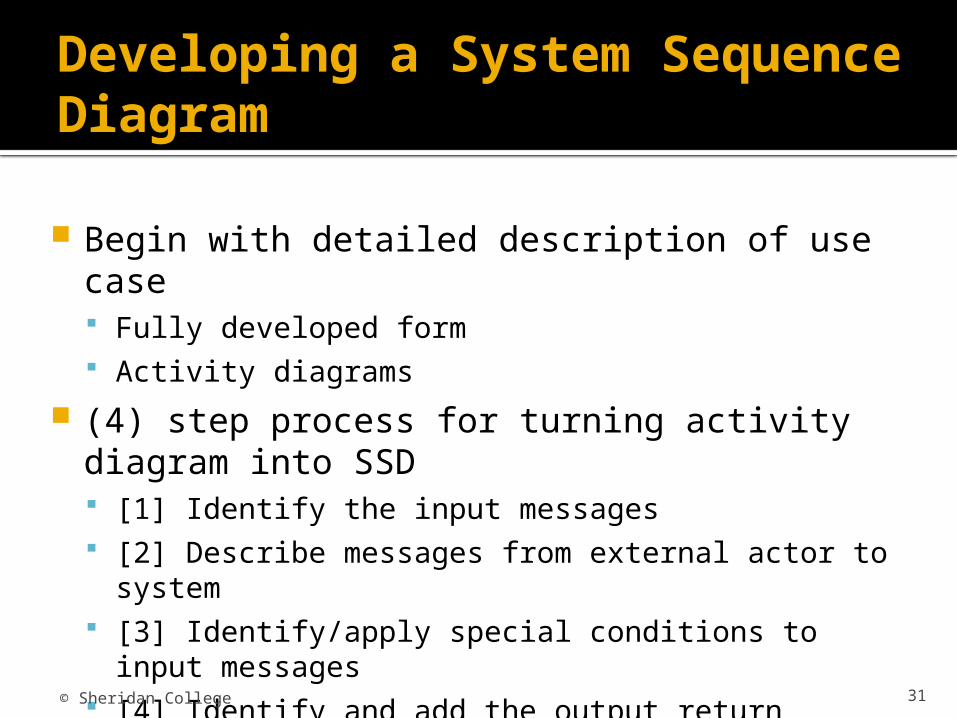
Begin with detailed description of use case Fully developed form Activity diagrams
(4) step process for turning activity diagram into SSD [1] Identify the input messages [2] Describe messages from external actor to system [3] Identify/apply special conditions to input messages [4] Identify and add the output return messages
© Sheridan College

32
A Simplified Diagram of the Telephone Order Scenario
© Sheridan College

33
An SSD of the Simplified Telephone Order Scenario for the Create New Order Use Case
© Sheridan College

34
Developing a System Sequence Diagram (continued)
Names of messages reflect services performed
Important principle for identifying data parameters Base the list on the class diagram Attributes from the classes listed as parameters
Iteratively define input/output parameters around workflows
Objective: discovery and understanding
© Sheridan College

35
Practice Exercise ICE07
See SLATE for a ICE07
© Sheridan College

36
For Next Class
Read & Study Chapter 6 Pages 237 -246
What comes next? Sequence Diagrams
© Sheridan College

37
Class example…
Car Rental System – Posted on SLATE Week10
© Sheridan College