star formation properties of spiral galaxies
TRANSCRIPT
STAR FORMATION PROPERTIES OF SPIRAL GALAXIES
R.A. KANDALYAN ∗, H.M.K. AL-NAIMIY and A.M. KHASSAWNEHInstitute of Astronomy and Space Sciences Al al-Bayt University, Mafraq, Jordan
Abstract. The gas properties of barred and unbarred spiral galaxies are compared in two completesamples. It is found that two types of spiral galaxies do not differ to each other in atomic andmolecular gas contents. On average there is 6 times more HI than H2 in spiral galaxies and theratio MHI/MH2 decreases from early to late types. The barred and unbarred spirals in general show asimilar behaviors of the gas-to-luminosity relationships, but also there are certain differences betweenthem such as correlation of two gas phases (HI and H2) for unbarred galaxies. It is suggested thatdifferent behaviors of two types galaxies are due to the higher star forming activity of barred withrespect unbarred spirals. The expected values of HI and H2 gas contents have been estimated usingblue and far-infrared emission.
1. Introduction
There is still an active debate on the nature and dependence of star formationactivity from the morphology of spiral galaxies in general, and from the bar ef-fect in particular. There are many reasons which indicate that the presence of abar increases star formation activity in spiral galaxies (see, e.g. Kandalyan andKalloghlyan, 1998b,c; Kalloghlyan and Kandalyan, 1998 and references therein,for more detail). For example, it was found that SB galaxies have hotter FIR colorsthan SA galaxies (De Jonget al., 1998; Hawardenet al., 1986; Kandalyan andKalloghlyan, 1998b). According to Huanget al.(1996) the presence of a bar defin-itely affects the degree of star formation rate (SFR) in early but not in late types ofspirals. Devereux (1987) noted that the presence of bars is strongly correlated withthe concentration if emission at 10 micron.
Giuricin et al. (1994) realized that barred spirals are brighter at 10 micron thanunbarred systems, essentially because they are more frequently contain HII region-like nuclei. For SB galaxies there are tight correlation between luminosities in FIR,radio and X-ray ranges (Kandalyan and Kalloghlyan, 1998c). The radio spectralindices of SA and SB galaxies between 1.4 and 5 GHz are the same. Howeverthere are certain connections between spectral index of SB galaxies and their FIRand X-ray luminosities, namely with increasing of both luminosities the spectralindex increases. It is suggested that this may be caused by existence of a bar, whichstimulates star formation process in SB galaxies. Arsenault (1989) found the en-hancement of star formation rate in barred galaxies according to Hα observations.∗ Byurakan Astrophysical Observatory, Armenia.
Astrophysics and Space Science273: 103–115, 2000.© 2000Kluwer Academic Publishers. Printed in the Netherlands.
104 R.A. KANDALYAN ET AL.
There is a higher degree of formation of massive stars in galaxies of SBO-SBbcthan in ordinary spirals (Hoet al., 1996). According to Phillips (1996), in general,global SFR and other properties of barred galaxies are consistent with unbarredspirals of comparable Hubble class. But in barred spiral of SBb-SBc types, theeffect of the bar on star formation is clearly seen in the distribution of star formingsites.
There are contradictory results and opinions, for example, observations by Deve-reuxet al.(1987) of a sample of nearby, relatively faint galaxies at 10 micron showno intense emission in the regions of SB galaxies near the nucleus. Eskride andPogge (1991) argued that the presence or absence of bars does not affect the SFRin SO galaxies. Moreover, Isobe and Feigelson (1992) found that barred galaxies ina volume-limited sample have lower overall FIR luminosity than unbarred galaxies.No bar effect was found in the near-IR (Giuricinet al., 1993).
It seems likely that large scale galaxy environment (i.e. galaxy group) doesnot affect by presence or absence of a bar. However, group and non-group barredgalaxies may differ by star formation activity (Kalloghlyan and Kandalyan, 1998).
Another important constituent of star formation is gas content. However gasproperties of barred galaxies with respect unbarred ones are less studied. Presentpaper deals with neutral hydrogen (λ = 21 cm) and molecular hydrogen (estimatedfrom 12CO(1–0),λ = 2.6 mm line observation) gas content of barred and unbarredgalaxies, as well as Hα (λ = 6462 A) line.
2. Samples of Barred and Unbarred Galaxies
Kandalyan and Kalloghlyan (1998) have compiled a magnitude-limited (13.5m)sample of barred and unbarred galaxies. The catalog of barred galaxies containsa total of 690 SB+SAB objects north ofδ = −10◦. The list of unbarred galaxiescontains a total of 456 objects north ofδ = +30◦. The optical and FIR luminosityfunctions of these galaxies are discussed in (Kalloghlyan and Kandalyan, 1998and Kandalyan and Kalloghlyan, 1998b). For the present study we have used thesesamples of spiral galaxies.
The main parameters of these galaxies, including HI (λ = 21 cm) data havebeen extracted from the LEDA and NED∗ database. The 12CO(1–0) line data arefrom (Younget al., 1995; Sage, 1993; Kenney and Young, 1988; Starket al., 1986;Elfhag et al., 1996; Braine and Combes, 1992; Contini, 1996). The Hα line dataare from (Younget al., 1996; Hoet al., 1997; Continiet al., 1998). The FIR, blue,radio and X-ray luminosities have been calculated according to formulas presentedin (Kandalyan and Kalloghlyan, 1998b,c). The total MHI and MH2 masses havebeen calculated according to formulas:
∗ The NASA-IPAC Extra-galactic Database (NED) which is operated by the Jet PropulsionLaboratory, Caltech, under contract with the National Aeronautics and Space Administration(U.S.A.).
STAR FORMATION PROPERTIES OF SPIRAL GALAXIES 105
log(MHI/M�) = 5.372 + log F(Jy km s−1) + 2 logD(Mpc),
where F is integral line intensity and D is distance of the galaxy.
log(MH2/M�) = 0.679 + log(Lco/L�)
for the molecular hydrogen to CO conversion factor
N(H2)/Ico = 3 1020 cm2 (K km s−1)−1,
where ICO is integral CO line intensity in K km s−1 (Sanderset al., 1991). The COline luminosity has been calculated according to:
log(Lco/L�) = 1.425 + logICO (K km s−1) + 2 logϑ(arcsec) + 2logD(Mpc),
wereϑ is beam-size of a telescope at 2.6 mm. The Hα luminosity has been calcu-lated according to
log(LHα/L�) = 16.496 + logfC(ergs cm−2 s−1) + 2logD(Mpc),
where fC is the flux density corrected for Galactic and internal absorption. Thedistance D of a galaxy has been calculated from the galaxy virgo-centric radialvelocity, for the Hubble constant HO = 75 km s−1 Mpc−1. All calculated luminos-ities and masses are in solar units. For the radio telescopes at 2.6 mm have beenaccepted following beam-sizes: IRAM 30 m (23 arcsec); Onsala 20 m (33 arcsec);SEST 15 m (44 arcsec); FCRAO 14 m (45 arcsec); NRAO 12 m (55 arcsec); BellLab. 7 m (100 arcsec).
3. Comparison of Barred and Unbarred Galaxies
3.1. THE MEAN VALUES OF MHI, MH2 AND LHα FOR SB AND SA GALAXIES
There have been many studies concerning of star formation in the spiral galaxies(see, e.g. Young and Scoville, 1991; Kandalyan, 1996 and references herein). Thecold neutral component of interstellar medium of spiral galaxies consists of twophases: atomic and molecular. These two phases are important constituents ofstar formation, although probably molecular phase is tightly connected with starformation activity than atomic phase. There are many studies, which have shownthat star formation activities of spiral galaxies depend on morphological types. Forthis reason we will compare calculated parameters of barred and unbarred galaxiesbetween difference morphological subtypes.
The spiral galaxies have been divided into three subgroups: early type (SO/a-Sa), intermediate type (Sb-Sc?) and late type (Sc-Irr). Table I presents the meanvalues of logMHI, logMH2 and logLHα for barred and unbarred galaxies for eachmorphological subgroup. The number of galaxies and standard error of means
106 R.A. KANDALYAN ET AL.
TABLE I
Mean Parameters of barred and unbarred galaxies
Morph. Log N Std. Log N Std. Log N Std.
Type MHI error MH2 error LHα error
SBO/a-SBa 9.16 94 0.08 8.56 39 0.13 5.66 32 0.18
SO/a-Sa 9.06 59 0.09 8.47 18 0.20 5.53 16 0.23
SBb-SBc 9.59 281 0.03 8.84 84 0.08 5.67 86 0.08
Sb-Sc 9.61 115 0.06 8.68 32 0.16 5.37 34 0.16
SBc-Irr 9.26 168 0.04 7.96 29 0.18 4.98 43 0.13
Sc-Irr 9.18 36 0.14 7.43 5 0.56 4.85 5 0.97
All SB 9.41 543 0.03 8.60 152 0.07 5.48 161 0.07
SA 9.38 210 0.05 8.50 55 0.13 5.37 55 0.14
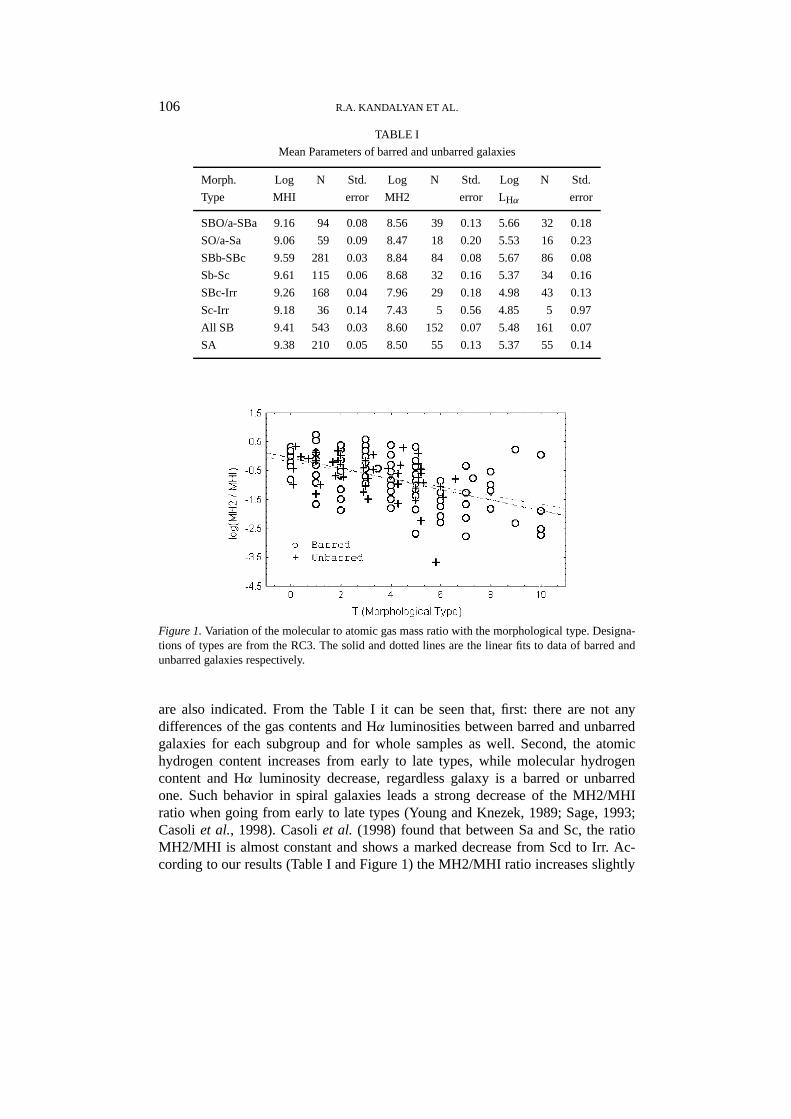
Figure 1.Variation of the molecular to atomic gas mass ratio with the morphological type. Designa-tions of types are from the RC3. The solid and dotted lines are the linear fits to data of barred andunbarred galaxies respectively.
are also indicated. From the Table I it can be seen that, first: there are not anydifferences of the gas contents and Hα luminosities between barred and unbarredgalaxies for each subgroup and for whole samples as well. Second, the atomichydrogen content increases from early to late types, while molecular hydrogencontent and Hα luminosity decrease, regardless galaxy is a barred or unbarredone. Such behavior in spiral galaxies leads a strong decrease of the MH2/MHIratio when going from early to late types (Young and Knezek, 1989; Sage, 1993;Casoliet al., 1998). Casoliet al. (1998) found that between Sa and Sc, the ratioMH2/MHI is almost constant and shows a marked decrease from Scd to Irr. Ac-cording to our results (Table I and Figure 1) the MH2/MHI ratio increases slightly
STAR FORMATION PROPERTIES OF SPIRAL GALAXIES 107
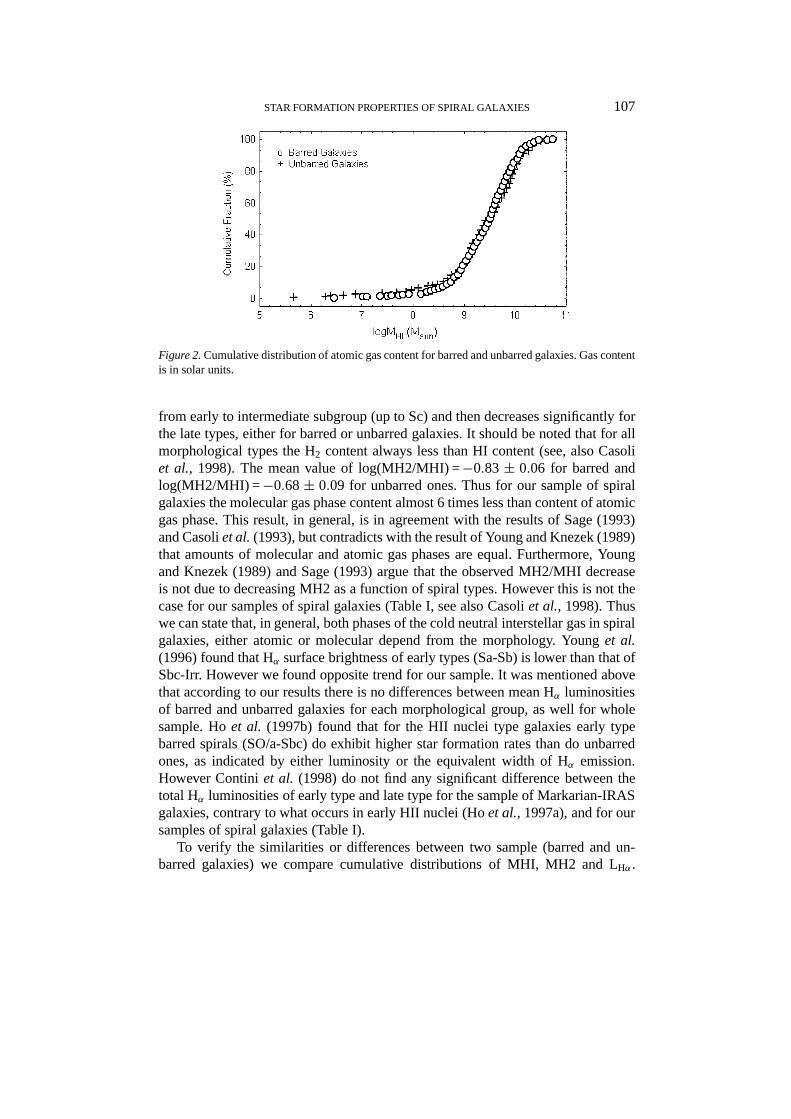
Figure 2.Cumulative distribution of atomic gas content for barred and unbarred galaxies. Gas contentis in solar units.
from early to intermediate subgroup (up to Sc) and then decreases significantly forthe late types, either for barred or unbarred galaxies. It should be noted that for allmorphological types the H2 content always less than HI content (see, also Casoliet al., 1998). The mean value of log(MH2/MHI) =−0.83± 0.06 for barred andlog(MH2/MHI) =−0.68± 0.09 for unbarred ones. Thus for our sample of spiralgalaxies the molecular gas phase content almost 6 times less than content of atomicgas phase. This result, in general, is in agreement with the results of Sage (1993)and Casoliet al.(1993), but contradicts with the result of Young and Knezek (1989)that amounts of molecular and atomic gas phases are equal. Furthermore, Youngand Knezek (1989) and Sage (1993) argue that the observed MH2/MHI decreaseis not due to decreasing MH2 as a function of spiral types. However this is not thecase for our samples of spiral galaxies (Table I, see also Casoliet al., 1998). Thuswe can state that, in general, both phases of the cold neutral interstellar gas in spiralgalaxies, either atomic or molecular depend from the morphology. Younget al.(1996) found that Hα surface brightness of early types (Sa-Sb) is lower than that ofSbc-Irr. However we found opposite trend for our sample. It was mentioned abovethat according to our results there is no differences between mean Hα luminositiesof barred and unbarred galaxies for each morphological group, as well for wholesample. Hoet al. (1997b) found that for the HII nuclei type galaxies early typebarred spirals (SO/a-Sbc) do exhibit higher star formation rates than do unbarredones, as indicated by either luminosity or the equivalent width of Hα emission.However Continiet al. (1998) do not find any significant difference between thetotal Hα luminosities of early type and late type for the sample of Markarian-IRASgalaxies, contrary to what occurs in early HII nuclei (Hoet al., 1997a), and for oursamples of spiral galaxies (Table I).
To verify the similarities or differences between two sample (barred and un-barred galaxies) we compare cumulative distributions of MHI, MH2 and LHα.
108 R.A. KANDALYAN ET AL.
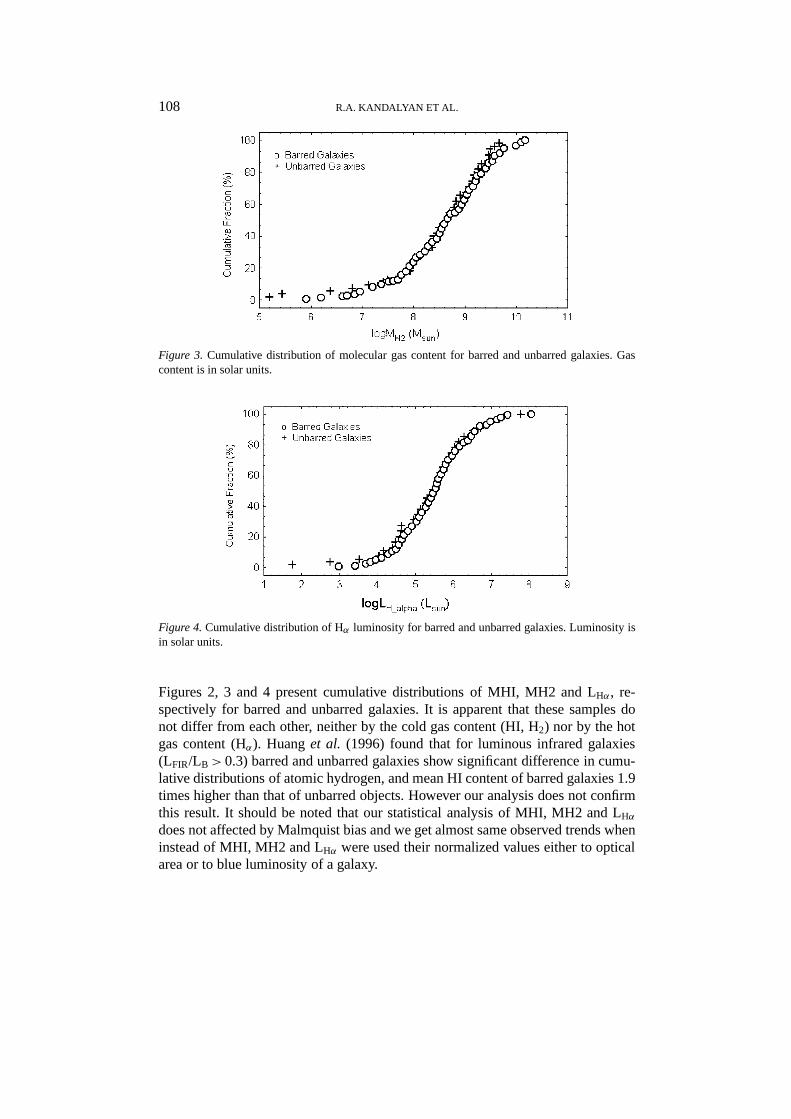
Figure 3. Cumulative distribution of molecular gas content for barred and unbarred galaxies. Gascontent is in solar units.
Figure 4.Cumulative distribution of Hα luminosity for barred and unbarred galaxies. Luminosity isin solar units.
Figures 2, 3 and 4 present cumulative distributions of MHI, MH2 and LHα, re-spectively for barred and unbarred galaxies. It is apparent that these samples donot differ from each other, neither by the cold gas content (HI, H2) nor by the hotgas content (Hα). Huanget al. (1996) found that for luminous infrared galaxies(LFIR/LB>0.3) barred and unbarred galaxies show significant difference in cumu-lative distributions of atomic hydrogen, and mean HI content of barred galaxies 1.9times higher than that of unbarred objects. However our analysis does not confirmthis result. It should be noted that our statistical analysis of MHI, MH2 and LHα
does not affected by Malmquist bias and we get almost same observed trends wheninstead of MHI, MH2 and LHα were used their normalized values either to opticalarea or to blue luminosity of a galaxy.
STAR FORMATION PROPERTIES OF SPIRAL GALAXIES 109
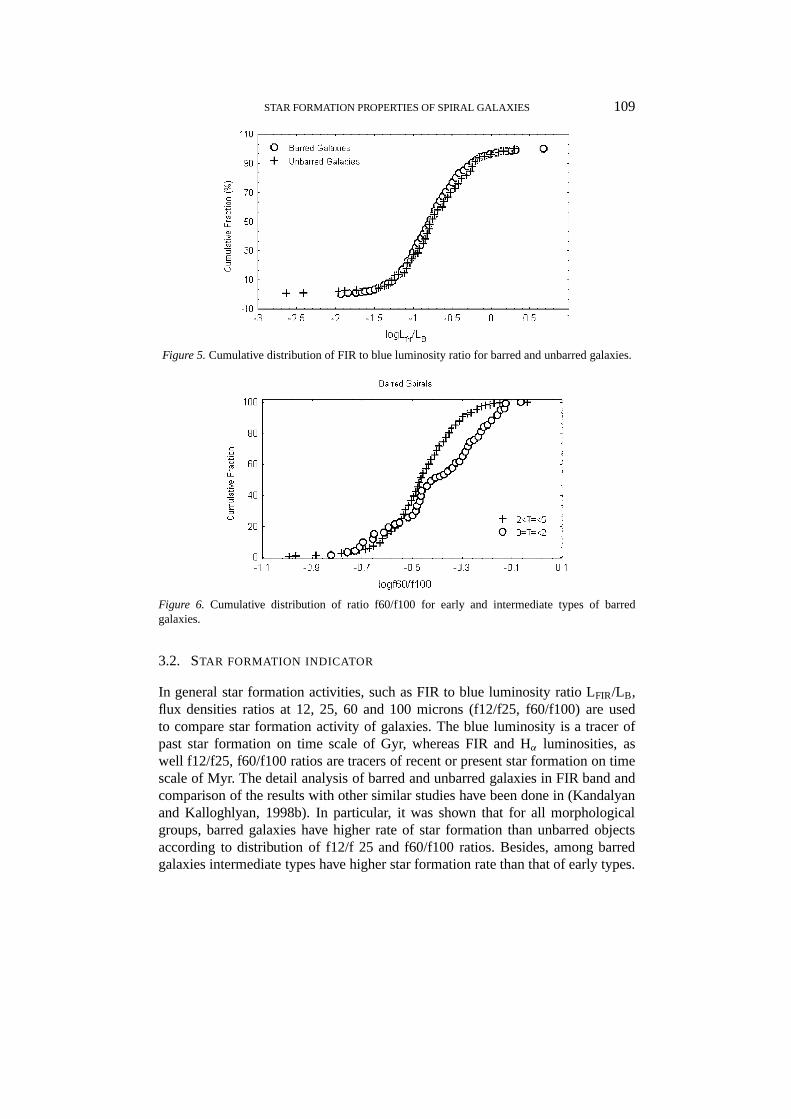
Figure 5.Cumulative distribution of FIR to blue luminosity ratio for barred and unbarred galaxies.
Figure 6. Cumulative distribution of ratio f60/f100 for early and intermediate types of barredgalaxies.
3.2. STAR FORMATION INDICATOR
In general star formation activities, such as FIR to blue luminosity ratio LFIR/LB,flux densities ratios at 12, 25, 60 and 100 microns (f12/f25, f60/f100) are usedto compare star formation activity of galaxies. The blue luminosity is a tracer ofpast star formation on time scale of Gyr, whereas FIR and Hα luminosities, aswell f12/f25, f60/f100 ratios are tracers of recent or present star formation on timescale of Myr. The detail analysis of barred and unbarred galaxies in FIR band andcomparison of the results with other similar studies have been done in (Kandalyanand Kalloghlyan, 1998b). In particular, it was shown that for all morphologicalgroups, barred galaxies have higher rate of star formation than unbarred objectsaccording to distribution of f12/f 25 and f60/f100 ratios. Besides, among barredgalaxies intermediate types have higher star formation rate than that of early types.
110 R.A. KANDALYAN ET AL.
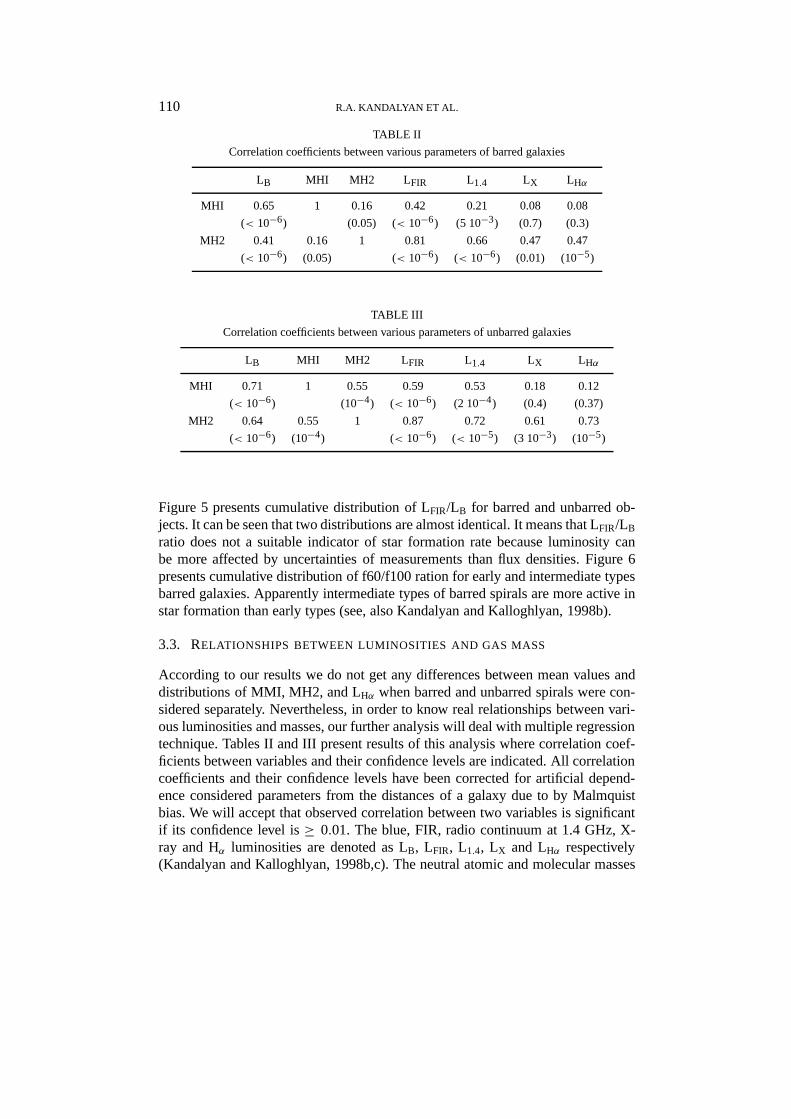
TABLE II
Correlation coefficients between various parameters of barred galaxies
LB MHI MH2 L FIR L1.4 LX LHα
MHI 0.65 1 0.16 0.42 0.21 0.08 0.08
(< 10−6) (0.05) (< 10−6) (5 10−3) (0.7) (0.3)
MH2 0.41 0.16 1 0.81 0.66 0.47 0.47
(< 10−6) (0.05) (< 10−6) (< 10−6) (0.01) (10−5)
TABLE III
Correlation coefficients between various parameters of unbarred galaxies
LB MHI MH2 L FIR L1.4 LX LHα
MHI 0.71 1 0.55 0.59 0.53 0.18 0.12
(< 10−6) (10−4) (< 10−6) (2 10−4) (0.4) (0.37)
MH2 0.64 0.55 1 0.87 0.72 0.61 0.73
(< 10−6) (10−4) (< 10−6) (< 10−5) (3 10−3) (10−5)
Figure 5 presents cumulative distribution of LFIR/LB for barred and unbarred ob-jects. It can be seen that two distributions are almost identical. It means that LFIR/LB
ratio does not a suitable indicator of star formation rate because luminosity canbe more affected by uncertainties of measurements than flux densities. Figure 6presents cumulative distribution of f60/f100 ration for early and intermediate typesbarred galaxies. Apparently intermediate types of barred spirals are more active instar formation than early types (see, also Kandalyan and Kalloghlyan, 1998b).
3.3. RELATIONSHIPS BETWEEN LUMINOSITIES AND GAS MASS
According to our results we do not get any differences between mean values anddistributions of MMI, MH2, and LHα when barred and unbarred spirals were con-sidered separately. Nevertheless, in order to know real relationships between vari-ous luminosities and masses, our further analysis will deal with multiple regressiontechnique. Tables II and III present results of this analysis where correlation coef-ficients between variables and their confidence levels are indicated. All correlationcoefficients and their confidence levels have been corrected for artificial depend-ence considered parameters from the distances of a galaxy due to by Malmquistbias. We will accept that observed correlation between two variables is significantif its confidence level is≥ 0.01. The blue, FIR, radio continuum at 1.4 GHz, X-ray and Hα luminosities are denoted as LB, LFIR, L1.4, LX and LHα respectively(Kandalyan and Kalloghlyan, 1998b,c). The neutral atomic and molecular masses
STAR FORMATION PROPERTIES OF SPIRAL GALAXIES 111
are denoted as MHI and MH2 respectively. Tables II and III reveal differences inbehavior of SB and SA galaxies on one hand, and general relationships betweengas phase components and luminosities of spiral galaxies on the other hand. Theanalysis of the Tables II and III show following results.
Main differences between barred and unbarred samples.(i) The atomic and molecular phases of the gas are not correlated for SB galax-
ies (or marginally correlated) while for SA galaxies there is a tight relationshipbetween them. This may indicate, for example, that in barred galaxies degree ofcompactness of molecular hydrogen is higher than that for unbarred objects, be-cause the H2 emission is generally concentrated within the central few kiloparsecswhile the HI gas distribution shows a depression in the central region of the galaxy.So in the SA galaxies the H2 gas can be more extended from the central part thanthat of SB objects. The CO gas indicates the rotation and/or velocity dispersionamong clouds in the innermost region, whereas the HI gas indicates the rotationand velocity dispersion of the outer disk.
(ii) The HI emission is tighter linked with the radio continuum for unbarredgalaxies than that for barred ones, which may indicate that bar structure preventselectrons of cosmic rays to escape from the central region to outer disk freely (see,Kandalyan and Kalloghlyan, 1998c; Chi and Wolfendale, 1990).
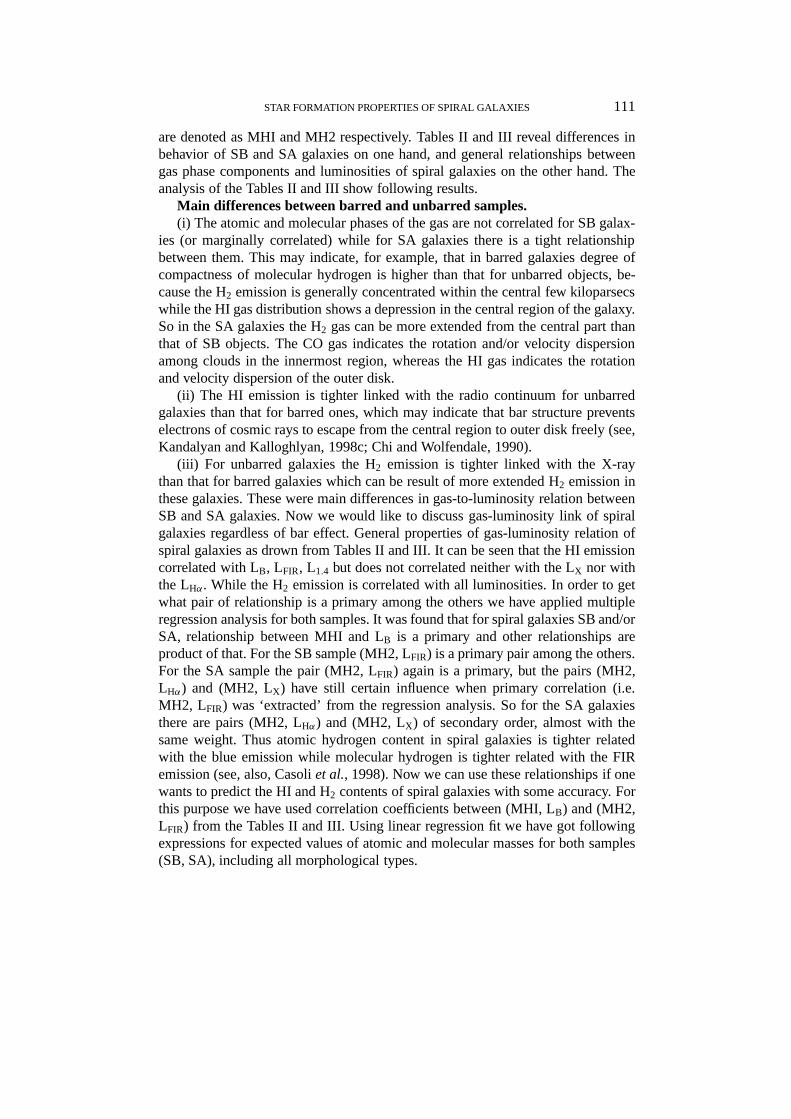
(iii) For unbarred galaxies the H2 emission is tighter linked with the X-raythan that for barred galaxies which can be result of more extended H2 emission inthese galaxies. These were main differences in gas-to-luminosity relation betweenSB and SA galaxies. Now we would like to discuss gas-luminosity link of spiralgalaxies regardless of bar effect. General properties of gas-luminosity relation ofspiral galaxies as drown from Tables II and III. It can be seen that the HI emissioncorrelated with LB, LFIR, L1.4 but does not correlated neither with the LX nor withthe LHα. While the H2 emission is correlated with all luminosities. In order to getwhat pair of relationship is a primary among the others we have applied multipleregression analysis for both samples. It was found that for spiral galaxies SB and/orSA, relationship between MHI and LB is a primary and other relationships areproduct of that. For the SB sample (MH2, LFIR) is a primary pair among the others.For the SA sample the pair (MH2, LFIR) again is a primary, but the pairs (MH2,LHα) and (MH2, LX) have still certain influence when primary correlation (i.e.MH2, LFIR) was ‘extracted’ from the regression analysis. So for the SA galaxiesthere are pairs (MH2, LHα) and (MH2, LX) of secondary order, almost with thesame weight. Thus atomic hydrogen content in spiral galaxies is tighter relatedwith the blue emission while molecular hydrogen is tighter related with the FIRemission (see, also, Casoliet al., 1998). Now we can use these relationships if onewants to predict the HI and H2 contents of spiral galaxies with some accuracy. Forthis purpose we have used correlation coefficients between (MHI, LB) and (MH2,LFIR) from the Tables II and III. Using linear regression fit we have got followingexpressions for expected values of atomic and molecular masses for both samples(SB, SA), including all morphological types.
112 R.A. KANDALYAN ET AL.
logMHI(expected) = (0.70± 0.04)logLB + (2.35± 0.38)logMH2(expected) = (0.93± 0.05)logLFIR – (0.14± 0.44), for SB sample, andlogMHI(expected) = (0.77± 0.06)logLB + (1.49± 0.55)logMH2(expected) = (1.11± 0.10)logLFIR – (2.01± 0.85), for SA sample.
In Section 3 it was argued that there are dependence of MH1 and MH2 withmorphological type. Thus in order to estimate expected gas mass in spiral galax-ies using LB and LFIR, it should be done separately for each morphological type,because slope and intercept of linear relation will depend from the type of galaxy.However, since for our samples there are not enough data at the CO line (Table I)in order to estimate expected molecular mass separately for each morphologicaltypes, and we have presented expected gas mass for all SB and SA galaxies.
4. Discussion
A large number of articles have been devoted to the investigation of the gas proper-ties of galaxies (see, e.g. Young and Scoville, 1991). Particularly gas-to-luminosityrelations of various types of galaxies have been studied extensively. The results ofcomparison between gas content and luminosity reveals different behavior of thegalaxies. For example, in the nearby spirals the HI content is unrelated with the H2
content (Braine and Combes, 1992) whereas, for the IRAS-selected galaxies thereis tight correlation between them (e.g., Younget al., 1989; Andreaniet al., 1995;Kandalyan, 1997). In some samples, HI-deficient galaxies are shown different re-lations between HI content and LFIR than HI-normal objects (Cosoliet al., 1996).Thus gas phase-to-gas phase and gas phase-to-luminosity relations in the galaxiesare different and very complicated, and depend from many internal and externalfactors such as environment, luminosity, morphology, gas content, star forminghistory etc. (Casoliet al., 1998). Of course, using different samples in the studyof the gas-to-luminosity relation reveals different properties of the galaxies. Forinstance, IRAS selected samples are biased toward galaxies with recent or presentstar forming objects while in the optically selected samples dominate past starforming galaxies.
Another important problem is related with star formation indicators. What ismore suitable indicator of star formation activity either past or present? It lookslike that spectral indices (or flux densities ratios), for example, such as f12/f25and f60/f100 more correctly reflect star formation activities than global character-istics (luminosities or their rations) of galaxies (e.g, Kandalyan and Kalloghlyan,1998b,c). Moreover, correlation coefficients between various luminosities may tellus more about star formation activities than mean values of luminosities. For ex-ample, mean luminosities and masses of barred and unbarred galaxies do not differ,but their flux densities ratios f12/f25 or f60/f100 are deviate significantly (Kan-dalyan and Kalloghlyan, 1998b). There are also different behaviors in relationshipsbetween global parameters of two samples (Kandalyan and Kalloghlyan, 1998c
STAR FORMATION PROPERTIES OF SPIRAL GALAXIES 113
and Section 3 of the present paper). Besides flux densities are not affected by un-certainties of distance measurements. Observed global parameters of the galaxiescan be suffered, for instance, miss classification of SA galaxies and some of themmay have weak bars; variation of the CO-H2 conversion factor from one morpho-logical type to another; differences of spatial resolutions of the telescopes at thedifferent wavelengths; uncertainties of measured flux densities and magnitudes.But all these uncertainties could not create artificial correlation, and may only addsome dispersion to existing relationships and sometimes hide them. However theseuncertainties will contaminate the data of both samples (SB and SA) in the sameway. Of course, the MH2/MHI ratio for spiral galaxies strongly depends from theCO-H2 conversion factor. But there are several indications that this factor for spiralgalaxies could be even lower than our adopted value of 3 1020 (e.g., Digelet al.,1996). Thus actual H2 masses could be even lower than we have estimated, and theMH2/MHI ratio is even lower than what we find.
Our finding that the HI content in spiral galaxies is better correlated with theblue luminosity than with FIR luminosity is in good agreement with the previousresults (see, e.g., Casoliet al., 1998 and references therein). It is also well knownthat H2 content is directly related with FIR luminosity because star formation inthe galaxies is taking place inside the molecular clouds. However our finding thatfor unbarred galaxies there are not negligible relationships between H2 content Hαand/or X-ray luminosity, as we know is a new result.
We have also found that there is tight relationship between two gas phases inSA galaxies, while it is extremely weak in SB objects. Whether presented aboveresults of correlation analysis (Section 3.3) reflect differences in star formationactivities between barred and unbarred galaxies? According to observations withhigh angular resolution at CO lines the molecular gas is concentrated in the centralregion of barred galaxies, and it is usually distributed along the bar (e.g., Benedictet al., 1996). Suppose that in unbarred galaxies molecular gas has larger extendfrom the central part than that of barred galaxies. When both types have sametotal molecular gas than in the central region of barred galaxies it should be moreamount of molecular gas than in the central part of unbarred ones, and consequentlymolecular gas of the disk in SB galaxies will be less than that of SA objects. Hencein the central region of SB galaxies star formation activity can be higher than thatin SA objects, since star formation is taking place in the molecular clouds, like inour Galaxy. But in that case star formation activity in the disk should be higherin SA galaxies than that in SB ones. On the other hand it is well known that starformation rate and efficiency in the central part of a galaxy is much higher than inthe disk. So, as a result star formation activities of barred galaxies will be higherthan that in unbarred objects. It seems very likely that results of correlation analysissupport such behavior of barred and unbarred galaxies. In that case existent tightrelationships between (MHI, MH2), (MH2, LHα) and (MH2, LX) for SA galaxiesare result of extended structure of molecular gas, since either X-ray, Hα or HIemission in a galaxy also have disk component. Of course there could be other
114 R.A. KANDALYAN ET AL.
explanations of these properties of barred and unbarred galaxies, but we think thatour explanation is more realistic. Further observations with high angular resolutionat HI, CO and other wavelengths will help to understand star formation propertiesof spiral galaxies.
5. Conclusions
The main results of this work are summarized in the following:1. The atomic and molecular gas properties of barred and unbarred galaxies are
analyzed using two complete samples. It is shown that in gas content bothtypes of spirals do not differ from each other.
2. In the sample of spiral galaxies, on average, there is 6 times more HI than H2.The ratio MH2/MHI decreases from early to late types. This variation is dueto by increasing of the atomic gas mass and decreasing of the molecular gasmass from early to late types of spirals.
3. There are different behaviors of the gas-to-luminosity relationships betweenbarred and unbarred galaxies which may indicate on high star formation activ-ity of barred galaxies with respect unbarred ones.
4. In general HI content in spiral galaxies is better correlated with blue lumin-osity while H2content is tighter related with FIR luminosity. However forunbarred galaxies there are not negligible relationships between H2 and/orHα, X-ray luminosities.
5. We have estimated expected value of gas content (HI and H2) for barred andunbarred galaxies using blue and FIR luminosities.
Acknowledgements
This research has made use of the Lyon-Meudon Extra-galactic Database (LEDA),supplied by the LEDA team at CRAL-Observatoire de Lyon (France).
References
Andreani, P., Casoli, F. and Gerin, M.: 1995,Astron. Astrophys.300, 43.Arsenault, R.: 1989,Astron. Astrophys.217, 66.Benedict, F.G., Smith, B.J. and Kenney J.D.: 1996,Astron. J.111, 1861.Brain, J. and Combes, F.: 1992,Astron. Astrophys.264, 433.Casoli, F., Dickey, J., Kazes, I., Boselli, A., Gavazzi, P. and Baumgardt, K.: 1996,Astron. Astrophys.
309, 43.Casoli, F., Sauty, S., Gerin, M., Boselli, A., Fouque, P., Braine, J., Gavazzi, G., Lequeux, J. and
Dickey, J.: 1998,Astron. Astrophys.331, 451.Chi, X. and Wolfendale, A.W.: 1990,Mon. Not. R. Astron. Soc.245, 101.
STAR FORMATION PROPERTIES OF SPIRAL GALAXIES 115
Contini, T.: 1996, PhD Thesis, Universite Paul Sabatier, Toulouse, France.Contini, T., Considere, S. and Davoust E.: 1998,Astron. Astrophys. Suppl.130, 2.De Jong, T., Clegg, P.E., Soifer, B.T.,et al.: 1984,Astrophys. J.278, L67.Devereux, N.A.: 1987,Astrophys. J.323, 91.Devereux, N.A., Becklin, E.E. and Scoville, N.: 1987,Astrophys. J.312, 529.Digel, S., Grenier, I., Heithausen, A.,et al.: 1996,Astrophys. J.463, 604.Elfhag, T., Booth, R.S., Hoglund, B., Johansson, L.E.B. and Sandqvist, Aa.: 1996,Astron. Astrophys.
Suppl.115, 439.Eskridge, P.B. and Pogge, R.W.: 1991,Astron. J.101, 2056.Giuricin, G., Biviano, A., Girardi, M., Mardirossian, F. and Mazzetti, M.: 1993,Astron. Astrophys.
275, 390.Giuricin, G., Tamburini, L., Mardirossian, F., Mazzetti, M. and Monaco, P.: 1994,Astrophys. J.427,
202.Hawarden, T.G., Mountain, C.M., Leggett, S.K. and Puxley, P.J.: 1986,Mon. Not. R. Astron. Soc.
221, 41.Ho, L.C., Filippenko, A.V. and Sargent, W.L.W.: 1997a,Astrophys. J.487, 591.Ho, L.C., Filippenko, A.V. and Sargent, W.L.W.: 1997b,Astrophys. J.487, 568.Ho, L.C., Filippenko, A.V. and Sargent, W.L.W.: 1997c,Astrophys. J. Suppl.112, 315.Huang, J.H., Gu, Q.S., Su, H.J., Hawarden, T.G., Liao, X.H. and Wu, G.X.: 1996,Astron. Astrophys.
313, 13.Isobe, T. and Feigelson, E.D.: 1992,Astrophys. J. Suppl.79, 197.Kalloghlyan, A.T. and Kandalyan, R.A.: 1998,Astrophysics41, 185.Kandalyan, R.A.: 1996,Astrophysics39, 327.Kandalyan, R.A.: 1997, in:Galaxy Interactions at Low and High Redshift, 23rd IAU GA, S186,
Kyoto.Kandalyan, R.A. and Kalloghlyan, A.T.: 1998a,Astrophysics41, 5.Kandalyan, R.A. and Kalloghlyan, A.T.: 1998b,Astrophysics41, 349.Kandalyan, R.A. and Kalloghlyan, A.T.: 1998c,Astrophysics41, 599.Kenney, J.D. and Young, J.S.: 1988,Astrophys. J. Suppl.66, 261.Phillip, A.C.: 1996, in: R. Buta, R. Buta, D.A. Crocker and B.G. Elmegreen (eds.),Barred Galaxies,
ASP Conf., Ser., Vol. 91.Sage, L.J.: 1993,Astron. Astrophys.272, 123.Sanders, D.B., Scoville, N.Z. and Soifer, B.T.: 1991,Astrophys. J.370, 158.Stark, A.T., Knapp, G.R., Bally, J., Wilson, R.W., Penzias, A.A. and Rowe, H.E.: 1986,Astrophys. J.
310, 660.Young, J.S.,et al.: 1995,Astrophys. J. Suppl.98, 219.Young, J.S., Allen, L., Kenney, J.D., Lesser, A. and Rownd, B.: 1996,Astron. J.112, 1903.Young, J.S. and Knezek, P.M.: 1989,Astrophys. J.347, L55.Young, J.S. and Scoville, N.Z.: 1991,Annu. Rev. Astron. Astrophys.29, 581.Young, J.S., Xie, S., Kenney, J.D. and Rice, W.L.: 1989,Astrophys. J. Suppl.70, 699.
