stanford universitysnap.stanford.edu/class/cs322-2009/08-macro-evol-annot.pdf · stanford...
TRANSCRIPT

CS 322: (Social and Information) Network AnalysisJure LeskovecStanford University

How do networks evolve at the macroscopic How do networks evolve at the macroscopic level?
Are there global phenomena of network evolution?evolution?
What are analogs of the “small world” and What are analogs of the small world and “power‐law degrees”
10/15/2009 Jure Leskovec, Stanford CS322: Network Analysis

What is the relation between the number What is the relation between the number of nodes n(t) and number of edges e(t)over time t?over time t?
How does diameter change as the network How does diameter change as the network grows?
How does degree distribution evolve as the network grows?the network grows?
10/15/2009 Jure Leskovec, Stanford CS322: Network Analysis

[Leskovec et al. KDD 05]
N(t) nodes at time t N(t) … nodes at time t E(t) … edges at time t Suppose that Suppose that
N(t+1) = 2 * N(t) Q: what is Q: what is
E(t+1) =A d bl d! A: over‐doubled! But obeying the Densification Power Law
10/15/2009 Jure Leskovec, Stanford CS322: Network Analysis

[Leskovec et al. KDD 05]
Citations amongCitations among physics papers
1992:E(t)
1,293 papers,2,717 citations
2003
1.69
2003: 29,555 papers, 352,807 citations352,807 citations
For each month M, create a graph N(t)of all citations up to month M
N(t)
10/15/2009 Jure Leskovec, Stanford CS322: Network Analysis

[Leskovec et al. KDD 05]
Densification Power Law Densification Power Law the number of edges grows faster than the number of nodes – average degree is increasingg g g
orequivalently
a … densification exponent: 1 ≤ a ≤ 2: a=1: linear growth – constant out‐degree (traditionally assumed) a=2: quadratic growth clique a=2: quadratic growth – clique
10/15/2009 Jure Leskovec, Stanford CS322: Network Analysis

[Leskovec et al. KDD 05]
Prior work on Power Law graphs hints at Prior work on Power Law graphs hints atSlowly growing diameter: diameter ~ O(log N) diameter ~ O(log N) diameter ~ O(log log N)
Wh i h i i l d ? What is happening in real data?
10/15/2009 Jure Leskovec, Stanford CS322: Network Analysis

[Leskovec et al. KDD 05]
diameter Citations among physics papers
1992 –2003 One graph per year
i [ ]time [years]
10/15/2009 Jure Leskovec, Stanford CS322: Network Analysis

[Leskovec et al. TKDD 07]
met
er
Erdos‐Renyirandom graphIs shrinking
diameter just a di
amDensification exponent a =1.3
jconsequence of densification?
size of the graph
p
size of the graph
Densifying random graph has increasing diameterThere is more to shrinking diameter
10/15/2009 Jure Leskovec, Stanford CS322: Network Analysis
diameterThere is more to shrinking diameter than just densification

[Leskovec et al. TKDD 07]
Cit tiIs it the degree sequence?Compare diameter of a:
eter
Citations
True network (red) Random network with
diam
e
the same degree distribution (blue) size of the graph
Densification + degree sequence h k dgive shrinking diameter
10/15/2009 Jure Leskovec, Stanford CS322: Network Analysis

[Leskovec et al. TKDD 07]
How does degree distribution evolve to allow How does degree distribution evolve to allow for densification?
2 Options: 2 Options: 1) Degree exponent is constant: Fact 1: For degree exponent 1<<2: a = 2/ Fact 1: For degree exponent 1<<2: a = 2/
10/15/2009 Jure Leskovec, Stanford CS322: Network Analysis
Email network

[Leskovec et al. TKDD 07]
How does degree distribution evolve to allow How does degree distribution evolve to allow for densification?
2 Options: 2 Options: 2) Exponent n evolves with graph size n: Fact 2: Fact 2:
10/15/2009 Jure Leskovec, Stanford CS322: Network Analysis
Citation network

[Leskovec et al. TKDD 07]
Densification and Shrinking diameter can be Densification and Shrinking diameter can be observed in many real life graphs:
10/15/2009 Jure Leskovec, Stanford CS322: Network Analysis

What explains the Densification Power Law What explains the Densification Power Lawand Shrinking diameters
Can we find a simple model of local behavior, which naturally leads to the observedwhich naturally leads to the observed phenomena?
Yes! Community Guided Attachment
10/15/2009 Jure Leskovec, Stanford CS322: Network Analysis

[Leskovec et al. TKDD 07]
Let’s assume the Let s assume the community structure Science Arts
University
One expects many within‐group f i d hi d
CS Math Drama Music
Science Arts
friendships and fewer cross‐group onesones
How hard is it to i i ?
Self‐similar university it t tcross communities? community structure
10/15/2009 Jure Leskovec, Stanford CS322: Network Analysis

Assume the cross community linking Assume the cross‐community linking probability of nodes at tree‐distance h is scale‐freescale free
Then the cross‐community linking probability is: p y
where: c ≥ 1 … the Difficulty constant≥ ff yh … tree‐distance
10/15/2009 Jure Leskovec, Stanford CS322: Network Analysis

n = 2k nodes reside in the leaves of the b way n = 2 nodes reside in the leaves of the b‐way community hierarchy (assume b=2)
Each node then independently creates edges based the community hierarchybased the community hierarchy,
How many edges m are in a graph of n nodes?10/15/2009 Jure Leskovec, Stanford CS322: Network Analysis

[Leskovec et al. TKDD 07]
l d d h Claim: Community Guided Attachment random graph model, the expected out‐d f d i i ldegree of a node is proportional to
10/15/2009 Jure Leskovec, Stanford CS322: Network Analysis

What is expected out degree of a node x? What is expected out‐degree of a node x?
10/15/2009 Jure Leskovec, Stanford CS322: Network Analysis

10/15/2009 Jure Leskovec, Stanford CS322: Network Analysis

Claim: The Community Guided Attachment Claim: The Community Guided Attachment leads to Densification Power Law with exponentp
d ifi ti t a … densification exponent b … community tree branching factor c difficulty constant 1 ≤ c ≤ b c … difficulty constant, 1 ≤ c ≤ b
10/15/2009 Jure Leskovec, Stanford CS322: Network Analysis

DPL: DPL:
Gives any non‐integer Densification Gives any non‐integer Densification exponent
If c = 1: easy to cross communities If c = 1: easy to cross communities Then: a=2, quadratic growth of edges – near cliqueclique
If c = b: hard to cross communities Then: a=1 linear growth of edges – constant Then: a=1, linear growth of edges – constant out‐degree
10/15/2009 Jure Leskovec, Stanford CS322: Network Analysis

[Leskovec et al. TKDD 07]
Community tree evolves by a complete newCommunity tree evolves by a complete new level of nodes being added in each time step Now nodes also reside in non‐leafs of the treeNow nodes also reside in non leafs of the tree
Can show:Can show: Densification + power‐law degree distribution
10/15/2009 Jure Leskovec, Stanford CS322: Network Analysis

[Leskovec et al. TKDD 07]
Topics of web pages: Topics of web pages: Each node represents k pages Nodes everywhere in the treeNodes everywhere in the tree Link up h levels with prob. ~ -h
Simplification: only bottom level creates links10/15/2009 Jure Leskovec, Stanford CS322: Network Analysis

[Leskovec et al. TKDD 07]
Expected degree of a node at height h: Expected degree of a node at height h:
Fraction of nodes with degree >d as a Fraction of nodes with degree >d as a function of d?
10/15/2009 Jure Leskovec, Stanford CS322: Network Analysis

Normal N(x) = Normal N(x) =
Limit of avg of indep draws from a random var Limit of avg. of indep. draws from a random varfrom any distribution
X is lognormally distributed if Y = ln X is X is lognormally distributed if Y ln X is normally distributed
Log‐normal density Log normal density f(x)=
10/15/2009 Jure Leskovec, Stanford CS322: Network Analysis

[Mitzenmacher]
11e
xxf x 22 2/)(ln1
21)(
Properties:
x2
Finite mean/variance. Skewed: mean > median > mode Multiplicative: X1 lognormal, X2 lognormal implies X1X2 lognormal.
10/15/2009 Jure Leskovec, Stanford CS322: Network Analysis

[Mitzenmacher]
Looks similar to power‐law on log‐log plot:p g g p Power‐law has linear log‐density
cxxf lnln)(ln For large , lognormal has nearly linear log‐
cxxf lnln)(ln
density:
2ln2ll)(l xf
Similarly both have near linear log ccdfs
22
2lnln)(ln xxf
Similarly, both have near linear log‐ccdfs. Question: how to differentiate them empirically?
10/15/2009 Jure Leskovec, Stanford CS322: Network Analysis

Question: Is this distribution lognormal or a Question: Is this distribution lognormal or a power law? Reasonable follow up: Does it matter? Reasonable follow‐up: Does it matter?
Generative model:Generative model: Size‐independent + growth Size (e g popularity degree) start at one andSize (e.g., popularity, degree) start at one and changes in each step by a random multiplicative factor F
10/15/2009 Jure Leskovec, Stanford CS322: Network Analysis

Start with an organism of size X Start with an organism of size X0. At each time step, size changes by a random multiplicative factor XFXmultiplicative factor.
Claim: If F is taken from a lognormal
11 ttt XFX Claim: If Ft is taken from a lognormal distribution, each Xt is lognormal.
10/15/2009 Jure Leskovec, Stanford CS322: Network Analysis

Claim: If F is taken from a lognormal Claim: If Ft is taken from a lognormal distribution, each Xt is lognormal.
If Ft are independent, identically distributed then (by CLT) X converges to lognormalthen (by CLT) Xt converges to lognormal distribution.
ln Xt = size at time t = ln F1+ ln F2+…+ln Ft
ln Xt = ln Fj ~ normal dist Xt is lognormal10/15/2009 Jure Leskovec, Stanford CS322: Network Analysis

[Mitzenmacher]
If there exists a lower bound: If there exists a lower bound:
),max( 11 ttt XFX then Xt converges to a power law distribution [Champernowne 1953]
11 ttt
[Champernowne, 1953]
Lognormal model easily pushed to a power Lognormal model easily pushed to a power law model
10/15/2009 Jure Leskovec, Stanford CS322: Network Analysis
[Mitzenmacher]
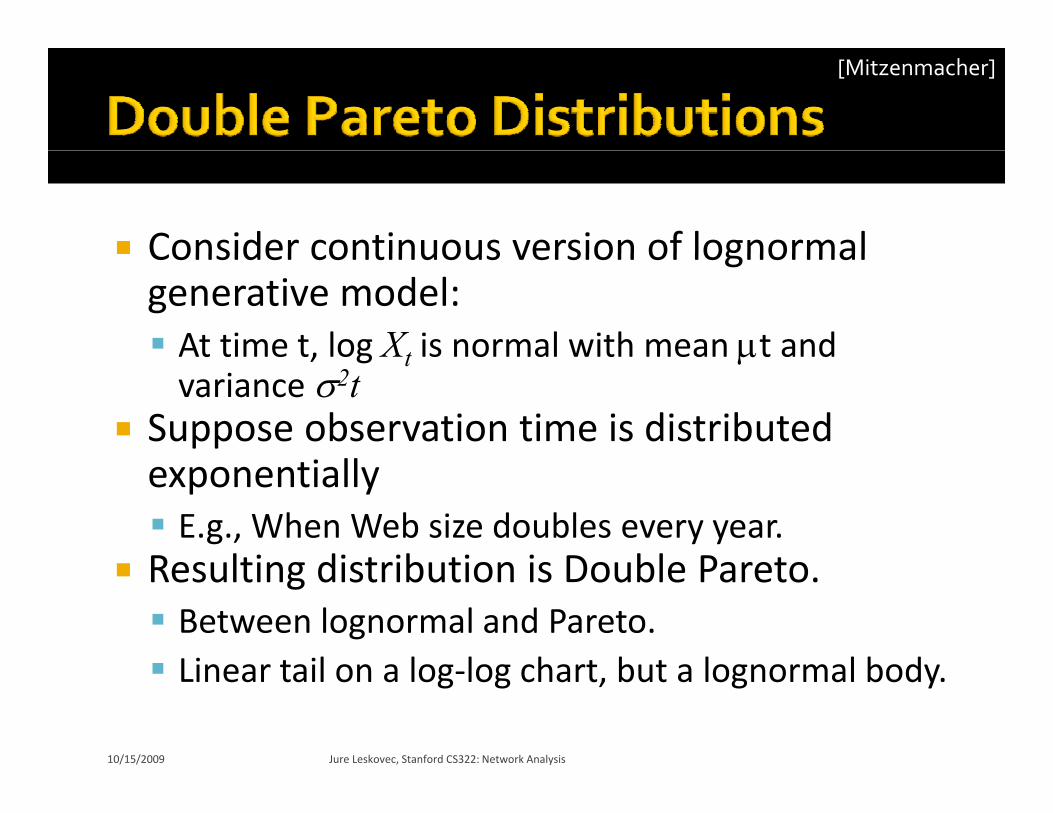
Consider continuous version of lognormal Consider continuous version of lognormal generative model: At time t, log Xt is normal with mean t andAt time t, log Xt is normal with mean t and variance 2t
Suppose observation time is distributed exponentially E.g., When Web size doubles every year.R lti di t ib ti i D bl P t Resulting distribution is Double Pareto. Between lognormal and Pareto. Li t il l l h t b t l l b d Linear tail on a log‐log chart, but a lognormal body.
10/15/2009 Jure Leskovec, Stanford CS322: Network Analysis

[Mitzenmacher]
10/15/2009 Jure Leskovec, Stanford CS322: Network Analysis
Hierarchical model that produces power laws Hierarchical model that produces power‐laws
Zipf’s law – how does the frequency of a word Zipf s law – how does the frequency of a word depend on its rank?
Empirically: rank ~1/freq
10/15/2009 Jure Leskovec, Stanford CS322: Network Analysis

10/15/2009 Jure Leskovec, Stanford CS322: Network Analysis

Mandelbrot experiment: design a language over a d‐ary alphabet to optimize information per character. Probability of jth most frequently used word is pj. Length of jth most frequently used word is cj.A i f ti d Average information per word:
Average characters per word: j jj ppH 2log
Average characters per word:
j jjcpC
Optimization leads to power law.10/15/2009 Jure Leskovec, Stanford CS322: Network Analysis

Alphabet of c letters plus spacebar Alphabet of c letters plus spacebar Monkey sits at a typewriter and randomly pushes keyspushes keys Uniformly random sequence of c+1 symbols –spaces mark word boundariesspaces mark word boundaries
Word ranks 1 2 c 1 letter words 1, 2, …, c 1‐letter words c+1, …, c2+c+1 2‐letter words c2+c+1+1 3 letter words c2+c+1+1, … 3‐letter words
10/15/2009 Jure Leskovec, Stanford CS322: Network Analysis
Each j letter word has frequency (c+1)‐(j+1) Each j‐letter word has frequency (c+1) (j )
Pick representative point cj for j‐letter word Rank cj is a j‐letter word with freq (c+1)‐(j+1) Rank cj is a j‐letter word with freq (c+1) (j )
10/15/2009 Jure Leskovec, Stanford CS322: Network Analysis

Write (c+1)‐(j+1) as a function of rank Write (c+1) (j ) as a function of rank
10/15/2009 Jure Leskovec, Stanford CS322: Network Analysis