stain removal paper
TRANSCRIPT

promoting access to White Rose research papers
White Rose Research Online
Universities of Leeds, Sheffield and York http://eprints.whiterose.ac.uk/
This is an author produced version of a paper published in Wear. White Rose Research Online URL for this paper: http://eprints.whiterose.ac.uk/3521/
Published paper Lewis, R., Barber, S.C. and Dwyer-Joyce, R.S. (2007) Particle motion and stain removal during simulated abrasive tooth cleaning, Wear, Volume 263 (1-6), 188 - 197.

PARTICLE MOTION AND STAIN REMOVAL DURING SIMULATED
ABRASIVE TOOTH CLEANING
R. LEWIS*, S.C. BARBER, R.S. DWYER-JOYCE
Department of Mechanical Engineering, The University of Sheffield, Mappin Street,
Sheffield, S1 3JD
*Corresponding author: Tel. +44 (0) 114 2227838; Fax. +44 (0) 114 2227890

ABSTRACT
Stain removal from teeth is important both to prevent decay and for appearance. This is
usually achieved using a filament based toothbrush with a toothpaste consisting of abrasive
particles in a carrier fluid. This work has been carried out to examine how these abrasive
particles interact with the filaments and cause material removal from a stain layer on the
surface of a tooth. It is important to understand this mechanism as while maximum cleaning
efficiency is required, this must not be accompanied by damage to the enamel or dentine
substrate.
In this work simple abrasive scratch tests were used to investigate stain removal mechanism
of two abrasive particles commonly used in tooth cleaning, silica and perlite. Silica particles
are granular in shape and very different to perlite particles, which are flat and have
thicknesses many times smaller than their width.
Initially visualisation studies were carried out with perlite particles to study how they are
entrained into a filament/counterface contact. Results were compared with previous studies
using silica. Reciprocating scratch tests were then run to study how many filaments have a
particle trapped at one moment and are involved in the cleaning process. Stain removal tests
were then carried out in a similar manner to establish cleaning rates with the two particle
types. Perlite particles were found to be less abrasive than silica. This was because of their
shape and how they were entrained into the filament contacts and loaded against a
counterface. With both particles subsurface damage during stain removal was found to be
minimal.
A simple model was built to predict stain removal rates with silica particles, which gave
results that correlated well with the experimental data.
Keywords: teeth cleaning, stain removal, abrasive particles, toothbrush, toothpaste
1 INTRODUCTION
The removal of stain from teeth allows our smiles to be cosmetically acceptable to society of
today. If stain is seen to cover more than five percent of an incisor tooth it is considered to be
cosmetically unacceptable [1].
There are two main types of tooth stain, intrinsic and extrinsic. Intrinsic stains are caused by
the natural colour of dentine showing through the translucent enamel layer on a tooth. The
colour of dentine varies from person to person and may vary from white through to brown.
These intrinsic stains are not possible to remove.
Extrinsic stain forms on the tooth surface. The most common of these stains is pellicle, which
is initially a bacterium free layer 1-10 µm thick formed from proteins in the oral environment.
Once it becomes infected with bacteria it becomes stained by tannin rich foods such as red
wine or cationic agents such as chlorhexadine, commonly found in mouth rinses [2]. Work by
White [3] and Sheen [4] has shown that chlorhexadine may promote the absorption of tannin
rich foods such as tea or coffee into the pellicle layer. The mechanical properties of pellicle,
such as hardness, have been found to be similar to those of dentine [5], but those of other
stains can vary considerably depending on the length of accumulation time and other factors.
Stain can be observed as different colours, each colour with its most likely cause are
summarised in Table 1. Although, as indicated, foodstuffs and tobacco have been shown to
stain teeth, there has been no correlation found between the volume of food or amount of
tobacco and the stain intensity [6].
Teeth are usually cleaned using a filament based toothbrush and a toothpaste, which consists
of abrasive particles in a carrier fluid. The particles are made from materials such as calcium
carbonate, sodium bicarbonate, precipitated silica, pumice and perlite. During brushing the
particles are intended to be trapped and loaded at the filament tips and scrape away the softer
underlying stain (see Figure 1). The particle/filament interaction is therefore key to the
cleaning performance.
Although optimum stain removal is desired from a toothpaste abrasive it is important that
during the cleaning process that the underlying material (enamel or dentine) or soft gum
tissue is not damaged. Abrasive selection is therefore quite difficult due to the varying
properties of stain. Dentine is four to five times softer than enamel and therefore wear
concerns would clinically be expected to more important with respect to dentine. Patients and
practitioners, however, value cleaning formulations which are gentle to both materials [7, 8].
There are other components in toothpaste that act chemically to reduce stain and whiten teeth.
Stain can be either dissolved or bleached using peroxides. Enzyme systems and absorbents
are also used to soften the pellicle easing the removal process. This is important in regions of
the mouth less accessible by a toothbrush.
The cleaning performance of toothbrushes and toothpastes is assessed using a number of
different in vivo, in vitro and in situ tests. For the toothpastes, these are used to determine the
stain removal capability and the abrasivity.
Typical in vivo tests involve using volunteers and controlling their diet and toothbrushing
regimes while taking measurements of stain accumulation and removal. One example is a
study carried out using a sample of forty volunteers [9] who were instructed to use low
abrasive toothpaste for six weeks allowing stain to accumulate. Three independent observers
carried out initial stain assessments on each individual. A hygienist then brushed their teeth
under specified conditions before they were reassessed by the observers to assess the levels of
stain removal. In this type of testing although the actual oral environment is used, there is
little control over brushing technique and quantitative measurements are very difficult to
obtain.

A number of simulators have been developed for carrying out in vitro testing (see for example
[10, 11, 12, 13]). Most of these work by mechanically loading and moving a toothbrush head
over a test specimen, which is typically made from bovine dentine, enamel or acrylic. With in
vitro testing the level of control over brushing parameters is high, but specimens are not
exposed to the actual oral environment and model stains have to be applied to specimens.
In situ tests offer a compromise and involve using dentine or enamel specimens mounted in
devices worn in the mouth by subjects and then removed for ex vivo testing in a brushing
simulator [14, 15]. Specimens can therefore be exposed to the chemical environment within
the mouth, brushing can be controlled well and measurements are easier to take.
In all types of test the performance of the toothpaste or toothbrush is compared to that of a
standard paste and brush.
In such testing, however, no investigations have been carried out to study the actual
mechanism of material removal from a stain layer. Work has been undertaken to study
particle/filament interaction visually [16], identified above as being critical in the cleaning
process, which has shown how silica particles are entrained in a filament/counterface contact
and subsequently loaded against the counterface. The effect of varying load and filament
deflection was also qualitatively determined. Subsequent work was carried out using scratch
testing to study and model the removal of material from hard tissue materials and dental
restoratives [17], but did not investigate stain layers.
The aims of this work were to study material removal from a stain layer using simulated
toothbrushing with both silica particles and perlite particles. Perlite particles are currently
being introduced to toothpastes with the aim of reducing their abrasivity without
compromising cleaning power. They differ considerably in geometry from silica particles
used in previous studies although perlite is actually largely made up of silica with aluminium
oxide and sodium oxide being the next largest constituents. They are flat in nature (see Figure
2) (reminiscent of broken egg shells) with widths (up to 100 µm) many time their thickness
(~2 µm). Silica particles are granular in shape.
Visualisation studies were initially carried out to see how the entrainment and loading of
perlite particles in a filament/counterface contact differed from that previously seen for silica
particles. Abrasion tests were then run to determine for a given load how many particles were
causing material removal and the actual material removal mechanisms and rates from a stain
layer.
2 VISUALISATION STUDIES
2.1 Test Apparatus
Simple optical apparatus was used to enable the visualisation of perlite particles in a
simulated teeth cleaning contact (shown in Figure 3). This was the same apparatus as used in
the previous work using ~10µm silica particles [16]. A toothbrush head was loaded against a
rotating glass disc using a hydraulic actuator. The toothbrush head was located in a clip
attached to the hydraulic actuator. The fluid/abrasive particle mixture was applied either to
the brush head prior to loading or fed in during disc rotation. The contact region was observed
using a positionable microscope attached to the rig. Image capture was by a CCD video
camera.
2.2 Specimens and Operating Conditions
A standard toothbrush design consisting of equi-spaced tufts of filaments of equal length was
used in the tests (as shown in Figure 4).
Load and brushing speed used in the tests were based on reported measurements taken during
in vivo experiments [18, 19]. A load of 225g was used with a sliding speed of 30mm/s. Perlite
particles were mixed with water at 1% concentration by mass.
2.3 Results
Observation of the filament tip contacts showed that the perlite particles were passing though
the tip contacts in a flat orientation, as shown in Figures 5a and 5b. Particles continued to
pass through the contact for the duration of the test and did not accumulate around the
filament tips. The particles appeared to re-orientate themselves just before entering the
filament tip contact as if to find the path of least resistance. This was very different to the
action of silica particles under similar conditions [16]. They were seen to build-up around the
filament tip, as shown in Figure 5c, with some passing through the tip contact at low loads
and filament deflections. Even the largest perlite particles were able to pass through the
contact. Similar sized silica particles were unable to do so and were deflected away from the
filament tip.
Increasing load stopped perlite particles from entering the contact. This was probably due to
the deflected shape of the filaments. At higher loads silica particles were also not able to enter
the contact, but as with lower loads, accumulated around the edge of the contact [16].
3 ABRASION EXPERIMENTS
Two types of abrasion test were carried out to study scratch formation and relate this to
particle behaviour seen during visualisation studies. The first set of tests was carried out to try
to determine the mechanism of abrasion by inspection of scratched surfaces. The second set

of tests was carried out to study the material removal process from a model stain layer from
the morphology of the scratches formed and the stain removal rate.
3.1 Apparatus
The abrasion tests were performed using a linear reciprocating rig. The set-up used is shown
in Figure 6. A perspex specimen was clamped into a holder mounted on the rig. The
fluid/particle mixture was applied to the specimen using a pipettor to ensure an equal amount
was used for each test. The toothbrush head, clamped to the end of an arm attached to the
oscillator, was then loaded against the perspex specimen.
3.2 Specimens and Operating Conditions
Standard toothbrushes consisting of 34 equi-spaced tufts of 36 nylon filaments (0.2mm
diameter and 11.2mm long) were used in the tests (see Figure 4). A new brush head was used
for each test. Particles were mixed with water at 1% concentration by mass.
Scratch tests were carried out using both silica and perlite particles to assess what differences
there were in abrasive behaviour due to varying particle geometry. A test was also carried out
with no particles. A load of 200g was used in all the tests. Peak to peak motion was 5mm.
Tests were run for either 4500 cycles or 50 cycles at a frequency of 5Hz. This allowed long
term scratch behaviour to be observed, for example how many filaments were actually in
contact with the perspex counterface and trapping particles and causing scratches etc. as well
as short term behaviour to determine how many particles were causing scratches at a single
point in time.

Stain removal tests were carried out by applying a model stain, created using an organic dye,
painted onto the perspex specimens. Stain thickness was assessed using a profilometer. As
shown in Figure 7, the thickness was approximately 1 µm. A range of loads were used from
10 to 300g and the brushing time was 15 seconds (75 cycles). These tests were run using
silica (10 µm) and perlite particles (again at 1% concentration by mass) and with no particles.
A test was also carried out at 200g to determine how stain removed varied with time. The test
was stopped every 15 seconds (75 cycles) to assess stain removal. Tests were repeated at each
set of conditions two or three times to check for repeatability.
To establish the amount of stain removed a grid of 2 × 2 mm squares was placed over the
brushed area of stain and the number of squares containing scratches through to the perspex
was counted. Results were plotted as the proportion of the brushed area with scratches
through to the perspex counterface (number of squares with scratches through to
perspex/number of squares in brushed area). This is quite a crude method and will clearly
give an upper estimate for the stain removed.
3.3 Results
Figure 8 shows typical scratch patterns attained from tests with perlite and silica particles. It
can be seen that less scratches occurred when using perlite and that they were different in
nature. Scratches caused by perlite were less uniform than those caused by silica particles.
The trapped perlite particles appear to be less stable than silica particles; presumably they are
not held so rigidly by the filament. Scratches caused by perlite particles can also be seen to be
less deep.
The peak to peak distance moved by the reciprocating arm was 5mm, but the scratches were
only about 1mm long (for tests with silica). This is because there is a lag in the filament
motion as some of the sliding distance of 5mm is taken up by elastic deformation of the
filaments. This was also observed in previous scratch testing [17]. It is also clear that the
perlite scratches are shorter than the silica scratches. Actual scratch lengths were measured
and a mean value is given in Table 2. Scratch numbers were also determined. For the long
4500 cycle tests the number of groups of scratches (see Figures 8c and 8d) indicated how
many filaments were trapping particles (shown in Table 2 as the proportion of total filaments,
i.e. number of scratch groups/total number of filaments) and for the short 50 cycle tests to
give an estimate of how many particles were cutting and causing scratches at any one moment
(shown in Table 2 as the proportion of filaments trapping particles, i.e. number of
scratches/number of filaments trapping particles).
Scratch numbers, particularly for the short tests were difficult to assess, however, it could be
seen that there were a similar number of filaments in contact for all tests, but less perlite
particles were cutting at any one moment than silica particles.
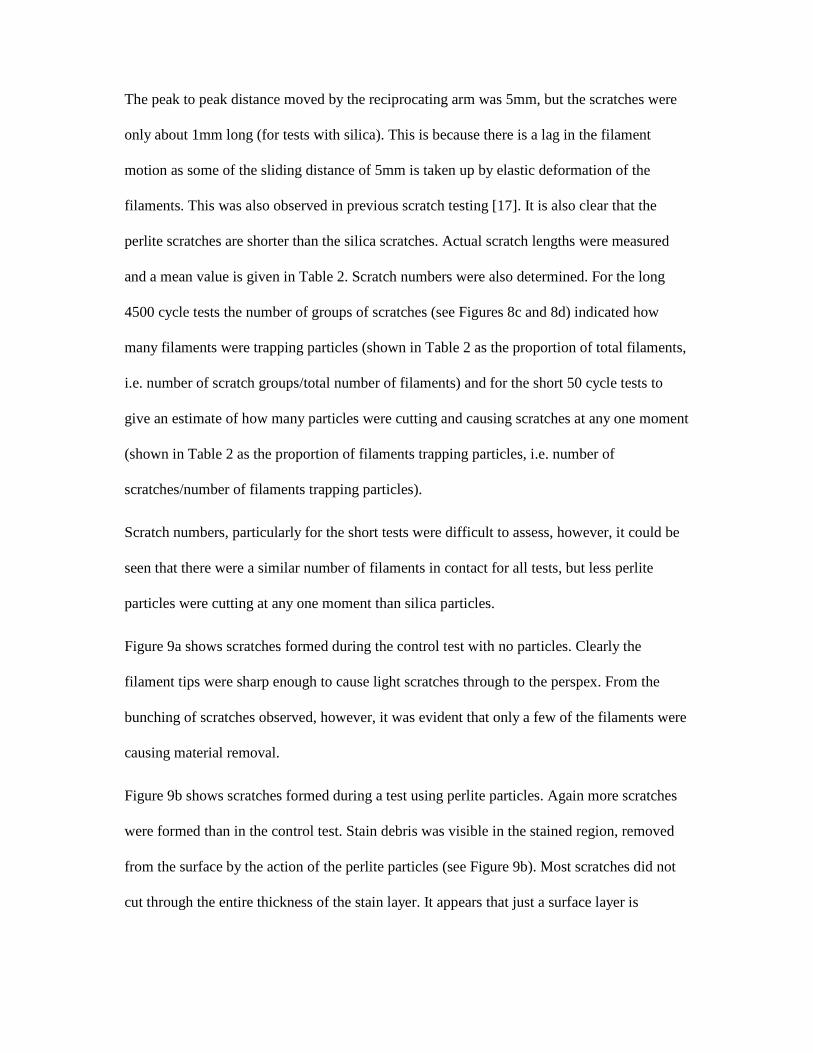
Figure 9a shows scratches formed during the control test with no particles. Clearly the
filament tips were sharp enough to cause light scratches through to the perspex. From the
bunching of scratches observed, however, it was evident that only a few of the filaments were
causing material removal.
Figure 9b shows scratches formed during a test using perlite particles. Again more scratches
were formed than in the control test. Stain debris was visible in the stained region, removed
from the surface by the action of the perlite particles (see Figure 9b). Most scratches did not
cut through the entire thickness of the stain layer. It appears that just a surface layer is
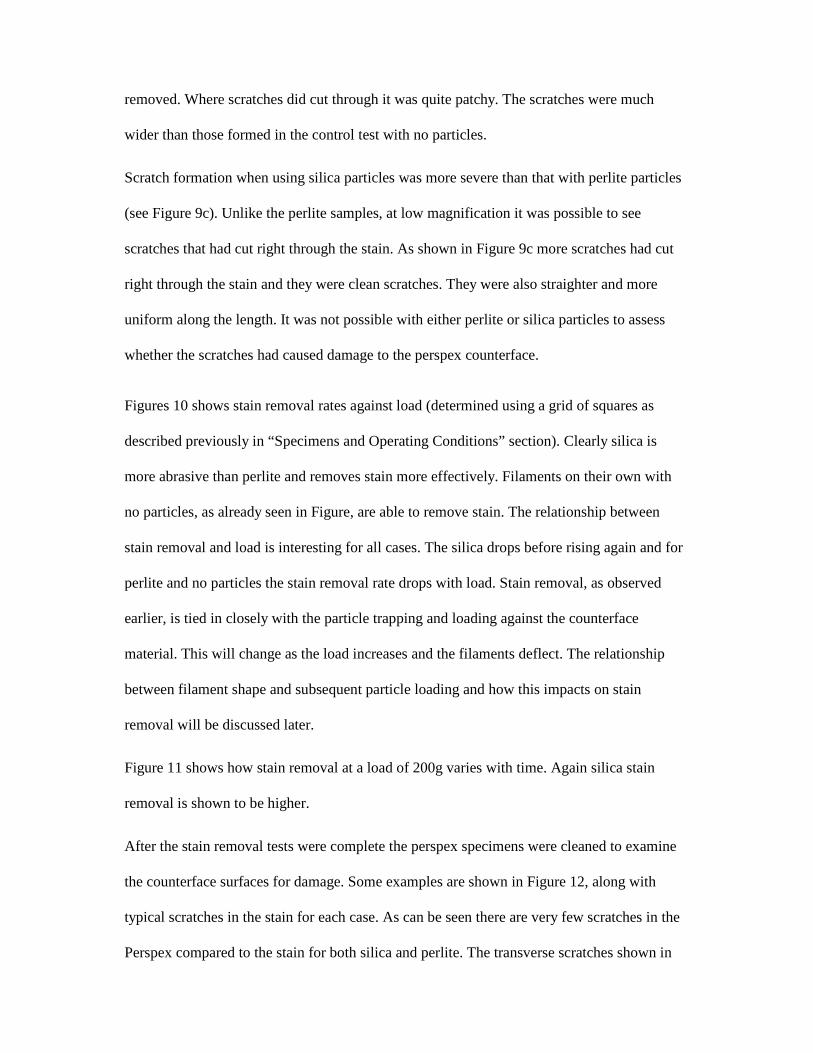
removed. Where scratches did cut through it was quite patchy. The scratches were much
wider than those formed in the control test with no particles.
Scratch formation when using silica particles was more severe than that with perlite particles
(see Figure 9c). Unlike the perlite samples, at low magnification it was possible to see
scratches that had cut right through the stain. As shown in Figure 9c more scratches had cut
right through the stain and they were clean scratches. They were also straighter and more
uniform along the length. It was not possible with either perlite or silica particles to assess
whether the scratches had caused damage to the perspex counterface.
Figures 10 shows stain removal rates against load (determined using a grid of squares as
described previously in “Specimens and Operating Conditions” section). Clearly silica is
more abrasive than perlite and removes stain more effectively. Filaments on their own with
no particles, as already seen in Figure, are able to remove stain. The relationship between
stain removal and load is interesting for all cases. The silica drops before rising again and for
perlite and no particles the stain removal rate drops with load. Stain removal, as observed
earlier, is tied in closely with the particle trapping and loading against the counterface
material. This will change as the load increases and the filaments deflect. The relationship
between filament shape and subsequent particle loading and how this impacts on stain
removal will be discussed later.
Figure 11 shows how stain removal at a load of 200g varies with time. Again silica stain
removal is shown to be higher.
After the stain removal tests were complete the perspex specimens were cleaned to examine
the counterface surfaces for damage. Some examples are shown in Figure 12, along with
typical scratches in the stain for each case. As can be seen there are very few scratches in the
Perspex compared to the stain for both silica and perlite. The transverse scratches shown in
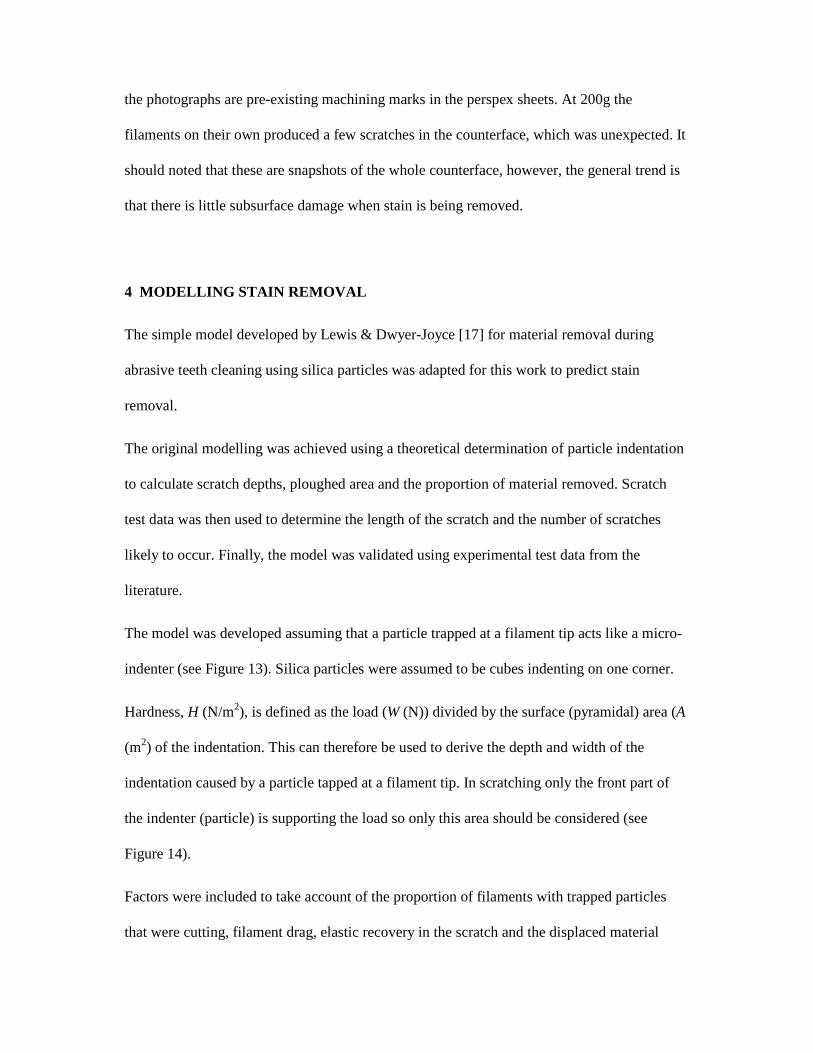
the photographs are pre-existing machining marks in the perspex sheets. At 200g the
filaments on their own produced a few scratches in the counterface, which was unexpected. It
should noted that these are snapshots of the whole counterface, however, the general trend is
that there is little subsurface damage when stain is being removed.
4 MODELLING STAIN REMOVAL
The simple model developed by Lewis & Dwyer-Joyce [17] for material removal during
abrasive teeth cleaning using silica particles was adapted for this work to predict stain
removal.
The original modelling was achieved using a theoretical determination of particle indentation
to calculate scratch depths, ploughed area and the proportion of material removed. Scratch
test data was then used to determine the length of the scratch and the number of scratches
likely to occur. Finally, the model was validated using experimental test data from the
literature.
The model was developed assuming that a particle trapped at a filament tip acts like a micro-
indenter (see Figure 13). Silica particles were assumed to be cubes indenting on one corner.
Hardness, H (N/m2), is defined as the load (W (N)) divided by the surface (pyramidal) area (A
(m2) of the indentation. This can therefore be used to derive the depth and width of the
indentation caused by a particle tapped at a filament tip. In scratching only the front part of
the indenter (particle) is supporting the load so only this area should be considered (see
Figure 14).
Factors were included to take account of the proportion of filaments with trapped particles
that were cutting, filament drag, elastic recovery in the scratch and the displaced material
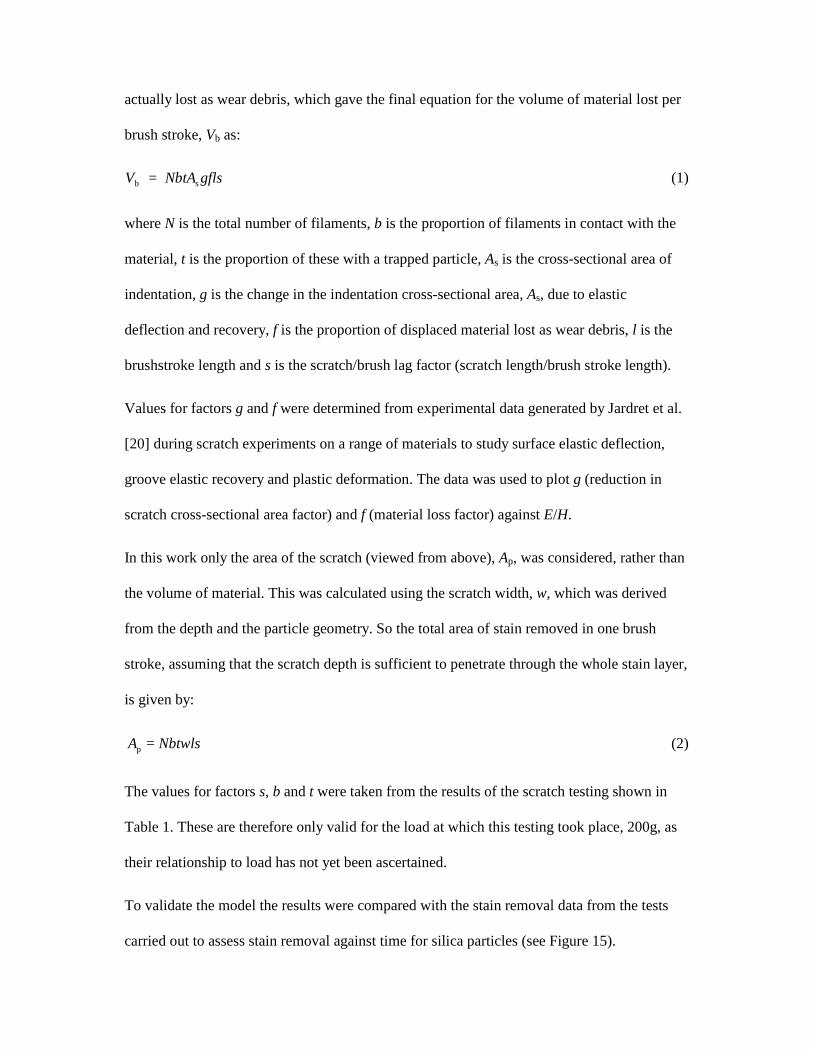
actually lost as wear debris, which gave the final equation for the volume of material lost per
brush stroke, Vb as:
V NbtA gflsb s = (1)
where N is the total number of filaments, b is the proportion of filaments in contact with the
material, t is the proportion of these with a trapped particle, As is the cross-sectional area of
indentation, g is the change in the indentation cross-sectional area, As, due to elastic
deflection and recovery, f is the proportion of displaced material lost as wear debris, l is the
brushstroke length and s is the scratch/brush lag factor (scratch length/brush stroke length).
Values for factors g and f were determined from experimental data generated by Jardret et al.
[20] during scratch experiments on a range of materials to study surface elastic deflection,
groove elastic recovery and plastic deformation. The data was used to plot g (reduction in
scratch cross-sectional area factor) and f (material loss factor) against E/H.
In this work only the area of the scratch (viewed from above), Ap, was considered, rather than
the volume of material. This was calculated using the scratch width, w, which was derived
from the depth and the particle geometry. So the total area of stain removed in one brush
stroke, assuming that the scratch depth is sufficient to penetrate through the whole stain layer,
is given by:
NbtwlsA = p (2)
The values for factors s, b and t were taken from the results of the scratch testing shown in
Table 1. These are therefore only valid for the load at which this testing took place, 200g, as
their relationship to load has not yet been ascertained.
To validate the model the results were compared with the stain removal data from the tests
carried out to assess stain removal against time for silica particles (see Figure 15).

The stain removed per brushstroke will not be the same as time progresses because the
amount of stain left will reduce, so if an even distribution of cutting particles is assumed, it is
less likely that stain will be removed with each subsequent brush stroke. The model therefore
has to be iterative to accommodate this. It was run for 15 second intervals. After the first
interval the proportion of stain removed was calculated. For the second interval this value was
multiplied by 1 minus the proportion removed in the first interval and so on.
The brushing parameters used in the model and data relating to the scratches and the stain
removed are given in Table 3. The model predictions are compared with the test results in
Figure 15. Values of E and H for pellicle were used as an approximation for those of the
organic dye in the absence of actual data (giving E/H = 29).
This model has been developed for the blocky shaped silica particles. Perlite particles are flat
and plate-like shapes. There are a number of ways that perlite particles could be modelled, for
example as flat squares (cutting on one edge or a corner) or discs or as a shallow “V” shape.
However, the scratch widths and or depths turn out to be very dependent on the assumed
shape and orientation of the particle and the angle of cutting. More work is needed on
visualising perlite particle in a contact to establish exactly how they cut through stain before
an accurate prediction can be produced. Also the stain removal due to filaments with no
particle trapped needs to be incorporated as a small proportion cause stain removal.

5 DISCUSSION
5.1 Particle Entrainment and Scratch Morphology
It is clear from the visualisation studies carried out that perlite particles enter the filament tip
contact region in a flat orientation. This is critical in determining their likely abrasive action.
A flat rather than an edge orientation should give a less severe action.
In the flat orientation the large front edge on the perlite particles may have been expected to
cause a large amount of material removal. Scratch widths seen in stain removal tests,
however, are similar in width to those with silica (see Figures 9b and 9c). It is not clear which
profile is cutting with perlite particles. However, the particles are not completely flat and it
could be envisaged that under load only a small part of the front edge is cutting, as shown in
Figure 16, which could explain the similarities in scratch width.
It was evident from observation of the stain removal scratches that silica scratches were
deeper. Far more scratches could be seen where the stain layer had been completely removed
exposing the substrate. Perlite scratches in the stain were jagged and cutting was intermittent.
Clearly the particles are not stable when under load at the tip of a filament. This was also
highlighted in the abrasion tests where silica scratches were uniform in nature while the
perlite scratches were ion more random directions and not continuously (see Figure 7).
Cutting with a flat edge rather than a point would probably be less stable and hence much
straighter scratches were seen with silica.
It was also clear that more scratches were created when using silica particles in both the
abrasion and stain removal tests.
It was evident from scratch length measurements taken (see Table 2) that filament lag was
occurring, as seen in previous work [17]. Perlite scratch lengths, however, were clearly

shorter than those with silica. This may have been due to the less stable nature of the
entrainment trapping process leading too shorter trapping times. Scratch numbers were
similar to those seen during previous work. It was noticeable, however, that there were less
scratches being formed at any one moment with perlite than with silica. This was probably
because there are many more small silica particles in a given mass than larger perlite
particles. The less stable trapping of perlite particles will also have had an effect as well as
the fact that more silica particles accumulate around filament tips and are therefore more
likely to be entrained and trapped at a filament tip.
5.2 Stain removal
The stain removal rates see in Figure 10, were very interesting. Firstly the removal rates with
no particles clearly indicate that brushing alone with no toothpaste will remove a certain
amount of a stain layer. This is because the filament tips can end up being quite pointed as
shown in Figure 17. The removal rates reduced with increasing load as the filaments deflect
further and the side of the tip will be in contact with the stain rather than the tip, decreasing
the cutting potential.
Similar results were seen for the perlite particles, although the stain removal rates were
slightly higher. The stain removal decreases with increasing load in this case because as the
filament deflects it becomes harder for the perlite particle to enter the filament tip contact, as
seen in the visualisation studies.
The stain removal rates with silica particles were much higher indicating that silica is more
abrasive. The variation in removal rate with load was different to perlite. It was high initially
before dropping and then rising to its original level again. This again can be explained by
looking at the particle entrainment behaviour with increasing load. At low loads and filament
deflection the particles are more likely to be trapped and loaded at the tip contact and
therefore stain removal is possible (see Figure 18). As the filaments start to deflect under
increasing loads less and less particles enter the contact stain removal reduces. Most particles
accumulate around the tip where they are not under load. As the load continues to increase,
however, the particles accumulating around the filament tip will be loaded against the stain
layer with greater and greater force and therefore be able to remove more stain again.
In all cases the counterface damage was low during stain removal. This is despite the fact that
when no stain is applied the particles are able to scratch the perspex counterface. This clearly
indicates the necessity to avoid over brushing of teeth. With some improvements the stain
removal model proposed could be used to try and optimise recommended brushing times to
help toothbrush users avoid damaging teeth and gums.
6 CONCLUSIONS
Tests have been performed to compare and contrast the abrasive and stain removal actions of
two types of toothpaste particle. Silica particles are small and blocky whilst perlite is large
and flat.
Visualisation studies showed that the perlite particles pass under filament tips in a flat
orientation. The particles appeared to re-orientate themselves just before entering the filament
tip contact as if to find the path of least resistance. Perlite particles did not accumulate at a
filament tip as silica particles have been seen to.
Perlite scratches were less uniform than silica scratches indicating a less stable trapping
process occurred, probably caused by perlite scratching with an edge rather than a point as
with silica. Fewer scratches were caused by perlite particles than silica particles, the scratches

were also shorter. This was due to the fact far less perlite particles were present and the less
stable trapping process seen. Perlite particles produced shallower scratches than silica. This
was because the perlite particles cut with a flat edge.
Stain removal was also more uniform with silica. Perlite scratches in stain were jagged and
intermittent. This indicates that particles are not stable when under load at the tip of a
filament. Stain removal rates were higher with silica and showed different behaviour to
perlite as load and filament deflections were increased. The changes in stain removal rates
with increasing load could be directly attributed to the change in particle entrainment and
loading seen during the visualisation studies.
Little counterface damage occurred during the stain removal process with either silica or
perlite.
A stain removal model has been developed that has shown good correlation with
experimental data for silica particles. The enable reliable predictions for perlite particles more
information is needed about the way they are orientated and remove material.
REFERENCES
1. G.K. Stookey, T.A. Burkhard, B.R. Schemehorn, In vitro removal of stain with
dentifrices, Journal of Dental Research 61 (1982), 1236-1239.
2. L.M. MacPherson, K.W. Stephen, A. Joiner, Comparison of a conventional and
modified tooth stain index, Clinical Periodontology, 27 (2000), 854-859.
3. D.J. White, Development of an improved whitening dentifrice based upon ‘stain-
specific soft silica’ technology, Journal of Clinical Dentistry 12 (2001), 25-29.
4. S. Sheen, M. Addy, An in vitro evaluation of the availability of cetylpyridinium
chloride and chlorhexadine in commercially available mouth rinse products, British
Dental Journal 194 (2003), 207-210.

5. P.L. Dawson, J.E. Walsh, T. Morrison, Dental stain prevention by abrasive
toothpastes: a new in vitro test and its correlation with clinical observations, Journal
of Cosmetic Science 49 (1998), 275-283.
6. G.C. Forward, Role of toothpastes in the cleaning of teeth, International Dental
Journal 41 (1991), 164-170.
7. F. Barbakow, F. Lutz, T. Imfeld, Relative dentin abrasion by dentifrices and
propylaxis pastes: implications for clinicians, manufacturers and patients,
Quintessence International 18 (1987), 29-34.
8. J.J. Hefferren, Historical view of dentifrice functionality methods, Journal of Clinical
Dentistry (1998) 9, 53-56.
9. P.M. Baxter, W.B. Davis, J. Jackson, Toothpaste abrasive requirements to control
naturally stained pellicle, Journal of Oral Rehabilitation 8 (1981), 19-26.
10. R.S. Manly, Factors influencing tests on abrasion of dentin by brushing with
dentifrice, Journal of Dental Research 23 (1944), 59-72.
11. J.R. Heath, H.J Wilson, Abrasion of restorative materials by toothpaste, Journal of
Oral Rehabilitation 3 (1976), 121-138.
12. E. Harrington, P.A. Jones, S.E. Fisher, H.J. Wilson, Toothbrush - dentifrice abrasion -
a suggested standard method, British Dental Journal 153 (1982), 135-138.
13. J.R. Condon, J.F. Ferracane, A new multi-mode oral wear simulator, Dental Materials
12 (1996), 218-226.
14 M. Addy, J. Hughes, M.J. Pickles, A. Joiner, E. Huntington, Development of a
method in situ to study toothpaste abrasion of dentine, Journal of Clinical
Periodontology 29 (2002), 896-900.
15. A. Joiner, M.J. Pickles, J.R. Matheson, E. Weader, L. Noblet, E. Huntington,
Whitening toothpastes: effects on tooth stain and enamel, International Dental Journal
52 (2002), 424-434.
16. R. Lewis, R.S. Dwyer-Joyce, M.J. Pickles, Interaction between toothbrushes and
toothpaste abrasive particles in simulated tooth cleaning, Wear 257 (2004), No. 3-4,
368-376.

17. R. Lewis, R.S. Dwyer-Joyce, Interaction of toothbrush filaments and toothpaste
particles during simulated abrasive cleaning, in press Journal of Engineering
Tribology, Proceedings of the IMeche Part J (2005).
18. E.A. Phaneuf, J.H. Harrington, P.P Dale, G. Shklar, Automatic toothbrush: a new
reciprocating action, Journal of the American Dental Association 65 (1962) 12-25.
19. C.R. Allen, N.K. Hunsley, I.D.M. MacGregor, Development of a force-sensing
toothbrush using PIC micro-controller technology for dental hygiene, Mechatronics 6
(2) (1996) 125-40.
20. V. Jardret, H. Zahouani, J.L. Loubet, T.G. Mathia, Understanding and quantification
of elastic and plastic deformation during a scratch test, Wear 218 (1998), 8-14.
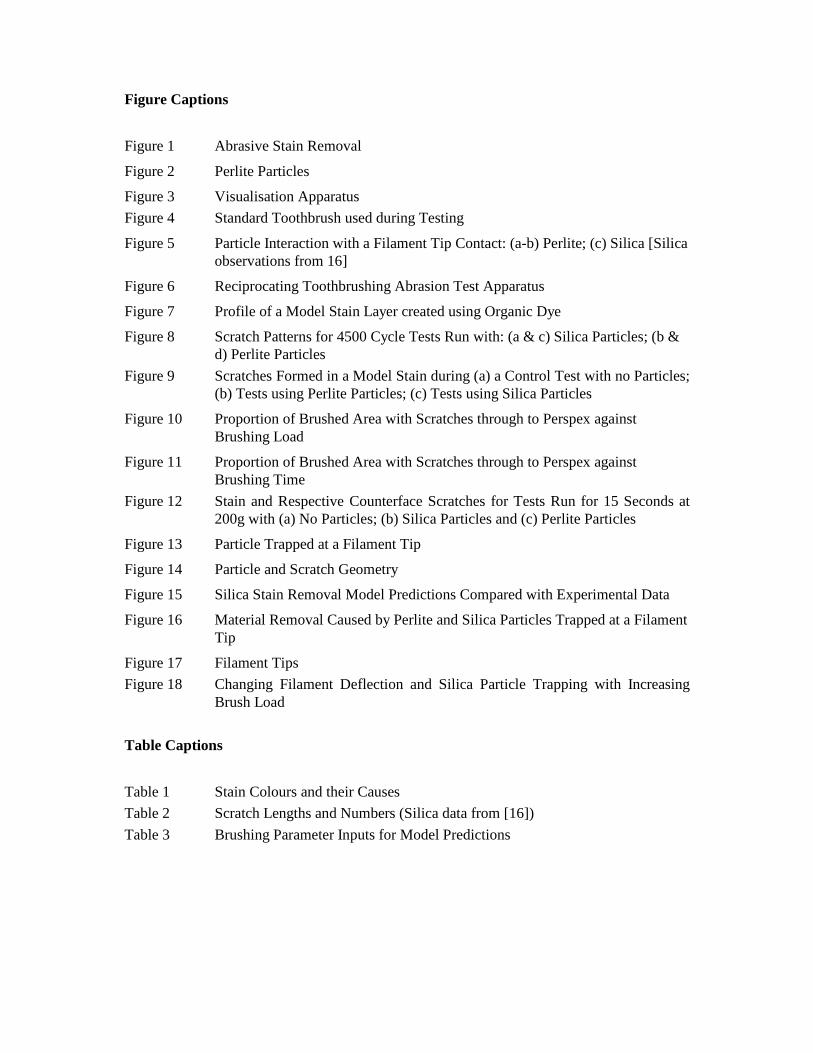
Figure Captions
Figure 1 Abrasive Stain Removal
Figure 2 Perlite Particles
Figure 3 Visualisation Apparatus
Figure 4 Standard Toothbrush used during Testing
Figure 5 Particle Interaction with a Filament Tip Contact: (a-b) Perlite; (c) Silica [Silica observations from 16]
Figure 6 Reciprocating Toothbrushing Abrasion Test Apparatus
Figure 7 Profile of a Model Stain Layer created using Organic Dye
Figure 8 Scratch Patterns for 4500 Cycle Tests Run with: (a & c) Silica Particles; (b & d) Perlite Particles
Figure 9 Scratches Formed in a Model Stain during (a) a Control Test with no Particles; (b) Tests using Perlite Particles; (c) Tests using Silica Particles
Figure 10 Proportion of Brushed Area with Scratches through to Perspex against Brushing Load
Figure 11 Proportion of Brushed Area with Scratches through to Perspex against Brushing Time
Figure 12 Stain and Respective Counterface Scratches for Tests Run for 15 Seconds at 200g with (a) No Particles; (b) Silica Particles and (c) Perlite Particles
Figure 13 Particle Trapped at a Filament Tip
Figure 14 Particle and Scratch Geometry
Figure 15 Silica Stain Removal Model Predictions Compared with Experimental Data
Figure 16 Material Removal Caused by Perlite and Silica Particles Trapped at a Filament Tip
Figure 17 Filament Tips
Figure 18 Changing Filament Deflection and Silica Particle Trapping with Increasing Brush Load
Table Captions
Table 1 Stain Colours and their Causes
Table 2 Scratch Lengths and Numbers (Silica data from [16])
Table 3 Brushing Parameter Inputs for Model Predictions

Figure 1
Brush Motion
Enamel/Dentine Substrate
Stain Layer (1-10µm)
Abrasive Particle
ToothbrushFilamentStain Removed
Figure 2
20µm
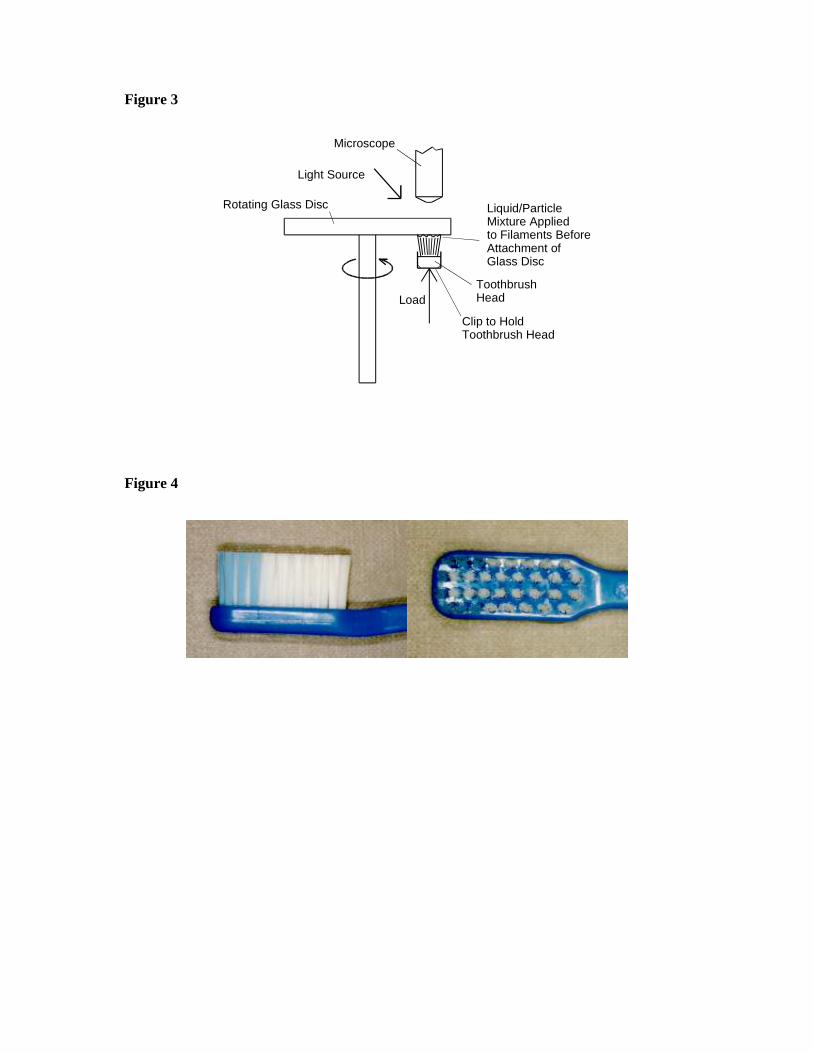
Figure 3
Rotating Glass Disc
Microscope
Light Source
ToothbrushHead
Clip to HoldToothbrush Head
Liquid/ParticleMixture Appliedto Filaments BeforeAttachment ofGlass Disc
Load
Figure 4
Figure 5
FilamentContactRegion
Figure 6
SignalGenerator
PowerAmplifier
Oscillator
Load
Perspex SpecimenClamped in Position
Liquid/ParticleMixture Appliedto Perspex BeforeLowering ofBrushhead
ReciprocatingBrushhead
Stain applied toSurface of Perspex
(a)
(b)
(c) Perlite particles passing though contact in flat orientation Silica particles
accumulate at contact
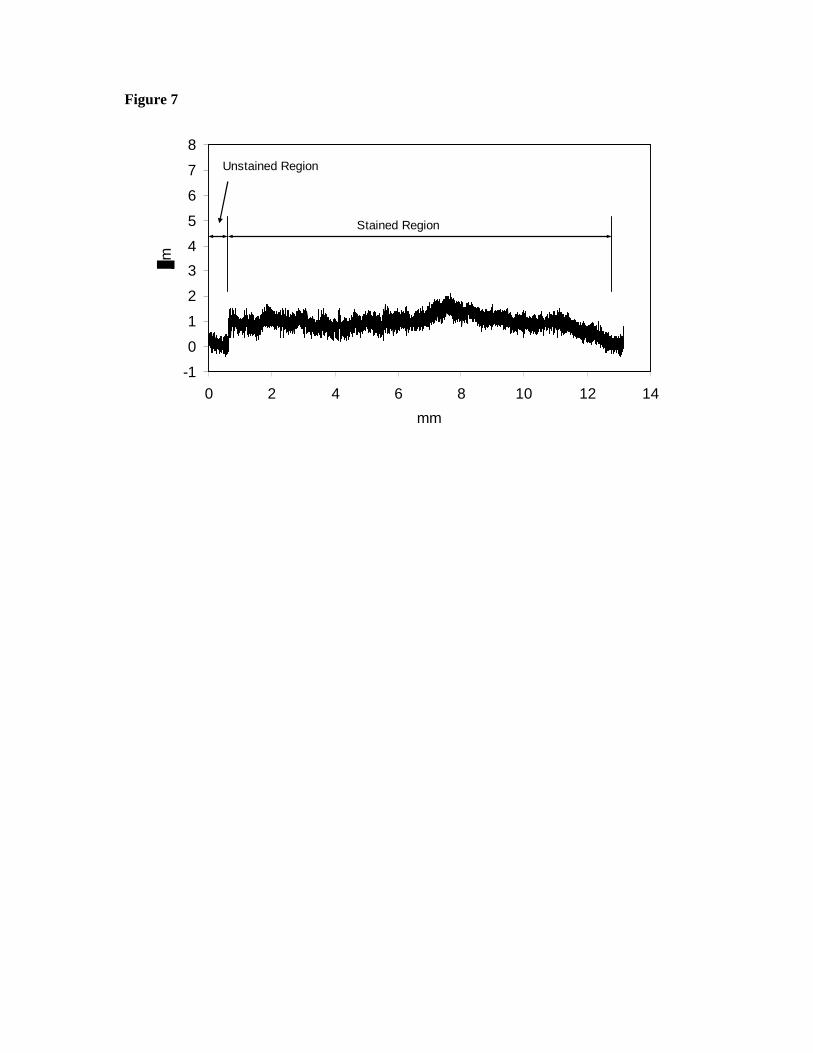
Figure 7
-1
0
1
2
3
4
5
6
7
8
0 2 4 6 8 10 12 14
mm
m
Stained Region
Unstained Region

Figure 8
Scratches Caused by 1 Clump of Filaments
Group of Scratches Caused by 1 Filament
(a) (b)
(c) (d)

Figure 9
Stain debris
Brushing motion
Perlite particle
(a)
Jagged scratch - intermittent cutting
Many scratches have cut through the stain to expose perspex counterface
Brushing motion
(b)
(c)
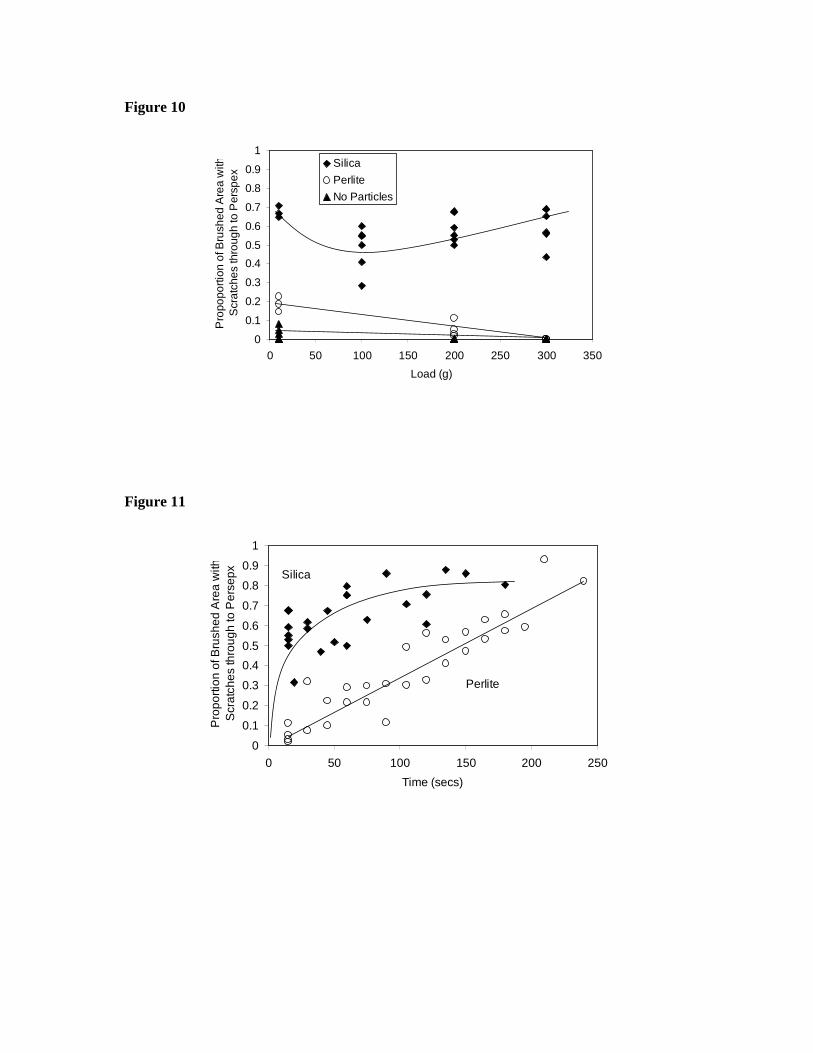
Figure 10
0
0.1
0.2
0.3
0.4
0.5
0.6
0.7
0.8
0.9
1
0 50 100 150 200 250 300 350
Load (g)
Pro
popo
rtion
of B
rush
ed A
rea
with
S
crat
ches
thro
ugh
to P
ersp
ex
Silica
Perlite
No Particles
Figure 11
0
0.1
0.2
0.3
0.4
0.5
0.6
0.7
0.8
0.9
1
0 50 100 150 200 250
Time (secs)
Pro
porti
on o
f Bru
shed
Are
a w
ith
Scr
atch
es th
roug
h to
Per
sepx
Perlite
Silica

Figure 12
(a) No Particles (b) Silica (c) Perlite S
tain
Sta
in R
em
ove
d
Brushing Direction
Figure 13
INDENTATIONDEPTH
200µm

Figure 14
AREA SUPPORTING LOAD, A
DIRECTION OFINDENTER (PARTICLE)MOTION
Figure 15
0
0.2
0.4
0.6
0.8
1
1.2
0 50 100 150 200
Time (secs)
Pro
porti
on o
f Sta
in R
emov
ed
Silica (Model)
Silica (Test)

Figure 16
Load Applied by Filament Tip
Direction of Motion
ContactRegion
(a) (b)
Substrate PerliteParticle Silica
Particle
Figure 17
200µm

Figure 18
Direction of Brush Motion
Particles AccummulatingAround Tip Contact,Particles not Trapped soLower Load Transfer Occurs
Particles Trapped at Tip Contact,High Load Transfer to Particles
Particles Now Trapped Around Tip Contact, soLoad Transfer toParticles has Increased
Increasing Loadon Filaments

Table 1
Colour Source Green, Orange, Black Chromogenic bacteria Yellow, Brown Tobacco, Food
Table 2
Perlite Silica Length of scratch (mm) 0.8 1.1 Proportion of filaments in contact and trapping particles
70% 72%
Proportion of filaments with particles cutting at any one moment
10% 15%
Table 3
Particle Silica Load on Brush Head (g) 200 Scratch Depth (µm) 0.98 Scratch Width (µm) 2.4 Brush Stroke Length (mm) 5 Number of filaments, N 1360 Proportion of Filaments in Contact with Counterface, b
0.97
Proportion of filaments in contact with a trapped particle, t
0.15
Filament Drag Factor, s 0.22 f 0.5 g 0.7 Number of Strokes 150 Proportion of Stain Removed in first 15 second interval
0.24