staff budget briefing fy 2018-19 department of …staff budget briefing fy 2018-19 department of...
TRANSCRIPT

STAFF BUDGET BRIEFING FY 2018-19
DEPARTMENT OF CORRECTIONS
JBC WORKING DOCUMENT - SUBJECT TO CHANGE STAFF RECOMMENDATION DOES NOT REPRESENT COMMITTEE DECISION
PREPARED BY: MEGAN DAVISSON, JBC STAFF
DECEMBER 20, 2017
JOINT BUDGET COMMITTEE STAFF 200 E. 14TH AVENUE, 3RD FLOOR · DENVER · COLORADO · 80203
TELEPHONE: (303) 866-2061 · TDD: (303) 866-3472 https://leg.colorado.gov/agencies/joint-budget-committee

CONTENTS Department Overview ...................................................................................................................................... 1 Department Budget: Recent Appropriations ................................................................................................ 1 Department Budget: Graphic Overview ....................................................................................................... 2 General Factors Driving the Budget ............................................................................................................... 4 Summary: FY 2017-18 Appropriation & FY 2018-19 Request .................................................................. 7 ISSUES
Issue #1Overview of the Colorado Correctional System ............................................................ 13 Issue #2 Prison Utilization and R2 Prison Capacity ..................................................................... 22 Issue #3 Correctional Officer Step Plans and R1 Staff Retention ............................................. 31 Issue #4 Hepatitis C Treatment (R3) .............................................................................................. 41 Issue #5 Parole Board Hearing Topics ........................................................................................... 44
APPENDICES A. Numbers Pages .............................................................................................................................. 46 B. Recent Legislation Affecting Department Budget ................................................................... 86 C. Update on Long Bill Footnotes and Requests for Information ............................................. 91 D. Department Annual Performance Report ................................................................................ 93 E. FY 2016-17 Cost Per Offender by Facility ................................................................................ 94 F. Classification Job Duties .............................................................................................................. 95 G. Prison Utilization Study Facility Tiers ....................................................................................... 96 H. 2017 Interim Committee Legislation ......................................................................................... 98 I. Private Prison Response Letters to Committee Inquiries on Operational Costs .............. 100

DEPARTMENT OF CORRECTIONS
DEPARTMENT OVERVIEW The Department is responsible for:
Managing, supervising, and controlling the correctional facilities operated and supported by the State;
Supervising the population of offenders placed in the custody of the Department, including inmates, parolees, and transition inmates who are placed into community corrections programs;
Planning for the projected, long-range needs of the institutions under the Department's control; and
Developing educational, treatment, and correctional industries programs that have a rehabilitative or therapeutic value for inmates and supply products for state and private purposes, as provided by law.
DEPARTMENT BUDGET: RECENT APPROPRIATIONS
FUNDING SOURCE FY 2015-16 FY 2016-17 FY 2017-18 FY 2018-19 *
General Fund $763,812,924 $751,095,253 $769,192,172 $826,995,444
Cash Funds 39,346,724 41,066,811 39,760,660 40,426,978
Reappropriated Funds 46,665,389 49,183,898 51,620,128 51,075,840
Federal Funds 1,259,937 1,357,641 4,167,290 3,516,067
TOTAL FUNDS $851,084,974 $842,703,603 $864,740,250 $922,014,329
Full Time Equiv. Staff 6,239.8 6,242.7 6,247.0 6,228.5
*Requested appropriation.
20-Dec-2017 1 DOC-brf

DEPARTMENT BUDGET: GRAPHIC OVERVIEW
All charts are based on the FY 2017-18 appropriation.
20-Dec-2017 2 DOC-brf

All charts are based on the FY 2017-18 appropriation.
20-Dec-2017 3 DOC-brf

GENERAL FACTORS DRIVING THE BUDGET Funding for this department consists of 89.0 percent General Fund, 4.6 percent cash funds, 6.0 percent reappropriated funds, and 0.4 percent federal funds. Some of the major factors driving the Department's budget are discussed below.
OPERATING APPROPRIATIONS Appropriations for operating costs to the Department of Corrections (DOC) are primarily dependent upon two key components of prison caseload:
The DOC inmate population, which consists of DOC offenders with "inmate" status. These offenders have been sentenced to the DOC but are not on parole. They are housed in state-operated prisons, private prisons, county jails, and community corrections facilities; a small portion live independently in the community under intensive supervision.
The DOC parole population, which consists of DOC offenders who have been paroled but have not yet reached the end of their parole term. Parolees whose parole has been revoked are classified as inmates until reparoled.
The following table, from the Department’s dashboard measures, shows the population change since April 2011.
20-Dec-2017 4 DOC-brf

INMATE POPULATION The following table and chart report the average DOC inmate population during recent fiscal years. The FY 2017-18 and FY 2018-19 estimated population numbers are based on the Division of Criminal Justice December 2017 prison population forecast. The second issue in this document will discuss the population projections.
AVERAGE DOC INMATE POPULATION
FY 2011-12
ACTUAL FY 2012-13
ACTUAL FY 2013-14
ACTUAL FY 2014-15
ACTUAL FY 2015-16
ACTUAL FY 2016-17
ACTUAL FY 2017-18
ESTIMATE FY 2018-19
ESTIMATE
Average DOC inmate population 21,890 20,437 20,346 20,652 20,062 20,101 19,786 20,900
Percentage change from prior year n/a (6.64%) (0.45%) 1.50% (2.86%) 0.19% (1.57%) 5.63%
DOC OFFENDERS IN PRIVATE PRISONS During the 1990s, the DOC began contracting with private prisons to house Colorado offenders. The following table summarizes the daily rate paid to private prisons since FY 2012-13.
PRIVATE PRISON DAILY REIMBURSEMENT RATE
FY 2012-13
ACTUAL FY 2013-14
ACTUAL FY 2014-15
ACTUAL. FY 2015-16
ACTUAL FY 2016-17
ACTUAL FY 2017-18
APPROPRIATION FY 2018-19
REQUEST
Daily reimbursement rate per offender $53.69 $53.74 $55.08 $56.02 $56.02 $56.80 $57.37
Percentage change from prior year 0.00% 2.00% 2.50% 1.70% 0.00% 1.4% 1.0%
DOC OFFENDERS IN COUNTY JAILS At any given time, there are department inmates and parolees housed in county jails. Some are newly sentenced by a court to the Department and await transfer from jail to the Denver Reception and Diagnostic Center. Other offenders were paroled and, following a parole violation, have been placed in jail for a few days to deter further misbehavior. Others with more severe parole violations are awaiting a parole revocation hearing or are awaiting trial for a new crime. If parole is revoked, the parolee remains in jail until transferred to another facility. Still other DOC offenders may have been transported from prison to a jail on a writ from a judge who needs them to appear in court. In addition, the DOC sometimes contracts with county jails and places offenders in these facilities on a long term basis. The DOC pays jails to house some, but not all, of the DOC offenders who are in jail. The following table and chart show the average "reimbursable" jail population during recent years, i.e. the average number of jailed DOC offenders for whom DOC pays reimbursement. (The substantial number of non-reimbursed DOC offenders who are in jails are excluded.)
20-Dec-2017 5 DOC-brf

REIMBURSABLE DOC OFFENDERS IN COUNTY JAILS
FY 2012-13
ACTUAL FY 2013-14
ACTUAL FY 2014-15
ACTUAL FY 2015-16
ACTUAL FY 2016-17
ESTIMATE FY 2017-18
APPROP. FY 2018-19
REQUEST
Average DOC reimbursable jail population 562 806 710 566 653 758 772
Percentage change from prior year 0.5% 43.4% (11.9%) (20.3%) 15.3% 16.1% 1.8%
Daily reimbursement rate per offender $50.44 $51.45 $52.74 $53.64 $53.64 $54.39 $54.93
Percentage change from prior year 0.00% 2.00% 2.50% 1.70% 0.00% 1.40% 1.00%
Total payments to jails $10,348,430 $15,141,029 $13,676,168 $11,120,578 $12,784,826 $15,047,289 $15,475,692
Percentage change from prior year 0.3% 46.3% (9.7%) (18.7%) 15.0% 17.7% 2.8%
TRANSITION AND PAROLE – COSTS OF RETURNING OFFENDERS TO THE COMMUNITY The process of returning an offender to the community usually involves a period of parole. The process may include placement in a community corrections facility (also known as a halfway house) and a period of intensely supervised independent living in the community before parole begins (known as the Intensive Supervision-Inmate or ISP-Inmate Program). Inmates living in halfway houses or participating in the ISP-Inmate Program are often referred to as "transition" offenders.
The costs of returning offenders to the community are shared by the Department and the Division of Criminal Justice (DCJ), within the Department of Public Safety. DCJ is responsible for payments to community correction boards and halfway houses. The Department is responsible for oversight of parolees and ISP-Inmate offenders. In addition, the DOC pays (1) some of the jail costs that arise when community-corrections offenders, ISP-Inmate offenders, and parolees are jailed for violations, and (2) all the incarceration costs following revocation. Costs of parole supervision are tied to caseloads. The following table and chart report the average parole population in recent fiscal years. The FY 2017-18 and FY 2018-19 estimated population numbers are based on the Division of Criminal Justice December 2017 prison population forecast.
AVERAGE PAROLE POPULATION
FY 2012-13
ACTUAL FY 2013-14
ACTUAL FY 2014-15
ACTUAL FY 2015-16
ACTUAL FY 2016-17
ACTUAL FY 2017-18
ESTIMATE FY 2018-19
ESTIMATE Average parole population 8,650 8,415 7,947 8,048 8,286 8,670 7,766 Percentage change from prior year 5.30% (2.70%) (5.60%) 1.30% (1.38)% 4.63% (10.42%)
CAPITAL APPROPRIATIONS In addition to the Department's operating costs, there are capital costs associated with new construction, controlled maintenance of existing capital resources, and payments for the certificates of participation that sometimes finance capital construction. These appropriations appear in the Department's Institutions Division and the Capital Construction Long Bill sections.
CERTIFICATES OF PARTICIPATION AND CAPITAL CONSTRUCTION APPROPRIATIONS FY 2011-12 FY 2012-13 FY 2013-14 FY 2014-15 FY 2015-16 FY 2016-17 FY 2017-18
$18,952,353 $20,798,083 $27,225,308 $29,120,526 $26,583,095 $20,258,268 $28,310,552
20-Dec-2017 6 DOC-brf

SUMMARY: FY 2017-18 APPROPRIATION & FY 2018-19 REQUEST
DEPARTMENT OF CORRECTIONS TOTAL
FUNDS GENERAL
FUND CASH
FUNDS REAPPROPRIATED
FUNDS FEDERAL
FUNDS
FTE
FY 2017-18 APPROPRIATION:
SB 17-254 (Long Bill) $862,934,388 $767,386,310 $39,760,660 $51,620,128 $4,167,290 6,246.2
HB 17-1326 (Justice Reinvestment) (5,865,182) (5,865,182) 0 0 0 0.8
Other legislation 7,671,044 7,671,044 0 0 0 0.0
TOTAL $864,740,250 $769,192,172 $39,760,660 $51,620,128 $4,167,290 6,247.0
FY 2018-19 APPROPRIATION:
FY 2017-18 Appropriation $864,740,250 $769,192,172 $39,760,660 $51,620,128 $4,167,290 6,247.0
R1 Staff retention 3,336,294 3,292,961 4,365 38,968 0 0.0
R2 Prison capacity 19,364,000 19,364,000 0 0 0 0.0
R3 Hepatitis C treatment 16,514,144 16,514,144 0 0 0 0.0
R4 Medical caseload 1,647,588 1,647,588 0 0 0 0.0
R5 La Vista food service 172,514 172,514 0 0 0 0.0
R6 DeCORuM operating 90,723 90,723 0 0 0 0.0
R7 Interstate probation position transfer (92,913) (92,913) 0 0 0 (2.0)
R8 Parole caseload 0 0 0 0 0 0.0
R9 Community supervision caseload (2,061,362) (2,061,362) 0 0 0 (17.4)
R10 Community provider rate 1,130,641 1,095,584 0 35,057 0 0.0
Non-prioritized request items 1,657,953 1,617,246 40,707 0 0 0.0
Centrally appropriated line items 16,611,416 16,113,208 498,208 0 0 0.0
CI wage increase 94,000 0 94,000 0 0 0.0
Fund source adjustment 0 0 0 0 0 0.0
Indirect cost assessment (622,930) 614,827 31,779 (618,313) (651,223) 0.0
Annualize prior year legislation (452,461) (452,461) 0 0 0 0.6
Annualize prior year budget actions (114,650) (111,909) (2,741) 0 0 0.3
COP payment adjustment (878) (878) 0 0 0 0.0
TOTAL $922,014,329 $826,995,444 $40,426,978 $51,075,840 $3,516,067 6,228.5
INCREASE/(DECREASE) $57,274,079 $57,803,272 $666,318 ($544,288) ($651,223) (18.5)
Percentage Change 6.6% 7.5% 1.7% (1.1%) (15.6%) (0.3%)
R1 STAFF RETENTION: The Department requests an increase of $3,336,294 total funds, of which $3,292,961 is General Fund for a 5.0 percent salary increase for the following six employee classifications:
Correctional Officer I
Correctional Officer II
Correctional Support Trades Supervisor I
Nurse I
Nurse III
Mid-Level Provider (physician assistants). The salary increases, as proposed by the Department, would be for staff with two to seven years of experience with the Department. Raises would be effective July 2018. Note the request does not account for the statewide 3.0 percent salary survey increase or Governor’s proposed 2.0 percent
20-Dec-2017 7 DOC-brf

increase of the employee Public Employees Retirement Association (PERA) contribution starting January 2019. The third issue in this document provides additional discussion of this request. R2 PRISON CAPACITY: This request is a placeholder. The Department will submit an updated request on January 15, 2018 based on the December 2017 population projections. Information provided by private prison operations in response to the JBC’s request will also be used to inform the Department’s January 15, 2018 budget amendment. The placeholder request is for $19,364,000 General Fund. The placeholder includes $248,443 for 18 new private prison beds from July 2018 to February 2019. These beds will be needed because 18 beds at the Buena Vista Correctional Facility will be taken off-line for a controlled maintenance project approved in FY 2017-18. The remainder of the request is for caseload, including the continuation of the September 2-17 interim supplemental appropriation to lease a private prison. The second briefing issue provides additional discussion about prison capacity. R3 HEPATITIS C TREATMENT: The Department requests $16,514,144 General Fund to treat an additional 632 offenders at an average cost of $26,166 per offender who have Hepatitis C. If this request is approved, the Department will have $20,514,144 General Fund to treat 784 offenders with Hepatitis C. The Department’s request cites the pending lawsuit filed by the American Civil Liberties regarding the provision of Hepatitis C treatment to offenders. The forth issue in this document will provide additional discussion about this request. R4 MEDICAL CASELOAD: The Department requests an increase of $1,647,588 General Fund for medical and pharmaceutical costs. The request assumes an additional 446 offenders will use medical services and 272 offenders will access pharmaceutical services. This increase is due to the projected growth of the offender population. This request will be revised as part of the January 15, 2018 caseload budget amendment. The projected per offender per month (POPM) rate for medical services will increase by $2.15 per month from the current $113.66. This increase is due to the following contractual increases: a 4.0 percent increase in the administrative fee (paid to the third party administrator), and a 3.0 percent increase for the security contract. The pharmaceutical POPM rate is projected to increase by $1.35 per month from the current rate of $107.09. The pharmaceutical POPM rate is based on actual and projected expenses plus an inflation adjustment of 3.9 percent. The inflation adjustment is from the Consumer Price Index for all Urban Consumers (CPI-U) for prescription drugs. R5 LA VISTA FOOD SERVICE: The Department is requesting $172,514 General Fund to pay for increased food service costs at the La Vista Correctional Facility. The Department has added 112 beds to the La Vista Correctional Facility to accommodate the female offender population increase. The La Vista Correctional Facility is located on the Colorado Mental Health Institute – Pueblo (CMHIP) campus. The La Vista Correctional Facility does not have a food preparation area and must purchase food services from the Department of Human Services (which operates CMHIP). Since there are 112 additional offenders, the Department is requesting the associated funds to pay for the additional food costs.
20-Dec-2017 8 DOC-brf

R6 DECORUM OPERATING: The Department requests an increase of $90,723 General Fund for the maintenance costs associated with the Department of Corrections Offender Records Management System (DeCORuM). The Department noted in the FY 2017-18 capital construction request for the final phase of the DeCORuM construction that the maintenance costs would be included in the FY 2018-19 operating request. The request includes an associated increase of reappropriated funds in the Office of Information Technology who will provide the system maintenance. R7 INTERSTATE PROBATION POSITION TRANSFER: The Department requests a reduction of $92,913 General Fund and 2.0 FTE to transfer staff to the Judicial Department, Division of Probation Services. The two FTE identified in this request work on the Interstate Compact which is overseen by the Division of Probation Services. The Judicial Department expressed interest in managing these positions to streamline the training, data access, and oversight of staff working on the Interstate Compact. The difference between this request and the Judicial Department’s associated request is due to centrally appropriated costs. The Department’s request does not include a reduction for centrally appropriated costs, while the Judicial Department’s request includes an increase for centrally appropriated costs. R8 PAROLE CASELOAD: The Department requests no change to funding and staffing for regular parole. The Department’s request includes the consolidation of three line items within the Division of Adult Parole based on the operational structure of the Division. The request indicates the appropriations to specific lines items does not match expenditures and the request would consolidate all the lines into a single contract line. Staff will make a recommendation on the proposed consolidation during figure setting. The parole population does not increase as the prison population increases because the parole population is governed by different factors than those that govern the prison population. The prison population is governed by the number of new court committees and returns to prison. The parole population is largely governed by decisions of the Parole Board (discretionary parole, mandatory parole). The number of parolees depends on the length of mandatory parole (which ranges from one to five years depending upon felony type), as well as parolees with a parole violation or new crime that results in a return to prison. Through November 2017, more offenders are being paroled by the Parole Board than were over the past year.
20-Dec-2017 9 DOC-brf

The Division of Criminal Justice December 2017 prison population projections indicates the FY 2017-18 parole caseload will increase by 4.63 percent. The projected FY 2018-19 parole caseload is projected to drop by 904 parolees or 10.42 percent. The December 2017 changes to the projected parole population will be addressed in the Department’s January 15, 2018 budget amendment. R9 COMMUNITY SUPERVISION CASELOAD: The Department is requesting a reduction of $2,061,362 General Fund and 17.4 FTE to the parole community supervision subprogram. This subprogram includes transitional offenders (inmate status and still considered under the custody of the Department) who are either living in their own home, an approved private residence, or who have been released to a community corrections facility. The Department’s request indicates this reduction is due to a lower utilization of the Inmate Intensive Supervision Program and community supervision (i.e. offenders transitioned to community corrections facilities prior to be being paroled). The request also includes the consolidation of five line items based on the operational structure. The request indicates the appropriations to specific lines items does not match expenditures and the request would consolidate all the lines into a single contract line. Staff will make a recommendation on the proposed consolidation during figure setting. The second briefing issue in the December 20, 2017 Division of Criminal Justice JBC staff briefing discusses the downward trend of community corrections utilization by transition offenders. This request is a direct reflection of the reduction in the number of inmates transitioned to community corrections from prison. Any change in the utilization of community corrections by transition offenders could have an impact on the magnitude of this request. R10 COMMUNITY PROVIDER RATE: The Department requests a 1.0 percent community provider rate increase. The largest increases are for payments to local jails ($150,473 General Fund), payments to in-state private prisons ($569,772 General Fund), and payments to pre-release parole revocation facilities ($106,592 General Fund). NON-PRIORITIZED REQUEST ITEMS: The Department request includes two adjustments for statewide programs overseen by the Department of Personnel and one adjustment to the cost of services provided by the Office of Information Technology in the Governor’s Office. The two Department of Personnel change items will be addressed in a separate staff briefing presented by Scott Thompson for the Department of Personnel on Thursday, December 21, 2017. The Office of Information Technology change was addressed in a separate staff briefing presented by Kevin Neimond for the Office of the Governor on Wednesday November 15, 2017. The table below itemizes each requested non-prioritized item for FY 2018-19.
NON-PRIORITIZED REQUEST ITEMS TOTAL
FUNDS GENERAL
FUND CASH
FUNDS REAPPROPRIATED
FUNDS FEDERAL FUNDS FTE
NP2 Operating system suite (OIT) $1,116,829 $1,110,129 $6,700 $0 $0 0.0
NP Annual Fleet Supplemental (PER) 445,322 415,090 30,232 0 0 0.0
NP1 Cybersecurity liability insurance policy (PER) 95,802 92,027 3,775 0 0 0.0
TOTAL $1,657,953 $1,617,246 $40,707 $0 $0 0.0
CENTRALLY APPROPRIATED LINE ITEMS: The appropriation includes adjustments to centrally appropriated line items for the following: state contributions for health, life, and dental benefits; short-term disability; supplemental state contributions to the Public Employees' Retirement Association (PERA) pension fund; shift differential; salary survey; workers' compensation; legal services;
20-Dec-2017 10 DOC-brf

administrative law judges; payment to risk management and property funds; vehicle lease payments; Capitol complex leased space; payments to the Governor’s Office of Information Technology (OIT); and CORE operations.
CENTRALLY APPROPRIATED LINE ITEMS TOTAL
FUNDS GENERAL
FUND CASH
FUNDS REAPPROPRIATED
FUNDS FEDERAL FUNDS FTE
Salary survey adjustment $10,825,001 $10,516,363 $308,638 $0 $0 0.0
Payments to OIT adjustment 4,671,258 4,643,225 28,033 0 0 0.0
Health, life, and dental adjustment 1,666,559 1,556,187 110,372 0 0 0.0
Workers’ compensation adjustment 559,530 541,849 17,681 0 0 0.0
Legal services adjustment 188,497 182,088 6,409 0 0 0.0
Leased space adjustment 151,856 140,966 10,890 0 0 0.0
Payment to risk management / property funds adjustment (1,129,517) (1,085,014) (44,503) 0 0 0.0
AED adjustment (95,735) (119,622) 23,887 0 0 0.0
SAED adjustment (95,735) (119,622) 23,887 0 0 0.0
Short-term disability adjustment (70,061) (69,010) (1,051) 0 0 0.0
Shift differential adjustment (54,292) (69,955) 15,663 0 0 0.0
Capitol Complex leased space adjustment (5,945) (4,247) (1,698) 0 0 0.0
TOTAL $16,611,416 16,113,208 $498,208 $0 $0 0.0
CI WAGE INCREASE: The request includes $94,000 cash funds for the prevailing wage increase for Colorado Correctional Industries jobs. Colorado Correctional Industries (CCi) participates in Prison Industry Enhancement (PIE) programs. PIE was authorized under the Justice System Improvement Act of 1979 and continued indefinitely under the Crime Control Act of 1990. PIE is part of a federal program that exempts the Department from normal restrictions on the sale of offender-made goods in interstate commerce. The program places offenders in realistic work environments, pays them prevailing wages, and gives them a chance to develop marketable skills that will assist in a successful transition to the community. Colorado’s minimum wage is the starting point for setting prevailing wages for CCi’s PIE programs. Colorado voters approved Amendment 70 in the November 2016 general election. This amendment triggers minimum wage increases in Colorado starting January 1, 2017. Prior to this change, the Colorado minimum wage was $8.31 per hour. CCi’s current inmate pay cash funds spending authority is able absorb the increase to $9.30 per hour on January 1, 2017 and the first six months of the $10.20 per hour increase starting January 1, 2018. INDIRECT COST ASSESSMENT: The appropriation includes a net decrease in the Department’s indirect cost assessment. ANNUALIZE PRIOR YEAR LEGISLATION: The appropriation includes adjustments for the second- and third-year impact of prior year legislation.
ANNUALIZE PRIOR YEAR LEGISLATION TOTAL
FUNDS GENERAL
FUND CASH
FUNDS REAPPROPRIATED
FUNDS FEDERAL
FUNDS FTE
SB 16-180 (DOC for Juvenile Offenders) $13,062 $13,062 $0 $0 0.4
HB 17-1326 (Justice Reinvestment) (460,820) (460,820) 0 0 0.2
TOTAL ($447,758) ($447,758) $0 $0 0.6
20-Dec-2017 11 DOC-brf

ANNUALIZE PRIOR YEAR BUDGET ACTIONS: The request includes appropriation includes adjustments for the second- and third-year impact of prior year budget actions.
ANNUALIZE PRIOR YEAR BUDGET ACTIONS TOTAL
FUNDS GENERAL
FUND CASH
FUNDS REAPPROPRIATED
FUNDS FEDERAL
FUNDS FTE
Annualize merit base pay ($105,470) ($102,960) ($2,510) $0 $0 0.0
Annualize prior year salary survey (8,480) (8,249) (231) 0 0 0.0
FY16-17 Sterling Correctional Facility restrictive housing staffing (700) (700) 0 0 0 0.3
TOTAL ($114,650) ($111,909) ($2,741) $0 $0 0.3
COP PAYMENT ADJUSTMENT: The request includes a reduction of $878 General Fund for the final certificate of participation (COP) payment for the Centennial South Correctional Facility.
20-Dec-2017 12 DOC-brf

ISSUE #1 OVERVIEW OF THE COLORADO CORRECTIONAL SYSTEM
The Colorado correctional system is broken into five phases: laws, sentencing, incarceration, parole, and community corrections. Offenders typically move through the first two phases once per crime, but may visit the last three phases multiple times. The Colorado correctional system is largely funded with General Fund. The system encompasses programs within the Department of Corrections, a portion of the Judicial Branch, and Department of Public Safety. This informational issue will provide a brief overview of each phase.
SUMMARY
The Colorado correctional system is broken into five phases: laws, sentencing, incarceration, parole, and community corrections.
Funding for the Colorado correctional system is primarily General Fund. State appropriations for the correctional system occur in the Department of Corrections, Department of Public Safety, the Judicial Department, and the General Assembly.
RECOMMENDATION This is an informational issue and requires no staff recommendation.
DISCUSSION This issue is designed to provide the Committee with a high-level overview of the Colorado correctional system. JBC staff has broken the correctional system into five phases. For each phase, there will be a brief discussion of the entities involved in the phase, how funding is appropriated, and a description of the activities that occur during the phase.
PHASES The five phases of the Colorado correctional system are:
Phase 1 – Laws
Phase 2 – Sentencing
Phase 3 – Incarceration
Phase 4 – Parole
Phase 5 – Community Corrections PHASE 1 - LAWS This phase is primarily comprised of lawmakers including the General Assembly, Congress, and locally elected officials. Lawmakers are responsible for writing laws, which govern what society deems as acceptable and unacceptable behavior. When an individual is accused of violating one or more of these standards for behavior, they are charged with breaking the law. The cost for lawmakers is funded through the federal government, the Long Bill appropriation for the General Assembly, and the cost for local governments.
20-Dec-2017 13 DOC-brf

This is the first phase of the correctional system and governs the majority of decisions made in all subsequent phases. Laws can be prescriptive and provide little flexibility in implementation. Laws can also be less prescriptive, and clearly express legislative intent while providing the Executive Branch and local governments with the flexibility in implementation. The following are two examples of legislation, one that provided less flexibility (H.B. 15-1043) and one which provided more implementation flexibility (H.B. 16-180). Any statutory change to the laws governing crimes, sentencing, and parole that has a fiscal impact will usually be considered by the Appropriations Committee in each house.
House Bill 15-1043 (Felony Offense for Repeat DUI Offenders) made a DUI, DUI per se, or DWAI a class 4 felony after three or more prior convictions of a DUI, DUI per se, DWAI, vehicular homicide, vehicular assault, or any combination thereof. The fiscal note assumed that the statutory changes would equate to 15.0 percent of cases sentenced to an average prison sentence of 30 months. The bill’s fiscal note estimated that over five years an additional 1,463 offenders would be incarcerated.
House Bill 16-180 (DOC Program for Juvenile Offenders) required the Department to create a specialized program for offenders who committed a felony as a juvenile and were sentenced as an adult. The bill established eligibility criteria for the program that ranged from a minimum time served requirement, to a broad “any other factor determined relevant”. The bill required the Department to design a program that fosters independent living skills development and provide intensive supervision and monitoring. The Department was required to house the program in a minimum facility but had the latitude to design the operational aspects of the program.
PHASE 2 – SENTENCING The following four entities are found in this phase: 1 Law enforcement including local police, county sheriffs, and Colorado State Patrol. 2 County jails staffed by sheriff deputies. 3 Court system including district attorney’s, courts, and public defenders. 4 Individuals who has been accused/convicted of a crime.
This phase is where individuals are accused of breaking a law, and have initial contact with law enforcement. Law enforcement is responsible for identify individuals accused of breaking the law and detaining those individuals, usual in a local jail. Once an individual has been detained, law enforcement is responsible for submitting potential charges to district attorneys. District attorneys are responsible for deciding on whether to charge an individual with a crime. If an individual is charged with a crime, the court system becomes. The court system is responsible for determining whether or not an individual violated the law; and if the individual violated the law, setting the punishment. The Court System includes:
County Courts have limited jurisdiction, handling civil cases under $15,000, misdemeanors, civil and criminal traffic infractions, felony complaints, protection orders, and small claims.
District Courts have general jurisdiction, handling felony criminal cases, large civil cases, probate and domestic matters, cases for and against the government, as well as juvenile and mental health cases.
The Colorado Court of Appeals hears cases when either a plaintiff or a defendant believes that the trial court made errors in the conduct of the trial.
20-Dec-2017 14 DOC-brf

The Colorado Supreme Court also hears appeals, but only when it considers the cases to have great significance. The Supreme Court may also answer legal questions from the General Assembly regarding proposed laws. The Supreme Court is also responsible for overseeing the regulation of attorneys and the practice of law, and for reviewing judges standing for retention during elections.1
Phase 2 Funding Sources Local law enforcement is funded by local funds appropriated within city and county budgets. Police departments are funded by cities and sheriff offices are funded by counties. The exception is the City and County of Denver, which funds both police and sheriffs. The Colorado State Patrol is funded within the Department of Public Safety primarily with Highway User Tax Funds (HUTF). The Department of Corrections pays a daily rate to county jails that are holding eligible Department of Corrections’ offenders, including offenders who have violated parole conditions, and those offenders sentenced to prison and awaiting an open prison bed. The daily rate paid by the Department Corrections does not fully cover the cost of housing the offender in the jail. The cost of county and district courts are covered partially by the state (primarily for staff and furnishing), and partially by the county (building and security costs). The Court of Appeals and Supreme Court are funded through appropriations in the Judicial Department. PHASE 3 – INCARCERATION The prisons are run by the Department of Corrections and private operators. Also within this phase are county jails. In this phase, offenders are housed in a confined facility that eliminates their contact with society. Offenders have no choice in housing location, food, or cellmates. Based on behavior while incarcerated, offenders may gain the ability to make choices about work, educational opportunities, and canteen purchases. There are different types of therapies (e.g. sex offender therapy, and therapeutic communities) available to offenders. Offenders have access to medical treatment, medications, and mental health services. Prisons are classified based on the highest risk level offender they can safety house. There are five different prison levels. The higher the prison level, the more secure the prison.
Level V – Maximum-security facilities. Level V facilities can house any risk level offender from close custody and below, as well as offenders assigned a status (close custody2, protective custody, or residential treatment program). There are six Level V facilities and all are state run.
Level IV – Second highest security level facilities. Level IV facilities can house mixed custody offenders including those in close and medium custody. An offender is eligible for assignment to a Level IV facility if their current custody level is medium or close. Limon Correctional Facility is the only Level IV facility.
Level III – Medium level facilities can house medium level offenders and below. Lower custody level inmates may be housed at a Level III facility for specific work assignments as dictated by the needs of the facility. There are eight Level III facilitates, five state run prisons and the three private prisons.
1 From 2016 Justice System Background Information for 2016 New Member Orientation 2 Close custody offenders are the highest risk offenders who spend the majority of their day in a cell.
20-Dec-2017 15 DOC-brf

Level II – Minimum-restricted and minimum custody facilities. An offender is eligible for assignment to a Level II facility if their current custody level is minimum-restricted, or below, has not been identified as a sex offender. Offenders must be within 60 months of parole eligibility and have no restriction on their mandatory release date. There are three Level II facilities and all are state run.
Level I – Minimum custody facilities. An offender is eligible to be considered for assignment to a Level I facility if their current custody level is minimum, has not been identified as a sex offender. Offenders at Rifle Correctional Center, Colorado Correctional Center, and Delta Correctional Center must be within 36 months of parole eligibility, or within seven years of a mandatory release date. Offenders at Skyline, which has a higher level of security, must be within 60 months of parole eligibility, or within 10 years of a mandatory release date.3 There are four Level I facilities and all are state run.
There are different types of beds within each facility. The following is a brief description of the bed types within the correctional system:
General population – housing for the typical inmate generally assigned to a facility;
Disciplinary segregation – restrictive housing for inmates in violation of major institutional rules;
Close custody – restrictive housing for inmates who present a significant threat to an institution’s safety and security;
Protective custody –voluntary housing for inmates seeking protection from other inmates;
Infirmary – temporary or long-term housing for inmates requiring specific medically-determined treatment;
Mental health – dedicated housing for inmates with diagnosed mental illness with integrated treatment provided in the housing unit;
Unclassified/booking –initial separate housing of inmates newly admitted to a facility while they undergo classification and initial orientation; and
Emergency beds – available for use when facilities exceed normal population levels.4 Funding for state run prisons and private prisons is primarily General Fund. A small portion of the funding is from cash funds related to canteen purchases and Correctional Industries. The following table summarizes the average daily rate by custody level of state run prisons and the average daily rate paid to private prisons.
3 Facility type description is from the “Colorado Prison Utilization Study.” Becker, Karl, etc. June 2013. Page 20 and 21 4 Bed type description is from the “Colorado Prison Utilization Study.” Becker, Karl, etc. June 2013. Page 18
20-Dec-2017 16 DOC-brf

There are nineteen prisons operated by the Department. Appendix F includes the Department’s FY 2016-17 cost per offender by facility. This provides a high-level overview of the size and cost of each facility. There are three in-state private prisons operated by private companies. Private prisons house medium and low-level custody offenders. Private prisons provide general equivalency diploma (GED) classes and medical services, but do not provide specialized therapies or Correctional Industry work opportunities. The privately run Cheyenne Mountain ReEntry Center provides intensive reentry services to offenders (including sex offenders) prior to parole. The Department operates the Youthful Offender System (YOS). YOS is a sentencing option for offenders who committed a violent offense as a youth (18 years old or younger). Instead of being sentenced to an adult prison, youth offenders are sentenced to YOS. YOS offenders receive an adult sentence that is suspended pending successful completion of the YOS sentence. PHASE 4 – PAROLE The Parole Board is responsible for making discretionary and mandatory parole decisions for eligible offenders. Once an offender is paroled, the Division of Adult Parole, within the Department of Corrections, is responsible for monitoring parolees for compliance with their parole plans. In this phase, offenders are reentering society through release to parole (the next phase will discuss release to community corrections). Parole officers and management are funded through the Department of Corrections Division of Adult Parole. Funding for parole is General Fund. The Parole Board is funded by General Fund within a separate division in the Department of Corrections. There are three types of parole: regular parole, inmate intensive supervision parole, and parole intensive supervision parole. Inmate Intensive Supervision Parole is for offenders who are low risk, within 180 days of their parole eligibility date, and considered safe to be managed in the community prior to their actual parole (therefore they are still called offenders and not parolees). Regular Parole is granted to offenders who have not yet completed their prison sentence and agree to comply with certain conditions. Parole Intensive Supervision Parole (ISP) is used as a condition of parole for parolees who are the highest risk offenders. There are nineteen parole offices throughout the state. Offenders can be paroled to any location if the parole officer, Parole Board, and case manager has approved it. Offenders can also be paroled out of state.
$76.94$82.45
$107.16
$124.93
$62.13
$0
$20
$40
$60
$80
$100
$120
$140
Level I Level II Level IV Level V Private
Average Daily Cost Per Offender by Custody Level
20-Dec-2017 17 DOC-brf
Offenders are released to parole with some or all of the following conditions5:
Conduct: Parolee shall obey all state and federal laws and municipal ordinances. Parolee shall follow the directives of the parole officer at all times.
Report: Parolee shall make written and in person reports as directed to the parole officer and shall permit visits to his/her place of residence as required by the parole officer/parolee shall submit urinalysis or other tests for narcotics or chemical agents upon the request of the parole officer, and is required to pay for all tests.
Weapons: Parolee shall not own, possess, nor have under his control or his custody, firearms or other deadly weapons.
Association: Parolee shall not associate with any person with a criminal record without the permission of the parole officer.
Employment: Parolee shall seek and obtain employment, or shall participate in a full time educational or vocational program, unless waived by the parole officer.
Alcohol/Drugs: Parolee shall not abuse alcoholic beverages, medical or recreational marijuana or possess and/or use illegal drugs.
Child Support: Parolee shall comply with any court or administrative order to pay child support Mandatory and Discretionary Parole When an offender arrives in prison, there is a range of dates on which they can be paroled.
The mandatory release date, or MRD, is the date by which the parole board must grant parole. Initially the MRD equals the end of the judge's prison sentence.
The parole eligibility date, or PED, is the first date on which the offender can be paroled. The PED depends on the sentence and the offense. The PED occurs prior to the MRD.
Offenders who committed non-violent felonies are generally eligible for parole at the 50.0 percent point of their MRD; offenders who commit certain violent felonies are eligible for parole at the 75.0 percent of their MRD. Once an offender is paroled, the prison sentence no longer matters; only the length of the parole term matters. The sentence discharge date, i.e. the date on which parole ends, initially equals the end of the mandatory parole period; the offender is discharged from parole when he reaches this date. Discharge is automatic at the sentence discharge date; there is no review by the Parole Board.
PHASE 5 COMMUNITY CORRECTIONS The Division of Criminal Justice within the Department of Public Safety oversees the community corrections boards, providers and facilities. Community correction board members are appointed by commissioners of the counties that make up each of Colorado’s 22 judicial districts. Community correction providers can be non-profits, for-profits, or local governments. Colorado's community corrections programs, also known as halfway houses, provide clients with supervision and structure in both residential and nonresidential settings. They are operated by local governments, private providers, and non-profits. Residential clients live in residential facilities and go out during the day to work or seek work.
5 https://www.colorado.gov/pacific/cdoc/adult-parole
20-Dec-2017 18 DOC-brf

Community corrections is funded through the Department of Public Safety, Division of Criminal Justice. Funding for community corrections is primarily General Fund. There are 32 residential facilities throughout the state comprising approximately 4,000 beds. Of the 32 facilities, 10 are located in Denver, 3 each are located in the 17th and 18th judicial districts, and 2 each are located in the 20th, 1st, and 4th judicial districts. There are residential, non-residential and specialized beds. The first briefing issue in the December 20, 2017 JBC staff briefing on the Division of Criminal Justice within the Department of Public Safety provides a detailed overview of community corrections.
SENTENCING AND EARNED TIME OVERVIEW SENTENCING OVERVIEW Offenders sent to the Colorado Department of Corrections are sentenced to a period of imprisonment and to a period of parole. For example, an offender who committed a class 4 felony might be sentenced to 5 years of imprisonment followed by 3 years of parole. The court has some discretion regarding the length of the prison term but the parole period is mandatory (set in statute) and depends on the felony classification.
EARNED TIME Offenders with good behavior (i.e. obey prison rules), and comply with their assigned programs, are awarded "earned time," which moves the parole range forward by the amount of earned time. Offenders who committed class 4, 5, or 6 felonies receive 12 days of earned time per month. Offenders who committed class 2 and 3 felonies receive 10 days of earned time per month. Maximum allowable earn time (regular earned time plus achievement earned time) per incarceration is 120 days. The Parole Board must parole the offender when reaches their mandatory release date as adjusted for earned time. The Parole Board may parole the offender as early as their parole eligibility date, as adjusted for earned time. With a few exceptions, earned time, can at most, move the parole eligibility date and mandatory release date forward by 30.0 percent of the sentence pursuant to Section 17-22.5-405 (4), C.R.S. Earned time can also be accumulated while in community corrections or while on "Intensive Supervision Parole-Inmate" status.
20-Dec-2017 19 DOC-brf

Achievement Earned Time The Department can award up to 60 days of "achievement earned time" to offenders who are incarcerated or on parole who successfully complete a milestone or phase of an educational, vocational, therapeutic, or reentry program. Achievement time can also be awarded for offenders who, through exceptional conduct, promote the safety of correctional staff, volunteers, contractors, or other persons at the DOC.
PAROLE EARNED TIME AND PAROLE VIOLATIONS Most parolees can receive earned time by complying with their conditions of parole. Earned time awards equal 10 days per month for class 2 and 3 felonies and 12 days per month for class 4, 5 and 6 felonies. The sentence discharge date moves forward as the earned time accumulates. Two types of offenders can receive earned time while on parole: (1) offenders who committed non-violent crimes after June 1992 and (2) offenders who committed violent crimes after June 1992 and were paroled after 2009. If a parolee violates his conditions of parole, either by committing a technical violation or a new crime, their parole may be revoked by the Parole Board, resulting in reincarceration. An offender can be reincarcerated more than once while on parole. The offender keeps progressing toward their sentence discharge date while reincarcerated. When the offender reaches his sentence discharge date, as moved left by earned time, they are discharged. In some cases, offenders may reach this discharge date while reincarcerated for a parole violation. If this occurs, the offender is released from reincarceration on this date.
20-Dec-2017 20 DOC-brf

20-Dec-2017 21 DOC-brf

ISSUE #2 PRISON UTILIZATION AND R2 PRISON CAPACITY
The recent prison population dropped from a high of 20,144 in July 2017 to 19,718 on November 30, 2017. The population is projected to raise by up to 244 offenders by the end of FY 2017-18. The population is projected to increase beyond current system capacity by the end of FY 2018-19. Based on the projections, the prison population will grow between 700 to 1,200 offenders in FY 2018-19. Currently the Centennial South Correctional Facility is vacant. The 2016 Prison Utilization Study Update recommended structural changes to three facilities to increase the capacity of the State to house offenders.
SUMMARY
The recent prison population dropped from a high of 20,144 offenders in July 2017 to 19,718 offenders on November 30, 2017. The recommended bed vacancy rate is 2.0 percent. The bed vacancy rate in July 2017 was 0.9 percent. The November 2017 bed vacancy rate was 3.0 percent.
The prison population is projected to grow slightly through the end of FY 2017-18. Legislative Council projects the population to be 19,962 at the end of FY 2017-18 (an increase of 244 offenders from the November 2017 level). The Division of Criminal Justice projects the population to be 19,786 at the end of FY 2017-18 (an increase of 68 offenders).
Legislative Council projects the FY 2018-19 population to grow by 751 offenders. The Division of Criminal Justice projects the FY 2018-19 population to grow by 1,114 offenders. Both projections indicate the population will grow beyond current system capacity.
The Committee approved an interim supplement to add 250 beds by leasing a private prison. The Department has not yet signed a lease with the private prison.
The Committee received responses from private prison operators about their cost to reopen and operate a private prison in Colorado. It would cost private prison operators between $67.00 per day and $85.00 per day ($12.3 million to $15.5 million annually for 500 offenders) to reopen and operate a private prison in Colorado.
The February 2016 Colorado Prison Utilization Study Update made four recommendations for how the Department could reconfigure/repurpose facilities to make use of Centennial South. If the recommendations are adopted, the State’s bed capacity would increase by 820 beds.
RECOMMENDATION Staff recommends the Committee sponsor legislation to remove the statutory prohibition on using Centennial South. Staff also recommends the Committee fund the capital construction costs associated with the recommendations of the February 2016 Prison Utilization Study Update.
20-Dec-2017 22 DOC-brf

DISCUSSION This issue will cover the following four topics: 1 A summary of the past 28 months of data on the number of offenders and vacancy rates; 2 An overview of the December 2017 DCJ and Legislative Council prison population forecasts; 3 A summary of the 2013 Prison Utilization Study; and 4 A summary of the recommendations made in the 2016 Prison Utilization Study Update.
HISTORICAL DATA This section focuses on recent actual prison data (June 2015 through November 2017). The purpose of this section is to provide the Committee with an understanding of where the prison population and bed vacancy numbers have been. This should help contextualize the magnitude of changes included in the next section’s discussion of the population forecasts. The following two tables show the total number of offenders by type of prison (state or private prison) and by gender.
10,000
12,000
14,000
16,000
18,000
20,000
22,000
6/
1/2015
7/
1/2015
8/
1/2015
9/
1/2015
10/
1/
2015
11/
1/
2015
12/
1/
2015
1/
1/2016
2/
1/2016
3/
1/2016
4/
1/2016
5/
1/2016
6/
1/2016
7/
1/2016
8/
1/2016
9/
1/2016
10/
1/
2016
11/
1/
2016
12/
1/
2016
1/
1/2017
2/
1/2017
3/
1/2017
4/
1/2017
5/
1/2017
6/
1/2017
7/
1/2017
8/
1/2017
9/
1/2017
10/
1/
2017
11/
1/
2017
Total Prison Population by State and Private PrisonState Prison Private prison
20-Dec-2017 23 DOC-brf

The following table shows the number and percentage of vacant state prison. The 2013 Prison Utilization Study recommended a 2.0 percent vacant rate. The July 2017 bed vacancy percent was 0.9 percent. As of November 30, 2017, there were 481 vacant beds, a 3.0 percent vacancy rate.
14,500
15,000
15,500
16,000
16,500
17,000
17,500
18,000
18,5006/
1/2015
7/
1/2015
8/
1/2015
9/
1/2015
10/
1/
2015
11/
1/
2015
12/
1/
2015
1/
1/2016
2/
1/2016
3/
1/2016
4/
1/2016
5/
1/2016
6/
1/2016
7/
1/2016
8/
1/2016
9/
1/2016
10/
1/
2016
11/
1/
2016
12/
1/
2016
1/
1/2017
2/
1/2017
3/
1/2017
4/
1/2017
5/
1/2017
6/
1/2017
7/
1/2017
8/
1/2017
9/
1/2017
10/
1/
2017
11/
1/
2017
Total Prison Population by GenderMale Pop. Female Pop.
0.0%
0.5%
1.0%
1.5%
2.0%
2.5%
3.0%
3.5%
4.0%
0
100
200
300
400
500
600
700
6/
1/2015
7/
1/2015
8/
1/2015
9/
1/2015
10/
1/
2015
11/
1/
2015
12/
1/
2015
1/
1/2016
2/
1/2016
3/
1/2016
4/
1/2016
5/
1/2016
6/
1/2016
7/
1/2016
8/
1/2016
9/
1/2016
10/
1/
2016
11/
1/
2016
12/
1/
2016
1/
1/2017
2/
1/2017
3/
1/2017
4/
1/2017
5/
1/2017
6/
1/2017
7/
1/2017
8/
1/2017
9/
1/2017
10/
1/
2017
11/
1/
2017
Number and Percentage of Vacant State Beds
No. Vacant Beds % of Vacant Beds
20-Dec-2017 24 DOC-brf

The following graph shows the relationship between the state prison population (i.e. offenders in state-run prison) and the bed vacancy rate.
DECEMBER 2017 PRISON POPULATION FORECASTS The following chart compares the Legislative Council and Division of Criminal Justice December 2017 prison population forecasts. FY 2017-18 Prison Population Forecast In both forecasts, the prison population is projected to grow slightly through the end of FY 2017-18. Legislative Council projects the population to be 19,962 at the end of FY 2017-18 (an increase of 244 offenders from November 2017). The Division of Criminal Justice projects the population to be 19,786 at the end of FY 2017-18 (an increase of 68 offenders).
FY 2018-19 Prison Population Forecast Both forecasts project a large growth in the prison population in FY 2018-19. Legislative Council projects the FY 2018-19 population to grow by 751 offenders. The Division of Criminal Justice projects the FY 2018-19 population to grow by 1,114 offenders. Both projections indicate the population will grow beyond current system capacity.
0.0%
0.5%
1.0%
1.5%
2.0%
2.5%
3.0%
3.5%
4.0%
13,500
13,600
13,700
13,800
13,900
14,000
14,100
14,200
14,300
14,400
14,500
6/
1/2015
7/
1/2015
8/
1/2015
9/
1/2015
10/
1/
2015
11/
1/
2015
12/
1/
2015
1/
1/2016
2/
1/2016
3/
1/2016
4/
1/2016
5/
1/2016
6/
1/2016
7/
1/2016
8/
1/2016
9/
1/2016
10/
1/
2016
11/
1/
2016
12/
1/
2016
1/
1/2017
2/
1/2017
3/
1/2017
4/
1/2017
5/
1/2017
6/
1/2017
7/
1/2017
8/
1/2017
9/
1/2017
10/
1/
2017
11/
1/
2017
State Prison Population and Percentage of Vacant State Beds
State Prison Population % of Vacant Beds
20-Dec-2017 25 DOC-brf

2013 COLORADO PRISON UTILIZATION STUDY House Bill 12-1336 required the Office of State Planning and Budgeting to contract for a prison utilization study “that identifies the most appropriate and cost-effective uses of the available public and private inmate beds that house the Department of Corrections’ jurisdictional population. The analysis shall consider different possible scenarios of population growth or decline and changes in the composition of the inmate population and including level of risk, length of sentence, and associated programmatic needs.” The 2013 Prison Utilization Study categorized the state prisons into three tiers based on their functional value to the correctional system6. Appendix F includes a description of each tier and the explanation of the tier placement of facilities.
Tier 1 Tier 2 Tier 3
Denver Reception Sterling Cheyenne Mountain ReEntry
Center
Denver Women’s Centennial North Rifle
San Carlos Limon Four Mile
Colorado State Penitentiary Arkansas Valley Skyline
Colorado Territorial Correctional Facility Bent County
Colorado Correctional Center (Camp George West)
Buena Vista Youthful Offender System
Crowley County Kit Carson
Fremont
La Vista
Arrowhead
Trinidad
Delta
*Prisons in italics are privately run.
6 Colorado Prison Utilization Study. Becker, Karl, et. All. June 2013. Pages 2 and 3.
18,500
19,000
19,500
20,000
20,500
21,000
21,500
22,000
22,500
6/
1/2017
12/
1/
2017
6/
1/2018
12/
1/
2018
6/
1/2019
12/
1/
2019
6/
1/2020
Actual and Projected Prison Population June 2017 through June 2020
DCJ Leg Council Actual
20-Dec-2017 26 DOC-brf

RECOMMENDATIONS IN THE 2016 PRISON UTILIZATION STUDY UPDATE Other than the closure of the privately run Kit Carson facility, no action has been taken to close or repurpose any of the remaining prisons in recent years. The 2013 Prison Utilization Study noted that the vacant Centennial Correctional Facility South “has left the State with significant ongoing expenditures to pay for its construction without any operational benefit. The potential for a sale or lease of the facility to another jurisdiction is quite limited due to the location of the facility in the middle of a state correctional complex shared with another facility (Centennial North).” The study noted that Centennial South “could be beneficial to the Department if a specific, cost-effective mission for the facility could be identified.7” The potential beneficial use of Centennial South spurred the February 2016 Colorado Prison Utilization Study Update that made the following recommendations for how the Department could reconfigure/repurpose facilities to make use of Centennial South. 1 Move central reception and diagnostic review of all intakes into DOC from the Denver Reception
and Diagnostic Center (DRDC) to Centennial South. Support of this function will require 442 beds.
2 Establish a centralized re-entry program at CCF South that will provide transitional preparation and support for inmates from throughout the prison system who are approaching the end of their terms of incarceration. This program will require 506 beds and result in full utilization of CCF South.
3 Designate Centennial Correctional Facility North (CCF North or Centennial North) as the central transportation unit hub and support facility for CCF South. The transportation unit will require 192 beds, or four housing units, at CCF North. Establishing an inmate worker cadre to perform facility support functions at both CCF South and North will require 144 beds, making full use of available capacity at the facility.
4 Relocate the residential treatment program (RTP) from CCF North to DRDC. This program, which provides mental health treatment services to inmates diverted from administrative segregation, will require three housing units at DRDC, providing 340 beds.
5 Centralize housing for inmates with long-term care needs at DRDC. These inmates, who have physical, cognitive, and medical conditions that require special care, will have 238 beds at the facility designated for their housing and care.8
The report noted the recommendations accomplish three department objectives: “(1) provides a strategy to make effective use of Centennial South. (2) Centralizes and improves services to inmates with long-term care needs, medical issues, and ongoing mental health treatment in a facility that is both well-designed to manage these inmates and located in a metropolitan area that can support the facility’s clinical staff and service needs. (3) Creates a central re-entry program to address the needs of inmates as they prepare to transition back into the community9.” Overall, the recommended changes would increase the state prison bed count by 820.
7 Becker, K., McGinnis, K., Austin, J., & Fisher, M., Colorado Prison Utilization Study, CNA, June 2013, p. 137. 8 CGL. Colorado Prison Utilization Study Update. February 2016. Page 1. 9 CGL. Colorado Prison Utilization Study Update. February 2016. Page 3.
20-Dec-2017 27 DOC-brf

FACILITY CURRENT PROPOSED CHANGE DRDC 572 552 (20)
Centennial South 0 948 948
CCF North 320 336 16
CTCF – Central Transportation Unit 124 0 (124)
La Vista Correctional Facility – Southern Transportation Unit (Males)
30 0 (30)
La Vista Correctional Facility (Females) 560 590 30
Total Capacity Change 820
The 2016 Prison Utilization Study Update included the following pros and cons of the repurposing existing facilities. Pros
Full utilization of CCF South, a new state-of-the-art correctional facility that has stood vacant for the past four years.
Assignment of housing and programs for offenders with special medical and mental health treatment needs to the facility that has the most resources available to provide effective services. The DRDC’s infirmary, ample medical treatment resources, and access to mental health treatment resources in the Denver metropolitan area make it the optimal choice to house these populations.
Addition of 820 beds to correctional system capacity. The additional capacity provides a means to potentially reduce the DOC’s private prison contracts by shifting inmates back to available state facility beds and provides needed flexibility in managing overall system capacity.
Establishment of a centralized point for re-entry programming for soon-to-be released offenders. Standardizing and upgrading re-entry services for all inmates exiting the correctional system have been long-term goals for the DOC and an important component of strategies to reduce offender recidivism.
Cons
Significant capital costs required to modify current facilities to meet new operational and program responsibilities. None of the facilities were designed to support the functions proposed by the DOC, and therefore will require physical plant modifications to support their new responsibilities.
Significant increased annual operating costs.
Moving reception away from the DRDC, a facility specifically designed to manage intake processing in a highly efficient and effective manner. DRDC has an optimal design and location for processing new admissions into the state prison system. While the facility can be effectively repurposed to serve other functions, its effectiveness and efficiency as an intake and diagnostic center is outstanding.
Significantly increasing the distance to prison system intake for northern Colorado counties. Locating central intake at CCF South will substantially increase transportation responsibilities for the DOC, as inmates from northern Colorado counties will probably continue to drop off new inmates at DRDC, which will then have to develop a staging process to very quickly move these offenders to CCF South. Approximately 65 percent of the DOC’s annual intake comes from northern and central Colorado counties. The required logistics increase the complexity and expense of the inmate transportation system.
20-Dec-2017 28 DOC-brf

In response to staff questions, the Department indicated they would support funding to implement the 2016 Prison Utilization Study Update recommendations. The Department provided updated cost estimates and a timeline in which those changes could be made. The following table summarizes the cost estimates and timeline.
INFLATION ADJUSTED ESTIMATE TO IMPLEMENT PRISON
UTILIZATION STUDY 2.0 RECOMMENDATIONS
INITIAL
ESTIMATE
FY14|15
INFLATED
ESTIMATE
FY19|20*
Capital Construction Costs Centennial Correction Facility - South (CCF-S) $2,800,705 $3,170,398
Centennial Correction Facility - North (CCF-N) 3,157,273 3,574,033
Denver Reception & Diagnostic Center (DRDC) 3,314,101 3,751,562
Subtotal $9,272,079 $10,495,993
Startup Expense
Software ** $240,320 $240,320
Data and Communications Equipment 128,380 128,380
IT Technical Staff Support 200,000 200,000
CO Uniforms 33,626 38,065
Misc. Equipment/Commodities 43,864 49,654
Staff Relocation 60,000 60,000
Re-Entry Program Materials 39,001 44,149
Subtotal $745,191 $760,568
Annual Operating Costs
Personal Services $14,548,294 $14,754,730
Office of Information Technology 146,934 166,329
Support Costs 3,727,508 3,913,883
Subtotal $18,422,736 $18,834,943
If funding is approved to begin July 1, 2018, the first year will be contract and selection, design, bidding, and contract award. Construction and updates could start in approximately May 2019 through June 2020 (Centennial South improvements May through August 2019; Denver Reception and Diagnostic Center renovation October 2019 through February 2020; Centennial North American with Disabilities Act (ADA) improvements May through June 2020. Staffing hiring could begin in spring 2019. The Department identified three possible issues if the recommended changes are made:
Logistical challenges to arrange transportation and processing for intakes and releases for the northern counties within the State.
Human resources challenges related to relocating the 38 diagnostic positions from Denver Reception and Diagnostic Center to Centennial South.
There will be challenges recruiting and retaining the thirty additional clinical positions allocated for Centennial South for the diagnostic process
20-Dec-2017 29 DOC-brf

R2 PRISON CAPACITY The Department has requested a $19.4 million General Fund placeholder for prison capacity costs (Department request R2). The Department will submit a January 15, 2018 caseload budget amendment with additional details of what comprises the $19.4 million General Fund. The placeholder includes $248,443 for 18 new private prison beds from July 2018 to February 2019. These beds will be needed because 18 beds at the Buena Vista Correctional Facility will be taken off-line for a controlled maintenance project.
THINGS TO CONSIDER The work and recommendations have been made for structural changes to the system what would utilize existing facilities while also making improvements to reentry services. In order to inform supplemental and figure setting decisions, staff recommends the Committee consider the following points:
Is leasing a private prison and staffing with state employees, a long-term solution? If the caseload forecasts hold true, this option will not generate enough new beds.
The prison population is forecasted to increase significantly in FY 2018-19 and FY 2019-20.
Incarceration in a prison is not the start of the correctional process, but the midpoint. Housing offenders sentenced to prison is not optional.
The General Assembly has invested significant resources to construct Centennial South.
Would a large-scale system change encourage better reentry services?
20-Dec-2017 30 DOC-brf

ISSUE #3 CORRECTIONAL OFFICER STEP PLANS AND R1 STAFF RETENTION
The Department has requested $3,336,294 total funds, of which $3,292,961 is General Fund for a 5.0 percent salary increase to employees within the Correctional Office I and II, Correctional Support Trades Supervisor I, Nurse I and III, and Mid-Level Provider classifications with two to seven years of service. The primary purpose of the Department’s request is to improve staff retention, align with other law enforcement agencies, and provide a safe work environment within institutions. In place of the 5.0 percent increase, JBC staff proposes the General Assembly fund a step plan for Correctional Officers I, II and Correctional Support Trades Supervisor I in FY 2018-19.
SUMMARY
The Department has requested $3,336,294 total funds, of which $3,292,961 is General Fund for a 5.0 percent salary increase for Correctional Office I and II, Correctional Support Trades Supervisor I, Nurse I and III, and Mid-Level Provider classifications with two to seven years of service. The Department’s request is intended to improve staff retention.
Combing the Department’s request with the Governor’s proposed changes to employee contributions to the Public Employees Retirement Association (PERA) reduces the proposed increases to 2.9 percent.
An across the board increase does not address the issue that Department employees are not moving through the pay range and leaving the Department for better paying jobs. Funding a step plan for correctional officers would ensure movement through the pay range and align with how other law enforcement officers are paid.
The cost of implementing the correctional officer step plan option 1 across all classifications discussed in this issue is $25.2 million. The cost of implementing the correctional officer step plan option 2 across all classifications discussed in this issue is $13.1 million.
The Department of Human Services received funding in FY 2017-18 to increase salaries for nurses working at the Colorado Mental Health Institute - Pueblo. The Department of Corrections’ request for compensation increases for nurses and mid-level providers is not structured the same as the funding approved for similarly classified employees working in the Department of Human Services.
Based on the methodology used in the Department of Human Services’ compensation request, it will cost $8,841,356 General Fund to adjust salaries for nurses and mid-level providers in the Department of Corrections.
RECOMMENDATIONS Staff recommends the Committee the sponsor legislation to eliminate the Department of Corrections personal services reversion transfers to the SERF and allow these funds to revert to the General Fund. This change would enable personal services reversions to pay for the following fiscal year step increases.
20-Dec-2017 31 DOC-brf

Staff recommends the adjustment to the nurse I, II, and III classifications, as well as the mid-level provider classification, be adjusted using the same methodology that is approved for the Department of Human Services R1 request. Staff recommends the Committee discuss with the Department during the hearing the logics of implementing of a step plan for Correctional Officer I, II, and Correctional Support Trades Supervisor I in FY 2018-19. Staff also recommends the Department discuss what other classifications in future years should be included in a step plan.
DISCUSSION This issue will cover the following topics:
Summary of the Department’s R1 Staff Retention request and staff concerns with the request.
Overview of the JBC staff proposed step plan.
Summary of the implementation process for the step plan for the Correctional Officer I, Correctional Officer II, and Correctional Support Trade Supervisor I classifications.
Discussion of the compensation adjustments approved for the Department of Human Services nurses and mid-level providers.
DEPARTMENT R1 STAFF RETENTION The Department is requesting $3,336,294 total funds, of which $3,292,961 is General Fund for 5.0 percent salary increase to eligible employees in six classifications. The eligible employees must have between two and seven years of services with the Department. The classifications identified in this request and associated annual increase are: 1 Correctional Officer I - $2,100 annual increase 2 Correctional Officer II - $2,352 annual increase 3 Correctional Support Trades Supervisor - $2,328 annual increase 4 Nurse I - $3,216 annual increase 5 Nurse III - $3,684 annual increase 6 Mid-Level Provider - $4,512 annual increase.
The request indicates the majority of employees in these classifications are in the lowest pay range quartile. The reason for this is due to the elimination of the step plans in the early 2000s because of General Fund constraints. The lack of salary progression, work life balance (mandatory overtime) due to requirements to maintain minimum staffing patterns to ensure appropriate public safety, compounded by a competitive job market have contributed to high turnover in these classifications. The staff within these classifications comprise 59.4 percent of the Department’s FTE, but account for 69.9 percent of the turnover. JBC STAFF CONCERNS WITH R1 One-Time Increase Does Not Provide Long-term Incentives JBC staff is not convinced a 5.0 percent one-time increase for these classifications would improve long-term retention because a 5.0 percent increase does not address the underlying issue about the lack of progression through the pay range. Employees within the Correctional Officer I and II classifications can easily move to county sheriff departments or local police departments after a couple of years with the Department and start out at a substantially higher salary. This request does not provide a continuous incentive for employees to stay with the Department for more than an additional
20-Dec-2017 32 DOC-brf
year. Additionally, historical across the board salary increases have not improved the Department’s ability to retain staff. Inequity between Departments for Similarly Classified Employees The Department of Human Services requested and received $2,853,305 General Fund in a FY 2017-18 September interim request for salary increases for registered nurses (Nurse I, II, and III) who worked at the Colorado Mental Health Institute – Pueblo (CMHIP). The Department of Human Services has requested for FY 2018-19 the continuation of these increases ($8,901,740 General Fund). The Department of Human Services increases are structured as follows:
Newly hired CMHIP staff in the Nurse I, II, and III classifications are paid a starting salary that equals the midpoint of the corresponding State pay ranges for FY 2017-18. The FY 2017-18 funding assumes that half of the current vacancies will be filled for four months in FY 2017-18; projections for ongoing costs in FY 2018-19 assume all vacancies will be filled for the full fiscal year.
Effective October 1, 2017, increase salaries for existing staff in the Nurse I, II, and III classifications to at least the midpoint of the corresponding State pay range for FY 2017-18. Salary increases will be limited to employees who are performing satisfactorily (based on a rating of 2 or 3 on the most recent performance evaluations). Existing employee’s salaries will be increased above this midpoint based on the number of years employed by the State.10
Using the Department of Human Services’ methodology for salary adjustments for the Nurse I, Nurse II, Nurse III, and Mid-level Providers at the Department of Corrections, would cost $8,841,356 General Fund. The cost includes current vacant positions at range midpoint, uses years of service in the current classification, and places current staff along the compression pay table used for the funding approved for the Department of Human Services. Nurses and mid-level providers who are working in Department of Corrections’ facilities, especially San Carlos, are on the same campus as the Department of Human Services nurses who are receiving these raises. It is unclear to staff why nurses who are doing similar job functions in institutional facilities should be treated differently. Therefore, staff recommends the Committee apply the same compensation methodology to the Department of Corrections nurses and mid-level providers that is provided to similarly classified staff in the Department of Human Services.
STEP PLAN The Department had a step plan prior to FY 2001-02. The step plan was eliminated because of the economic downturn requiring General Fund reductions. There is a tipping point where the mental and physical demands of working as a correctional officer outweigh the pay and benefit incentives the State can offer. Based on the turnover rates, the Department is close to this point. The following table shows, for the four correctional officer classifications, how turnover has increased since FY 2011-12 despite periodic funding for salary survey and merit pay.
10 Kampman, Carolyn. Department of Human Services, September 20, 2017 interim supplemental JBC Staff recommendation. Pages 22 and 23.
20-Dec-2017 33 DOC-brf

Many law enforcement agencies, including county sheriffs and local police departments, use a step plan for officer pay. Step plans are used to minimize officer turnover and maintain officer morale. The current relationship between the public and law enforcement, as well the demands and expectations placed on law enforcement officers is evolving and challenging. High staff turnover leads to:
Increased overtime costs to cover shifts while new officers are in training;
High costs to train and equip new officers;
Decreased work life balance due to forced overtime and limited time off; and
Unsafe conditions within the prisons11. Ensuring that the Department is able to maintain, and even reduce, officer turnover would lead to future cost avoidances. Additionally, incentivizing officers to stay within the Department and promote through the ranks ensures there are officers able and willing to take over leadership positions as the current leadership retires. There can be any number of steps to a step plan. The JBC staff proposed step plan is broken out into ten steps based on the structure of county sheriff’s step plans, PERA vestment timelines, and state annual leave amounts. The steps at each classification discussed in this issue follow the same principles: 1 Largest increases are provided in step years one through six. 2 Minimal increases are provided in step years seven through nine. 3 A larger increase is provided in step year ten. State employees become vested in their retirement benefits through PERA after five years, which can incentivize employees to stay at the Department through at least five years. The Department has found that if an employee stays for at least seven years, they are more likely to complete their tenure with the Department. Therefore, the proposed plan provides larger steps through step year six (steps start after
11 Staff shortages were noted as a contributor in the February 2017 Delaware prison riot that claimed the life of one employee and the October 2017 North Carolina prion escape attempt that claimed the lives of four employees.
0.0%
5.0%
10.0%
15.0%
20.0%
25.0%
0
500
1,000
1,500
2,000
2,500
3,000
3,500
4,000
FY 11-12 FY 12-13 FY 13-14 FY 14-15 FY 15-16 FY 16-17
Turnover of COI, COII, CSTSI
Existing New Percent of New Employees
20-Dec-2017 34 DOC-brf

the first year of service). In order to keep staff past the seventh year of service, the plan includes a larger increase in step year ten to provide employees with an incentive to stay. Annual leave and sick leave allowances increase in service years eleven and sixteen. The following table summarizes the steps by correctional officer classifications.
STEP PLAN STEPS
STEP PERCENT
INCREASE
CORRECTIONAL OFFICER I CORRECTIONAL OFFICER II CORRECTIONAL SUPPORT
TRADES SUPERVISOR 1
MONTHLY ANNUAL MONTHLY ANNUAL MONTHLY ANNUAL
Base $3,448 $41,376 $4,031 $41,376 $4,031 $41,376
1 5.0% 3,620 43,440 4,233 50,796 4,233 50,796
2 4.8% 3,794 45,528 4,436 53,232 4,436 53,232
3 4.4% 3,961 47,532 4,631 55,572 4,631 55,572
4 3.8% 4,112 49,344 4,807 57,684 4,807 57,684
5 3.4% 4,252 51,024 4,970 59,640 4,970 59,640
6 3.0% 4,380 52,560 5,119 61,428 5,119 61,428
7 1.5% 4,446 53,352 5,196 62,352 5,196 62,352
8 1.5% 4,513 54,156 5,274 63,288 5,274 63,288
9 1.5% 4,581 54,972 5,353 64,236 5,353 64,236
10 5.0% 4,810 57,720 5,621 67,452 5,621 67,452
Similar to how the Department of Human Services implemented the pay increases for nurses, employees would need to have a rating of 2 or 3 on the most recent performance evaluation to be eligible to progress to the next step. The final detail to the step plan is how to ensure that new employees are not paid above current employees with more experience. The proposed plan has the following two components to address new and current staff. COMPONENT 1 The step plan as shown in the above table would apply to all staff hired starting July 1, 2017 and going forward. This would affect the new staff approved through the September 2017 interim supplemental. Staff in this category would move through the steps and, if they do not promote to a higher classification, would max out after step year ten. COMPONENT 2 For all existing staff (hire on or before June 30, 2017), there would need to be salary adjustments to ensure new employees are not paid above current employees. This component has at least two options for how to implement. Implementing a step plan without moving existing staff to steps would create inequities and could lead to a higher turnover rate. See slide 19 for a graphical illustration of how option 1 and option 2 work. The following table summarizes the total cost to implement the step plan.
STEP PLAN TOTAL COST Correctional Officer I
Option 1 $14,918,537
Option 2 $8,075,582
Correctional Officer II
Option 1 $5,130,186
Option 2 $2,113,199
Correctional Support Trades Supervisor
Option 1 $5,129,237
Option 2 $2,882,137
Total Cost
Option 1 $25,177,959
Option 2 $13,070,918
20-Dec-2017 35 DOC-brf

Option 1 – All In Option 1 would jump all employees within each of the classifications to the step equaling their years of service. JBC staff recommends the step plan be funded at the option 1 level because it eliminates any future compression issues and ensures all employees within these classifications are treated equally. Option 2 – Double Step Jumps This option would group two years of employees together for each jump. The issue with this option is that it could create issues with staff hired in the first year being paid the same as those in the second year (i.e. an employee is hired in July 2015 would be moved to the same step as an employee hired June 2017). Based on the current compensation data there is little (as little as $30 per month) difference in the average salary of employees hired in one fiscal year compared to the next.
SUMMARY OF IMPLEMENTATION - CORRECTIONAL OFFICER I The minimum requirements to be a Correctional Officers I is a high school diploma or General Education Diploma. Correctional Officer Is maintain public safety and security of facility and work sites through various housing and security duties. Appendix F includes additional details on the duties of a Correctional Officer I. CORRECTIONAL OFFICER I TURNOVER The following graphic shows the turnover percentage for Correctional Officer Is over the past five years. Part of the reason for the increased turnover is once the officer obtains two or more years of experience, they leave for a county deputy sheriff position with better pay and benefits.
0.0%
5.0%
10.0%
15.0%
20.0%
25.0%
0
500
1,000
1,500
2,000
2,500
FY 11-12 FY 12-13 FY 13-14 FY 14-15 FY 15-16 FY 16-17
New
Em
plo
yees
as
Per
cen
t o
f T
ota
l E
mp
loye
es
Num
ber
of
Em
plo
yees
Correctional Officer I - New, Total, and New as Percent of Total
COI New COI New COI Percent of Total
20-Dec-2017 36 DOC-brf

PROPOSE CORRECTIONAL OFFICER I STEP PLAN The following table summarizes the monthly and annual changes for an employee within the Correctional Office I classification.
COI STEP PLAN
STEP PERCENT
INCREASE MONTHLY SALARY ANNUAL SALARY
Base $3,448 $41,376
1 5.0% 3,620 43,440
2 4.8% 3,794 45,528
3 4.4% 3,961 47,532
4 3.8% 4,112 49,344
5 3.4% 4,252 51,024
6 3.0% 4,380 52,560
7 1.5% 4,446 53,352
8 1.5% 4,513 54,156
9 1.5% 4,581 54,972
10 5.0% 4,810 57,720
The range for a Correctional Officer I is $3,448 per month to a maximum of $5,123 per month. As shown in the above table the steps do not move a Correctional Officer I to the range maximum. Salary data from the Department demonstrates that employees with more than ten years of experience are approximately $1,000 per month below the range maximum. ESTIMATED COST TO IMPLEMENT STEP PLAN FOR CORRECTIONAL OFFICER I Based on the average salary of existing Correctional Officer Is, the following table summarizes the JBC staff estimated cost to move existing Correctional Officer Is to the step plan.
CORRECTIONAL OFFICER I STEP PLAN OPTION COSTS
SALARY AED/SAED/STD TOTAL COST
Option 1 $13,385,856 $1,532,681 $14,918,537
Option 2 7,245,924 829,658 8,075,582
SUMMARY OF IMPLEMENTATION - CORRECTIONAL OFFICER II The minimum requirements to be a Correctional Officers II is a high school diploma or General Education Diploma and two years of experience. Correctional Officer IIs are first line supervisors of Correctional Officer Is and hold the title of Sergeant. Appendix F includes additional details on the duties of a Correctional Officer II. CORRECTIONAL OFFICER II TURNOVER The following graphic shows the turnover percentage for Correctional Officer IIs over the past five years. Part of the reason for the turnover is lack of progression through the pay range at a rate similar to counterparts in other law enforcement agencies. This lack of progression means employees will leave for a county deputy sheriff position that can pay upwards of $8,000 more per year.
20-Dec-2017 37 DOC-brf

PROPOSE CORRECTIONAL OFFICER II STEP PLAN The following table summarizes the monthly and annual changes for an officer within the Correctional Officer II classification.
CORRECTIONAL OFFICER II STEP PLAN
STEP PERCENT
INCREASE MONTHLY
SALARY ANNUAL
SALARY
Base $4,031 $41,376
1 5.0% 4,233 50,796
2 4.8% 4,436 53,232
3 4.4% 4,631 55,572
4 3.8% 4,807 57,684
5 3.4% 4,970 59,640
6 3.0% 5,119 61,428
7 1.5% 5,196 62,352
8 1.5% 5,274 63,288
9 1.5% 5,353 64,236
10 5.0% 5,621 67,452
The range for a Correctional Officer II is $3,800 per month to $5,649 per month. As shown in the above table the steps do not move a Correctional Officer II to the range maximum. Salary data from the Department indicates that even with ten or more years of experience there is no Correctional Office II within $500 per month of the range maximum. Salary data from the Department demonstrates that all Correctional Officer IIs make at least $4,096 on average a month, therefore the step plan moves the base to the midpoint of the range. This is designed to ensure no new Correctional Officer II is paid less than a Correctional Office I and is paid similarly, to how other Correctional Officer IIs are paid.
0.0%
1.0%
2.0%
3.0%
4.0%
5.0%
6.0%
0
500
1,000
1,500
2,000
2,500
FY 11-12 FY 12-13 FY 13-14 FY 14-15 FY 15-16 FY 16-17
New
Em
plo
yees
as
Per
cen
t o
f T
ota
l E
mp
loye
es
Num
ber
of
Em
plo
yees
Correctional Officer II - New, Total, and New as Percent of Total
Existing COII New COII New COII Percent of Total
20-Dec-2017 38 DOC-brf

ESTIMATED COST TO IMPLEMENT STEP PLAN FOR CORRECTIONAL OFFICER II Based on the average salary of existing Correctional Officer IIs, the following table summarizes the JBC staff estimated cost to move existing Correctional Officer IIs to the step plan.
CORRECTIONAL OFFICER II STEP PLAN OPTION COSTS
SALARY AED/SAED/STD TOTAL COST
Option 1 $4,603,128 $527,058 $5,130,186
Option 2 1,896,096 217,103 2,113,199
SUMMARY OF IMPLEMENTATION - CORRECTIONAL SUPPORT TRADES SUPERVISOR I The minimum requirements to be a Correctional Support Trades Supervisor I is a high school diploma or General Education Diploma and four years of experience. The Correctional Support Trades Supervisor I (CSTS I) works in several different areas that are responsible for facility or industry operations, including Food Service, Laundry, Maintenance, Warehouse Operations, and Correctional Industries. They hold the title of Sergeant. CORRECTIONAL SUPPORT TRADES SUPERVISOR I TURNOVER The following graphic shows for the turnover percentage for Correctional Support Trades Supervisor Is over the past five years. Part of the reason for the turnover is lack of progression through the pay range at a rate similar to counterparts in other law enforcement agencies. This lack of progression means employees will leave for a county deputy sheriff position that can pay upwards of $8,000 per year more.
0.0%
0.5%
1.0%
1.5%
2.0%
2.5%
3.0%
3.5%
0
500
1,000
1,500
2,000
2,500
FY 11-12 FY 12-13 FY 13-14 FY 14-15 FY 15-16 FY 16-17
New
Em
plo
yees
as
Per
cen
t o
f T
ota
l E
mp
loye
es
Num
ber
of
Em
plo
yees
Correctional Support Trades Supervisor I - New, Total and New as Percent of Total
CO1 New CSTSI New CSTSI as Percent of Total
20-Dec-2017 39 DOC-brf

PROPOSE CORRECTIONAL SUPPORT TRADES SUPERVISOR I STEP PLAN The following table summarizes the monthly and annual changes for an employee within the Correctional Support Trades Supervision I classification.
CORRECTIONAL SUPPORT TRADES SUPERVISOR I
STEP PLAN
STEP PERCENT
INCREASE MONTHLY
SALARY ANNUAL
SALARY
Base $4,031 $41,376
1 5.0% 4,233 50,796
2 4.8% 4,436 53,232
3 4.4% 4,631 55,572
4 3.8% 4,807 57,684
5 3.4% 4,970 59,640
6 3.0% 5,119 61,428
7 1.5% 5,196 62,352
8 1.5% 5,274 63,288
9 1.5% 5,353 64,236
10 5.0% 5,621 67,452
Since the Correctional Support Trades Supervisor I and Correctional Officer II are both considered sergeants, the pay ranges are the same. The range for a Correctional Support Trades Supervisor I is $3,800 per month to a maximum of $5,649 per month. As shown in the above table, the steps do not move a Correctional Support Trades Supervisor I to the range maximum. Salary data from the Department indicates that even with ten or more years of experience, Correctional Support Trades Supervisor Is are at least $500 below the range maximum. In order to maintain equity between classifications and department ranks, the step plan moves the base to the midpoint of the range, same as the Correctional Officer II.
ESTIMATED COST TO IMPLEMENT STEP PLAN FOR CORRECTIONAL SUPPORT TRADES SUPERVISOR I Based on the average salary of existing Correctional Support Trades Supervisor I, the following table summarizes the JBC staff estimated cost to move existing Correctional Officer Is to the step plan.
CORRECTIONAL SUPPORT TRADES SUPERVISOR I STEP PLAN COSTS
SALARY AED/SAED/STD TOTAL COST
Option 1 $4,602,276 $526,961 $5,129,237
Option 2 2,586,036 296,101 2,882,137
FUTURE STEPS Staff recommends the Department discuss at the hearing which classifications should be included in the step plan in future years. Staff at this time does not have enough information to determine whether or not having higher level correctional officers in a step would improve employee morale issues or retention issues.
20-Dec-2017 40 DOC-brf

ISSUE #4 HEPATITIS C TREATMENT (R3) The Department has requested $16.5 million General Fund to treat an additional 632 offenders infected with Hepatitis C. If this request is approved, the Department will have $20,514,144 General Fund to treat 784 total offenders with Hepatitis C. The Department is being sued by the American Civil Liberties Union for failure to treat all offenders with Hepatitis C. The lawsuit seeks to obtain treatment for all offenders with Hepatitis C. There are currently thirteen other states that have been, or are being, sued for failure to treat offenders with Hepatitis C.
SUMMARY
The Department was appropriated $4.0 million General Fund to treat approximately 75 offenders with Hepatitis C in FY 2017-18. The Department has requested an additional $16.5 million to treat an additional 632 offenders in FY 2018-19. If the Department’s request is approved a total of $20.5 million General Fund would be appropriated to treat approximately 784 offenders.
Currently there are thirteen other states in addition to Colorado being sued for failure to treat offenders with Hepatitis C. The lawsuits are similar and seek to require the state to provide treatment to all offenders in prison with Hepatitis C.
The 1974 Supreme Court decision in the Estelle v. Gamble affirmed offenders’ entitlement to adequate medical care under the U.S. Constitution’s Eight Amendment.
The Department’s cost for Hepatitis C treatment drugs is determined by the drug manufacturer contract, which does not include discounted prices or rebates due to the complicated negotiation process. The average cost for Hepatitis C treatment drugs is $26,166 per offender.
RECOMMENDATION This is an informational issue and there is no staff recommendation at this time.
DISCUSSION This issue will cover the following topics:
The Department’s current and FY 2018-19 funding request for Hepatitis C treatment drugs;
Similar lawsuits related to Hepatitis C treatment for offenders.
What other states have done about Hepatitis C treatment and associated costs.
HISTORICAL AND CURRENT HEPATITIS C TREATMENT DRUGS Hepatitis C is a virus transmitted by contact with the blood of an infected person, most commonly through intravenous drug use. It can also be transmitted through tattooing with shared equipment that is not sterilized. The Department tests inmates for Hepatitis C with a blood test when they arrive at the Denver Reception and Diagnostic Center. Offenders may decline to be tested, and if they do, they are strongly encouraged to participate. Currently there are 2,242 offenders infected with Hepatitis C.
20-Dec-2017 41 DOC-brf

From FY 2014-17 through FY 2016-17 the Department treated approximately 32 offenders per year for Hepatitis C at a cost of $2.0 million General Fund. The Department would identify the sickest offenders and select them for treatment. In FY 2017-18 the appropriation for Hepatitis C treatment was increased to $4.0 million General Fund. The expectation was that approximately 75 offenders per year would be treated for Hepatitis C.
THE DEPARTMENT’S FY 2018-19 R3 HEPATITIS C The Department requests an increase of $16,514,144 General Fund to treat an additional 632 offenders with Hepatitis C per year. The average treatment cost cited in the request is $26,166 per offender. The Department’s request cites the pending lawsuit filed against the Department by the American Civil Liberties Union. The lawsuit complaints states, “there is no medical justification for the CDOC’s decision to withhold a life-saving cure from the thousands of prisoners living with chronic HCV. The inability of the Department to treat all offenders diagnosed with HCV is based on available funding.” The request does not directly say that the request is a result of the lawsuit, but by referencing the lawsuit in the problem statement leads staff to connect the lawsuit with the reason for the request. The Department uses a combination of three drugs to treatment offenders with Hepatitis C. The Department has a single line item appropriation for all drugs. The line item is titled Purchase of Pharmaceuticals and there is not a separate appropriation for Hepatitis C drugs. Federal regulations prohibit the use of Medicaid funds to pay for services rendered to individuals who are involuntarily confined to a public institution, including correctional facilities. However, there is an exception to the Medicaid funding prohibition when an inmate is admitted as an inpatient in a hospital for greater than 24 hours. Under that exception, Medicaid may pay for Medicaid covered hospital and physician services, drugs, and durable medical equipment rendered and provided during that qualifying inpatient stay12.
OTHER STATES In total thirteen states13 have lawsuits related to treatment for offenders with Hepatitis C. In 1976, the Supreme Court ruled in the Estelle v. Gamble case that all prisoners are entitled to adequate medical care. Subsequent federal rulings have established the requirement prisons provide health care in a manner that does not demonstrate “a deliberate indifference to serious medical need.”14 The Florida Department of Corrections, like the Colorado Department of Corrections, is requesting funding to treat offenders with Hepatitis C. The Florida Department of Corrections was sued in May 2017 by the Florida Justice Institute for failure to provide Hepatitis C treatment to offenders. As of October 2017, the Florida Department of Corrections is requesting $19.3 million to treat 500 offenders with Hepatitis C15. On November 17, 2017, U.S. District Court Judge Mark Walker required
12 Department of Health Care Policy and Financing FY 2018-19 hearing response provided to the Joint Budget Committee on December 14, 2017. 13 Colorado, Missouri, Tennessee, Florida, Pennsylvania, Illinois, Virginia, Arizona, Minnesota, Iowa, California, Oregon, and Washington 14 “The Current State of Public and Private Prison Health Care.” February 24, 2017. https://publicpolicy.wharton.upenn.edu/live/news/1736-the-current-state-of-public-and-private-prison#_edn4 15 “Amid Ongoing Lawsuit, Florida’s Prison Agency Asks for Millions to Treat Inmates with Hep C.” Sascha Cordner. October 25, 2017. http://news.wfsu.org/post/amid-ongoing-lawsuit-floridas-prison-agency-asks-millions-treat-inmates-hep-c
20-Dec-2017 42 DOC-brf

the Florida Department of Corrections to begin immediate treatment of offenders with Hepatitis C16. The cost of treating all offenders in Florida prisons could range from $200 million to $700 million. State prisons are omitted from many of the programs that allow federal prisons to receive discounted drugs. The negotiation process for lower prices is so complicated that only 16 states are working to receive discounts through that pathway. In the absence of help from these programs, many states are left to negotiate directly with the pharmaceutical companies, leading to wildly varying costs for the treatments. 17 The Department purchases Hepatitis C drugs through the Minnesota Multistate Contracting Alliance for Pharmacy18. The following table summarizes for the two most recent fiscal years the level of treatment that has been provided by various states to offenders with Hepatitis C19.
TREATMENT OF OFFENDERS WITH HEPATITIS C
FY 2015-16 FY 2016-17
EST. NO. OF
OFFENDERS
AVERAGE
TREATMENT
COST EST. NO. OF
OFFENDERS
AVERAGE
TREATMENT
COST
Arkansas 1,627 n/a 1,739 n/a
California 772 $74,172 1,036 $73,553
Colorado 33 $60,088 45 $52,075
Hawaii 19 $64,000 19 $64,000
Indiana 50 $30,000 50 $30,000
Iowa 16 $26,733 20 $54,455
Louisiana 29 n/a 37 $31,802
Minnesota 27 $57,624 35 $54,803
Missouri 35 n/a 38 n/a
Nevada 6 $93,799 21 $46,625
New Hampshire 5 $25,983 15 $59,554
North Carolina 158 $45,424 320 $58,445
Oregon 197 $51,416 n/a n/a
South Dakota 5 $76,727 9 $64,489
Vermont 2 $150,167 2 $101,408
Virginia 139 $47,911 138 $43,226
16 “Florida let hepatitis C go untreated in prisons. Now it may cost taxpayers millions.” Mary Ellen Klas. November 17, 2017. http://www.miamiherald.com/news/state/florida/article185341808.html 17 “Inconsistent Treatment for Prisoners with Hepatitis C Provokes Lawsuits.” Christina Mattina. October 17, 2016. http://www.ajmc.com/newsroom/inconsistent-treatment-for-prisoners-with-hepatitis-c-provokes-lawsuits 18 http://www.mmd.admin.state.mn.us/mmcap/ 19 Data provided by the National Conference on State Legislatures at the request of JBC Staff.
20-Dec-2017 43 DOC-brf

ISSUE #5 PAROLE BOARD HEARING TOPICS Each year the Committee sets aside time in the schedule for a hearing with the Parole Board. This issue provides a summary of topics the Committee may wish to discuss with the Parole Board during their hearing.
SUMMARY
The Parole Board is comprised of seven members, appointed by the Governor, and confirmed by the Senate for three-year terms. The Parole Board is charged with evaluating an inmate’s ability to re-integrate into society, and balancing that ability against the need to ensure public safety.
The Parole Board has voiced numerous concerns with reentry services provided by the Department of Corrections to offenders preparing to exit prison. The Parole Board also expressed concerns with the quality of data provided to Parole Board Members that is used to inform parole decisions.
The General Assembly will consider legislation during the 2018 session that directly affects parole and the Parole Board. Obtaining feedback from the Parole Board on the legislation, and on the larger question of what role the Parole Board can and should play in the Colorado correctional system, would benefit the Committee and General Assembly as they consider legislation.
RECOMMENDATION: Staff recommends the Parole Board discuss the following two topics during their hearing with the Committee: 1 What is the biggest challenge the Parole Board faces in the upcoming fiscal year?
2 What are possible solutions to the concerns about reentry and data quality that have been raised
by the Parole Board?
DISCUSSION
WHAT IS THE PAROLE BOARD There are seven members of the Parole Board. Members are appointed by the Government and confirmed by the Senate for three-year terms. Members must have knowledge about parole, rehabilitation, correctional administration, and how the criminal justice system functions. Members must have at least five years of education and/or experience. Of the seven members: two are from law enforcement; one is a former parole or probation officer; and four are citizen representatives. The Parole Board is charged with evaluating an inmate’s ability to re-integrate into society and balancing that ability against the need to ensure public safety. The Parole Board accomplishes this through discretional and mandatory parole releases.
20-Dec-2017 44 DOC-brf

TYPES OF PAROLE DATES The parole eligibility date (PED) is the first date an offender is eligible to see the Parole Board. The Parole Board generally conducts initial Parole Application Hearings approximately three months prior to an offender’s PED. If an offender is deferred at the time of the application hearing (i.e. not given a discretionary release), they are typically seen by the Board one year from the time of the deferral action.20 Any discretionary release of an inmate that has been convicted of a violent or sexual crime is required to be reviewed by the Full Board. An offender seen by the Full Board requires at least four affirmative votes to be released discretionarily. The Parole Board sits as a Full Board at least once a week.21
CHALLENGES FACING THE PAROLE BOARD JBC staff inquired about any challenges the Parole Board is experiencing. The following is a snap shot of the issues identified by the Parole Board. The Committee may want to discuss with the Parole Board the challenges they experience and possible solutions.
Individuals are not getting the treatment they need prior to leaving the facilities. Offenders seen by the Parole Board can have significant criminogenic needs that require intervention but remain untreated in prison.
Inconsistencies with parole holding hold parolees accountable to stay in programs while on parole.
The Parole Board has experienced numerous hearings with offenders who are at facilities which lack the services offenders require based on their criminogenic needs and intervention requirements. For instance, it is a common occurrence to conduct hearings with inmates at Level I facilities such as Delta, Skyline, Rifle, Camp George West, etc. who have a high levels of criminogenic need, however there is no access to any treatment because of where they are located.
A lack of programs to address domestic violence while in prison despite a need for these programs. The Parole Board also expressed concerns about the offender data they are provided which is used to inform parole decisions. Information lacking from data provided to the Parole Board includes the amount and effectiveness of treatment, community correction referrals and refusals, parole plan details, and recent Code of Penal Discipline (COPDs) violation. The Parole Board, in the current structure of the Colorado correctional system, plays a critical role in determining what offenders are appropriate for release to parole and/or community corrections. The General Assembly has recently, and will again in 2018, consider legislation that would have a significant impact on the Parole Board. Obtaining feedback from the Parole Board on the legislation and on the larger question of what role the Parole Board can and should play in the Colorado correctional system, would benefit the Committee and General Assembly as they consider legislation.
20 https://www.colorado.gov/pacific/sites/default/files/01-17_Joint%20Budget%20Committee.pdf Page 11 21 https://www.colorado.gov/pacific/sites/default/files/01-17_Joint%20Budget%20Committee.pdf Page 13
20-Dec-2017 45 DOC-brf

Appendix A: Number Pages
FY 2015-16Actual
FY 2016-17Actual
FY 2017-18Appropriation
FY 2018-19Request
Request vs.Appropriation
DEPARTMENT OF CORRECTIONSRick Raemisch, Executive Director
(1) MANAGEMENTPrimary Functions: Central management, appropriations for private prisons, and the Inspector General's Office.
(A) Executive Director's Office, SubprogramPrimary Function: Provide oversight and develop policies for the entire Department.
Personal Services 1,820,825 3,409,527 3,443,975 3,500,244FTE 29.0 28.5 26.8 26.8
General Fund 1,586,735 3,185,281 3,200,170 3,256,439Reappropriated Funds 134,601 224,246 243,805 243,805Federal Funds 99,489 0 0 0
Restorative Justice Program with Victim-OffenderDialogues in Department Facilities 75,000 74,998 75,000 75,000
FTE 0.0 1.2 1.2 1.2General Fund 75,000 74,998 75,000 75,000
Health, Life, and Dental 51,579,140 50,481,587 54,108,968 55,632,838 *General Fund 50,015,018 48,999,350 52,536,256 53,949,754Cash Funds 1,564,122 1,482,237 1,572,712 1,683,084
Short-term Disability 733,991 617,301 628,089 561,589 *General Fund 711,870 598,986 610,911 545,394Cash Funds 22,121 18,315 17,178 16,195
20-Dec-2017 46 DOC-brf

Appendix A: Number Pages
FY 2015-16Actual
FY 2016-17Actual
FY 2017-18Appropriation
FY 2018-19Request
Request vs.Appropriation
S.B. 04-257 Amortization Equalization Disbursement 15,015,963 15,955,728 16,892,514 16,893,069 *General Fund 14,570,654 15,491,590 16,439,123 16,414,013Cash Funds 445,309 464,138 453,391 479,056
S.B. 06-235 Supplemental Amortization EqualizationDisbursement 14,498,673 15,789,522 16,892,514 16,893,069 *
General Fund 14,068,545 15,330,219 16,439,123 16,414,013Cash Funds 430,128 459,303 453,391 479,056
Salary Survey 2,016,911 583,577 6,294,313 10,825,001General Fund 1,906,474 580,443 6,122,116 10,516,363Cash Funds 110,437 3,134 172,197 308,638
Merit Pay 3,485,908 0 2,777,553 0General Fund 3,384,324 0 2,711,425 0Cash Funds 101,584 0 66,128 0
Shift Differential 7,687,883 7,940,718 8,125,195 8,172,797 *General Fund 7,648,987 7,906,423 8,085,286 8,116,484Cash Funds 38,896 34,295 39,909 56,313
Workers' Compensation 8,583,237 7,886,908 6,857,483 7,417,013General Fund 8,312,007 7,637,682 6,640,787 7,182,636Cash Funds 271,230 249,226 216,696 234,377
Operating Expenses 326,684 344,445 357,759 357,759General Fund 267,753 267,759 267,759 267,759Reappropriated Funds 5,000 5,000 5,000 5,000Federal Funds 53,931 71,686 85,000 85,000
20-Dec-2017 47 DOC-brf

Appendix A: Number Pages
FY 2015-16Actual
FY 2016-17Actual
FY 2017-18Appropriation
FY 2018-19Request
Request vs.Appropriation
Legal Services 1,752,463 1,824,116 1,890,448 2,078,945General Fund 1,748,419 1,820,503 1,826,938 2,009,026Cash Funds 4,044 3,613 63,510 69,919
Payment to Risk Management and Property Funds 4,203,591 4,241,910 5,020,275 3,986,560 *General Fund 4,037,970 4,074,779 4,822,476 3,829,489Cash Funds 165,621 167,131 197,799 157,071
Leased Space 4,116,123 4,491,661 4,841,708 4,993,564General Fund 3,882,449 4,240,493 4,572,941 4,713,907Cash Funds 233,674 251,168 268,767 279,657
Capitol Complex Leased Space 56,300 58,367 63,551 57,606General Fund 40,218 41,695 45,398 41,151Cash Funds 16,082 16,672 18,153 16,455
Planning and Analysis Contracts 82,410 82,410 82,410 82,410General Fund 82,410 82,410 82,410 82,410
Payments to District Attorneys 427,726 469,979 681,102 681,102General Fund 427,726 469,979 681,102 681,102
Payments to Coroners 0 32,175 32,175 32,175FTE 0.0 0.0 0.0 0.0
General Fund 0 32,175 32,175 32,175
Clinical Employee Bonuses 0 0 0 0General Fund 0 0 0 0
20-Dec-2017 48 DOC-brf

Appendix A: Number Pages
FY 2015-16Actual
FY 2016-17Actual
FY 2017-18Appropriation
FY 2018-19Request
Request vs.Appropriation
Start-up Costs 0 0 0 0General Fund 0 0 0 0
SUBTOTAL - (A) Executive Director's Office,Subprogram 116,462,828 114,284,929 129,065,032 132,240,741 2.5%
FTE 29.0 29.7 28.0 28.0 (0.0%)General Fund 112,766,559 110,834,765 125,191,396 128,127,115 2.3%Cash Funds 3,403,248 3,149,232 3,539,831 3,779,821 6.8%Reappropriated Funds 139,601 229,246 248,805 248,805 0.0%Federal Funds 153,420 71,686 85,000 85,000 0.0%
(B) External Capacity SubprogramPrimary Function: Oversee and fund private prisons(1) Private Prison Monitoring Unit
Personal Services 1,075,564 1,058,680 1,090,250 1,116,234FTE 14.1 15.7 15.7 15.7
General Fund 1,075,564 1,058,680 1,090,250 1,116,234
Operating Expenses 196,291 183,969 213,443 213,443General Fund 183,974 183,969 183,976 183,976Cash Funds 12,317 0 29,467 29,467
SUBTOTAL - 1,271,855 1,242,649 1,303,693 1,329,677 2.0%FTE 14.1 15.7 15.7 15.7 0.0%
General Fund 1,259,538 1,242,649 1,274,226 1,300,210 2.0%Cash Funds 12,317 0 29,467 29,467 0.0%
20-Dec-2017 49 DOC-brf

Appendix A: Number Pages
FY 2015-16Actual
FY 2016-17Actual
FY 2017-18Appropriation
FY 2018-19Request
Request vs.Appropriation
(2) Payments to House State PrisonersPayments to local jails 11,120,578 14,094,232 15,047,289 15,475,695 *
General Fund 11,120,578 14,094,232 15,047,289 15,475,695
Payments to in-state private prisons 65,036,792 59,925,149 59,054,933 65,491,520 *General Fund 65,036,746 55,364,356 56,977,213 63,413,800Cash Funds 46 4,560,793 2,077,720 2,077,720
Payments to pre-release parole revocation facilities 11,150,004 12,471,659 10,659,198 12,009,710 *General Fund 11,150,004 12,471,659 10,659,198 12,009,710
Payments to Community Return to Custody Facilities 3,045,400 2,038,156 465,372 0General Fund 3,045,400 2,038,156 465,372 0
Inmate Education and Benefit Programs at In-state PrivatePrisons 534,079 534,079 541,566 541,566
General Fund 534,079 534,079 541,566 541,566
Inmate Education and Benefit Programs at Pre-releaseParole Revocation Facilities 119,476 119,476 121,151 121,151
General Fund 119,476 119,476 121,151 121,151
External Capacity Sustainability 0 0 0 0General Fund 0 0 0 0
SUBTOTAL - 91,006,329 89,182,751 85,889,509 93,639,642 9.0%FTE 0.0 0.0 0.0 0.0 0.0%
General Fund 91,006,283 84,621,958 83,811,789 91,561,922 9.2%Cash Funds 46 4,560,793 2,077,720 2,077,720 0.0%
20-Dec-2017 50 DOC-brf

Appendix A: Number Pages
FY 2015-16Actual
FY 2016-17Actual
FY 2017-18Appropriation
FY 2018-19Request
Request vs.Appropriation
SUBTOTAL - (B) External Capacity Subprogram 92,278,184 90,425,400 87,193,202 94,969,319 8.9%FTE 14.1 15.7 15.7 15.7 0.0%
General Fund 92,265,821 85,864,607 85,086,015 92,862,132 9.1%Cash Funds 12,363 4,560,793 2,107,187 2,107,187 0.0%
(C) Inspector General SubprogramPrimary Function: Investigate crimes within the prison system.
Personal Services 3,860,552 4,004,198 4,145,719 4,241,991FTE 47.2 0.0 48.2 48.2
General Fund 3,860,552 4,004,198 4,039,486 4,135,758Cash Funds 0 0 106,233 106,233
Operating Expenses 357,847 370,261 428,866 428,398 *General Fund 345,530 370,261 345,679 345,211Cash Funds 12,317 0 83,187 83,187
Inspector General Grants 207,222 64,636 207,912 207,912FTE 0.0 0.0 0.0 0.0
Reappropriated Funds 0 0 0 0Federal Funds 207,222 64,636 207,912 207,912
SUBTOTAL - (C) Inspector General Subprogram 4,425,621 4,439,095 4,782,497 4,878,301 2.0%FTE 47.2 0.0 48.2 48.2 0.0%
General Fund 4,206,082 4,374,459 4,385,165 4,480,969 2.2%Cash Funds 12,317 0 189,420 189,420 0.0%Reappropriated Funds 0 0 0 0 0.0%Federal Funds 207,222 64,636 207,912 207,912 0.0%
20-Dec-2017 51 DOC-brf

Appendix A: Number Pages
FY 2015-16Actual
FY 2016-17Actual
FY 2017-18Appropriation
FY 2018-19Request
Request vs.Appropriation
TOTAL - (1) Management 213,166,633 209,149,424 221,040,731 232,088,361 5.0%FTE 90.3 45.4 91.9 91.9 (0.0%)
General Fund 209,238,462 201,073,831 214,662,576 225,470,216 5.0%Cash Funds 3,427,928 7,710,025 5,836,438 6,076,428 4.1%Reappropriated Funds 139,601 229,246 248,805 248,805 0.0%Federal Funds 360,642 136,322 292,912 292,912 0.0%
20-Dec-2017 52 DOC-brf

Appendix A: Number Pages
FY 2015-16Actual
FY 2016-17Actual
FY 2017-18Appropriation
FY 2018-19Request
Request vs.Appropriation
(2) INSTITUTIONSent, mental health, inmate pay, legal resources for inmates, and capital lease purchase payments.
(A) Utilities SubprogramPrimary Function: Provide heat, power, water, and sanitation at all facilities.
Personal Services 242,719 281,503 309,434 316,808FTE 2.7 3.0 2.6 2.6
General Fund 242,719 281,503 309,434 316,808
Utilities 21,012,799 21,936,410 22,062,941 22,062,941General Fund 19,865,260 20,691,398 20,658,871 20,658,871Cash Funds 1,147,539 1,245,012 1,404,070 1,404,070
SUBTOTAL - (A) Utilities Subprogram 21,255,518 22,217,913 22,372,375 22,379,749 0.0%FTE 2.7 3.0 2.6 2.6 0.0%
General Fund 20,107,979 20,972,901 20,968,305 20,975,679 0.0%Cash Funds 1,147,539 1,245,012 1,404,070 1,404,070 0.0%
(B) Maintenance SubprogramPrimary Functions Provide grounds and facilities maintenance, including the boiler house, janitorial services, and life safety.
Personal Services 17,983,087 19,751,802 19,673,603 20,172,962 *FTE 286.2 283.3 276.8 276.8
General Fund 17,983,087 19,751,802 19,673,603 20,172,962
Operating Expenses 5,714,042 5,714,110 7,114,522 7,114,522General Fund 5,714,042 5,714,110 7,114,522 7,114,522
20-Dec-2017 53 DOC-brf

Appendix A: Number Pages
FY 2015-16Actual
FY 2016-17Actual
FY 2017-18Appropriation
FY 2018-19Request
Request vs.Appropriation
Maintenance Pueblo Campus 1,545,553 1,545,552 2,059,181 2,059,181General Fund 1,545,553 1,545,552 2,059,181 2,059,181
Start-up Costs 0 0 0 0General Fund 0 0 0 0
Maintenance Grants 0 0 0 0General Fund 0 0 0 0
SUBTOTAL - (B) Maintenance Subprogram 25,242,682 27,011,464 28,847,306 29,346,665 1.7%FTE 286.2 283.3 276.8 276.8 0.0%
General Fund 25,242,682 27,011,464 28,847,306 29,346,665 1.7%
(C) Housing and Security SubprogramPrimary Function: Provide inmate supervision, including the implementation and management of security operations.
Personal Services 168,351,679 167,393,010 167,498,055 173,461,380 *FTE 2,996.9 2,990.3 2,974.4 2,974.4
General Fund 168,351,679 167,390,063 167,495,108 173,458,433Cash Funds 0 2,947 2,947 2,947
Operating Expenses 1,808,935 1,808,940 1,848,941 1,848,941General Fund 1,808,935 1,808,940 1,848,941 1,848,941
Start-up Costs 0 0 0 0General Fund 0 0 0 0
20-Dec-2017 54 DOC-brf

Appendix A: Number Pages
FY 2015-16Actual
FY 2016-17Actual
FY 2017-18Appropriation
FY 2018-19Request
Request vs.Appropriation
SUBTOTAL - (C) Housing and Security Subprogram 170,160,614 169,201,950 169,346,996 175,310,321 3.5%FTE 2,996.9 2,990.3 2,974.4 2,974.4 0.0%
General Fund 170,160,614 169,199,003 169,344,049 175,307,374 3.5%Cash Funds 0 2,947 2,947 2,947 0.0%
(D) Food Service SubprogramPrimary Function: Provide three meals daily to all inmates.
Personal Services 17,896,616 17,825,748 17,812,705 18,403,482 *FTE 315.1 328.7 317.8 317.8
General Fund 17,896,616 17,825,748 17,812,705 18,403,482
Operating Expenses 16,646,929 17,010,023 17,804,557 17,804,557General Fund 16,646,929 16,930,023 17,804,557 17,804,557Federal Funds 0 80,000 0 0
Food Service Pueblo Campus 1,719,343 1,792,915 1,827,855 2,000,369 *General Fund 1,719,343 1,792,915 1,827,855 2,000,369
SUBTOTAL - (D) Food Service Subprogram 36,262,888 36,628,686 37,445,117 38,208,408 2.0%FTE 315.1 328.7 317.8 317.8 0.0%
General Fund 36,262,888 36,548,686 37,445,117 38,208,408 2.0%Federal Funds 0 80,000 0 0 0.0%
20-Dec-2017 55 DOC-brf

Appendix A: Number Pages
FY 2015-16Actual
FY 2016-17Actual
FY 2017-18Appropriation
FY 2018-19Request
Request vs.Appropriation
(E) Medical Services SubprogramPrimary Function: Provide acute and long-term health care services for all inmates, using both state employees and contracted health care providers.
Personal Services 31,116,755 31,902,960 32,101,298 33,180,749 *FTE 370.0 387.5 387.5 387.5
General Fund 30,962,247 31,664,577 31,862,915 32,942,366Cash Funds 154,508 238,383 238,383 238,383
Operating Expenses 2,579,052 2,579,051 2,579,052 2,579,052General Fund 2,579,052 2,579,051 2,579,052 2,579,052
Purchase of Pharmaceuticals 14,681,545 15,156,481 18,227,911 35,320,005 *General Fund 14,681,545 15,156,481 18,227,911 35,320,005
Purchase of Medical Services from Other Medical Facilities 22,140,857 23,737,167 23,926,924 24,996,562 *General Fund 22,140,857 23,737,167 23,926,924 24,996,562
Service Contracts 2,417,890 2,490,075 2,524,981 2,550,231 *General Fund 2,417,890 2,490,075 2,524,981 2,550,231
Indirect Cost Assessment 0 1,835 730 1,522General Fund 0 0 0 0Cash Funds 0 1,835 730 1,522
Catastrophic Medical Expenses 0 0 0 0General Fund 0 0 0 0
20-Dec-2017 56 DOC-brf

Appendix A: Number Pages
FY 2015-16Actual
FY 2016-17Actual
FY 2017-18Appropriation
FY 2018-19Request
Request vs.Appropriation
SUBTOTAL - (E) Medical Services Subprogram 72,936,099 75,867,569 79,360,896 98,628,121 24.3%FTE 370.0 387.5 387.5 387.5 0.0%
General Fund 72,781,591 75,627,351 79,121,783 98,388,216 24.4%Cash Funds 154,508 240,218 239,113 239,905 0.3%
(F) Laundry SubprogramPrimary Function: Issue, clean, and maintain all inmate clothing, bedding, coats, and footwear.
Personal Services 2,128,016 2,223,488 2,343,112 2,411,144 *FTE 35.3 35.2 37.4 37.4
General Fund 2,128,016 2,223,488 2,343,112 2,411,144
Operating Expenses 2,197,539 2,197,542 2,197,545 2,197,545General Fund 2,197,539 2,197,542 2,197,545 2,197,545
SUBTOTAL - (F) Laundry Subprogram 4,325,555 4,421,030 4,540,657 4,608,689 1.5%FTE 35.3 35.2 37.4 37.4 0.0%
General Fund 4,325,555 4,421,030 4,540,657 4,608,689 1.5%
(G) Superintendents SubprogramPrimary Function: Develop facility policies, procedures, and practices that conform with applicable laws, consent decrees, court orders, legislative mandates, and executiveorders.
Personal Services 10,521,900 10,915,180 11,059,874 11,323,461FTE 160.5 162.7 156.9 156.9
General Fund 10,521,900 10,915,180 11,059,874 11,323,461
Operating Expenses 5,181,501 5,186,951 5,202,001 17,177,333 *General Fund 5,181,501 5,186,951 5,202,001 17,177,333
20-Dec-2017 57 DOC-brf

Appendix A: Number Pages
FY 2015-16Actual
FY 2016-17Actual
FY 2017-18Appropriation
FY 2018-19Request
Request vs.Appropriation
Dress-Out 735,432 735,432 735,433 735,433General Fund 735,432 735,432 735,433 735,433
Start-up Costs 38,830 45,328 7,800 0General Fund 38,830 45,328 7,800 0
Superintendents Grants 0 0 0 0General Fund 0 0 0 0Cash Funds 0 0 0 0
SUBTOTAL - (G) Superintendents Subprogram 16,477,663 16,882,891 17,005,108 29,236,227 71.9%FTE 160.5 162.7 156.9 156.9 (0.0%)
General Fund 16,477,663 16,882,891 17,005,108 29,236,227 71.9%Cash Funds 0 0 0 0 0.0%
(H) Youthful Offender System SubprogramPrimary Function: Target offenders aged 14 to 18 years at the time of offense who have committed violent class 2 to 6 felonies. All sentences are between 2 and 7 years.
Personal Services 10,399,799 10,151,332 10,109,863 10,438,919 *FTE 164.1 167.2 160.7 160.7
General Fund 10,399,799 10,151,332 10,109,863 10,438,919
Operating Expenses 604,705 604,704 604,705 604,705General Fund 604,705 604,704 604,705 604,705
Contract Services 28,820 23,350 28,820 28,820General Fund 28,820 23,350 28,820 28,820
Maintenance and Food Services 681,031 681,030 1,029,249 1,029,249General Fund 681,031 681,030 1,029,249 1,029,249
20-Dec-2017 58 DOC-brf

Appendix A: Number Pages
FY 2015-16Actual
FY 2016-17Actual
FY 2017-18Appropriation
FY 2018-19Request
Request vs.Appropriation
SUBTOTAL - (H) Youthful Offender SystemSubprogram 11,714,355 11,460,416 11,772,637 12,101,693 2.8%
FTE 164.1 167.2 160.7 160.7 0.0%General Fund 11,714,355 11,460,416 11,772,637 12,101,693 2.8%
(I) Case Management SubprogramPrimary Function: Responsible for case analysis, classification reviews, performance assessment, earned time evaluations, sentence computation, and parole preparation.
Personal Services 17,519,409 17,028,581 16,959,241 17,363,426FTE 247.8 245.8 247.3 247.3
General Fund 17,519,409 17,028,581 16,959,241 17,363,426
Operating Expenses 172,581 172,581 172,581 172,581General Fund 172,581 172,581 172,581 172,581
Offender ID Program 314,601 278,214 341,135 341,135General Fund 314,601 278,214 341,135 341,135
Start-up Costs 0 0 0 0General Fund 0 0 0 0
SUBTOTAL - (I) Case Management Subprogram 18,006,591 17,479,376 17,472,957 17,877,142 2.3%FTE 247.8 245.8 247.3 247.3 0.0%
General Fund 18,006,591 17,479,376 17,472,957 17,877,142 2.3%
20-Dec-2017 59 DOC-brf
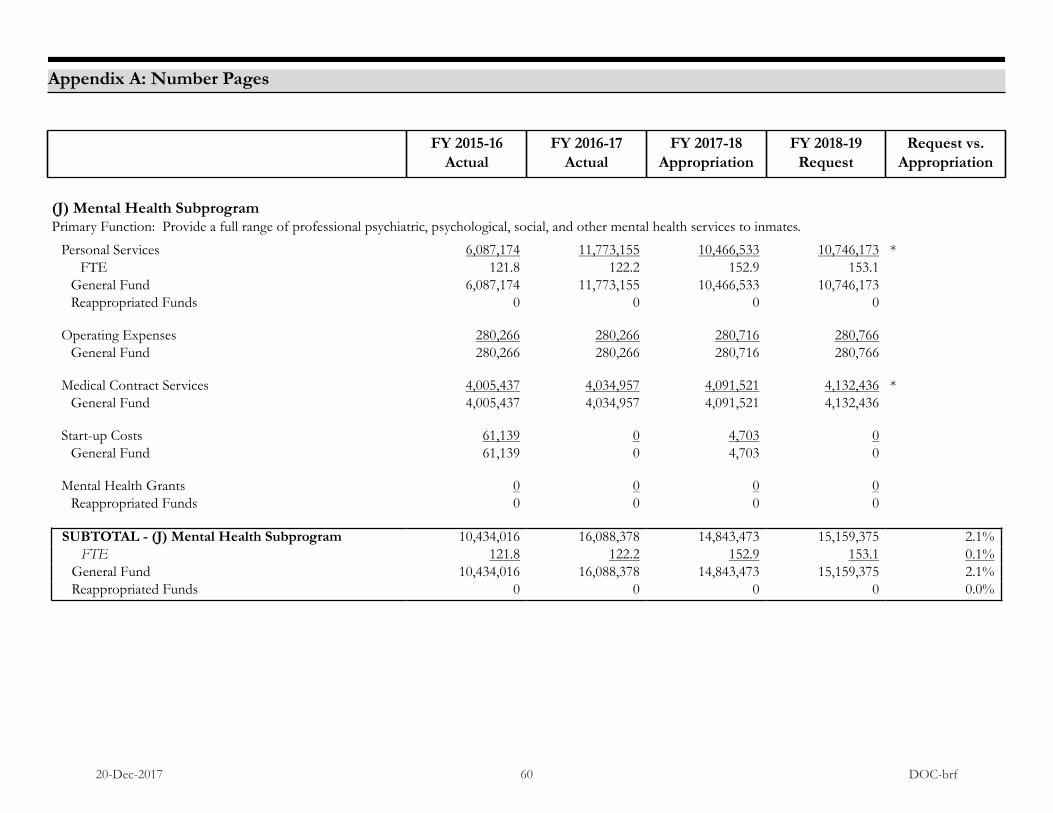
Appendix A: Number Pages
FY 2015-16Actual
FY 2016-17Actual
FY 2017-18Appropriation
FY 2018-19Request
Request vs.Appropriation
(J) Mental Health SubprogramPrimary Function: Provide a full range of professional psychiatric, psychological, social, and other mental health services to inmates.
Personal Services 6,087,174 11,773,155 10,466,533 10,746,173 *FTE 121.8 122.2 152.9 153.1
General Fund 6,087,174 11,773,155 10,466,533 10,746,173Reappropriated Funds 0 0 0 0
Operating Expenses 280,266 280,266 280,716 280,766General Fund 280,266 280,266 280,716 280,766
Medical Contract Services 4,005,437 4,034,957 4,091,521 4,132,436 *General Fund 4,005,437 4,034,957 4,091,521 4,132,436
Start-up Costs 61,139 0 4,703 0General Fund 61,139 0 4,703 0
Mental Health Grants 0 0 0 0Reappropriated Funds 0 0 0 0
SUBTOTAL - (J) Mental Health Subprogram 10,434,016 16,088,378 14,843,473 15,159,375 2.1%FTE 121.8 122.2 152.9 153.1 0.1%
General Fund 10,434,016 16,088,378 14,843,473 15,159,375 2.1%Reappropriated Funds 0 0 0 0 0.0%
20-Dec-2017 60 DOC-brf

Appendix A: Number Pages
FY 2015-16Actual
FY 2016-17Actual
FY 2017-18Appropriation
FY 2018-19Request
Request vs.Appropriation
(K) Inmate Pay Subprogram, education assignments (such as adult basic education or GED), and vocational education assignments. Health care aides are paid at higher rates. Offenders in CorrectionalIndustries are paid from a separate appropriation.
Inmate Pay 1,947,885 2,247,885 2,247,885 2,247,885General Fund 1,947,885 2,247,885 2,247,885 2,247,885
SUBTOTAL - (K) Inmate Pay Subprogram 1,947,885 2,247,885 2,247,885 2,247,885 0.0%FTE 0.0 0.0 0.0 0.0 0.0%
General Fund 1,947,885 2,247,885 2,247,885 2,247,885 0.0%
(L) Legal Access SubprogramPrimary Function: Provide inmates with resources to research and file claims with the courts.
Personal Services 1,378,570 1,369,731 1,381,191 1,414,108FTE 21.4 23.3 21.5 21.5
General Fund 1,378,570 1,369,731 1,381,191 1,414,108
Operating Expenses 299,597 299,602 299,602 299,602General Fund 299,597 299,602 299,602 299,602
Contract Services 70,905 70,905 70,905 70,905General Fund 70,905 70,905 70,905 70,905
SUBTOTAL - (L) Legal Access Subprogram 1,749,072 1,740,238 1,751,698 1,784,615 1.9%FTE 21.4 23.3 21.5 21.5 0.0%
General Fund 1,749,072 1,740,238 1,751,698 1,784,615 1.9%
20-Dec-2017 61 DOC-brf

Appendix A: Number Pages
FY 2015-16Actual
FY 2016-17Actual
FY 2017-18Appropriation
FY 2018-19Request
Request vs.Appropriation
(M) Capital Lease Purchase PaymentsPrimary Function: Fund the payments that must be made on the Certificates of Participation for Centennial South Correctional Facility (formerly called CSP II).
Lease Purchase of Colorado State Penitentiary II 20,254,768 20,258,268 20,256,546 20,255,668General Fund 20,254,768 20,258,268 20,256,546 20,255,668
SUBTOTAL - (M) Capital Lease Purchase Payments 20,254,768 20,258,268 20,256,546 20,255,668 NaNFTE 0.0 0.0 0.0 0.0 0.0%
General Fund 20,254,768 20,258,268 20,256,546 20,255,668 0.0%
TOTAL - (2) Institutions 410,767,706 421,506,064 427,263,651 467,144,558 9.3%FTE 4,721.8 4,749.2 4,735.8 4,736.0 0.0%
General Fund 409,465,659 419,937,887 425,617,521 465,497,636 9.4%Cash Funds 1,302,047 1,488,177 1,646,130 1,646,922 0.0%Reappropriated Funds 0 0 0 0 0.0%Federal Funds 0 80,000 0 0 0.0%
20-Dec-2017 62 DOC-brf

Appendix A: Number Pages
FY 2015-16Actual
FY 2016-17Actual
FY 2017-18Appropriation
FY 2018-19Request
Request vs.Appropriation
(3) SUPPORT SERVICESPrimary Functions: Contains the costs associated with the Department's support programs, including business operations, personnel, offender services, transportation,training, information services, and facility services.
(A) Business Operations SubprogramPrimary Function: Provide fiscal management and budgeting services for the Department.
Personal Services 6,043,719 6,105,068 6,192,084 6,304,815 *FTE 102.4 102.2 99.8 99.8
General Fund 5,238,206 5,227,744 4,430,488 5,160,243Cash Funds 38,991 40,297 40,297 41,897Reappropriated Funds 766,522 837,027 1,721,299 1,102,675Federal Funds 0 0 0 0
Operating Expenses 234,199 234,199 234,201 234,201General Fund 234,199 234,199 234,201 234,201
SUBTOTAL - (A) Business Operations Subprogram 6,277,918 6,339,267 6,426,285 6,539,016 1.8%FTE 102.4 102.2 99.8 99.8 (0.0%)
General Fund 5,472,405 5,461,943 4,664,689 5,394,444 15.6%Cash Funds 38,991 40,297 40,297 41,897 4.0%Reappropriated Funds 766,522 837,027 1,721,299 1,102,675 (35.9%)Federal Funds 0 0 0 0 0.0%
20-Dec-2017 63 DOC-brf

Appendix A: Number Pages
FY 2015-16Actual
FY 2016-17Actual
FY 2017-18Appropriation
FY 2018-19Request
Request vs.Appropriation
(B) Personnel SubprogramPrimary Function: Provides human resources services, including recruitment, examination, position classification, personnel records, affirmative action, appeals, grievance,and benefits administration.
Personal Services 1,255,169 1,271,310 1,368,076 1,393,681FTE 18.3 16.9 18.7 18.7
General Fund 1,255,169 1,271,310 1,368,076 1,393,681
Operating Expenses 86,925 86,927 86,931 86,931General Fund 86,925 86,927 86,931 86,931
Start-up Costs 0 0 0 0General Fund 0 0 0 0
SUBTOTAL - (B) Personnel Subprogram 1,342,094 1,358,237 1,455,007 1,480,612 1.8%FTE 18.3 16.9 18.7 18.7 0.0%
General Fund 1,342,094 1,358,237 1,455,007 1,480,612 1.8%
(C) Offender Services SubprogramPrimary Function: Provide offender population management, offender classification, offender case management, sentence computation, release operations, jail backlogmonitoring, etc.
Personal Services 3,074,995 2,848,778 3,025,806 3,097,919FTE 48.3 47.1 44.1 44.1
General Fund 3,074,995 2,848,778 3,025,806 3,097,919
Operating Expenses 62,044 62,041 62,044 62,044General Fund 62,044 62,041 62,044 62,044
20-Dec-2017 64 DOC-brf

Appendix A: Number Pages
FY 2015-16Actual
FY 2016-17Actual
FY 2017-18Appropriation
FY 2018-19Request
Request vs.Appropriation
Start-up Costs 0 0 0 0General Fund 0 0 0 0
SUBTOTAL - (C) Offender Services Subprogram 3,137,039 2,910,819 3,087,850 3,159,963 2.3%FTE 48.3 47.1 44.1 44.1 0.0%
General Fund 3,137,039 2,910,819 3,087,850 3,159,963 2.3%
(D) Communications SubprogramPrimary Function: Manage communication systems, including radio, cellular telephones, pagers, and video conferences.
Operating Expenses 1,624,365 1,624,770 1,626,840 1,618,965 *General Fund 1,624,365 1,624,770 1,626,840 1,618,965
Dispatch Services 177,544 176,715 224,477 224,477General Fund 177,544 176,715 224,477 224,477
SUBTOTAL - (D) Communications Subprogram 1,801,909 1,801,485 1,851,317 1,843,442 (0.4%)FTE 0.0 0.0 0.0 0.0 0.0%
General Fund 1,801,909 1,801,485 1,851,317 1,843,442 (0.4%)
(E) Transportation SubprogramPrimary Function: Manage the Department's vehicle fleet as well as the Central Transportation Unit, which transports offenders.
Personal Services 2,052,663 2,125,150 2,124,172 2,197,884 *FTE 35.6 36.6 35.9 35.9
General Fund 2,052,663 2,125,150 2,124,172 2,197,884
Operating Expenses 433,536 433,535 433,538 433,538General Fund 433,536 433,535 433,538 433,538
20-Dec-2017 65 DOC-brf

Appendix A: Number Pages
FY 2015-16Actual
FY 2016-17Actual
FY 2017-18Appropriation
FY 2018-19Request
Request vs.Appropriation
Vehicle Lease Payments 2,636,792 2,733,735 3,206,280 3,650,882 *General Fund 2,255,806 2,255,538 2,608,657 3,023,027Cash Funds 380,986 478,197 597,623 627,855
SUBTOTAL - (E) Transportation Subprogram 5,122,991 5,292,420 5,763,990 6,282,304 9.0%FTE 35.6 36.6 35.9 35.9 0.0%
General Fund 4,742,005 4,814,223 5,166,367 5,654,449 9.4%Cash Funds 380,986 478,197 597,623 627,855 5.1%
(F) Training SubprogramPrimary Function: Provide basic, extended, in-service, and advanced training to DOC employees.
Personal Services 2,333,210 2,235,497 2,277,827 2,332,114FTE 32.8 32.2 33.0 33.0
General Fund 2,333,210 2,235,497 2,277,827 2,332,114
Operating Expenses 286,978 287,002 287,124 286,656 *General Fund 286,978 287,002 287,124 286,656
Start-up Costs 0 0 0 0General Fund 0 0 0 0
SUBTOTAL - (F) Training Subprogram 2,620,188 2,522,499 2,564,951 2,618,770 2.1%FTE 32.8 32.2 33.0 33.0 0.0%
General Fund 2,620,188 2,522,499 2,564,951 2,618,770 2.1%
20-Dec-2017 66 DOC-brf

Appendix A: Number Pages
FY 2015-16Actual
FY 2016-17Actual
FY 2017-18Appropriation
FY 2018-19Request
Request vs.Appropriation
(G) Information Systems SubprogramPrimary Function: Develop and maintain of automated information systems within the DOC. The services are provided by OIT.
Operating Expenses 1,644,122 1,644,322 1,645,262 1,387,417 *General Fund 1,644,122 1,644,322 1,645,262 1,387,417
Payments to OIT 17,719,596 16,631,013 19,723,993 25,856,908 *General Fund 17,613,316 16,531,206 19,606,251 25,704,433Cash Funds 106,280 99,807 117,742 152,475
CORE Operations 611,121 404,620 418,183 413,877General Fund 539,192 356,852 368,814 365,017Cash Funds 34,467 22,903 23,671 23,427Reappropriated Funds 37,462 24,865 25,698 25,433
Start-up Costs 0 0 0 0General Fund 0 0 0 0
SUBTOTAL - (G) Information Systems Subprogram 19,974,839 18,679,955 21,787,438 27,658,202 26.9%FTE 0.0 0.0 0.0 0.0 0.0%
General Fund 19,796,630 18,532,380 21,620,327 27,456,867 27.0%Cash Funds 140,747 122,710 141,413 175,902 24.4%Reappropriated Funds 37,462 24,865 25,698 25,433 (1.0%)
20-Dec-2017 67 DOC-brf

Appendix A: Number Pages
FY 2015-16Actual
FY 2016-17Actual
FY 2017-18Appropriation
FY 2018-19Request
Request vs.Appropriation
(H) Facility Services SubprogramPrimary Function: Contractor/design team selection, design review, contract administration, and fiscal management of the DOC's capital construction and controlledmaintenance projects.
Personal Services 918,858 893,622 960,387 983,276FTE 10.0 9.8 9.7 9.7
General Fund 918,858 893,622 960,387 983,276
Operating Expenses 83,092 83,096 83,096 83,096General Fund 83,092 83,096 83,096 83,096
SUBTOTAL - (H) Facility Services Subprogram 1,001,950 976,718 1,043,483 1,066,372 2.2%FTE 10.0 9.8 9.7 9.7 0.0%
General Fund 1,001,950 976,718 1,043,483 1,066,372 2.2%
TOTAL - (3) Support Services 41,278,928 39,881,400 43,980,321 50,648,681 15.2%FTE 247.4 244.8 241.2 241.2 (0.0%)
General Fund 39,914,220 38,378,304 41,453,991 48,674,919 17.4%Cash Funds 560,724 641,204 779,333 845,654 8.5%Reappropriated Funds 803,984 861,892 1,746,997 1,128,108 (35.4%)Federal Funds 0 0 0 0 0.0%
20-Dec-2017 68 DOC-brf
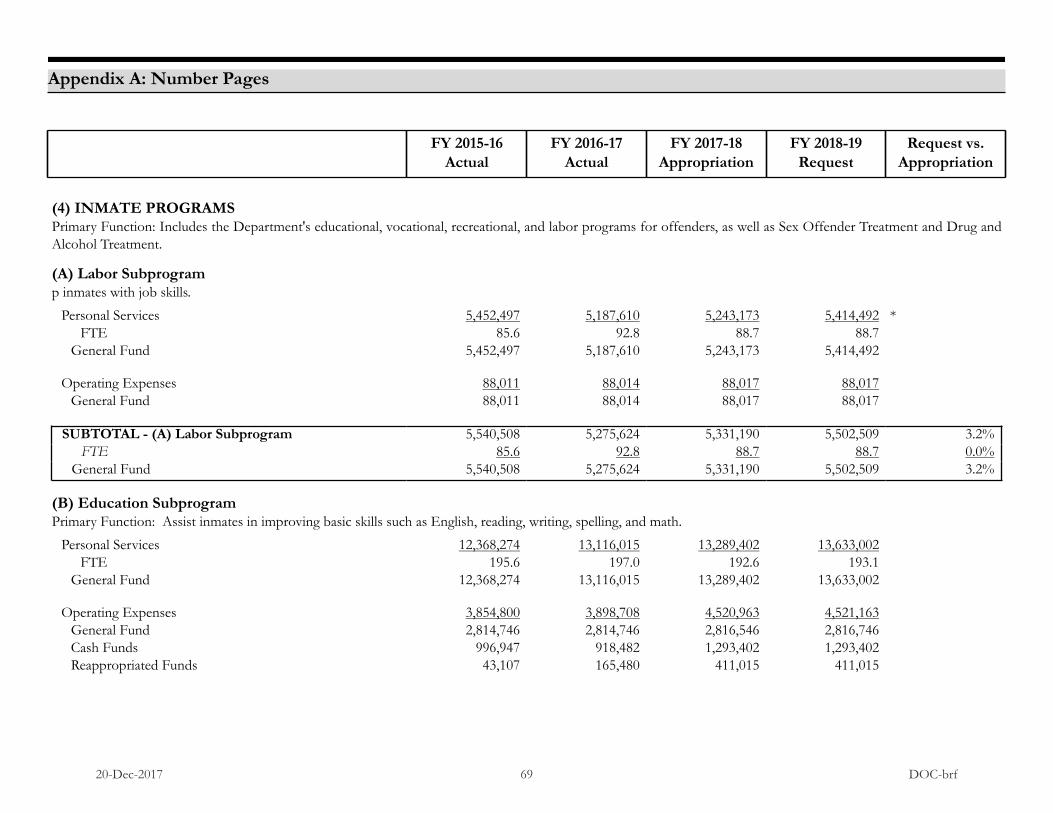
Appendix A: Number Pages
FY 2015-16Actual
FY 2016-17Actual
FY 2017-18Appropriation
FY 2018-19Request
Request vs.Appropriation
(4) INMATE PROGRAMSPrimary Function: Includes the Department's educational, vocational, recreational, and labor programs for offenders, as well as Sex Offender Treatment and Drug andAlcohol Treatment.
(A) Labor Subprogramp inmates with job skills.
Personal Services 5,452,497 5,187,610 5,243,173 5,414,492 *FTE 85.6 92.8 88.7 88.7
General Fund 5,452,497 5,187,610 5,243,173 5,414,492
Operating Expenses 88,011 88,014 88,017 88,017General Fund 88,011 88,014 88,017 88,017
SUBTOTAL - (A) Labor Subprogram 5,540,508 5,275,624 5,331,190 5,502,509 3.2%FTE 85.6 92.8 88.7 88.7 0.0%
General Fund 5,540,508 5,275,624 5,331,190 5,502,509 3.2%
(B) Education SubprogramPrimary Function: Assist inmates in improving basic skills such as English, reading, writing, spelling, and math.
Personal Services 12,368,274 13,116,015 13,289,402 13,633,002FTE 195.6 197.0 192.6 193.1
General Fund 12,368,274 13,116,015 13,289,402 13,633,002
Operating Expenses 3,854,800 3,898,708 4,520,963 4,521,163General Fund 2,814,746 2,814,746 2,816,546 2,816,746Cash Funds 996,947 918,482 1,293,402 1,293,402Reappropriated Funds 43,107 165,480 411,015 411,015
20-Dec-2017 69 DOC-brf

Appendix A: Number Pages
FY 2015-16Actual
FY 2016-17Actual
FY 2017-18Appropriation
FY 2018-19Request
Request vs.Appropriation
Contract Services 237,128 237,128 237,128 237,128General Fund 237,128 237,128 237,128 237,128
Education Grants 62,192 91,865 80,060 80,060FTE 0.0 2.0 2.0 2.0
Cash Funds 0 0 10,000 10,000Reappropriated Funds 0 0 42,410 42,410Federal Funds 62,192 91,865 27,650 27,650
Start-up Costs 0 0 18,812 0General Fund 0 0 18,812 0
Indirect Cost Assessment 0 377 311 0General Fund 0 0 0 0Federal Funds 0 377 311 0
SUBTOTAL - (B) Education Subprogram 16,522,394 17,344,093 18,146,676 18,471,353 1.8%FTE 195.6 199.0 194.6 195.1 0.3%
General Fund 15,420,148 16,167,889 16,361,888 16,686,876 2.0%Cash Funds 996,947 918,482 1,303,402 1,303,402 0.0%Reappropriated Funds 43,107 165,480 453,425 453,425 0.0%Federal Funds 62,192 92,242 27,961 27,650 (1.1%)
(C) Recreation SubprogramPrimary Function: Develop, implement, and supervise recreational programs including leisure time activities and outdoor exercise.
Personal Services 6,619,731 6,766,178 6,722,303 6,967,074 *FTE 124.2 123.1 116.7 116.7
General Fund 6,619,731 6,766,178 6,722,303 6,967,074
20-Dec-2017 70 DOC-brf

Appendix A: Number Pages
FY 2015-16Actual
FY 2016-17Actual
FY 2017-18Appropriation
FY 2018-19Request
Request vs.Appropriation
Operating Expenses 71,116 71,229 71,232 71,232Cash Funds 71,116 71,229 71,232 71,232
SUBTOTAL - (C) Recreation Subprogram 6,690,847 6,837,407 6,793,535 7,038,306 3.6%FTE 124.2 123.1 116.7 116.7 0.0%
General Fund 6,619,731 6,766,178 6,722,303 6,967,074 3.6%Cash Funds 71,116 71,229 71,232 71,232 0.0%
(D) Drug and Alcohol Treatment SubprogramPrimary Function: Provide drug and alcohol treatment services to inmates.
Personal Services 4,691,872 4,970,855 5,297,790 5,424,050FTE 83.6 74.5 85.4 85.4
General Fund 4,691,872 4,970,855 5,297,790 5,424,050
Operating Expenses 110,932 110,927 110,932 110,932General Fund 110,932 110,927 110,932 110,932
Services for Substance Abuse and Co-occurring Disorders 995,127 995,127 1,009,077 1,019,168 *Reappropriated Funds 995,127 995,127 1,009,077 1,019,168
Contract Services 2,420,458 2,277,864 2,459,804 2,484,402 *General Fund 2,070,458 1,927,864 2,104,898 2,125,947Reappropriated Funds 350,000 350,000 354,906 358,455
Treatment Grants 134,661 133,837 126,682 126,682Reappropriated Funds 0 0 126,682 126,682Federal Funds 134,661 133,837 0 0
20-Dec-2017 71 DOC-brf

Appendix A: Number Pages
FY 2015-16Actual
FY 2016-17Actual
FY 2017-18Appropriation
FY 2018-19Request
Request vs.Appropriation
Start-up Costs 0 0 0 0General Fund 0 0 0 0
SUBTOTAL - (D) Drug and Alcohol TreatmentSubprogram 8,353,050 8,488,610 9,004,285 9,165,234 1.8%
FTE 83.6 74.5 85.4 85.4 0.0%General Fund 6,873,262 7,009,646 7,513,620 7,660,929 2.0%Reappropriated Funds 1,345,127 1,345,127 1,490,665 1,504,305 0.9%Federal Funds 134,661 133,837 0 0 0.0%
(E) Sex Offender Treatment SubprogramPrimary Function: Provide treatment to sex offenders who are motivated to eliminate such behavior.
Personal Services 2,461,570 3,525,727 3,037,564 3,110,435FTE 40.2 47.1 55.8 55.8
General Fund 2,432,759 3,496,186 3,007,523 3,079,201Cash Funds 28,811 29,541 30,041 31,234
Operating Expenses 92,276 0.0 92,273 0.0 92,276 0.0 92,276 0.0General Fund 91,776 91,773 91,776 91,776Cash Funds 500 500 500 500
Polygraph Testing 242,500 230,675 242,500 242,500General Fund 242,500 230,675 242,500 242,500
Sex Offender Treatment Grants 111,872 78,232 65,597 65,597Federal Funds 111,872 78,232 65,597 65,597
20-Dec-2017 72 DOC-brf

Appendix A: Number Pages
FY 2015-16Actual
FY 2016-17Actual
FY 2017-18Appropriation
FY 2018-19Request
Request vs.Appropriation
Start-up Costs 0 0 0 0General Fund 0 0 0 0
SUBTOTAL - (E) Sex Offender TreatmentSubprogram 2,908,218 3,926,907 3,437,937 3,510,808 2.1%
FTE 40.2 47.1 55.8 55.8 0.0%General Fund 2,767,035 3,818,634 3,341,799 3,413,477 2.1%Cash Funds 29,311 30,041 30,541 31,734 3.9%Federal Funds 111,872 78,232 65,597 65,597 0.0%
(F) Volunteers SubprogramPrimary Function: Manage volunteer programs, including volunteer chaplain services to inmates.
Personal Services 497,967 426,933 424,144 434,252FTE 7.0 7.1 8.0 8.0
General Fund 497,967 426,933 424,144 434,252Cash Funds 0 0 0 0
Operating Expenses 17,908 17,908 17,912 17,912General Fund 17,908 17,908 17,912 17,912
SUBTOTAL - (F) Volunteers Subprogram 515,875 444,841 442,056 452,164 2.3%FTE 7.0 7.1 8.0 8.0 0.0%
General Fund 515,875 444,841 442,056 452,164 2.3%Cash Funds 0 0 0 0 0.0%
20-Dec-2017 73 DOC-brf
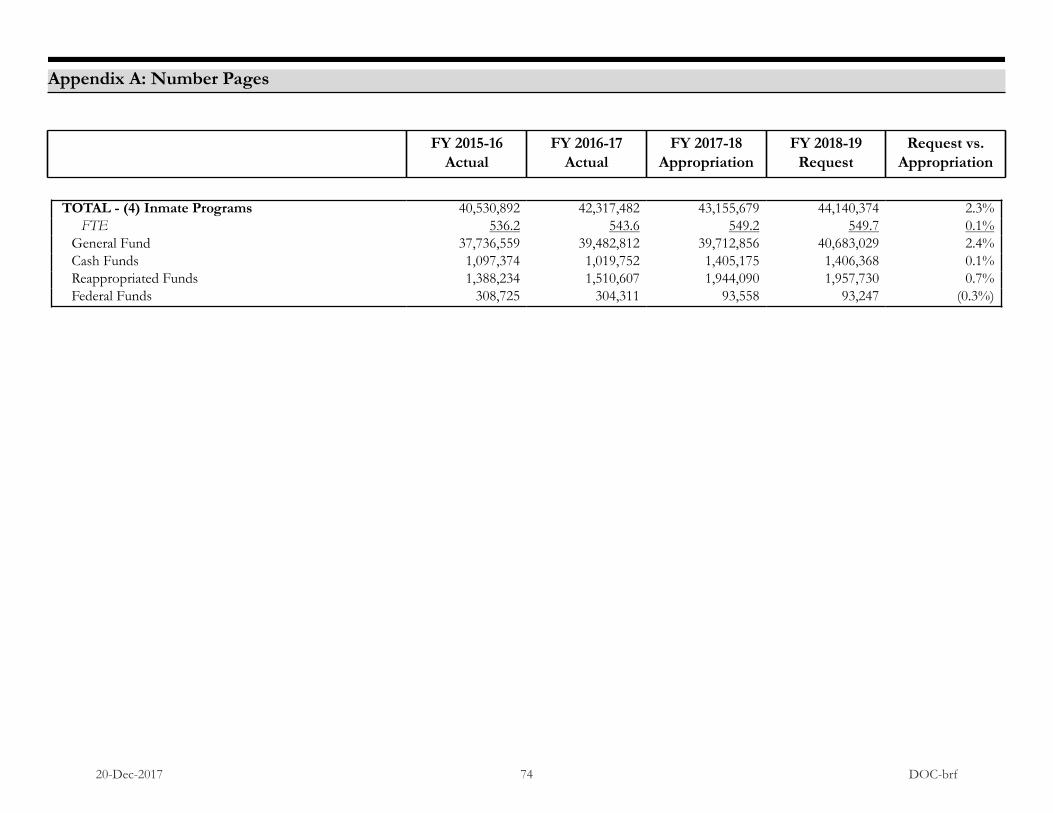
Appendix A: Number Pages
FY 2015-16Actual
FY 2016-17Actual
FY 2017-18Appropriation
FY 2018-19Request
Request vs.Appropriation
TOTAL - (4) Inmate Programs 40,530,892 42,317,482 43,155,679 44,140,374 2.3%FTE 536.2 543.6 549.2 549.7 0.1%
General Fund 37,736,559 39,482,812 39,712,856 40,683,029 2.4%Cash Funds 1,097,374 1,019,752 1,405,175 1,406,368 0.1%Reappropriated Funds 1,388,234 1,510,607 1,944,090 1,957,730 0.7%Federal Funds 308,725 304,311 93,558 93,247 (0.3%)
20-Dec-2017 74 DOC-brf

Appendix A: Number Pages
FY 2015-16Actual
FY 2016-17Actual
FY 2017-18Appropriation
FY 2018-19Request
Request vs.Appropriation
(5) COMMUNITY SERVICESPrimary Function: Monitors and supervises offenders who are on parole, in community corrections facilities prior to parole, living in private residences under intensivesupervision prior to parole, and in Youthful Offender System aftercare.
(A) Parole SubprogramPrimary Function: Supervise offenders who have been placed on parole by the Parole Board, including high-risk offenders who are on intensive supervision parole.
Personal Services 14,881,685 17,350,072 17,555,701 17,889,390 *FTE 248.7 254.9 294.0 292.2
General Fund 14,881,685 17,350,072 17,555,701 17,889,390
Operating Expenses 2,612,239 2,612,237 2,617,703 2,612,740General Fund 2,612,239 2,612,237 2,617,703 2,612,740
Contract Services 7,625,895 7,637,953 7,732,631 9,094,909 *General Fund 5,488,978 5,500,853 5,565,923 6,906,784Reappropriated Funds 2,136,917 2,137,100 2,166,708 2,188,125
Wrap-Around Services Program 1,834,290 1,834,291 1,860,004 1,878,604 *General Fund 1,834,290 1,834,291 1,860,004 1,878,604
Grants to Community-based Organizations for ParoleeSupport 1,708,910 1,710,000 1,733,971 1,733,971
General Fund 1,708,910 1,710,000 1,733,971 1,733,971
Non-residential Services 1,215,818 1,215,818 1,215,818 0 *General Fund 1,215,818 1,215,818 1,215,818 0
Home Detention 69,383 69,383 69,383 0 *General Fund 69,383 69,383 69,383 0
20-Dec-2017 75 DOC-brf

Appendix A: Number Pages
FY 2015-16Actual
FY 2016-17Actual
FY 2017-18Appropriation
FY 2018-19Request
Request vs.Appropriation
Start-up Costs 0 0 0 0General Fund 0 0 0 0
SUBTOTAL - (A) Parole Subprogram 29,948,220 32,429,754 32,785,211 33,209,614 1.3%FTE 248.7 254.9 294.0 292.2 (0.6%)
General Fund 27,811,303 30,292,654 30,618,503 31,021,489 1.3%Reappropriated Funds 2,136,917 2,137,100 2,166,708 2,188,125 1.0%
(Formerly B) Parole Intensive Supervision SubprogramThis subprogram was combined into the Parole Subprogram.
Contract Services 0General Fund 0
Non-residential Services 0General Fund 0
Home Detention 0General Fund 0
Start-up Costs 0General Fund 0
SUBTOTAL - (Formerly B) Parole IntensiveSupervision Subprogram 0 0.0%
FTE 0.0 0.0%General Fund 0 0.0%
20-Dec-2017 76 DOC-brf

Appendix A: Number Pages
FY 2015-16Actual
FY 2016-17Actual
FY 2017-18Appropriation
FY 2018-19Request
Request vs.Appropriation
(Formerly C) Community Intensive Supervision SubprogramThis subprogram was combined into the Community Supervision Subprogram.
Contract Services 0General Fund 0
SUBTOTAL - (Formerly C) Community IntensiveSupervision Subprogram 0 0.0%
FTE 0.0 0.0%General Fund 0 0.0%
(B) Community Supervision Subprogramet been paroled; these offenders are now living in the community under the Intensive-supervision Inmate program.(1) Community Supervision
Personal Services 5,789,583 5,922,197 5,951,926 5,185,148 *FTE 81.4 84.5 83.8 66.4
General Fund 5,789,583 5,922,197 5,951,926 5,185,148
Operating Expenses 632,648 632,650 632,650 603,566 *General Fund 632,648 632,650 632,650 603,566
Community Mental Health Services 640,062 640,062 649,034 6,490 *General Fund 640,062 640,062 649,034 6,490
Psychotropic Medication 131,400 77,961 131,400 131,400General Fund 131,400 77,961 131,400 131,400
20-Dec-2017 77 DOC-brf

Appendix A: Number Pages
FY 2015-16Actual
FY 2016-17Actual
FY 2017-18Appropriation
FY 2018-19Request
Request vs.Appropriation
Contract Services 2,901,864 2,703,453 2,952,822 3,043,132 *General Fund 2,901,864 2,703,453 2,952,822 3,010,657Reappropriated Funds 0 0 0 32,475
Contract Services for High Risk Offenders 221,200 221,200 221,200 0 *General Fund 221,200 221,200 221,200 0
Contract Services for Fugitive Returns 72,880 64,589 74,524 0 *General Fund 42,049 42,049 42,049 0Reappropriated Funds 30,831 22,540 32,475 0
SUBTOTAL - 10,389,637 10,262,112 10,613,556 8,969,736 (15.5%)FTE 81.4 84.5 83.8 66.4 (20.8%)
General Fund 10,358,806 10,239,572 10,581,081 8,937,261 (15.5%)Reappropriated Funds 30,831 22,540 32,475 32,475 0.0%
(2) Youthful Offender System AftercarePersonal Services 508,414 364,257 519,737 532,124
FTE 7.0 5.2 8.0 8.0General Fund 508,414 364,257 519,737 532,124
Operating Expenses 141,067 141,067 141,067 141,067General Fund 141,067 141,067 141,067 141,067
Contract Services 1,062,396 1,062,396 1,022,396 1,022,396General Fund 1,062,396 1,062,396 1,022,396 1,022,396
SUBTOTAL - 1,711,877 1,567,720 1,683,200 1,695,587 0.7%FTE 7.0 5.2 8.0 8.0 0.0%
General Fund 1,711,877 1,567,720 1,683,200 1,695,587 0.7%
20-Dec-2017 78 DOC-brf

Appendix A: Number Pages
FY 2015-16Actual
FY 2016-17Actual
FY 2017-18Appropriation
FY 2018-19Request
Request vs.Appropriation
SUBTOTAL - (B) Community SupervisionSubprogram 12,101,514 11,829,832 12,296,756 10,665,323 (13.3%)
FTE 88.4 89.7 91.8 74.4 (19.0%)General Fund 12,070,683 11,807,292 12,264,281 10,632,848 (13.3%)Reappropriated Funds 30,831 22,540 32,475 32,475 0.0%
(C) Community Re-entry Subprogramase, including access to community services and assistance in securing employment.
Personal Services 1,814,204 2,366,942 2,380,990 2,437,735FTE 36.7 38.2 41.6 41.6
General Fund 1,814,204 2,366,942 2,380,990 2,437,735
Operating Expenses 146,200 146,199 146,202 146,202General Fund 146,200 146,199 146,202 146,202
Offender Emergency Assistance 96,768 96,763 96,768 96,768General Fund 96,768 96,763 96,768 96,768
Contract Services 189,999 166,571 190,000 190,000General Fund 189,999 166,571 190,000 190,000
Offender Re-employment Center 364,000 364,000 374,000 374,000General Fund 364,000 364,000 364,000 364,000Cash Funds 0 0 10,000 10,000
20-Dec-2017 79 DOC-brf
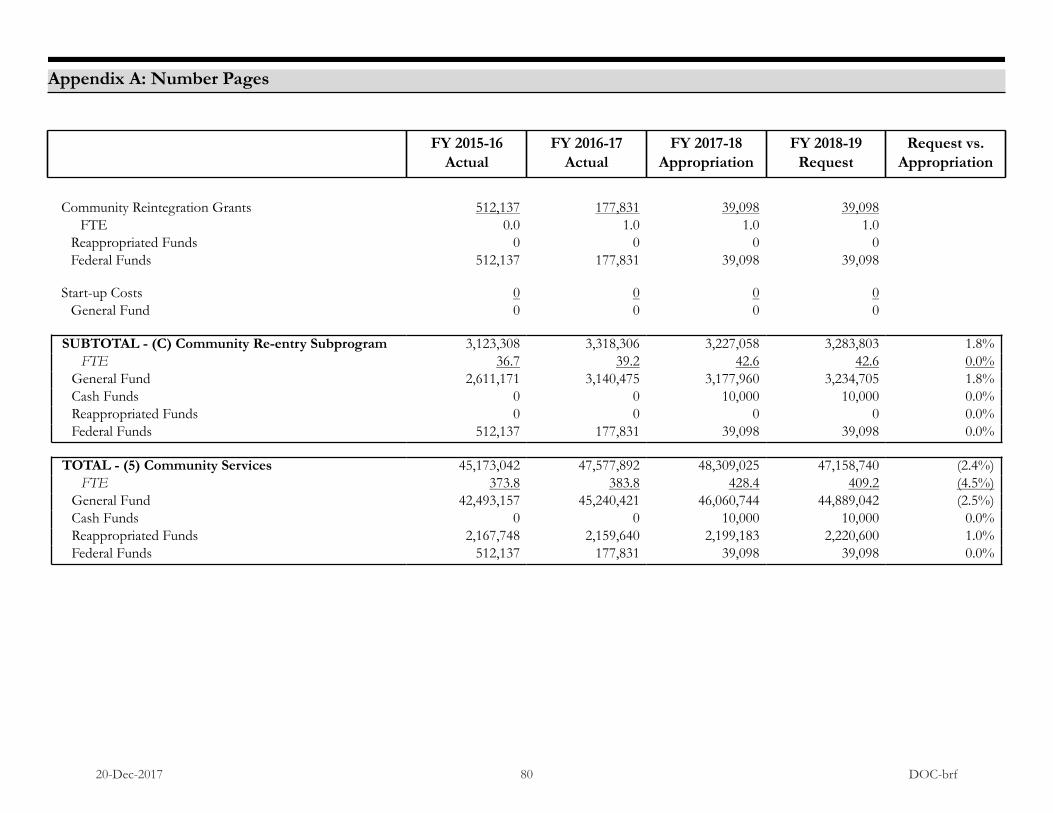
Appendix A: Number Pages
FY 2015-16Actual
FY 2016-17Actual
FY 2017-18Appropriation
FY 2018-19Request
Request vs.Appropriation
Community Reintegration Grants 512,137 177,831 39,098 39,098FTE 0.0 1.0 1.0 1.0
Reappropriated Funds 0 0 0 0Federal Funds 512,137 177,831 39,098 39,098
Start-up Costs 0 0 0 0General Fund 0 0 0 0
SUBTOTAL - (C) Community Re-entry Subprogram 3,123,308 3,318,306 3,227,058 3,283,803 1.8%FTE 36.7 39.2 42.6 42.6 0.0%
General Fund 2,611,171 3,140,475 3,177,960 3,234,705 1.8%Cash Funds 0 0 10,000 10,000 0.0%Reappropriated Funds 0 0 0 0 0.0%Federal Funds 512,137 177,831 39,098 39,098 0.0%
TOTAL - (5) Community Services 45,173,042 47,577,892 48,309,025 47,158,740 (2.4%)FTE 373.8 383.8 428.4 409.2 (4.5%)
General Fund 42,493,157 45,240,421 46,060,744 44,889,042 (2.5%)Cash Funds 0 0 10,000 10,000 0.0%Reappropriated Funds 2,167,748 2,159,640 2,199,183 2,220,600 1.0%Federal Funds 512,137 177,831 39,098 39,098 0.0%
20-Dec-2017 80 DOC-brf

Appendix A: Number Pages
FY 2015-16Actual
FY 2016-17Actual
FY 2017-18Appropriation
FY 2018-19Request
Request vs.Appropriation
(6) PAROLE BOARDPrimary Function: Conduct all parole application and parole revocation hearings.
Personal Services 1,305,431 1,289,440 1,305,657 1,401,775FTE 17.3 17.8 17.5 17.5
General Fund 1,305,431 1,289,440 1,305,657 1,401,775Cash Funds 0 0 0 0Reappropriated Funds 0 0 0 0Federal Funds 0 0 0 0
Operating Expenses 104,808 101,042 106,390 106,390General Fund 104,808 101,042 106,390 106,390
Contract Services 233,141 225,012 272,437 272,437General Fund 233,141 225,012 272,437 272,437
Start-up Costs 0 0 0 0General Fund 0 0 0 0
TOTAL - (6) Parole Board 1,643,380 1,615,494 1,684,484 1,780,602 5.7%FTE 17.3 17.8 17.5 17.5 0.0%
General Fund 1,643,380 1,615,494 1,684,484 1,780,602 5.7%Cash Funds 0 0 0 0 0.0%Reappropriated Funds 0 0 0 0 0.0%Federal Funds 0 0 0 0 0.0%
20-Dec-2017 81 DOC-brf

Appendix A: Number Pages
FY 2015-16Actual
FY 2016-17Actual
FY 2017-18Appropriation
FY 2018-19Request
Request vs.Appropriation
(7) CORRECTIONAL INDUSTRIESPrimary Function: Employ inmates in profit-oriented industries, usually within DOC facilities.
Personal Services 9,615,711 8,892,732 10,649,298 10,840,129 *FTE 135.6 135.4 155.0 155.0
Cash Funds 3,350,744 1,721,729 3,478,295 3,630,158Reappropriated Funds 6,264,967 7,171,003 7,171,003 7,209,971
Operating Expenses 5,875,636 4,758,093 6,689,926 6,689,926Cash Funds 1,816,591 289,381 1,817,327 1,817,327Reappropriated Funds 4,059,045 4,468,712 4,872,599 4,872,599
Raw Materials 28,052,347 20,306,391 38,878,810 38,878,810Cash Funds 8,326,464 2,539,257 8,441,080 8,441,080Reappropriated Funds 19,725,883 17,767,134 30,437,730 30,437,730
Inmate Pay 2,161,033 2,084,367 2,498,992 2,592,992Cash Funds 823,367 580,375 861,343 955,343Reappropriated Funds 1,337,666 1,503,992 1,637,649 1,637,649
Capital Outlay 524,676 138,772 1,406,200 1,406,200Cash Funds 23,884 46,825 337,094 337,094Reappropriated Funds 500,792 91,947 1,069,106 1,069,106
Correctional Industries Grants 2,509,851 5,295,893 2,500,000 2,500,000Federal Funds 2,509,851 5,295,893 2,500,000 2,500,000
20-Dec-2017 82 DOC-brf

Appendix A: Number Pages
FY 2015-16Actual
FY 2016-17Actual
FY 2017-18Appropriation
FY 2018-19Request
Request vs.Appropriation
Indirect Cost Assessment 426,356 755,946 1,650,611 1,019,890Cash Funds 140,983 131,587 115,923 135,538Reappropriated Funds 285,373 275,402 292,966 293,542Federal Funds 0 348,957 1,241,722 590,810
TOTAL - (7) Correctional Industries 49,165,610 42,232,194 64,273,837 63,927,947 (0.5%)FTE 135.6 135.4 155.0 155.0 0.0%
Cash Funds 14,482,033 5,309,154 15,051,062 15,316,540 1.8%Reappropriated Funds 32,173,726 31,278,190 45,481,053 45,520,597 0.1%Federal Funds 2,509,851 5,644,850 3,741,722 3,090,810 (17.4%)
20-Dec-2017 83 DOC-brf

Appendix A: Number Pages
FY 2015-16Actual
FY 2016-17Actual
FY 2017-18Appropriation
FY 2018-19Request
Request vs.Appropriation
(8) CANTEEN OPERATIONPrimary Function: Sell snacks, personal care products, TV's, phone time, and other items to DOC inmates at all DOC facilities.
Personal Services 1,771,932 1,800,878 2,037,260 2,118,188FTE 26.4 28.0 28.0 28.0
Cash Funds 1,771,932 1,800,878 2,037,260 2,118,188Reappropriated Funds 0 0 0 0Federal Funds 0 0 0 0
Operating Expenses 14,776,210 15,362,528 12,851,987 12,851,987Cash Funds 14,776,210 15,362,528 12,851,987 12,851,987
Inmate Pay 49,626 52,930 73,626 73,626Cash Funds 49,626 52,930 73,626 73,626
Indirect Cost Assessment 85,741 78,870 69,649 81,265General Fund 0 0 0 0Cash Funds 85,741 78,870 69,649 81,265
Start-up Costs 0 0 0 0General Fund 0 0 0 0
TOTAL - (8) Canteen Operation 16,683,509 17,295,206 15,032,522 15,125,066 0.6%FTE 26.4 28.0 28.0 28.0 0.0%
General Fund 0 0 0 0 0.0%Cash Funds 16,683,509 17,295,206 15,032,522 15,125,066 0.6%Reappropriated Funds 0 0 0 0 0.0%Federal Funds 0 0 0 0 0.0%
20-Dec-2017 84 DOC-brf

Appendix A: Number Pages
FY 2015-16Actual
FY 2016-17Actual
FY 2017-18Appropriation
FY 2018-19Request
Request vs.Appropriation
TOTAL - Department of Corrections 818,409,700 821,575,156 864,740,250 922,014,329 6.6%FTE 6,148.8 6,148.0 6,247.0 6,228.5 (0.3%)
General Fund 740,491,437 745,728,749 769,192,172 826,995,444 7.5%Cash Funds 37,553,615 33,463,518 39,760,660 40,426,978 1.7%Reappropriated Funds 36,673,293 36,039,575 51,620,128 51,075,840 (1.1%)Federal Funds 3,691,355 6,343,314 4,167,290 3,516,067 (15.6%)
20-Dec-2017 85 DOC-brf

APPENDIX B RECENT LEGISLATION AFFECTING
DEPARTMENT BUDGET
2016 SESSION BILLS S.B. 16-034 (TAMPERING WITH A DECEASED HUMAN BODY): Creates the crime of tampering with a deceased human body, a class 3 felony, which occurs when a person acting without legal right or authority, believing that an official proceeding is pending or in progress, willfully destroys, mutilates, conceals, removes, or alters a human body with the intent of hindering the official proceeding. S.B. 16-051 (JUDGE'S DISCRETION REGARDING CONSECUTIVE SENTENCES): Eliminates the requirement that a person convicted of 2 or more separate crimes of violence arising out of the same incident be sentenced consecutively rather than concurrently. Potentially reduces Department expenditures starting in FY 2021-22 by an indeterminate amount. S.B. 16-095 (5 YEAR DOC APPROPRIATIONS FOR CRIMES FIXES): Clarifies how many years of appropriations must be included in the fiscal note for a criminal sentencing bill and in the related bill. Specifies that only Department of Corrections expenditures are to be included and identifies the expenditures to include, which include parole costs. Clarifies that the statute applies when offenders are placed in private prisons. S.B. 16-102 (REPEAL CERTAIN MANDATORY MINIMUM PRISON SENTENCES): Removes the mandatory term of incarceration that must accompany convictions of certain types of second degree assault or violations of bail bond conditions. Appropriates $65,788 General Fund to the Judicial Department for FY 2016-17 based on the assumption that the Judicial Department will require 0.9 additional FTE. Reduces the FY 2016-17 General Fund appropriation to the Department of Corrections for private prison placements by $721,496. S.B. 16-142 (MISCELLANEOUS UPDATES TO ELECTIONS LAWS): Makes various changes and updates to election statutes, including creation of a class 6 felony for knowingly accessing the statewide voter registration system without authorization. Includes a 5-year statutory General Fund appropriation to the Department that provides $21,864 for FY 2017-18 and $546 for FY 2018-19. For more information, see the corresponding bill description in the "Recent Legislation" section of the Department of State. S.B. 16-180 (DOC PROGRAM FOR JUVENILE OFFENDERS): Requires the Department to create a specialized program for offenders in the custody of the Department who committed a felony as a juvenile but were sentenced as an adult under adult laws. Requires the program to include best and promising practices in independent living skills development and reentry services for long-term offenders. Establishes eligibility criteria for program acceptance. Allows offenders who did not commit first degree murder to apply for the program after serving 20 years of their sentence. Allows first degree murderers to apply after 30 years. Requires offenders to participate for at least three years in order to complete the program. If the program has been successfully completed, an offender who did not commit first degree murder and has served at least 25 years of his or her sentence is presumed to have met the factual burden of presenting extraordinary mitigating circumstances and his release to
20-Dec-2017 86 DOC-brf

early parole is presumed compatible with the safety and welfare of society unless rebutted by relevant evidence. The same presumption applies after 30 years for offenders who committed first degree murder. Makes offenders who complete the program eligible to apply for early parole. Directs the parole application to the parole board and the governor. Requires the parole board to make a recommendation to the governor and the governor to make the final parole decision. Appropriates $95,504 General Fund to the Department for FY 2016-17. S.B. 16-181 (SENTENCING JUVENILES CONVICTED OF CLASS 1 FELONIES): Establishes a procedure for resentencing persons who committed a class 1 felony while a juvenile and upon whom a court imposed a mandatory life sentence without the possibility of parole. If the related felony is first-degree murder committed in the course of any of several described offenses, then the district court may sentence the person to 30 to 50 years in prison, less any earned time granted, if the court finds extraordinary mitigating circumstances. Alternatively, the court may sentence the person to a term of life imprisonment with the possibility of parole after serving 40 years, less any earned time granted. If the related felony is not first-degree murder committed in the course of any of several described offenses, then the district court shall sentence the person to a term of life imprisonment with the possibility of parole after serving 40 years, less any earned time granted. Prohibits the awarding of good time to a resentenced offender but allows the retroactive award of earned time as if the person had been eligible for earned time from the beginning of his or her incarceration. The state board of parole may conduct parole hearings for resentenced offenders beginning in June 2017. Potentially reduces Department expenditures starting in FY 2017-18 by an indeterminate amount. H.B. 16-1080 (ASSAULT BY STRANGULATION): Classifies strangulation with the intent to cause serious bodily injury as first degree assault, and strangulation with intent to cause bodily injury as second degree assault. Designates second degree assault by strangulation as an extraordinary risk crime, thus increasing the maximum presumptive sentence range. Includes a 5-year statutory General Fund appropriation to the Department that provides $43,727 for FY 2017-18, $87,454 for FY 2018-19, $131,181 for FY 2019-20, and $170,900 for FY 2020-21. H.B. 16-1117 (RECORD CUSTODIAL INTERROGATIONS): Requires law enforcement officials who are investigating a class 1 or 2 felony or a felony sexual assault to make an audio-video recording of custodial interrogations occurring in a detention facility. Appropriates $24,700 General Fund to the Department for FY 2016-17. H.B. 16-1190 (EXCLUDE DETENTION FACILITIES FROM DEADLY FORCE LAW): Establishes that that prison cells and other places of habitation in detention facilities are not dwellings for purposes of Colorado's "Make my day" law, thus depriving inmates in those facilities of immunity from prosecution and civil liability when they use force, including deadly force, against another inmate who (1) has unlawfully entered the inmate-occupant's place of habitation, (2) the inmate-occupant reasonably believes is committing or intends to commit a crime against a person or property, in addition to the uninvited entry, and (3) the inmate-occupant reasonably believes might use physical force against the occupant, no matter how slight. The bill may result in increased sentences to the Department, but the amount and timing of the resulting costs was not estimated in the Legislative Council Staff Fiscal Note. H.B. 16-1260 (EXTEND STATUTE OF LIMITATIONS SEXUAL ASSAULT): Extends the criminal statute of limitations for felony sexual assault to 20 years. Potentially increases Department expenditures starting in FY 2026-27 by an indeterminate amount.
20-Dec-2017 87 DOC-brf

H.B. 16-1362 (LICENSE PLATE AUCTION TRANSFER DISABILITY BENEFIT): Transfers the functions of the License Plate Auction Group, currently housed in the Governor's Office, to the Disability-Benefit Support Contract Committee, housed in the Department of Personnel, and renames the new entity the Colorado Disability Funding Committee. Allows the committee to contract with an entity to sell and auction license registration numbers, for which it will also determine a reasonable commission. Directs that profits be used to aid people with disabilities in accessing disability benefits. Appropriates $42,283 cash funds and 0.5 FTE from the Disability Support Fund to the Department of Personnel. Directs that any money used to implement additional license plate options be transferred to the Division of Correctional Industries in the Department of Corrections. For more information, see the corresponding bill description in the "Recent Legislation" section of the Department of Personnel. H.B. 16-1405 (LONG BILL): General appropriations act for FY 2016-17. H.B. 16-1406 (COUNTY CORONERS REIMBURSEMENT BY DOC): Requires the Department to reimburse a county for reasonable and necessary costs related to investigations or autopsies for persons who were in the custody of the DOC at the time of their death. For FY 2016-17 appropriates $32,175 General Fund to the Department. H.B. 16-1411 (FORT LYON RESIDENTIAL COMMUNITY STUDY): Authorizes the State Auditor to contract for a study of the Fort Lyon Supportive Residential Community to evaluate the program's costs, benefits, and outcomes. This program serves approximately 250 chronically homeless individuals at a historic facility in Bent County. A preliminary findings report is due August 1, 2017 and a final report is due August 1, 2018. For FY 2016-17, appropriates $200,000 General Fund to the Legislative Department for the Office of the State Auditor to contract for the study and $11,875 General Fund to the Department of Corrections for contract services related to compiling data for the study. Unspent amounts may be rolled forward for expenditure in FY 2017-18. The total cost of the study from FY 2016-17 until its completion in FY 2018-19 is not expected to exceed $450,000 General Fund.
2017 SESSION BILLS S.B. 17-159 (SUPPLEMENTAL APPROPRIATION): Supplemental appropriation to the Department of Corrections to modify FY 2016-17 appropriations included in the FY 2016-17 Long Bill (H.B. 16-1405). S.B. 17-176 (Motor Vehicle License Plate Appropriation): Authorizes the use of the Colorado State Titling and Registration (CSTAR) Account in the Highway Users Tax Fund by the Department of Revenue to purchase license plates, decals, and validating tabs from the Department of Corrections. Provides $2,435,572 reappropriated funds to the Department of Corrections from the Department of Revenue to produce these items. For more information, see the corresponding bill description in the "Recent Legislation" section at the end of Part III of the Department of Revenue. S.B. 17-256 (LONG BILL): General appropriations act for FY 2017-18.
20-Dec-2017 88 DOC-brf

S.B. 17-048 (REQUIRE ARREST OF INTENSIVE SUPERVISION PAROLEES WHO ESCAPE FROM
DOC): Specifies that knowingly removing or tampering with an electronic monitoring device required to be worn as a condition of parole is considered escape from custody. Requires arrest of a parolee participating in an intensive supervision program if there is probable cause to believe that the parolee has committed such an act. The arresting officer is required to submit charges to the district attorney for consideration of filing. May increase costs of the Department of Corrections because some parolees may be sentenced for escape rather than being returned to custody for a technical parole violation, thereby increasing their length of stay upon return to prison. H.B. 17-1072 (HUMAN TRAFFICKING SEXUAL SERVITUDE): Adds to the definition of human trafficking for sexual servitude the act of purchasing another person for the purpose of coercing him or her to engage in commercial sexual activity. Also adds this element to the definition of human trafficking of a minor. May increase the number of persons sentenced to the Department of Corrections. H.B. 17-1125 (SERVICES IN CORRECTIONAL FACILITIES): Removes from statute the requirement that Correctional Industries provide vehicle maintenance, physical plant and facility maintenance, and food and laundry services for each of the state's correctional facilities. The changes make statute accord with current practice. H.B. 17-1172 (PENALTIES FOR CHILD SEX TRAFFICKERS): Requires that any person convicted of human trafficking of a minor for sexual servitude be sentenced to the Department of Corrections (DOC) for at least 8 years. May increase the length of sentences to the DOC. H.B. 17-1308 (INDIVIDUALIZED CONDITIONS OF PAROLE): Removes from statute the mandatory imposition of certain parole conditions, which is expected to reduce workload and state General Fund costs for the Department by an indeterminate amount. H.B. 17-1330 (NO ESCAPE CONVICTION FOR HABITUAL CRIMINALS): Clarifies that escape from a community-corrections facility and prior convictions for escape or attempted escape may not be used to adjudicate an offender as an habitual criminal. Habitual criminals are subject to longer periods of incarceration so the bill may reduce future Department costs. H.B. 17-1326 (JUSTICE REINVESTMENT CRIME PREVENTION INITIATIVE): Changes maximum parole revocation periods for technical parole violations. Depending on the nature of the parolee’s sentence, decreases or increases the revocation period with decreases expected to predominate. Reduces the maximum time a revoked parolee can be held in the Preparole Release and Revocation Facility from 180 to 90 days. Eliminates parole revocation placements in Community Return-to-custody Facilities. Directs the Parole Board to conduct a parole release review in lieu of a hearing, without the presence of the inmate, if (1) the inmate is assessed as being "low" or "very low" risk using a validated risk assessment instrument, (2) the inmate meets readiness criteria, and (3) victim notification is not required. Requires the Division of Adult Parole to investigate the parole release plans of prospective parolees. Establishes a new crime-prevention program in the Department of Local Affairs (DOLA) to provide small business loans and grants that are designed to reduce crime and promote community development in the target communities of north Aurora and southeast Colorado Springs. Establishes a new Parole Savings Fund to which some of the General Fund savings from the bill’s parole
20-Dec-2017 89 DOC-brf

revocation rules are appropriated. In FY 2017-18 the DOLA grant and loan program receives direct General Fund appropriations. In subsequent years the grant and loan program will be supported by appropriations from the Parole Savings Fund and that fund will receive General Fund appropriations. Adjusts FY 2017-18 appropriations to the DOC and DOLA as follows:
APPROPRIATION ADJUSTMENTS IN H.B. 17-1326 GENERAL FUND
Department of Corrections Appropriation Changes
Payments to local jails $13,595
Payments to in-state private prisons (2,165,720)
Payments to pre-release parole revocation facilities (1,082,860)
Payments to Community Return-to-custody Facilities (2,775,738)
Parole personal services 36,254
FTE (0.8 FTE)
Parole operating expenses 5,463
Computer programming 103,824
Total DOC adjustments ($5,865,182)
DOLA Appropriation Changes
Division of Local Government $51,001
FTE (0.8 FTE)
Computer programming 48,288
Legal services 4,753
Small business loans 1,000,000
Grants for crime reduction and community development 3,000,000
Parole Savings Fund 1,761,140
Total DOLA Adjustments $5,865,182
Overall General Fund Adjustments $0
H.B. 17-1369 (BONDS FOR PERSONS WHO FAIL TO APPEAR DUE TO IMMIGRATION ISSUES): Allows a person or professional bail bonding agent who posts a bail bond for a defendant to recover the bond if the surety can provide the court satisfactory evidence that the defendant was deported and the District Attorney does not object. Reduces cash fund revenue to the Corrections Expansion Reserve Fund and County Jail Assistance Fund in the Department of Corrections. The revenue reduction is estimated to be $8,869 annually for each fund.
20-Dec-2017 90 DOC-brf

APPENDIX C FOOTNOTES AND INFORMATION REQUESTS
UPDATE ON LONG BILL FOOTNOTES 2 Department of Corrections, Management, External Capacity Subprogram, Payments to House
State Prisoners -- The Department of Corrections is authorized to transfer up to 5.0 percent of the total appropriation for the external capacity subprogram between line items in the external capacity subprogram for purposes of reimbursing local jails, private prison providers, and community return to custody providers
COMMENT: The Department is in compliance with this footnote.
3 Department of Corrections, Management, External Capacity Subprogram, Payments to House State Prisoners -- It is the intent of the General Assembly that the department not withhold funds from the per diem payments to cover major medical expenses incurred by state inmates assigned to private facilities because appropriations made in the medical services subprogram are sufficient to cover major medical expenses incurred by state inmates held in both state and private facilities.
COMMENT: The Department is in compliance with this footnote.
4 Department of Corrections, Institutions, Housing and Security Subprogram, Personal Services
-- The amount appropriated in this line item does not include the $7,671,044 of FY 2017-18 General Fund appropriations for the Department of Corrections set forth in sections 108, 111, 116, 114, 115, 121, 120, 117, 118, 119, 122, and 123 of Title 17, Article 18, C.R.S. In calculating the amount appropriated in this line item, it is assumed that these statutory appropriations will be used for the same line item.
COMMENT: The Department is in compliance with this footnote. The footnote outlines the General Fund appropriations included in the required appropriation clauses for five-year criminal sentencing bills to pay for personal services in the housing and security subprogram.
4a Department of Corrections, Institutions, Housing and Security Subprogram, Operating
Expenses -- This appropriation includes $40,000 General Fund for the purpose of providing tampons for offenders.
COMMENT: This footnote was added to the FY 2017-18 as part of the conference committee report. The Department is in compliance with this footnote.
20-Dec-2017 91 DOC-brf

UPDATE ON REQUESTS FOR INFORMATION
MULTIPLE DEPARTMENT REQUEST FOR INFORMATION 1 Department of Corrections; Department of Human Services; Judicial Department;
Department of Public Safety; and Department of Transportation -- State agencies involved in multi-agency programs requiring separate appropriations to each agency are requested to designate one lead agency to be responsible for submitting a comprehensive annual budget request for such programs to the Joint Budget Committee, including prior year, request year, and three year forecasts for revenues into the fund and expenditures from the fund by agency. The requests should be sustainable for the length of the forecast based on anticipated revenues. Each agency is still requested to submit its portion of such request with its own budget document. This applies to requests for appropriation from: the Alcohol and Drug Driving Safety Program Fund, the Law Enforcement Assistance Fund, the Offender Identification Fund, the Persistent Drunk Driver Cash Fund, and the Sex Offender Surcharge Fund, among other programs. COMMENT: This request for information is intended to ensure that Departments coordinate requests that draw on the same cash fund. Each Department is required to include, as part of its budget request, a Cash Fund Report for each cash fund it administers to comply with the statutory limit on cash fund reserves. For funds that are shared by multiple departments, the department that administers the fund is responsible for coordinating submission of expenditure and revenue information from all departments to construct a schedule 9 that incorporates all activity in the fund. One of the funds referenced in this RFI pertains to the Department of Corrections. Sex Offender Surcharge Fund [Section 18-21-103 (3), C.R.S.] – This fund consists of 95.0 percent of sex offender surcharge revenues. These surcharges range from $150 to $3,000 for each conviction or, in the case of juveniles, adjudication. Money in this fund is subject to annual appropriation in the Judicial Department, the Department of Corrections, the Department of Public Safety’s Division of Criminal Justice, and the Department of Human Services to cover the direct and indirect costs associated with the evaluation, identification, and treatment and the continued monitoring of sex offenders. Pursuant to 16-11.7-103 (4)(c), C.R.S., the Sex Offender Management Board is required to develop and submit to the General Assembly the plan for the allocation of money deposited in this fund. The Department of Corrections receives a direct appropriation from the Sex Offender Surcharge Fund to support treatment and services for sex offenders in prison ($30,041 for FY 2017-18). Under the plan submitted by the SOMB, this appropriation would not change for FY 2018-19.
DEPARTMENT OF CORRECTIONS
1 Department of Corrections, Institutions, Mental Health Subprogram -- It is requested that the Department of Corrections submit a report to the House Judiciary Committee and the Senate Judiciary Committee by January 31, 2018, detailing progress related to the mental health unit at the Centennial Correctional Facility. COMMENT: The Department will submit this report on January 31, 2018.
20-Dec-2017 92 DOC-brf

APPENDIX D DEPARTMENT ANNUAL PERFORMANCE REPORT
Pursuant to Section 2-7-205 (1)(b), C.R.S., the Department of Corrections is required to publish an Annual Performance Report for the previous fiscal year by November 1 of each year. This report is to include a summary of the Department’s performance plan and most recent performance evaluation for the designated fiscal year. In addition, pursuant to Section 2-7-204 (3)(a)(I), C.R.S., the Department is required to develop a Performance Plan and submit the plan for the current fiscal year to the Joint Budget Committee and appropriate Joint Committee of Reference by July 1 of each year. For consideration by the Joint Budget Committee in prioritizing the Department’s FY 2018-19 budget request, the FY 2016-17 Annual Performance Report dated October 2017 and the FY 2017-18 Performance Plan can be found at the following link: https://www.colorado.gov/pacific/performancemanagement/department-performance-plans
20-Dec-2017 93 DOC-brf

APPENDIX E COST PER OFFENDER BY FACILITIY
20-Dec-2017 94 DOC-brf

APPENDIX F CLASSIFICATION JOB DUTIES
CORRECTIONAL OFFICER I The minimum requirements to be a Correctional Officers I is a high school diploma or General Education Diploma. Correctional Officer Is are responsible to maintain public safety and security of facility and work sites through various housing and security duties. Duties include: direct/indirect supervision of offenders; controlling facility access and egress; monitoring and inspecting security devices; conducting offender counts; conducting searches to control contraband; managing offender movement; maintaining control over tools, keys, and chemicals; providing transportation for offenders; responding to emergency situations; and completing relative incident reports. Officers maintain positive professional communications with offenders and teach offenders how to interact in a prosocial manner.
CORRECTIONAL OFFICER II The minimum requirements to be a Correctional Officers II is a high school diploma or General Education Diploma and two years of experience. Correctional Officer IIs are first line supervisors of Correctional Officer Is and hold the title of Sergeant. Correctional Officer IIs are responsible to provide lead work and oversight to CO Is assigned to the work area to ensure adherence to policies and procedures. They also are responsible for determining the workflow of the assigned area; ensuring daily tasks are completed; appropriately logging daily activities; completing appropriate documentation in accordance with policies; and training/mentoring CO Is in daily operations and security practices. They inspect the work area to maintain health, safety and sanitation standards; manage offender behavior; and encourage personal accountability through effective and professional communication and by modeling pro-social behavior. They provide offenders with second level of staff contact for counseling and contribute to case planning of offenders.
SUMMARY OF IMPLEMENTATION - CORRECTIONAL SUPPORT TRADES SUPERVISOR I The minimum requirements to be a Correctional Support Trades Supervisor I is a high school diploma or General Education Diploma and four years of experience. The Correctional Support Trades Supervisor I (CSTS I) works in several different areas that are responsible for facility or industry operations, including Food Service, Laundry, Maintenance, Warehouse Operations, and Correctional Industries. They hold the title of Sergeant. CSTS Is are responsible for maintaining security and safety within their assigned work area; supervising and training offender work crews in their specific trades and skill sets; ensuring key/tool control and appropriate use. CSTS Is are responsible for generating offender payroll records and verifying work hours; evaluating offender work performance; conducting offender counts, conducting searches to control contraband, transporting offenders to work sites (for off-site work crews); ensuring quality products or operations. CSTS Is also provide offenders with the first level of staff contact for counseling and interaction in their work areas.
20-Dec-2017 95 DOC-brf

APPENDIX G PRISON UTILIZATION STUDY FACILITY TIERS
From pages two and three of the Colorado Prison Utilization Study, the following is the description of the facility tiers and the explanation for why facilities were placed in the respective tier.
Tier 1: Facilities essential to the operation of the correctional system. These facilities provide critical services that support all CDOC facilities, perform functions that are critical to the overall management and daily operation of the CDOC, or fulfill mandatory missions that cannot be cost-effectively transferred to other facilities.
Tier 2: Facilities best suited to meet the system’s projected custody level housing needs. These facilities house general population inmates in each classification category. They provide great value to the correctional system by virtue of the number and type of beds provided, cost efficiency, operational effectiveness, program offerings, and role-played in overall system management.
Tier 3: Facilities that may be considered for temporary or permanent closure depending upon long-term prison population trends. These facilities represent the least critical facilities in the correctional system and could be considered for temporary or permanent closure if the prison population classification level drops significantly. The types of beds offered in these facilities may not be aligned with the overall capacity needs of the CDOC. These facilities may present challenges in terms of efficient management and utilization, or may provide services and functions that could be more effectively provided by other facilities.
The following is a summary from the report for why facilities were placed into the tier’s they were: The Tier 1 facilities all provide essential functions for the correctional system.
Denver Reception processes in admissions to the prison system.
Denver Women’s is the primary facility for female offenders.
San Carlos is specifically designed to manage offenders with serious mental health issues.
The Colorado State Penitentiary (CSP) is the primary close custody facility for the state.
*Territorial, despite an aging physical plan, manages one of only two infirmaries in the correctional system and houses most of the elderly and special needs population.
The facilities categorized in Tier 2 provide the bulk of the correctional system’s capacity, particularly in the critical medium custody category. Recent revisions in the Department’s offender classification system indicate a significant redistribution of the population into medium custody. CNA’s analysis of the Tier 3 facilities concludes that while these facilities are currently necessary and provide good programs, they are less essential to the core functions of the CDOC. Accordingly, in the event of a significant drop in the prison population, these facilities should receive serious consideration for closure.
A potential change in re-entry programming from a centralized to a decentralized model currently under consideration by the CDOC could make the Cheyenne Mountain Re-Entry Center (CMRC) expendable.
Rifle’s remote location is problematic for a minimum custody facility pre-paring offenders to re-enter society.
20-Dec-2017 96 DOC-brf

Similarly, Kit Carson’s location makes staff hiring and the delivery of medical and mental health services comparatively difficult22.
Colorado Correctional Center has an aging physical plant and its historical site status makes needed updates to the facility difficult.
Four Mile and Skyline are limited to minimum and minimum-restricted custody offenders.
Finally, the Youthful Offender System (YOS) facility is not well-suited to support this program due to inadequate program and recreational facilities23.
22 The private prison operator of Kit Carson closed this facility in 2016. 23 The text in quotes is directly from page 3 of the 2016 Utilization 2.0 report. Since the publication of the study, the YOS multiuse support building (which includes a gym, music room, and library) was opened July 2017.
20-Dec-2017 97 DOC-brf

APPENDIX H 2017 INTERIM COMMITTEE LEGISLATION
Two 2017 legislative interim committees have received approval from Legislative Council to introduce legislation which could have a large fiscal impact. This appendix is intended to provide the Committee with an over of the legislation that will be introduced during the 2018 Session. The Committee may want to use a portion of the meeting time with the Joint Judiciary Committee in January 2018 to discuss the legislation.
2017 COUNTY COURTHOUSE AND COUNTY JAIL FUNDING AND OVERCROWDING
SOLUTIONS INTERIM STUDY COMMITTEE This committee received approval to introduce a bill titled “Concerning the Amount that the Department of Corrections is Required to Reimburse a County or City and County for the Confinement and Maintenance in a Local Jail of Any Person who is Sentenced to a Term of Imprisonment in a Correctional Facility.” Bill Description Under current law, the General Assembly establishes in the annual General Appropriations bill the amount that the Department of Corrections must reimburse a county or city and county for a portion of the costs incurred in confining and maintaining in a local jail a person who is sentenced to a term of imprisonment in a correctional facility. The bill establishes this amount in statute as $108.78 per day. Estimated Fiscal Impact as Prepared by Legislative Council Fiscal Note Staff Under current law, the Department of Corrections pays $54.39 per person per day to reimburse county jails for housing DOC offenders. For a full year, this amounts to about $15.0 million for 758 beds. Assuming the same inmate population for FY 2018-19, this bill will increase the annual amount needed to reimburse county jails to about $30.0 million. This increase will vary in future years based on the number of actual beds funded. For FY 2017-18, it was assumed that the new rate would take effect in June 2017, increasing DOC expenditures for the current fiscal year by $1,254,007. This appropriation may vary depending on the inmate population and the date this law is passed.
20-Dec-2017 98 DOC-brf

2017 SENTENCING IN THE CRIMINAL JUSTICE SYSTEM INTERIM STUDY COMMITTEE
MANDATORY PAROLE PERIOD LEGISLATION This committee received approval from Legislative Council to introduce a bill titled “Concerning Lowering the Period of Mandatory Parole from Five years to Three years for certain Felony Offenses.” Under current law, the length of a mandatory parole sentence for a class 2 or 3 felony is five years. The bill reduces the length of mandatory parole for a class 2 or 3 felony to three years. Estimated Fiscal Impact as Prepared by Legislative Council Fiscal Note Staff The December 2016 Legislative Council Staff forecast anticipates that 9,052 offenders will be admitted to prison during FY 2018-19. It is assumed that approximately 105 offenders will be admitted because of a class 2 felony sentence and 475 offenders will be admitted as a result of a class 3 felony sentence. For fiscal years beyond FY 2018-19, these figures are grown by the State Demography Office population forecast. Actual admissions will vary greatly as a result of demographic, criminological, prosecutorial, judicial, and policy factors, and cannot be estimated with accuracy over this length of time. This fiscal note assumes that the bill will reduce parole caseload by 300 offenders during FY 2028-29, 700 offenders during FY 2030-31, and 935 offenders during FY 2038-39.
SENTENCING PRACTICES LEGISLATION This committee also received approval to introduce a bill titled “Concerning Requiring the Colorado Commission on Criminal and Juvenile Justice to Contract for a Study of Effective Criminal Sentencing Practices.” The bill directs the Colorado commission on criminal and juvenile justice (commission) to contract for a study of the most effective criminal sentencing practices available. The commission must establish an advisory committee to review the study and make recommendations regarding changes to the Colorado sentencing scheme based on the study. The following table summarizes the fiscal impact of the bill.
20-Dec-2017 99 DOC-brf

APPENDIX I PRIVATE PRISON RESPONSE LETTERS TO COMMITTEE
INQUIRIES ON OPERATIONAL COSTS Core Civic and The Geo Group responded to the Committee’s September 2017 letters asking about the cost to reopen and operate a private prison in Colorado. Included on the following pages are copies of the responses sent to the Committee.
20-Dec-2017 100 DOC-brf

Damon T. Hininger
President and CEO
CoreCivic Facility Support Center
November 1, 2017 Senator Kent Lambert, Chair Joint Budget Committee 200 East 14th Avenue 13th Floor Legislative Services Building Denver, CO 80203 Dear Senator Lambert: CoreCivic appreciates the opportunity to respond to your request from September 20th with a cost estimate to open an additional private prison under private prison management in Colorado. CoreCivic owns four facilities in Colorado: Bent County Correctional Center (Las Animas), Crowley County Correctional Center (Olney Springs), Kit Carson Correctional Center (Burlington), and Huerfano County Correctional Center (Walsenburg). CoreCivic currently houses approximately 3,100 Colorado offenders at the Bent and Crowley Correctional Centers. Huerfano County Correctional Center closed in 2010 and Kit Carson Correctional Center closed in 2016 as a result of available bed capacity in state-operated facilities. CoreCivic recently responded to the Department of Corrections' request for a potential short term lease of the Huerfano County Correctional Center. Under the terms of a proposed lease, the facility would be operated by the Department and CoreCivic would provide maintenance and facility repairs. The size and location of our Huerfano facility is a good fit to meet the CDOC's current need for beds and we are hopeful the lease arrangement will come to fruition. A lease arrangement also provides maximum flexibility as the state explores options for addressing its prison capacity challenges. CoreCivic is proud of our more than 600 Colorado employees who have been providing correctional and re-entry services to the State for over 20 years. CoreCivic would welcome the opportunity to re-open our Burlington and Walsenburg facilities. Given however the significant role staff plays in a correctional facility, we would need an operating contract that provides significantly more time than the seven (7) months duration potentially envisioned in a lease. Unlike a lease, in keeping with a traditional private operations agreement, CoreCivic would need to hire several hundred new staff which in order to attract we would have to have a multi-year contract from the State.
20-Dec-2017 101 DOC-brf

Senator Kent Lambert Page 2 of 2
November 1, 2017
10 Burton Hills Blvd, Nashville, TN 37215 p. (615) 263-3000 / f. (615) 263-3140 www.corecivic.com
Based on an initial review of operating requirements at our Burlington and Walsenburg facilities, we anticipate the cost to open and operate one of our vacant facilities in Colorado would require a per diem range of $67.00 to $75.00. Narrowing that range estimate and providing the committee with a more specific per diem rate is difficult due to uncertainty regarding population size, program and staffing requirements. Additionally, it depends which facility (Kit Carson or Huerfano) would be selected, as property taxes, local employment conditions and community involvement vary from location to location. The rate assumes full facility utilization and no impact upon current population levels in the Bent and Crowley facilities. Under the traditional public-private correctional partnership in Colorado, the State pays a daily amount to the operator based on each offender under the operator's care. The per diem or private prison provider rate has always been set by the Joint Budget Committee annually. In previous years, Joint Budget Committees have increased the per diem rate when possible, decreased the per diem rate when necessary or continued a flat rate from the prior year. Unfortunately, given the long term pressure on the state’s budget, the current per diem rate has not kept up with the long term rate of inflation. CoreCivic believes in the delivery of life-changing reentry programming and high-quality corrections and detention services. Our commitment to safety is built upon our mission to better the public good. CoreCivic values our longstanding relationship with the state of Colorado. Thank you for the opportunity to provide the above information and we hope that it is helpful to the Committee. Sincerely,
Damon Hininger President and Chief Executive Officer CoreCivic cc: John Ziegler, Staff Director, Joint Budget Committee Megan Davisson, Joint Budget Committee Staff
20-Dec-2017 102 DOC-brf

20-Dec-2017 103 DOC-brf

20-Dec-2017 104 DOC-brf

JBC Staff FY 2018-19 Briefing
Department of Corrections
Presented by:
Megan Davisson, JBC Staff
December 20, 2017

2
DECISION ITEMS NOT COVERED IN BRIEFING ISSUES
R4 Medical Caseload
R5 La Vista Food Service
R6 DeCORuM Operating
R7 Interstate Probation Position Transfer
R8 Parole Caseload
R9 Community Supervision Caseload
R10 Community Provider Rate
BRIEFING PAGES 7-12

3
BRIEFING PAGES 13-21
ISSUE #1 OVERVIEW OF THE COLORADO CORRECTIONAL SYSTEM
Issue Summary: The Colorado correctional system is broken into five phases: laws, sentencing, incarceration, parole, and community
corrections. Offenders typically move through the first two phases once per crime, but may visit the last three phases multiple times.
The Colorado correctional system is largely funded with General Fund. The system encompasses programs within the Department
of Corrections, a portion of the Judicial Branch, and Department of Public Safety. This informational issue will provide a brief
overview of each phase.
PHASES COVERED IN THIS ISSUE
Phase 1
Phase 2
Phase 3
Phase 4
Phase 5

4
Where laws are
established,
amended, or
repealed.
Phase 1
Where an
offender is
either:
(a) on
probation
or
(b) in prison
Phase 3
Where an
individual first
encounters law
enforcement and
violates existing
laws.
If guilty of
violating the
law, individual
becomes an
offender.
Phase 2
Parole Board
can:
(a) Release an
offender or
(b) Table or
(c) Defer
parole
Where an
offender in
prison meets
with the Parole
Board
regarding
possibility of
parole.
Phase 4 Phase 5
Community
Corrections
PHASES OF THE COLORADO CORRECTIONAL SYSTEM

5
No issues in this
document.
Phase 2
DOC Issue #5
Phase 4
PHASES OF THE COLORADO CORRECTIONAL SYSTEM
No issues in this
document.
Phase 1
Appendix H
DOC Issue #2
Phase 3
DOC Issue #3
DOC Issue #4
Phase 5
DCJ Issue #1
DCJ Issue #2
DCJ Issue #3
DOC Issue #1 – Overview of the Colorado Correctional System

6
Laws
Courts
Jail
Community
Corrections
Parole Board
Police/Charges
Prison
Probation
Parole
PATHS THROUGH THE COLORADO CORRECTIONAL SYSTEM

7
Level 1
Level I
1. Colorado Correctional Center
2. Delta Correctional Center
3. Rifle Correctional Center
4. Skyline Correctional CenterLevel 2
Level II
1. Arrowhead Correctional Center
2. Four Mile Correctional Center
3. Trinidad Correctional Facility
Level 3
Level III
1. Arkansas Valley Correctional
Facility
2. Buena Vista Correctional Facility
3. Territorial Correctional Facility
4. Fremont Correctional Facility
5. La Vista Correctional Facility
6. Bent County Correctional Facility
7. Crowley County Correctional
Facility
8. Cheyenne Mountain Reentry Center
Level 3
Level III
1. Arkansas Valley Correctional
Facility
2. Buena Vista Correctional Facility
3. Territorial Correctional Facility
4. Fremont Correctional Facility
5. La Vista Correctional Facility
6. Bent County Correctional Facility
7. Crowley County Correctional
Facility
8. Cheyenne Mountain Reentry CenterLevel 4
Level IV
1. Limon Correctional Facility
Level 4
Level IV
1. Limon Correctional Facility
Level 5Level 5
Level V
1. Centennial Correctional Facility
2. Colorado State Penitentiary
3. Denver reception & Diagnostic
Facility
4. Denver Women’s Correctional
Facility
5. San Carlos Correctional Facility
6. Sterling Correctional Facility
PHASE 3 – INSTITUTIONAL CUSTODY LEVELS

8
$76.94$82.45
$95.87
$107.16
$124.93
$62.13
$0
$20
$40
$60
$80
$100
$120
$140
Level I Level II Level III Level IV Level V Private
PHASE 3 – AVERAGE DAILY COST BY CUSTODY LEVEL
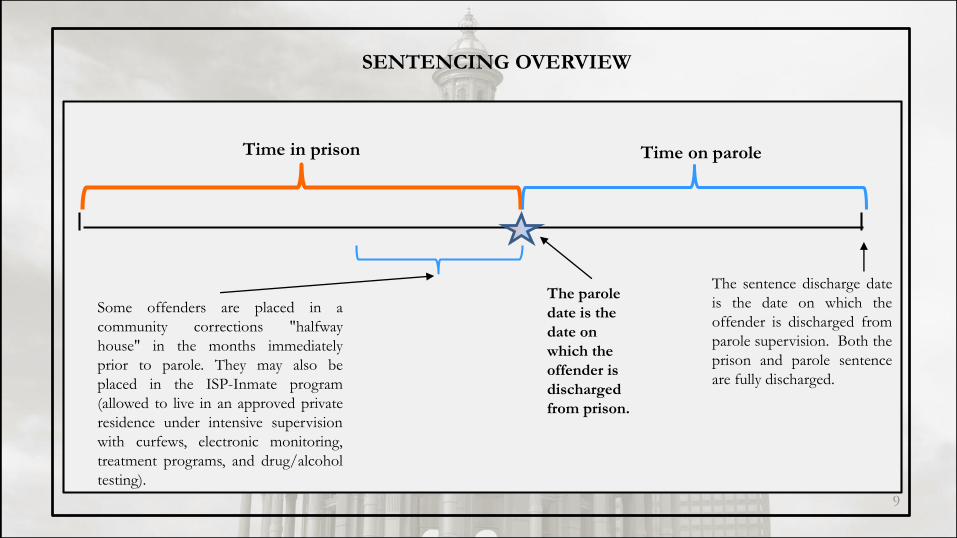
9
Time in prison Time on parole
Some offenders are placed in a
community corrections "halfway
house" in the months immediately
prior to parole. They may also be
placed in the ISP-Inmate program
(allowed to live in an approved private
residence under intensive supervision
with curfews, electronic monitoring,
treatment programs, and drug/alcohol
testing).
The parole
date is the
date on
which the
offender is
discharged
from prison.
The sentence discharge date
is the date on which the
offender is discharged from
parole supervision. Both the
prison and parole sentence
are fully discharged.
SENTENCING OVERVIEW

10
PAROLE TYPES – MANDATORY RELEASE AND PROLE ELIGIBILITY
Parole range upon arrival
in prison
Prison sentence imposed by court
PED MRD
Time in prison
Time on parole
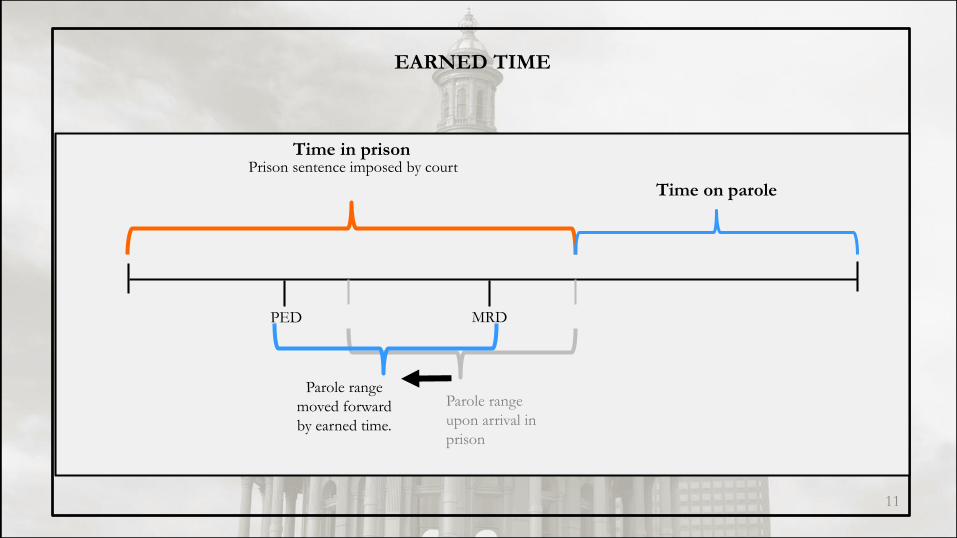
11
Prison sentence imposed by court
Parole range
upon arrival in
prison
PED MRD
Time in prison
Time on parole
EARNED TIME
Parole range
moved forward
by earned time.

12
Time in prison
Initial
Sentence
discharge
date
Initial Mandatory Parole Period
Mandatory
Parole Period
with Earned
Time
Parole revocation.
Offender
reincarcerated for
parole
violation(s).
Parole revocation.
Offender
reincarcerated a
2nd time for more
parole
violation(s).
PAROLE VIOLATIONS AND SENTENCE DISCHARGE DATE

13
BRIEFING PAGES 22-30
ISSUE #2 PRISON UTILIZATION AND R2 PRISON CAPACITY
Issue Summary: The recent prison population dropped from a high of 20,144 in July 2017 to 19,718 on November 30, 2017. The
population is projected to raise by up to 244 offenders by the end of FY 2017-18. The population is projected to increase beyond
current system capacity by the end of FY 2018-19. Based on the projections, the prison population will grow between 700 to 1,200
offenders in FY 2018-19. Currently the Centennial South Correctional Facility is vacant. The 2016 Prison Utilization Study Update
recommended structural changes to three facilities to increase the capacity of the State to house offenders.
PHASES COVERED IN THIS ISSUE
Phase 3

14
14,500
15,000
15,500
16,000
16,500
17,000
17,500
18,000
18,500
Total Prison Population by Gender
Male Pop. Female Pop.

15
0.0%
0.5%
1.0%
1.5%
2.0%
2.5%
3.0%
3.5%
4.0%
0
100
200
300
400
500
600
700
Number and Percentage of Vacant State Beds
No. Vacant Beds % of Vacant Beds

16
18,500
19,000
19,500
20,000
20,500
21,000
21,500
22,000
22,500
6/
1/2017
12/
1/
2017
6/
1/2018
12/
1/
2018
6/
1/2019
12/
1/
2019
6/
1/2020
Actual and Projected Prison Population June 2017 through June 2020
DCJ Leg Council Actual

17
FACILITY CURRENT PROPOSED CHANGE
DRDC 572 552 (20)
Centennial South 0 948 948
CCF North 320 336 16
CTCF – Central Transportation Unit 124 0 (124)
La Vista Correctional Facility –
Southern Transportation Unit (Males)30 0 (30)
La Vista Correctional Facility (Females) 560 590 30
Total Capacity Change 820
STATE BED CHANGE BASED ON 2016 PRISON UTILIZATION
STUDY UPDATE RECOMMENDATIONS

18
BRIEFING PAGES 31-40
ISSUE #3 CORRECTIONAL OFFICER STEP PLANS AND R1 STAFF RETENTION
Issue Summary: The Department has requested $3,336,294 total funds, of which $3,292,961 is General Fund for a 5.0 percent salary
increase to employees within the Correctional Office I and II, Correctional Support Trades Supervisor I, Nurse I and III, and Mid-
Level Provider classifications with two to seven years of service. The primary purpose of the Department’s request is to improve
staff retention, align with other law enforcement agencies, and provide a safe work environment within institutions. In place of the
5.0 percent increase, JBC staff proposes the General Assembly fund a step plan for Correctional Officers I, II and Correctional
Support Trades Supervisor I in FY 2018-19.
PHASES COVERED IN THIS ISSUE
Phase 3

19
Correctional Officer I
“Officer”
Correctional Officer II & Correctional
Support Training Supervisor I
“Sergeant”
Correctional Officer III
“Lieutenant”
Correctional Officer IV
“Captain”
Correctional Officer IV
“Major”
CORRECTIONAL OFFICER PROGRESSION

20
0.0%
5.0%
10.0%
15.0%
20.0%
25.0%
0
500
1,000
1,500
2,000
2,500
3,000
3,500
4,000
FY 11-12 FY 12-13 FY 13-14 FY 14-15 FY 15-16 FY 16-17
Turnover of COI, COII, CSTSI
Existing New Percent of New Employees

21
FY 2016-17
FY 2014-15
FY 2015-16
FY 2013-14
FY 2012-13
Step 1
Step 2
Step 3
Step 4
Step 5
OPTION 1 – ALL IN
FY 2016-17
FY 2014-15
FY 2015-16
FY 2013-14
FY 2012-13
Step 1
Step 2
Step 3
OPTION 2 – DOUBLED UP STEPS
FY 2011-12
STEP PLAN OPTIONS

22
$0
$500
$1,000
$1,500
$2,000
$2,500
$3,000
$3,500
$4,000
$4,500
$5,000F
Y 0
5-0
6
FY
06-0
7
FY
07-0
8
FY
08-0
9
FY
09-1
0
FY
10-1
1
FY
11-1
2
FY
12-1
3
FY
13-1
4
FY
14-1
5
FY
15-1
6
FY
16-1
7
Correctional Officer I Comparison of Average Monthly Base Salary with Associated Step
Average Salary Step Plan

23
$0
$1,000
$2,000
$3,000
$4,000
$5,000
$6,000
FY
05-0
6
FY
06-0
7
FY
07-0
8
FY
08-0
9
FY
09-1
0
FY
10-1
1
FY
11-1
2
FY
12-1
3
FY
13-1
4
FY
14-1
5
FY
15-1
6
FY
16-1
7
COII Comparison of Average Monthly Base Salary with Associated Step
Average Salary Step Plan

24
$0
$1,000
$2,000
$3,000
$4,000
$5,000
$6,000
FY
05-0
6
FY
06-0
7
FY
07-0
8
FY
08-0
9
FY
09-1
0
FY
10-1
1
FY
11-1
2
FY
12-1
3
FY
13-1
4
FY
14-1
5
FY
15-1
6
FY
16-1
7
CSTSI Comparison of Average Monthly Base Salary with Associated Step
Average Salary Step Plan

25
BRIEFING PAGES 41-43
ISSUE #4 HEPATITIS C TREATMENT (R3)
Issue Summary: The Department has requested $16.5 million General Fund to treat an additional 632 offenders infected with
Hepatitis C. If this request is approved, the Department will have $20,514,144 General Fund to treat 784 total offenders with
Hepatitis C. The Department is being sued by the American Civil Liberties Union for failure to treat all offenders with Hepatitis C.
The lawsuit seeks to obtain treatment for all offenders with Hepatitis C. There are currently thirteen other states that have been, or
are being, sued for failure to treat offenders with Hepatitis C.
PHASES COVERED IN THIS ISSUE
Phase 3

26
BRIEFING PAGES 44-45
ISSUE #5 PAROLE BOARD HEARING TOPICS
Issue Summary: Each year the Committee sets aside time in the schedule for a hearing with the Parole Board. This issue provides a
summary of topics the Committee may wish to discuss with the Parole Board during their hearing.
PHASES COVERED IN THIS ISSUE
Phase 4

JBC Staff FY 2018-19 Briefing
Department of Public Safety(Division of Criminal Justice Only)
Presented by:
Megan Davisson, JBC Staff
December 20, 2017

28
DECISION ITEMS NOT COVERED IN BRIEFING ISSUES
R5 Planning and Communications Office Capacity Building
R8 Colorado Commission on Criminal and Juvenile Justice
R10 Community Provider Rate
BRIEFING PAGES 7-8

29
BRIEFING PAGES 9-12
DCJ ISSUE #1 OVERVIEW OF THE OFFICE OF COMMUNITY CORRECTIONS
Issue Summary: The Office of Community Corrections oversees community corrections providers and facilities and administers
funding to the local Community Corrections Boards. This issue provides an overview of the community corrections system,
including types of providers and facilities, how offenders enter a community corrections program, and services offered.
PHASES COVERED IN THIS ISSUE
Phase 5

30
Community Corrections
Referral
Parole Board Requirement as
Condition of Parole
Diversion Sentence from
Courts
Parole Violation – Condition
in Lieu of Prison
Courts
Prison
Parole Board
Parole Board
Parole and
Probation Officers
HOW OFFENDERS GET TO COMMUNITY CORRECTIONS

31
HOW OFFENDERS GET REFERRED TO COMMUNITY CORRECTIONS FROM PRISON
Community Corrections
Referral
County Community
Corrections Board
Yes No
Community Corrections
Provider
Yes No
NoYesIn most cases –
a No on this
chart means the
offender
remains in
prison.
An offender can be referred
to community corrections
three times by their DOC
Case Manager

32
# of Facilities in
District
No Facility in District
Facility
Pending/Planned

33
Regular
Residential
Programs (32)
Non-Residential
Programs (27)
Intensive
Residential
Treatment (8)
Residential
Dual
Diagnosis
Treatment (8)Sex Offender
Supervision and
Treatment (11)Therapeutic
Communities
(2)
Cognitive
Behavioral
Therapy (1)
TYPES OF COMMUNITY CORRECTION PROGRAMS

34

35
Community Corrections
Referral
Parole Board
Requirement as
Condition of Parole
Diversion Sentence from
Courts
Parole Violation –
Condition in Lieu of
Prison
Courts
Prison
Parole Board
Parole Board
Probation Officers
Parole Officers
Transition
Offenders
Diversion
Offenders
TYPES OF OFFENDERS IN COMMUNITY CORRECTIONS

36
Housing
Food
Provision of treatment services –
specialized providers
Provision of education
services – all providers
Provider Service Requirements
Compliance with Division of
Criminal Justice standards
Employment
Payment of financial
responsibilities
Clothing
Compliance with behavioral
and facility rules
Offender Requirements
SERVICES AND REQUIREMENTS OF COMMUNITY CORRECTION PROGRAMS

37
BRIEFING PAGES 13-20
DCJ ISSUE #2 COMMUNITY CORRECTIONS UTILIZATION
Issue Summary: This issue looks at the historical and current utilization of community corrections. This issue also looks at the type
of offender referred to community corrections, as well as, the type of offender who would gain the most benefit from community
corrections.
PHASES COVERED IN THIS ISSUE
Phase 5

38
1,000
1,100
1,200
1,300
1,400
1,500
1,600
1,700
1,800
FY
08-0
9
FY
09-1
0
FY
10-1
1
FY
11-1
2
FY
12-1
3
FY
13-1
4
FY
14-1
5
FY
15-1
6
FY
16-1
7
Number of Diversion and Transition Placements in Community Corrections
Diversion Transition

39
0.0%
1.0%
2.0%
3.0%
4.0%
5.0%
6.0%
7.0%
8.0%
9.0%
10.0%
16,000
16,500
17,000
17,500
18,000
18,500
19,000
19,500
20,000
20,500
FY
08-0
9
FY
09-1
0
FY
10-1
1
FY
11-1
2
FY
12-1
3
FY
13-1
4
FY
14-1
5
FY
15-1
6
FY
16-1
7
DO
C P
riso
n P
op
ula
tio
n
Community Correction Referrals as Percent of DOC Prison Population
Total DOC population CC Referrals as % of Total Pop

40
1,466
1,318 1,343 1,280
1,143
1,547 1,582 1,608
1,553 1,616
0
200
400
600
800
1,000
1,200
1,400
1,600
1,800
FY 12-13 FY 13-14 FY 14-15 FY 15-16 FY 16-17
If Community Correction Referrals Had Been Maintained at 8.9 percent of DOC Population
Transition If Maintained 8.9 percent

41
14.4%
17.6% 17.8%
20.7%
22.0%
24.0%
25.2%
28.2%
0.0%
5.0%
10.0%
15.0%
20.0%
25.0%
30.0%
FY 08-09 FY 09-10 FY 10-11 FY 11-12 FY 12-13 FY 13-14 FY 14-15 FY 15-16
Mental Illness Rate Of Offenders in Community Corrections

42
BRIEFING PAGES 21-27
DCJ ISSUE #3 FUNDING FOR COMMUNITY CORRECTIONS
Issue Summary: The current budgeting and contracting structure for community corrections does not account for the quality of
provider services and outcome measures. The Committee discussed, during the FY 2013-14 budget process, how the Division could
implement performance based contracting for community corrections, but tabled the issue because of the complexity. In 2017 the
Division of Criminal Justice released new standards for community corrections providers. As part of the new standards, the
Department began using the Program Assessment for Correctional Excellence tool to evaluate community corrections providers.
The Program Assessment for Correctional Excellence tool provides a measurement standard the Division can use to implement
performance based contracting. Senate Bill 17-021 (Assistance to Released Mentally Ill Offenders) created a housing grant program
in the Department of Local Affairs. Funding for the program was a one-time transfer of the unexpended funds appropriated for
community corrections in FY 2016-17.
PHASES COVERED IN THIS ISSUE
Phase 5

43
0
500
1,000
1,500
2,000
2,500
3,000
3,500
4,000
4,500
5,000
$0.0
$10.0
$20.0
$30.0
$40.0
$50.0
$60.0
$70.0
$80.0
FY
10-1
1
FY
11-1
2
FY
12-1
3
FY
13-1
4
FY
14-1
5
FY
15-1
6
FY
16-1
7
Cas
elo
ad
Exp
end
iture
(in
mill
ion
s)
Community Corrections Expenditures and Caseload
Expenditures Community Correction Referrals

44
2010 Standards

45
1 6 8 12
DCJ initial data collection and
review of provider audio tapes.
DCJ staff at the
facility for on-
site data
collectionDCJ staff data entry,
analysis, and review.
DCJ staff provides
PACE assessment
report to facility
weeks are approximate
Strategic planning and
ongoing technical
assistance
PACE TOOL ASSESSMENT TIMELINE

46

47
PACE TOOL PRACTICES – PART 1

48
PACE TOOL PRACTICES – PART 2

49
PACE TOOL PRACTICES – PART 3

50
SENATE BILL 17-021
COMMUNITY CORRECTIONS REVERSIONS FY 2006-07
THROUGH FY 2016-17APPROPRIATION EXPENDITURE REVERSION
FY 2006-07 $44,981,089 $43,885,475 1,095,614)
FY 2007-08 47,456,881 46,900,963 (555,918)
FY 2008-09 51,380,099 50,085,976 (1,294,123)
FY 2009-10 52,951,463 50,733,241 (2,218,222)
FY 2010-11 54,443,786 52,559,455 (1,884,331)
FY 2011-12 56,441,796 53,579,207 (2,862,589)
FY 2012-13 53,781,933 53,030,594 (751,339)
FY 2013-14 58,789,749 56,490,160 (2,299,589)
FY 2014-15 65,969,196 63,135,355 (2,833,841)
FY 2015-16 65,424,062 62,389,012 (3,035,050)
FY 2016-17 67,437,308 62,353,921 (5,083,387)

JBC Staff FY 2018-19 Briefing
Department of Corrections and
Department of Public Safety (Division of Criminal Justice Only)
Presented by:
Megan Davisson, JBC Staff
Date, 2017