stability of air bubbles in fresh concrete
TRANSCRIPT
Stability of air bubbles in fresh concrete
Master of Science Thesis in the Master’s Programme Structural engineering and
Building Performance Design
QI YANG
Department of Civil and Environmental Engineering
Division of Building Technology
Building Materials
CHALMERS UNIVERSITY OF TECHNOLOGY
Göteborg, Sweden 2012
Master’s Thesis 2012:99


MASTER’S THESIS 2012:99
Stability of air bubbles in fresh concrete
Master of Science Thesis in the Master’s Programme Structural engineering and
Building Performance Design
QI YANG
Department of Civil and Environmental Engineering
Division of Building Technology
Building Materials
CHALMERS UNIVERSITY OF TECHNOLOGY
Göteborg, Sweden 2012

II
Stability of air bubbles in fresh concrete
Master of Science Thesis in the Master’s Programme
QI YANG
© QI YANG, 2012
Examensarbete / Institutionen för bygg- och miljöteknik,
Chalmers tekniska högskola 2012:99
Department of Civil and Environmental Engineering
Division of Building Technology
Building Materials
Chalmers University of Technology
SE-412 96 Göteborg
Sweden
Telephone: + 46 (0)31-772 1000
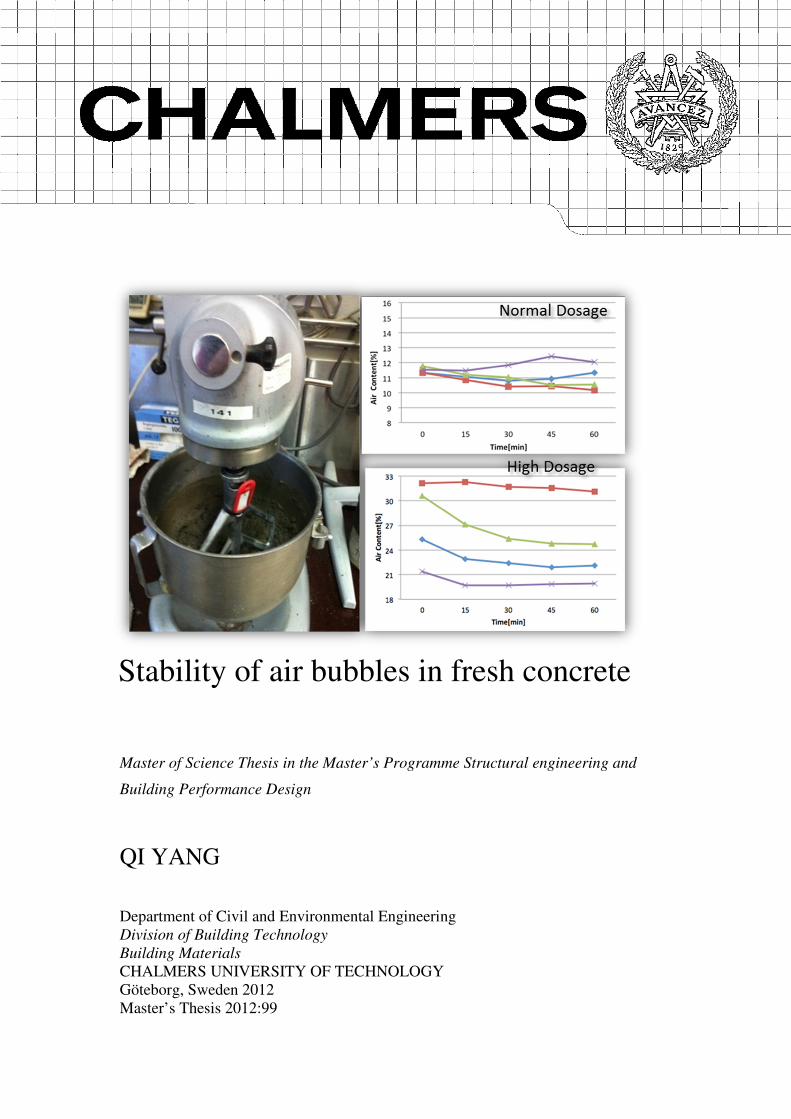
Cover:
Mortar mixer and results from the air content measurement
Chalmer reproservice / Department of Civil and Environmental Engineering
Göteborg, Sweden 2012

III
Stability of air bubbles in fresh concrete
Master of Science Thesis in the Master’s Programme
QI YANG
Department of Civil and Environmental Engineering
Division of Building Technology
Building Materials
Chalmers University of Technology
ABSTRACT
The use of air-entraining agents to (AEAs) improves not only the freeze-thaw
resistance of concrete but also the properties of fresh concrete, such as the flowability,
the resistance to segregation, the resistance to bleeding, and the improved finishing
quality. However, the key question is how to properly entrain the desired air bubbles
and how these can be stably kept in the concrete (from fresh to hardened state). There
are many factors in the procedure of concrete production that can influence the air
bubbles in concrete and it is therefore important to understand the most influencing
factors on air bubble stability.
In this study, four kinds of air-entraining agents, including synthetic (SikaAer-S,
called as Sika-S) and natural ones (GYQ, Sika 88L and BASF Micro Air), were
studied and compared with regard to their ability to entrain air and stabilize it. In these
experiments, gravimetrical method was used to measure the air content and the
stability of air bubbles in fresh concrete during one hour while the air void analyzer
was used to measure the air void system including the air content and size distribution.
The measurements were taken both at normal dosages and the maximum dosage of
AEAs. The results of this study primarily show that Sika-S performances well in
entraining and stabilizing air bubbles at a high dosage. GYQ was good in stabilizing
the air bubbles but cannot entrain as much air as Sika-S.
To further study the influence of entrainment and stability in fresh concrete the effect
of three kinds of cementitious materials were investigated at the maximum dosage. It
seems that the cement with higher alkali content leads to increased air entrainment.
While the cement blended with slag produces better air void system. At this time, it
can be seen that although the total air content by GYQ is less than Sika-S, the content
of efficient air bubbles are almost the same.
Based on the results in this study, it is possible to take the advantage of each material
in cooperation with air entraining agent for entraining and stabilizing desired air
bubbles.
Key words: air entrainment, AEAs, air bubbles, stability, air size distribution,
cementitious materials

IV

CHALMERS Civil and Environmental Engineering, Master’s Thesis 2012:99 V
Contents
ABSTRACT III
CONTENTS V
PREFACE VII
NOTATIONS VIII
1 INTRODUCTION 1
1.1 Background 1
1.2 Purpose 1
1.3 Method 1
1.4 Limitations 2
2 AIR BUBBLES IN FRESH CONCRETE 3
2.1 Function of air bubbles in concrete 3
2.1.1 Function of air bubbles in hardened concrete 3
2.1.2 Function of air bubbles in fresh concrete 3
2.2 Formation and stabilization of the air voids in fresh concrete 4
2.2.1 Mechanism of air entrainment 4
2.2.2 Air entraining agent in fresh concrete 4
2.3 Factors affecting air entrainment in concrete 5
2.3.1 Mixing 5
2.3.2 Mixture 5
2.3.3 Temperature 6
2.3.4 Other factors 7
2.4 Some observations of air entrainment in fresh concrete 7
2.4.1 Effect of entrained air on concrete properties 7
2.4.2 Observations of factors influencing entrained air 8
3 EXPERIMENTAL WORK 9
3.1 Materials 9
3.1.1 Air entraining agents 9
3.1.2 Cements 11
3.1.3 Sand 11
3.2 Test procedure and equipment 12
3.2.1 Mortar test 12
3.2.2 Gravimetric method 13
3.2.3 Air void analyzer (AVA) test 14
4 RESULT AND ANALYSIS 16

CHALMERS, Civil and Environmental Engineering, Master’s Thesis 2012:99 VI
4.1 Effect of different kinds of AEAs 16
4.1.1 Comparison of air content 16
4.1.2 Comparison of stability 17
4.1.3 Comparison by AVA 19
4.2 Effect of AEAs in Different Cementitious Materials 27
4.2.1 Akmenes cement 28
4.2.2 Akmenes cement with slag 29
4.2.3 Comparison of Anläggningscement, Akmenes cement and Akmenes
cement with slag 30
5 DISCUSSION 36
5.1 Discussion on the tests and the results 36
5.1.1 Discussion on the limitation of the tests 36
5.1.2 Discussion on the results 36
6 CONCLUSION AND FURTHER STUDIES 38
6.1 Conclusions 38
6.2 Future studies 38
7 REFERENCES 39
APPENDIX A 40
APPENDIX B 42

CHALMERS Civil and Environmental Engineering, Master’s Thesis 2012:99 VII
Preface
In this study, mortar tests have been done with four kinds of air entraining agents. The
tests have been carried out from January 2012 to March 2012.This laboratory work is
an important part of the project which gives me a data-based way to study the
characteristic of bubbles in fresh concrete. The project is carried out at the C. Lab of
Thomas Concrete Group AB and Chalmers University of Technology, Sweden.
I would like to thank my supervisors, Tang Luping and Ingemar Löfgren; they helped
me a lot during this project work. I would also like to thank Oskar Esping who gave
me a lot of help during the laboratory work. Furthermore, I appreciate the helps I got
during this project work.
Göteborg June 2012
Qi Yang

CHALMERS, Civil and Environmental Engineering, Master’s Thesis 2012:99 VIII
Notations
Vair as the air content determined by volume
d ryρ
as the density of the fully dry material
cementρ
as the density of cement
.aggρ as the density of aggregate
waterρ
as the density of water
bulkρ
as the density of the container
cementM
as the weight of cement
.aggM as the weight of aggregate
waterM
as the weight of water
bulkM
as the weight of the container
wc as the water cement ratio

CHALMERS, Civil and Environmental Engineering, Master’s Thesis 2012:99 1
1 Introduction
1.1 Background
Air entrainment was first discovered in the mid-1930s by accident, after that the
technology of entraining air in concrete was widely used to improve the freeze-thaw
resistance of concrete, especially in cold-climate regions. [Kosmatka (1994)] Air
entraining agents (AEAs), which can be based on natural resins (for example vinsol)
or synthetic surfactants, were added to the concrete mix to increase the controlled
quantity of air in the form of microscopic bubble in cement paste. From the first usage
of air entrainers until now, many different kinds of air entrainers have been developed.
However, regardless of what kind of air entrainers, they all have similar properties or
functions, that is, all of them are powerful surfactants. The intention of using AEAs is
to get more stable and uniform air bubbles with small sizes homogeneously
distributed in the cement paste.
The fine air bubbles (the diameter smaller than300μm) in concrete can improve not
only concrete freeze-thaw resistance but also the workability of fresh concrete. Owing
to the improvement of workability of fresh concrete, the paste content in concrete can
be reduced, benefiting both environmental conservation and hardened properties of
concrete, such as reduced shrinkage and creep as well as reduced permeability.
In practice, however, the air bubbles in the concrete are very sensitive. There are
many factors that can influence air content and the air void system in the concrete
such as: paste composition; temperature of concrete mix; other chemical admixtures;
mixer type and mixing time; and even the quality of mixing water. All of these factors
make the process of entraining air more complicated. In addition, the air is also
influenced by processes such as transportation, pumping, and compaction. So this
project studied not only on how much air that can be entrained in the fresh concrete
by using different kinds of AEAs but also on how good the entrained air void system
were.
Today, many companies and research organisations are investigating how to entrain
more air bubbles with better air void system, how to make the air stable in concrete,
and which factors influence the air in concrete. By these investigations, a better
understanding of the principle of the air entrainment in concrete will be achieved.
1.2 Purpose
The project aims at investigating the stability of air bubbles in fresh concrete. The
results from this project is as the first step to find the best AEA for entraining the high
volume of air bubbles with satisfactory stability and good air void system in fresh
concrete. And then it is possible to discuss the sustainable way to improve the
properties of the fresh concrete by replacing fine particles and fillers with air bubbles
so as to reduce cement content in concrete.
1.3 Method
A literature study was conducted parallel with laboratory work. In the laboratory
study, mortar tests with four kinds of AEAs were studied with regard to the stability
of entrained air. Furthermore Air Void Analyzer (AVA), an apparatus able to measure
the air void characteristics of fresh concrete, was used to measure the air content,
specific surface areas, spacing factor and the size distribution of air bubbles. This

CHALMERS, Civil and Environmental Engineering, Master’s Thesis 2012:99 2
provides a way to study the changes of the air bubbles regarding their content and size
distribution in the fresh concrete with time.
The following methods were used during the laboratory work:
� Mortar tests, where the total air content was measured immediately after mixing
and then every 15 minutes up to 1 hour. These measurements included two air
entrainment levels: the normal air content and the maximum air content.
� Mortar tests to find the maximum air content for each of the four AEAs
investigated.
� The air void system was studied by measuring the specific surface area, spacing
factor and the size distribution with the “Air Void Analyzer” (AVA). These
measurements were on normal air content as well as on maximum air content.
1.4 Limitations
The investigation was limited to mortar test. The fine aggregate used was sea-dredged
sand with a maximum aggregate size of 2 mm. The w/c was chosen to 0.5. Since all
the AEAs used in this study were either in the form of powder or in high
concentration, which are hard to measure accurately, all the AEAs were diluted before
used. The liquid ones were diluted tenfold and the powder one was made into solution
before used. In order to get a normal air content which is around 5% in concrete and
around 11% in mortar by volume, the dosage of diluted AEAs was around 0.3% of the
cement content by weight. The temperature in the laboratory was around 19℃. The
temperature of water in AVA was22℃ ± 2℃ during the test.

CHALMERS, Civil and Environmental Engineering, Master’s Thesis 2012:99 3
2 Air Bubbles in Fresh Concrete
2.1 Function of air bubbles in concrete
2.1.1 Function of air bubbles in hardened concrete
The concrete paste is the mixture of cement and water. After their reaction the
concrete will become hardened along with the time. Some of the remaining water in
concrete would be lost by evaporation left with capillary pores, which will in turn
absorb water from the exposure environment. When the temperature drops below zero,
the water in the capillary pores will freeze. The freeze leads to an expansion (about
nine percent) in volume, which introduces hydraulic pressure in the unfrozen water in
the fine pores. When this pressure exceeds the tensile strength of paste or aggregate
the concrete will start to deteriorate in the form of scaling or cracking. This is
significant in a moist condition since the capillary pores would fully filled with water
from environment left less space for filling or transfer of unfrozen water due to the
expansion of ice formation. [FHWA Publication No. HIF-07-004 (2006)]
If there are air bubbles in the concrete, these bubbles or voids can hardly be saturated
by capillary absorption. Thus the bubbles supply the spaces for unfrozen water to fill
in under the expansion of ice formation in capillary pores. If the distance between air
bubbles is short enough, the hydraulic pressure can easily be released when the
unfrozen water flows to the bubbles.
So the main reason for entraining air in concrete is to improve the freeze-thaw
resistance of hardened concrete. To achieve this, there will be many air bubbles in the
concrete, and the effective bubbles, the air bubbles that can protect concrete from
damaging during freeze thaw cycles, will generally be in the range 0.02-1 mm. And
the spacing factor (L), which is defined as the average distance from any point in the
paste to the edge of the nearest void, should not exceed 0.2 mm. The fine air bubbles
in concrete proved space for water/ice expansion and relieve pressure on the
surrounding concrete. The air entrainment however leads to a reduction in strength of
the concrete. Each 1% of entrained air in hardened concrete would lead to the
reduction of 5% in strength. [Mindes et al. (2003)]
2.1.2 Function of air bubbles in fresh concrete
Air entrainment in fresh concrete can also improve the workability and cohesiveness
of fresh concrete. The fine air bubbles in fresh concrete act as many fine aggregates
with low friction and elastic which form a lubricating layer around solid particles so
as to improve the workability such as flowability, resistance to segregation, resistance
to bleeding, improved finishing quality, etc. So entraining more fine air bubbles with
stability can reduce the amount of fine particles such as cement and water required on
the same slump condition in concrete. This is a more sustainable way which benefits
both environmental conservation and hardened properties of concrete, such as reduced
shrinkage and creeps and reduced permeability due to reduced content of cement
paste. Moreover by reducing the water in concrete, this partially offset the reduction
of strength in hardened concrete caused by air entrainment.

CHALMERS, Civil and Environmental Engineering, Master’s Thesis 2012:99 4
2.2 Formation and stabilization of the air voids in fresh
concrete
2.2.1 Mechanism of air entrainment
Air bubbles are actually not formed by air entraining agents but stabilized by them.
However air bubbles formation and stability in fresh concrete are considered as two
separate processes that are equally important for the air void system. One is air
entrainment in fresh concrete which is by the mixing process. [Powers (1968)]
Another is air stabilization which is achieved by adding AEAs which form a
protective film around the air bubbles. There are a lot of factors that can generate and
influence air bubbles in concrete but these air bubbles are inherently unstable. The
interface between the dispersed air and their surrounding contain surface energy. So
there is a tendency to reduce the interfacial surface area, which can be explained by
thermodynamic theory. Without the presence of AEAs, the small air bubbles (higher
internal pressure) tend to coalesce to form larger bubbles (lower internal pressure)
which have a greater tendency to escape from the paste due to the much lower density.
In addition, the capillary flow leads to rupture of the lamellar film between the
adjacent bubbles; rapid hydrodynamic drainage of liquid between bubbles leading to
rapid collapse. [Myers (1999)]
All of these physical mechanisms discussed above indicate that pure liquid cannot
form stable air bubbles. The use of AEAs in concrete is an efficient way to stabilize
the air bubbles in concrete.
As the AEA molecules insert into the cement paste, the mutual attraction between
water molecules is reduced. And the absorbed AEA molecules at the surface of the
bubble form a film, with their polar heads in the water phase (hydrophilic head group)
and hydrophobic tail in air bubbles. If the molecule is charged, the bubbles can
contain both a negative and a positive charge. The electrostatic repulsion keeps
bubbles separated and prevents coalescence. [Dodson (1990)]
2.2.2 Air entraining agent in fresh concrete
Generally, a distinction is made between two kinds of air in concrete: one is entrapped
air (natural) and the other is entrained air. The entrapped air is created during the
mixing but is not wanted; it generally has a size more than 1 mm in diameter. Another
is entrained air (designed) which is expected with the size 10 to 100μm in diameter.
This type of air entrainment is needed for freeze-thaw protection. To achieve this, air
entraining agents are used to entrain or stabilize more of the desirable air. Normally,
there are three categories of AEAs: wood-derived products, vegetables acids, and
synthetic detergents. Generally speaking, the synthetic ones generate air quicker than
the organic ones; however, the organic ones show better compatibility with other
admixtures than the synthetic ones. [Whiting (1998)]
Regardless of how many categories of AEAs, they are mainly mixtures of various
surfactants. They stabilize air bubbles in concrete by changing the surface tension of
the mixing water and act at the air-water interface within the cement paste. Their
molecules always have hydrophilic and hydrophobic groups, by which it becomes
orientated into the aqueous phase with the hydrophobic group inward toward the air.
This also reduces the surface tension of the water which makes it easier to form the air
bubbles in the cement paste. At the same time the formation of air in the cement paste
is more stable and uniformly dispersed because of the “protection” around it (Figure

CHALMERS, Civil and Environmental Engineering, Master’s Thesis 2012:99 5
2.1). In fresh concrete the surfactants can be adsorbed and absorbed on solid (cement
particles) surface, can be adsorbed at the water-air interfaces and can be soluble in
mixing water. The amount of surfactant adsorbed or absorbed on solid surfaces
contributes little to the air bubble formation and stability. The amount of surfactant
concentrated at the liquid-air interface is responsible for forming and stabilizing the
entrained air bubbles by orientating at the interface to minimize the unfavourable
interaction between them. The amount of surfactant soluble in liquid is also essential
because these molecules can balance the surfactant molecules adsorbed or absorbed
on solid surfaces and at the water-air interface, which makes them in a transient
equilibrium state. [Lianxiang and Folliard (2005)]
Figure 2.1 Stable air bubble with AEA [Lianxiang and Folliard (2005)]
2.3 Factors affecting air entrainment in concrete
2.3.1 Mixing
As mentioned above, air bubbles in concrete are firstly entrained by mixing process.
Hence, the mixing is important factor which together with the aggregates can affect
air entrainment in concrete, since the large air bubbles can be split into smaller ones
by the movement of aggregates in the mixer.
From the viewpoint of work and energy, the formation of air bubbles in fresh concrete
can be explained as follows: The mixing action gives the energy to the fresh concrete
to create the interface between air and water and form the large air voids, and then
split them into small voids. However, there is a tendency that the small air voids
coalesce into larger ones. From the energy viewpoint it is clear that for the same
volume of air, the one contains small air voids has a larger specific surface area and
therefore higher energy than the one with large air voids, the latter can always more
easily escape from the paste due to its larger buoyant force. So the mixing action
(mixer, mixing time, revolution rate, etc.), can affect how much energy can be turned
into free surface energy of the air bubbles which balance the surface tension of the air
bubbles. For example, mixing with longer time can of course entrain more air in fresh
concrete by applying more work on the paste.
2.3.2 Mixture
The concrete mixture itself also plays an important role in the air entrainment and the
following factors influence the air:

CHALMERS, Civil and Environmental Engineering, Master’s Thesis 2012:99 6
� w/c ratio
Since the air bubbles must be formed in water, if the w/c ratio of the paste is too low,
it is hard to entrain air in the paste. On the other hand, if the w/c ratio is too high, the
small air voids can easily become large ones and then escape from the paste. It has
been reported that with the increased w/c ratio, the spacing factor in hardened
concrete will increase and the air void system become worse. [Yan Shang (2010)]
� Aggregate
The characteristics and grading of aggregates have also significant influence on air
entrainment. In paste it is more difficult to entrain air because the entrained air is
affected by buoyancy and there are no particles that can trap the air bubbles. In mortar
and concrete, because of the addition of aggregates, the fine aggregates can form a
space to hold the air bubbles and prevent them from escaping. Furthermore, aggregate
with a sharp shape, like crushed stone, will entrain less air than gravel. The sharper
the aggregate is the harder for the air bubbles to attach on it. [Dodson (1990)]
� Cement alkali level and supplementary cementitious material
The air content increases with increasing alkali level in the cement. This is because
the alkali environment in cement paste allows the AEAs to create more air. However,
high-alkali environment is not good for stabilizing the air bubbles and it also influence
the air void system.
Fly ash, ground granulated blast furnace slag, silica fume and so on are used as
supplementary cementitious materials frequently. Fly ash which contains carbon can
attract and absorb the surfactants in AEAs. [Kqlaots (2004)] Slag is normally used at
high dosage. It is usually finer than cement, so under the same condition using slag
may decrease the entrained air but improve the air void system. Silica fume does not
have significant influence on the air content and the stability of air bubbles; however,
because of its fineness, greater amounts of AEA are needed. [Nagi et al. (2007)]
� Chemical admixtures
It is complex to conclude what and how the chemical admixtures affect the air
entrainment. Most organic chemical admixtures like superplasticizer can increase the
air entrainment since it can partly reduce the absorbed AEA molecules on the solid
surface by competing with them. Other admixtures like retards, accelerators, etc.,
have minor effect on the air entrainment. However, today there are many kinds of
AEAs like wood-derived acid salts AEA, vegetable oil acids AEA and synthetic
detergents AEA, which may react with the chemical admixtures. This adds the
difficulty on the study of the influence of chemical admixtures on the air entrainment.
2.3.3 Temperature
The temperature of mixture can affect the air entrainment by many aspects. First of all,
as it is well known that higher temperature of water leads to the lower solubility of air
in water. Secondly, as Tattersall (1976) reported, at the same slump value the mixture
with higher temperature always gets higher viscosity and for the mixture with higher
viscosity entraining air will become more difficult. How temperature and pressure
affects the size of air bubbles in fresh concrete can be illustrated by the ideal gas law
equation: � = ���; when � is constant, with increasing temperature the volume of
air increases, resulting the bubbles with larger size which are unstable and, as a
consequence, the total entrained air content will be reduced. Moreover, the alkali
based AEAs react immediately with the calcium ions in the solution to form insoluble
CHALMERS, Civil and Environmental Engineering, Master’s Thesis 2012:99 7
salts which are capable of stabilizing the air bubbles in the mixture. The increased
temperature will increase the polyvalent ions in the solution which may react with the
salts around the air bubbles and destroy the protection film around the air bubbles.
The increased amount of electrolytes in the solution due to the higher temperature will
reduce the stability of air bubbles by reducing the electrostatically induced disjoining
pressure. [Dodson (1990)] At last, the hydration of the cement can be accelerated by
increasing temperature. The hydration products will adsorb or absorb more AEA
molecules from liquid phase. The mixture with less surfactant in the liquid phase will
reduce the ability in forming and stabilizing the air bubbles. [Myers (1999)]
2.3.4 Other factors
� Quality of mixing water
As it mentioned above, hard water with high concentration of polyvalent ions like
Ca2+
and Mg2+
will also decrease the air content.
� Vibration
If the time of high-frequency vibration is too long, the spacing factor of the air void
system will increase. [Yan Shang (2010)] This is because the long-time vibration may
make the small air voids merged together to form large ones.
� Pumping
The free fall and pressure are the main factors that influence the air entrainment when
pumping concrete. In the pumping process, letting the concrete to free-fall always
reduces the air content. However, most of the lost air bubbles are the coarse bubbles
which contribute less to the durability of concrete. [Hover (1989)] The compressing
and de-compressing of air bubbles in the pumping process can also alter the air void
system. Sometimes the uncontrolled depressurization will lead the coalescence of the
small air bubbles and let them escape from the mixture. [Fagerlund (1990)]
� Surface finishing
Finishing can affect the air content, but this is mainly at the surface and near-surface
of the concrete. Finishing may cause the loss of air in concrete by an effect similar to
the compressing and de-compressing as mentioned above. However, normally only
coarser voids can be affected.
2.4 Some observations of air entrainment in fresh concrete
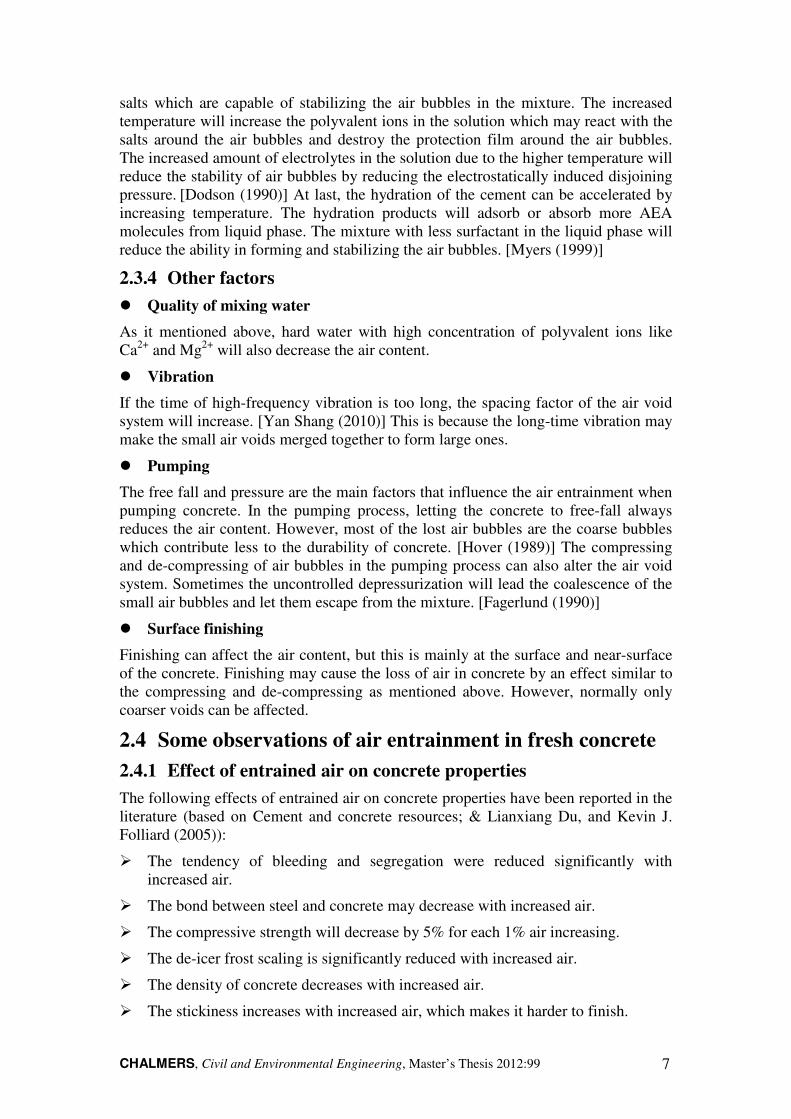
2.4.1 Effect of entrained air on concrete properties
The following effects of entrained air on concrete properties have been reported in the
literature (based on Cement and concrete resources; & Lianxiang Du, and Kevin J.
Folliard (2005)):
� The tendency of bleeding and segregation were reduced significantly with
increased air.
� The bond between steel and concrete may decrease with increased air.
� The compressive strength will decrease by 5% for each 1% air increasing.
� The de-icer frost scaling is significantly reduced with increased air.
� The density of concrete decreases with increased air.
� The stickiness increases with increased air, which makes it harder to finish.

CHALMERS, Civil and Environmental Engineering, Master’s Thesis 2012:99 8
� The effect on permeability of concrete with increased air is very little. However,
with increasing air content and equivalent compressive strength the w/c ratio need
to be decreased, which then can lead to a reduced permeability.
� The slump increases with increased air content, approximately the slump
increases 25 mm in slump for every 0.5 to 1 percentage increase in air.
� The thermal conductivity of the concrete decreases 1% to 3% per percentage
increase in air.
� The expansion due to alkali-silica reaction has been reported to decrease with
increased air.
2.4.2 Observations of factors influencing entrained air
The following observations of factors influencing entrained air have been reported in
the literature (based on Nagi, M. A., Okamoto, P. A., Kozikowski, R. L., and Hover,
K. (2007); Lianxiang Du, and Kevin J. Folliard (2005); & FHWA Publication No.
HIF-07-004):
� Air content decreases with the increased fineness of cementitious materials.
� Fine aggregates can entrain more air than coarse aggregates
� When the slump is less than 150 mm, the air content increases with an increase in
slump. However, above 150 mm, large air bubbles are more unstable due to
buoyant force to escape from the mixture, which reduce the air content
� With increased temperature the air content decreases.
� Maximum air content is achieved at normal mixing time. Mixing too short or too
long will both reduce the air content.
� Transportation may decrease the air content while pumping often decreases the
air content.
� With the use of other cementitious materials, like fly ash and slag, a higher
dosage of AEA is required compared with using Portland cement only in the
same condition.
� The influence of other chemical admixtures for air entrainment is complex.
Normally, most organic chemical admixture can increase the air entrainment.

CHALMERS, Civil and Environmental Engineering, Master’s Thesis 2012:99 9
3 Experimental Work
Mortar tests with different air entraining agents (SikaAer-S, GYQ, Sika 88 L, and
BASF Micro Air) and different cements (Akmenes Cement and Anläggningscement)
have been carried out and the total amount of air and the air void system have been
studied.
3.1 Materials
3.1.1 Air entraining agents
Four kinds of air entrainers were used in the mortar test to compare their ability of
entraining air and their formed air void system.
� SikaAer-S (called Sika-S thereafter): It is provided by Sika Sverige AB in
Sweden. It is a transparent liquid and is based on a synthetic surfactant. The
technical data of Sika-S is shown in table 3.1 below:
Table 3.1 Technical data of Sika-S
Colour and shape Transparent liquid
Density 1.01 kg / dm ³
pH value Approximately 7
Chloride content <0.10% by weight of the solvent
Alkaline Content, eq. Na2O <0.5% by weight of the solvent
Solids Approximately 4.5%
Viscosity Light liquid
Sika-S was used by solution in this study which was diluted to 0.45% solid
content.
� GYQ: It is a new air entraining agent developed and produced by Jiangsu Bote
New Materials Co Ltd in China. It can be both powder and liquid. The main
ingredient of GYQ is a kind of nonionic surfactant. For the transportation aspect,
in this study powder type of GYQ was used. The technical data of GYQ is shown
in table 3.2 below:

CHALMERS, Civil and Environmental Engineering, Master’s Thesis 2012:99 10
Table 3.2 Technical data of GYQ Powder
Colour and shape Brown
Chloride content ≤0.5%
Alkaline Content 6.0% ± 2%
Fineness Residue on 0.315 mm ≤8.0%
Surface tension 49±3 mN/m
Water content ≤6.0%
When using GYQ, a GYQ solution was made by dissolving the powder in water
with a diluted solution of 0.6% and 1.2%, respectively.
� Sika 88 L: It is provided by Sika Sverige AB in Sweden. It is a dark brown liquid,
based on vinsol resin which can be classified as natural air entraining agent. The
technical data of Sika 88 L is shown in table 3.3 below:
Table 3.3 Technical data of Sika 88 L
Colour and shape Dark brown liquid
Density 1.07 kg / dm ³
pH value approximately 13
chloride content <0.10% by weight of the solvent
Alkaline Content, eq. Na2O <2.5% by weight of the solvent
Solids About 20%
Viscosity Light liquid
Sika 88 L used in this study was diluted to 2% solid content.
� BASF Micro Air (called BASF thereafter): It is provided by BASF AB in
Sweden. It is based on a synthetic surfactant. The technical data of BASF is
shown in table 3.4 below:
Table 3.4 Technical data of BASF
Colour and shape Transparent liquid
Density 1.0 ± 0.01 kg/dm ³
pH value 10.5-12.5
chloride content <0.01%

CHALMERS, Civil and Environmental Engineering, Master’s Thesis 2012:99 11
Alkaline Content, eq. Na2O 1.24%
Solids 11% ± 1%
Storage time 12 months between 5 ° C and25 ° C
BASF was used by solution in this study which was diluted to 1.1% solid content.
3.1.2 Cements
Two kinds of cements were used in the tests.
One is Swedish cement called “Anläggningscement”, corresponding to CEM I 42.5 N
MH/SR/LA. It has a low C3A content and satisfies the requirements for sulfate
resistance and low-alkaline cement according to EN 197-1. Its compact density is
3200 ± 20 kg/m3 and Blain specific surface is 310 ± 30 m
2/kg.
Another is Portland Cement CEM I 42.5R which produced by Akmenés Cementas,
Lithuania. Its compact density is 3140 kg/m3, Blain specific surface is 410 ± 20 m
2/kg
and equivalent alkali content is 0.92% ± 0.10%.
The size distributions of the two cements are shown in Figure 3.1.
Figure 3.1 Size distribution of Anläggningscement and Akmenes cement1
Other technical data of these two cements are all shown in appendix A.
3.1.3 Sand
The sand used in the tests was sea-dredged sand. The maximum size of the sand is 2
mm and the size distribution is shown in table 3.5 below:
1 The size distribution test is based on SS-EN 196-2
0
10
20
30
40
50
60
70
80
90
100
0 0.5 1 2 3 4 5 8 16 32 63 125
Su
m o
f p
ass
ing
[%
]
Sieve Size [μm]
Anläggningscement
Akmenes Cement

CHALMERS, Civil and Environmental Engineering, Master’s Thesis 2012:99 12
Table 3.5 Size distribution of sea sands
Sieve size [mm] Sum of passing [%]
2 100
1 95.3
0.5 77.5
0.25 25.5
0.125 0.7
0.063 0.2
3.2 Test procedure and equipment
In this study, all tests were conducted at the central laboratory of Thomas Concrete
Group. During the whole tests the laboratory maintained a temperature of 20 � 2�,
and the relative humidity of around 50%. The temperature of water used in mixture is
potable water with a temperature of 20�. These conditions were also kept when
single or double tests were performed.
3.2.1 Mortar test
The mortar mixing procedure were conducted according to EN 196-1:2005. The total
mixing time was 4 minutes within both low rotation (140±5 min-1
) and high rotation
(285±10 min-1
). All the mortar mixed with w/c = 0.5, which contains 1350 g
aggregates (sea-dredged sand), 500 g cement, 250 g water and a designed amount of
AEA. The mixer used in the test is showed in figure 3.2.
Figure 3.2 Mixer
The test procedure used was:
� Weigh 500 g of cement and 250 g of water and put them into the bowl. Start to
mix immediately when the cement is added to the water. Note the time as the

CHALMERS, Civil and Environmental Engineering, Master’s Thesis 2012:99 13
mixer is started at the nearest minute ("zero time"). Let the cement and water mix
for 30 seconds at low speed.
� Slowly put 1350 g aggregates in the bowl during 30 seconds (30 sec.-60 sec.).
� When all aggregate is added, raise the mixer to high speed and mix for 30
seconds (60 sec.-90 sec.).
� Stop the mixer for 90 seconds (90 sec.-180 sec.), during this period scrape down
any material along the edges to the centre of the bowl and make sure the mortar is
mixed evenly from top to bottom.
� Start mixer on high speed and mix for 60 seconds (180 sec.-240 sec.), then stop.
Furthermore in order to measure the stability of fresh concrete in one hour, we need to
remix the mortar every 15 minutes before the measurement of air content for 10
seconds at low speed.
3.2.2 Gravimetric method
Figure 3.3 Gravimetric method
In order to measure the total air content in fresh concrete, gravimetric method was
used in this study. This method employs a simple container with 404 ml volume and
87.2 g weight (see Figure 3.3). After mixing, the container was filled in three equal
layers, each layer was compacted with ten strokes of the tamper, and a thin steel ruler
was used to remove any excess mortar. Then the total weight measure
M of the
container and the mortar inside were recorded.
The air content (in % by volume) is calculated using the following equation:
( ) 1000theoretical measure container container
air
theoretical
M M VV
ρ
ρ
− − ⋅=
(3.1)
Where��������� can be defined as:
.
.
.
cement agg water
theroeticalaggcement water
cement agg water
M M M
MM Mρ
ρ ρ ρ
+ +=
+ + (3.2)

CHALMERS, Civil and Environmental Engineering, Master’s Thesis 2012:99 14
Based on equations 3.1 and 3.2, the total air content can be calculated.
In this study, the air content in fresh concrete was measured by gravimetric method at
every 15 minutes during one hour, i.e. at the time of 0, 15, 30, 45 and 60 minutes after
stop of the mixing procedure described in 3.2.1. Before each measurement (except the
first one at 0 min) the mortar was mixed for 10 seconds at low speed to simulate
rotation of concrete container during transportation. In-between the measurements the
fresh concrete was covered by a wet towel to protect it from drying. The AVA (see
the next section) was also used, but only at time 0 and at 1 hour, to investigate the
changes of the air void system along the time.
3.2.3 Air void analyzer (AVA) test
� Equipment
The Air Void Analyzer (AVA) is an apparatus that measures the air void
characteristics of fresh concrete (see Figure 3.4). The equipment consists three main
parts.
1. The sampling part consists of a wire basket, a sampling syringe and a holder that
vibrates. The cage is vibrated into the concrete to extract a mortar sample of 20
cubic cm. In this study, mortar test were done so the sample could be extracted
directly.
2. The sample is transferred to the base of the AVA cylinder, and placed into the
analysis liquid.
3. The data analysis tool controls and monitors the test and computes the air content
in the paste, the specific surface of the air voids, and the spacing factor of the air
void structure.
Figure 3.4 The Air Void Analyzer
The measured three parameters air content, specific surface and spacing factor
describes the characteristics of an air void system. By using AVA, it is possible to
assess the air void characteristics of the concrete when it is fresh. This makes it
possible to modify the concrete mixture directly if required. One more advantage of
AVA is that the equipment is portable so it is applicable for in-situ measurements.
� Test procedure
A 20 ml mortar sample was extracted from the mortar in the container used for
determining the entrained air content by the gravimetric method as described in 3.2
(Figure 3.5). The sample was placed into the equipment for measurement. The
components of the AVA equipment are illustrated in Figure 3.6:

CHALMERS, Civil and Environmental Engineering, Master’s Thesis 2012:99 15
Figure 3.5 Taking the sample Figure 3.6 Components of AVA
The mortar sample was injected into the viscous liquid and they were stirred together.
The air bubbles within the mortar paste are released and start to rise. According to
Stoke’s law, the big air bubbles rise faster than the small ones. Based on the amount
of bubbles, the speed of the rising bubbles was registered by a balance and the
computer, which linked with the equipment, can calculate the air content, spacing
factor, specific surface area and air size distribution in the mortar sample.
In this method, large air bubbles like the entrapped air was omitted, as the equipment
is only able to measure air bubbles less than 2 mm in diameter.
The AVA works in the procedures as described below:
� The AVA riser column, Plexiglas, is filled at its base with a viscous (glycerine
based) liquid and topped with water.
� The mortar is injected into the viscous liquid and stirred for 30 seconds to release
the air bubbles.
� The air bubbles rise and are collected at the top of the water column beneath the
inverted petri dish.
� The inverted dish is attached to a sensitive balance. A change in its mass caused
by the buoyancy of the air bubbles is recorded by the computer for 25 minutes.
� This allows the computation of the air void parameters. Air voids greater than 2
mm are excluded from calculations.
CHALMERS, Civil and Environmental Engineering, Master’s Thesis 2012:99 16
4 Result and Analysis
4.1 Effect of different kinds of AEAs
In the first step of the test, the aim was to compare four available AEAs for their air
entraining compatibility, the air void system and the air stability. In order to compare
them more easily, the dosages of the AEAs were based on the diluted AEA solutions,
that is, by weight percentage of solid, 0.45% Sika-S solution, 0.6% and 1.2% GYQ
solution, 2% Sika88 L solution and 1.2% BASF solution were used in the test.
In order to make it simpler, when it comes to normal air content, a dosage of around
0.3% of the diluted solution by weight of cement was taken for all the AEAs; when it
comes to maximum air content, the dosage over 3% of the diluted solution by weight
of cement was taken for all the AEAs. The actual dosage of, for example, Sika-S at
normal air content was then 0.00135% (0.3% × 0.45%) by weight of cement.
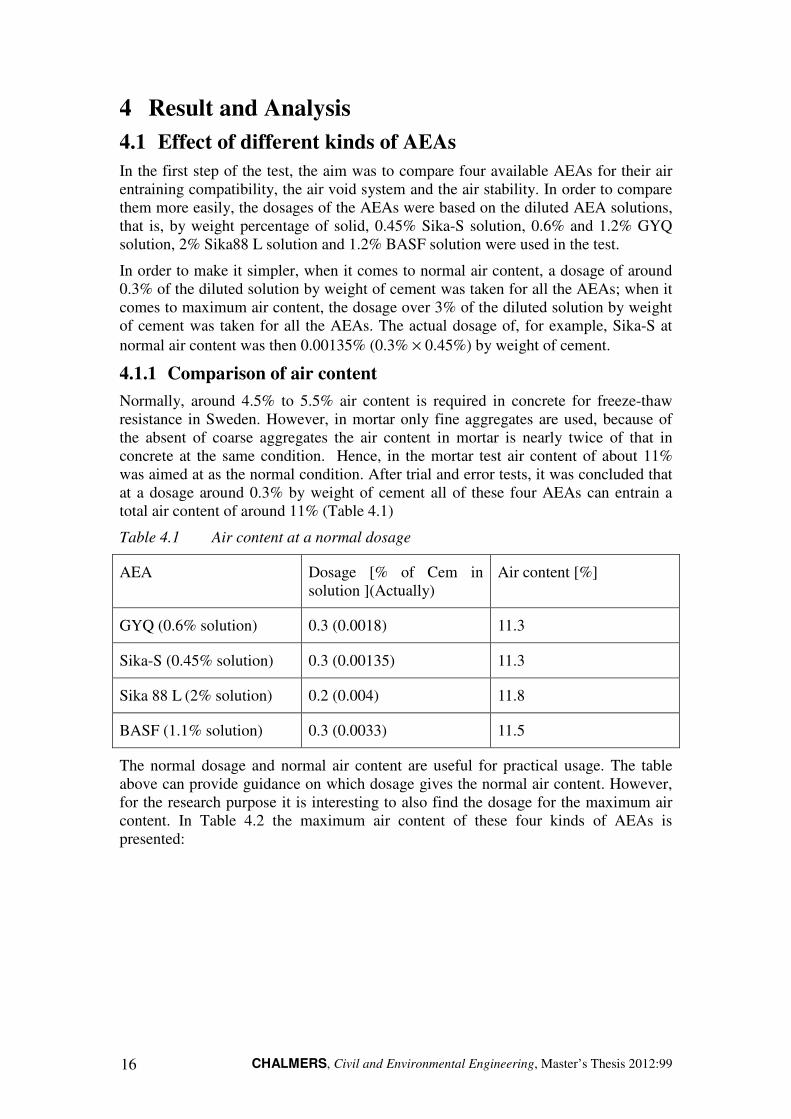
4.1.1 Comparison of air content
Normally, around 4.5% to 5.5% air content is required in concrete for freeze-thaw
resistance in Sweden. However, in mortar only fine aggregates are used, because of
the absent of coarse aggregates the air content in mortar is nearly twice of that in
concrete at the same condition. Hence, in the mortar test air content of about 11%
was aimed at as the normal condition. After trial and error tests, it was concluded that
at a dosage around 0.3% by weight of cement all of these four AEAs can entrain a
total air content of around 11% (Table 4.1)
Table 4.1 Air content at a normal dosage
AEA Dosage [% of Cem in
solution ](Actually)
Air content [%]
GYQ (0.6% solution) 0.3 (0.0018) 11.3
Sika-S (0.45% solution) 0.3 (0.00135) 11.3
Sika 88 L (2% solution) 0.2 (0.004) 11.8
BASF (1.1% solution) 0.3 (0.0033) 11.5
The normal dosage and normal air content are useful for practical usage. The table
above can provide guidance on which dosage gives the normal air content. However,
for the research purpose it is interesting to also find the dosage for the maximum air
content. In Table 4.2 the maximum air content of these four kinds of AEAs is
presented:

CHALMERS, Civil and Environmental Engineering, Master’s Thesis 2012:99 17
Table 4.2 Maximum air content
AEA Dosage [% of Cem. in
solution ](Actually)]
Air content [%]
GYQ (1.2% solution) 3.9 (0.0468) 25.3
Sika-S (0.45% solution) 5.4 (0.0243) 32.1
Sika 88 L (2% solution) 3.9 (0.078) 30.6
BASF (1.1% solution) 4.0 (0.044) 21.4
4.1.2 Comparison of stability
It is not enough to make a conclusion of which is the best AEA by only compare their
ability to entrain air. So tests on stability of the entrained air in fresh concrete were
taken as a part of the whole test program.
For the dosage of around 0.3% of the cement which leads the entrained air around
11%, the stability of entrained air was tested for every 15minutes during one hour.
Figure 4.1 shows the stability of the air void system during one hour and the data are
all shown in Table B.9 in appendix B:
Figure 4.1 Stability of air in fresh mortar at a normal dosage (around 0.3% Cem.)
We can see from Figure 4.1 that for most of the AEAs the air content slightly
decreases with time. However, for BASF, the air content increases with the time. Also
we can conclude from the figure that GYQ has more stable air at the normal dosage
than the others during one hour while Sika 88 L changes the most in this one hour.
8
9
10
11
12
13
14
15
16
0 15 30 45 60
Air
Co
nte
nt[
%]
Time[min]
GYQ [%]
Sika-S [%]
Sika 88 L [%]
BASF [%]

CHALMERS, Civil and Environmental Engineering, Master’s Thesis 2012:99 18
Figure 4.2 Stability of air in fresh mortar at a dosage of 0.15% Cem.
Figure 4.3 Stability of air in fresh mortar at a dosage of 0.45% Cem.
The air content results at the dosage 0.15% of Cem and 0.45% of Cem are shown in
Figures 4.2 and 4.3. It can be seen that at the low dosage (0.15% Cem), all four AEAs
functioned similarly with regard to both air content and stability. At a higher dosage
(0.45% of Cem), both GYQ and BASF behavior relatively stable, while the AEAs
from Sika gave markedly higher initial air content but decreased with time, especially
Sika-S.
When it comes to the maximum air content, based on the certain dosages for reaching
the maximum air contents, air stability tests were also made to see which AEA keeps
the air system best in fresh concrete along with time and which is the worst. The
results of the tests shown in Figure 4.4 below (Table B.10 shows the data in this
figure):
8
9
10
11
12
13
14
15
16
0 15 30 45 60
Air
Co
nte
nt[
%]
Time[min]
GYQ [%]
Sika-S [%]
Sika 88 L [%]
BASF [%]
8
9
10
11
12
13
14
15
16
0 15 30 45 60
Air
Co
nte
nt[
%]
Time[min]
Air_G[%]
Air_S[%]
Air_L[%]
Air_B[%]

CHALMERS, Civil and Environmental Engineering, Master’s Thesis 2012:99 19
Figure 4.4 Stability of maximum air content in fresh mortar
From this figure it is clear that Sika-S and Sika 88 L can produce higher air content at
first. But Sika 88 L was very unstable and the air content decreased from 30.6% to
24.7% during one hour. The BASF AEA produced the smallest air content but with a
very stable air void system. At the same time, GYQ was in the middle in both air
content and stability of air. It is important to note that in Figure 4.4 the Sika-S
revealed the best stability at the high dosage (5.4% Cem in this study, see Table 4.4),
different behaviour when used at the normal dosage (≤ 0.45% Cem, see Figures 4.1 to
4.3).
4.1.3 Comparison by AVA
� Basic data from AVA
Since a test of AVA takes 40 minutes, measurements by AVA were carried out
immediately and one hour after mixing. Because of the uncertainty of the
measurements, for every dosage the measurements by AVA were repeated at least
twice. The details are shown in appendix B, and summarized in Tables 4.3 and 4.4.
Table 4.3 Data of air void system from AVA immediately after mixing
AEA Dosage Air content
(<2 mm)
[%]
Air content
(<0.35 mm)
[%]
Specific surface
area [mm-1
]
Spacing
factor [mm]
GYQ 0.3%C 16.5 11.1 39.5 0.06
Sika-S 0.3%C 16.7 10.5 33.6 0.07
Sika88L 0.2%C 16.3 11.3 41.2 0.05
BASF 0.3%C 16.0 12.6 45 0.05
18
21
24
27
30
33
0 15 30 45 60
Air
Co
nte
nt[
%]
Time[min]
GYQ
Sika-S
Sika 88 L
BASF

CHALMERS, Civil and Environmental Engineering, Master’s Thesis 2012:99 20
Table 4.4 Data of air void system from AVA one hour after mixing
AEA Dosage Air content
(<2 mm)
[%]
Air content
(<0.35 mm)
[%]
Specific surface
Area [mm-1
]
Spacing
factor [mm]
GYQ 0.3%C 17.7 12.5 38.2 0.06
Sika-S 0.3%C 18.8 12.4 37.9 0.05
Sika88L 0.2%C 19.8 14.3 38.2 0.05
BASF 0.3%C 12.8 10.5 39.5 0.08
Table 4.5 Air content measured by gravimetric method on the same sample*
AEA Dosage Air content
(Immediately) [%]
(Stdev.)
Air content (One hour)
[%] (Stdev.)
GYQ 0.3%C 11.7 (0.05) 11.5 (0.06)
Sika-S 0.3%C 12.6 (0.89) 12.0 (0.69)
Sika88L 0.2%C 11.8 (0.59) 11.7 (0.18)
BASF 0.3%C 11.5 (0.37) 12.2 (0.09)
* Average values from two measurements.
From the tables above, it is obvious that for the first three AEAs the air content
increased while BASF decreased after one hour measured by AVA. And so does the
specific surface area and spacing factor, which improved or was stable for GYQ,
Sika-S and Sika 88 L but became worse for BASF.
By using the AVA, two important data (specific surface areas and spacing factor) can
be measured. Specific surface area is the total surface areas per unit bulk volume. It is
defined as the surface area divided by volume (mm2/mm
3). The spacing factor is
average maximum distance in the cement paste from the periphery of a void. These
two data show the properties of the entrained air in the concrete and are affected by
both air bubble size and total air content. It is obvious that a large specific surface area
implies either large air content or large amount of small air bubbles.. However, it is
not enough to study the air void system by only these two characteristics. Air size
distribution will be shown later to make comparison and discussion.
Also from table 4.5 we can see that although all of the AEAs showed good abilities on
stabilizing the air bubbles, Sika-S and Sika 88 L are more sensitive to the mixing
which were displayed by their larger standard deviation.
By comparing table 4.5 with tables 4.3 and 4.4, we can see that there is a difference in
air content as measured by AVA and the gravimetric method (GM). The relationship
between air contents measured by AVA and GM is shown in appendix B. In this
comparison there are 32 groups, but two results by GM deviate significantly from the

CHALMERS, Civil and Environmental Engineering, Master’s Thesis 2012:99 21
AVA and have been deemed to be outliers. Hence, the results from AVA with
different air size (2 mm, 0.35 mm) are compared with GM, based on least squares
fitting, as shown in Figures 4.5 and 4.6.
Figure 4.5 Comparison of air content measured by GM and AVA (2 mm)
Figure 4.6 Comparison of air content measured by GM and AVA (0.35 mm)
It can be seen from Figure 4.5 that the air content measured by GM is generally lower
than that measured by AVA when comparing for air bubbles up to 2 mm. When
comparing GM gravimetric method with AVA for air bubbles up to 0.35 mm, Figure
4.6, it can be seen that the air content measured by GM is slightly higher than AVA
(0.35 mm). The above two comparisons indicate that the GM approach is closer to
AVA for air bubbles up to 0.35 mm with less bias.
One possible reason for the deviation could be that the sampling for the AVA is from
the upper portion of the cylinder, which may contain more air, especially large
bubbles, due to compaction and the buoyancy effect, resulting in a higher air content
than the average as measured by the GM.
y = 1.0459x + 3.6383
R² = 0.8886
0
5
10
15
20
25
30
35
40
0 5 10 15 20 25 30 35 40
Air
Co
nte
nt
(<2
mm
,fro
m A
VA
)[%
]
Air content (Gravimetric Method)[%]
y = 0.9139x + 0.6419
R² = 0.8744
0
5
10
15
20
25
30
35
40
0 5 10 15 20 25 30 35 40
Air
Co
nte
nt
(<0
.35
mm
,fro
m A
VA
)[%
]
Air content (Gravimetric Method)[%]

CHALMERS, Civil and Environmental Engineering, Master’s Thesis 2012:99 22
� Air size distribution
The AVA can record the size distribution of the air bubbles and presents the data for a
certain air bubble size as percentage of the total air content. The size of the air bubbles
vary between 0 and 2 mm.
Figures 4.7 and 4.8 below show the size distribution of the air bubbles in mortar
sample. As it is known, the most efficient air sizes with respect to the frost resistance
are those below 300 µm. From the size distribution graphs, it is clear that BASF can
produce the most efficient air among the four AEAs. Although Sika-S can produce the
most air bubbles, its air size distribution (high amount of the large bubbles) is not as
good as the others.
Figure 4.7 Size distribution of air in mortar sample (at a normal dosage,
immediately)
Figure 4.8 Size distribution of air in fresh concrete (at a normal dosage, one hour
later)
Since the total air contents of all the AEAs in the sample are not the same it is
difficult to compare them only based on the size distribution. Therefore the air volume
0
5
10
15
20
25
30
0 50 75 100 125 150 200 300 500 1000 2000
Pe
rce
nta
ge
[%]
Air SIze [μm]
GYQ(0,11%)
Sika-S(0,11%)
Sika88-L(0,11%)
BASF(0,11%)
0
5
10
15
20
25
30
0 50 75 100 125 150 200 300 500 1000 2000
Pe
rce
nta
ge
[%]
Air SIze [μm]
GYQ(1,11%)
Sika-S(1,11%)
Sika88-L(1,11%)
BASF(1,11%)

CHALMERS, Civil and Environmental Engineering, Master’s Thesis 2012:99 23
for each bubble size in the 20ml mortar sample was calculated. The result is shown in
Figures 4.9 to 4.12. The comparisons on the maximum air content are shown in
Figures 4.13 to 4.16.
Figure 4.9 Size distribution for Sika-S in real volume2
Figure 4.10 Size distribution for GYQ in real volume
2 0 represents for measured immediately and 1 represents for measured on hour later.
0
0.1
0.2
0.3
0.4
0.5
0.6
0.7
0.8
0.9
0 50 75 100 125 150 200 300 500 1000 2000
air
co
nte
nt[
ml]
air size[μm]
Sika-S(0,11%)
Sika-S(1,11%)
0
0.1
0.2
0.3
0.4
0.5
0.6
0.7
0.8
0.9
0 50 75 100 125 150 200 300 500 1000 2000
air
co
nte
nt[
ml]
air size[μm]
GYQ(0,11%)
GYQ(1,11%)

CHALMERS, Civil and Environmental Engineering, Master’s Thesis 2012:99 24
Figure 4.11 Size distribution for Sika 88 L in real volume
Figure 4.12 Size distribution for BASF in real volume
0
0.1
0.2
0.3
0.4
0.5
0.6
0.7
0.8
0.9
0 50 75 100 125 150 200 300 500 1000 2000
air
co
nte
nt[
ml]
air size[μm]
Sika88-L(0,11%)
Sika88-L(1,11%)
0
0.1
0.2
0.3
0.4
0.5
0.6
0.7
0.8
0.9
0 50 75 100 125 150 200 300 500 1000 2000
air
co
nte
nt[
ml]
air size[μm]
BASF(0,11%)
BASF(1,11%)

CHALMERS, Civil and Environmental Engineering, Master’s Thesis 2012:99 25
Figure 4.13 Size distribution for GYQ in real volume
Figure 4.14 Size distribution for Sika-S in real volume
0
0.2
0.4
0.6
0.8
1
1.2
1.4
1.6
1.8
2
0 50 75 100 125 150 200 300 500 1000 2000
air
co
nte
nt[
ml]
air size[μm]
GYQ(0,25%)
GYQ(1,25%)
0
0.2
0.4
0.6
0.8
1
1.2
1.4
1.6
1.8
2
0 50 75 100 125 150 200 300 500 1000 2000
air
co
nte
nt[
ml]
air size[μm]
Sika-S(0,25%)
Sika-S(1,25%)

CHALMERS, Civil and Environmental Engineering, Master’s Thesis 2012:99 26
Figure 4.15 Size distribution for Sika 88 L in real volume
Figure 4.16 Size distribution for BASF in real volume
From the results of the normal dosage, the volume of efficient air increased after one
hour with Sika-S and Sika 88 L, while with BASF it decreased. For GYQ the volume
of air bubbles with the size between 0 and 100μm decreased and those with the size
between 100μm and 300μm increased. When compare with AEAs the total air
volume of Sika-S (3.34 ml) is slightly larger than GYQ (3.29 ml), but the volume of
efficient air is smaller than that of GYQ. For Sika 88 L, although the volume of air
bubbles with the size around 125 µm increased a lot after one hour, for the volume of
big air bubbles also increased. It is noticed that the total air volume of Sika 88 L
increased a lot after one hour (from 2.42 ml to 3.1 ml), which is an indication of
instability. For BASF, the efficient air decreased after one hour.
From the results of the maximum air content shown in Figures 4.13 to 4.16 it can be
seen that the efficient air volume after one hour in general became better for all types
of AEAs. It should be noted that the mortar was mixed again for 10 seconds after one
hour before sampling for AVA test. The improved pore size distributions may be
0
0.2
0.4
0.6
0.8
1
1.2
1.4
1.6
1.8
2
0 50 75 100 125 150 200 300 500 1000 2000
air
co
nte
nt[
ml]
air size[μm]
Sika88-L(0,25%)
Sika88-L(1,25%)
0
0.2
0.4
0.6
0.8
1
1.2
1.4
1.6
1.8
2
0 50 75 100 125 150 200 300 500 1000 2000
air
co
nte
nt[
ml]
air size[μm]
BASF(0,25%)
BASF(1,25%)

CHALMERS, Civil and Environmental Engineering, Master’s Thesis 2012:99 27
attributed to the increase in viscosity of the paste one hour after initial mixing. This
increased viscosity helps to keep the small size air bubbles in the paste.
Moreover, from Tables 4.6 and 4.7 it can be conclude that for all AEAs the total air
content decreased after one hour, which was just like the measurements from GM
while for GYQ and BASF the efficient air content were slightly increased. For all
AEAs the specific surface area increased after one hour and the spacing factors were
stable.
Table 4.6 Data of air void system from AVA immediately (maximum air content)
AEA Dosage Air content
(<2 mm)
[%]
Air content
(<0.35 mm)
[%]
Specific surface
area [mm-1
]
Spacing
factor [mm]
GYQ 3%C 28.6 21 29.3 0.04
Sika-S 3%C 36.7 29.2 29.2 0.03
Sika88L 3%C 32.2 22.9 23.5 0.04
BASF 3%C 22 16.8 32.1 0.04
Table 4.7 Data of air void system from AVA one hour later (maximum air content)
AEA Dosage Air content
(<2 mm)
[%]
Air content
(<0.35 mm)
[%]
Specific surface
area [mm-1
]
Spacing
factor [mm]
GYQ 3%C 25.7 21.7 37.3 0.03
Sika-S 3%C 32.1 24.2 30.8 0.03
Sika88L 3%C 23.8 18.8 34.9 0.04
BASF 3%C 21.6 18 37.9 0.04
From Figures B.9 and B.10 it can be seen that Sika 88 L produced the least efficient
air among these four AEAs while BASF produce the most.
One thing that should be noted is that, although Sika-S produced the most air bubbles
at the maximum air content, its efficient air after one hour was the smallest, of the
total air a large part of the air bubbles were with large sizes. However, this may be an
effect of the extremely high air content which can affect the stability negatively.
4.2 Effect of AEAs in Different Cementitious Materials
In order to study the properties of the AEAs more deeply, in the second step Sika-S
and GYQ were chosen for further study. They were chosen as Sika-S is a synthetic
AEA which can produce the most air bubbles in concrete among these four while
GYQ is the one based on natural material which can produce better air void system

CHALMERS, Civil and Environmental Engineering, Master’s Thesis 2012:99 28
with relatively good stability. In the following tests diluted 1.2% GYQ solutions and
0.45% Sika-S solutions were used.
In the first part, all the cement used for the test was Anläggningscement, in the second
stage another cement with a higher fineness and alkali, Akmenes cement, was used. In
addition, Akmenes cement with slag was also investigated, both for the tests in the
fresh mortar with the maximum air content (dosage about 3% by weight of cement).
The air was evaluated by both the gravimetric method and the AVA.
4.2.1 Akmenes cement
By just changing the cement from Anläggningscement to Akmenes cement, the same
tests as previously used were carried out in the fresh mortar with the maximum air
content. Table 4.8 shows the stability of air void system measured by gravimetric
method during one hour. Tables 4.9 and 4.10 show the data measured by AVA. The
results are discussed in section 4.2.3.
Table 4.8 Stability of air in fresh mortar (Akmenes cement)
AEA Dosage
Air content[%]
0 min 15min 30min 45min 60min
GYQ 3%C 22.9 21.6 20.7 19.9 19.9
Sika-S 3%C 29.6 28.9 28.2 27.8 27.5
Table 4.9 Data of air void system from AVA immediately (Akmenes cement)
AEA Dosage Air content
(<2 mm)
[%]
Air content
(<0.35 mm)
[%]
Specific surface
area [mm-1
]
Spacing
factor [mm]
GYQ 3%C 32.8 28.5 37.3 0.03
Sika-S 3%C 34.4 27.5 21.2 0.04

CHALMERS, Civil and Environmental Engineering, Master’s Thesis 2012:99 29
Table 4.10 Data of air void system from AVA one hour later (Akmenes cement)
AEA Dosage Air content
(<2 mm)
[%]
Air content
(<0.35 mm)
[%]
Specific surface
area [mm-1
]
Spacing
factor [mm]
GYQ 3%C 22.7 19.8 35.7 0.04
Sika-S 3%C 32.3 25.7 26.7 0.04
Here all GYQ solutions are 1.2% of solid and all Sika-S solutions are 0.45% of solid.
4.2.2 Akmenes cement with slag
The slag used in the test is Slag Bremen which has a compact density of 2900 kg/m3,
compared with the cement which has about 3100 kg/m3. In this study 1/3 of cement
by weight was replaced by slag. The dosages of all the components used in the tests
were shown in Table 4.11 below:
Table 4.11 Dosages of components
Component Dosage [g] Density [kg/m3]
Water 250 1000
Akmenes cement 335 3140
Slag 165 2900
Aggregate 1350 2650
Table 4.12 shows the stability of air void system in the mortar with slag measured by
gravimetric method during one hour. Table 4.13 and 4.14 show the data measured by
AVA.
Table 4.12 Stability of air in fresh mortar (Akmenes cement with slag)
AEA Dosage
Air content[%]
0 min 15min 30min 45min 60min
GYQ 3%C 19.1 18.3 17.7 17.5 17.5
Sika-S 3%C 28.4 28.0 27.7 27.3 27.0

CHALMERS, Civil and Environmental Engineering, Master’s Thesis 2012:99 30
Table 4.13 Data of air void system from AVA immediately (Akmenes cement with
slag)
AEA Dosage Air content
(<2 mm)
[%]
Air content
(<0.35 mm)
[%]
Specific surface
area [mm-1
]
Spacing
factor [mm]
GYQ 3%C 23.5 20.1 34.6 0.04
Sika-S 3%C 37.7 31.2 31.6 0.03
Table 4.14 Data of air void system from AVA one hour later (Akmenes cement
with slag)
AEA Dosage Air content
(<2 mm)
[%]
Air content
(<0.35 mm)
[%]
Specific surface
area [mm-1
]
Spacing
factor [mm]
GYQ 3%C 24 14.4 23.8 0.06
Sika-S 3%C 47.5 31.2 22.9 0.03
Here all GYQ solutions are 1.2% solid content, and all Sika-S solutions are 0.45% solid content.
4.2.3 Comparison of Anläggningscement, Akmenes cement and
Akmenes cement with slag
The air content and its relative changes with time are shown in Figure 4.17. When
comparing the stability of air in fresh mortar between Akmenes cement and Akmenes
cement with slag the following conclusions/observations can be made:
1) Sika-S is always more stable than GYQ regardless of the kinds of cementitious
materials. This is probably due to the difference between synthetic and natural
air entrainers.
2) The stability of air was improved by replacing 1/3 Akmenes cement with slag,
for both GYQ and Sika-S. This is probably because the particles of slag are
finer than cement. Replacing cement with slag is kind of improving the
fineness of the cementitious materials used in the test which stabilizes the air
bubbles better. Another possible reason is that by adding slag the alkali of the
cementitious material in the test decreased. Since the alkali environment can
affect protective shell of the air bubbles and then the damaged bubbles may
coalescence and become a larger one. The mortar sample with slag (lower
alkaline content than only Akmenes cement) can then produce a more stable
air in concrete. This may also explain why Anläggningscement (low alkali
content) can produce more stable air than Akmenes cement (normal alkali
content).

CHALMERS, Civil and Environmental Engineering, Master’s Thesis 2012:99 31
Figure 4.17 Comparison of stability of air in fresh concrete between Akmenes
cement and Akmenes cement with slag
Tables 4.15 and 4.16 show the changes in air content with the different cementitious
materials and air entrainers. Here it can be conclude that: Akmenes cement always
contains a little more entrained air than Anläggningscement; and when replacing 33%
Akmenes cement with slag, the air content decreased. However, these are only total
air contents. When examining the air void system, GYQ had a decreasing air content
and specific surface and the spacing factor decreased when slag was added. Also with
Sika-S the specific surface decreased.
Table 4.15 Comparison of air contents with three kinds of cementitious material
(measured immediately)
Category Air
content
[%]
Air
volume
[mm3]
Specific
surface area
[mm-1]
Spacing
factor
[mm]
GYQ(CEM Ι 42,5N) 3
24.14 4.83 29.3 0.04
GYQ(CEM Ι 42,5R) 4
24.75 4.95 37.3 0.03
GYQ(CEM Ι 42,5R+33%Slag)5 19.14 3.83 34.6 0.04
Sika-S(CEM Ι 42,5N) 28.88 5.78 29.2 0.03
Sika-S(CEM Ι42,5R) 29.40 5.88 21.2 0.04
Sika-S(CEM Ι 42,5R+33%Slag) 28.39 5.68 31.6 0.03
3 CEMⅠ42,5N refers to Anläggningscement
4 CEMⅠ42,5R refers to Akmenes cement
5 CEMⅠ42,5R+33%Slag refers to 335g Akmenes cement and 165g slag
CHALMERS, Civil and Environmental Engineering, Master’s Thesis 2012:99 32
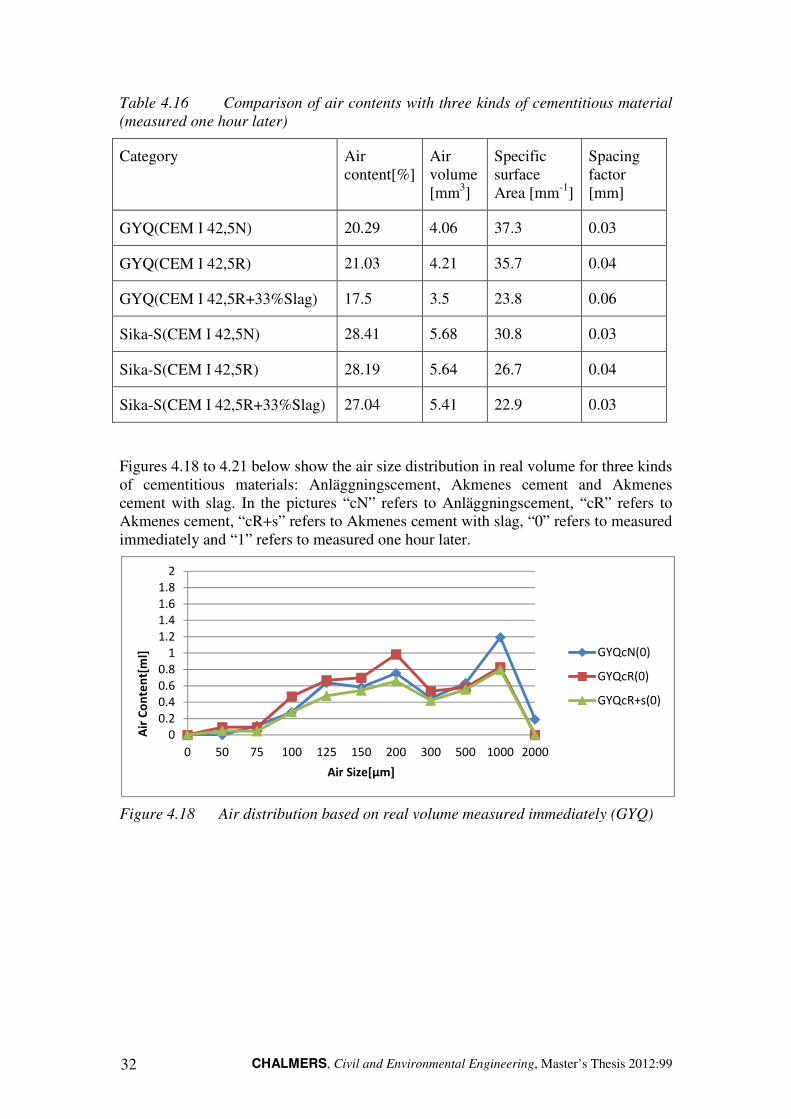
Table 4.16 Comparison of air contents with three kinds of cementitious material
(measured one hour later)
Category Air
content[%]
Air
volume
[mm3]
Specific
surface
Area [mm-1
]
Spacing
factor
[mm]
GYQ(CEM Ι 42,5N) 20.29 4.06 37.3 0.03
GYQ(CEM Ι 42,5R) 21.03 4.21 35.7 0.04
GYQ(CEM Ι 42,5R+33%Slag) 17.5 3.5 23.8 0.06
Sika-S(CEM Ι 42,5N) 28.41 5.68 30.8 0.03
Sika-S(CEM Ι42,5R) 28.19 5.64 26.7 0.04
Sika-S(CEM Ι 42,5R+33%Slag) 27.04 5.41 22.9 0.03
Figures 4.18 to 4.21 below show the air size distribution in real volume for three kinds
of cementitious materials: Anläggningscement, Akmenes cement and Akmenes
cement with slag. In the pictures “cN” refers to Anläggningscement, “cR” refers to
Akmenes cement, “cR+s” refers to Akmenes cement with slag, “0” refers to measured
immediately and “1” refers to measured one hour later.
Figure 4.18 Air distribution based on real volume measured immediately (GYQ)
0
0.2
0.4
0.6
0.8
1
1.2
1.4
1.6
1.8
2
0 50 75 100 125 150 200 300 500 1000 2000
Air
Co
nte
nt[
ml]
Air Size[μm]
GYQcN(0)
GYQcR(0)
GYQcR+s(0)

CHALMERS, Civil and Environmental Engineering, Master’s Thesis 2012:99 33
Figure 4.19 Air distribution based on real volume measured immediately (Sika-S)
Figure 4.20 Air distribution based on real volume measured one hour later (GYQ)
Figure 4.21 Air distribution based on real volume measured one hour later (Sika-S)
Tables 4.17 and 4.18 summarize how the air void system changed during one hour for
the different cementitious materials with different AEAs, including the change of total
air content and also the changes of air content in small air bubbles.
0
0.2
0.4
0.6
0.8
1
1.2
1.4
1.6
1.8
2
0 50 75 100 125 150 200 300 500 1000 2000
Air
Co
nte
nt[
ml]
Air Size[μm]
Sika-ScN(0)
Sika-ScR(0)
Sika-ScR+s(0)
0
0.2
0.4
0.6
0.8
1
1.2
1.4
1.6
1.8
2
0 50 75 100 125 150 200 300 500 1000 2000
Air
Co
nte
nt[
ml]
Air Size[μm]
GYQcN(1)
GYQcR(1)
GYQcR+s(1)
0
0.2
0.4
0.6
0.8
1
1.2
1.4
1.6
1.8
2
0 50 75 100 125 150 200 300 500 1000 2000
Air
Co
nte
nt[
ml]
Air Size[μm]
Sika-ScN(1)
Sika-ScR(1)
Sika-ScR+s(1)

CHALMERS, Civil and Environmental Engineering, Master’s Thesis 2012:99 34
Table 4.17 Changes of air void system during one hour for all kinds of AEAs at
normal air content
AEAs
Total air
content
by GM
[%]
Change measured by AVA (air_t60/air_t0)
Total
change
air
content
Change
air
content
(< 0.35
mm)
Change
air
content
(< 0.15
mm)
Change
spec.
surface
GYQ 11.7 ↑ → ↓ →
Sika-S 12.6 ↑↑ ↑↑ ↑↑ ↑↑
Sika 88 L 11.8 ↑↑ ↑↑ ↑↑ ↑↑
BASF 11.5 ↓↓ ↓↓ ↓↓ ↓↓
Table 4.18 Changes of air void system during one hour for three kinds of
cementitious material and two kinds of AEAs
AEAs Cementitious
materials
Total air
content
by GM
[%]
Change measured by AVA (air_t60/air_t0)
Total
change
air
content
Change
air
content
(< 0.35
mm)
Change
air
content
(< 0.15
mm)
Change
spec.
surface
GYQ
CEMⅠ42,5N 24.14 ↓ ↑↑ ↑↑ ↑↑
CEMⅠ42,5R 24.75 ↓↓ ↓↓ ↓↓ →
CEMⅠ
42,5R+33%Slag 19.14 → ↓↓ ↓↓ ↓↓
Sika-S
CEMⅠ42,5N 28.88 ↓↓ ↓↓ ↑↑ →
CEMⅠ42,5R 29.4 ↓ ↓ → ↑↑
CEMⅠ
42,5R+33%Slag 28.39 ↑↑ → ↓↓ ↓↓
The arrows indicate the change:
→ means stable (0.95 ≤ air_t60/air_t0 ≤ 1.05) ↓ means decreases (0.9 ≤ air_t60/air_t0 < 0.95) ↓↓ means large decreases (air_t60/air_t0 <0.9) ↑ means increase (1.05 < air_t60/air_t0 ≤ 1.1) ↑↑means large increases (air_t60/air_t0 >1.1)

CHALMERS, Civil and Environmental Engineering, Master’s Thesis 2012:99 35
From Figures 4.18 to 4.21, Tables 4.17 and 4.18 above it can be seen that:
1) From the changes of air size distribution, the air void system in fresh mortar with
Anläggningscement is better than that with Akmenes cement. This is probably
due to the fact that Anläggningscement contains lower alkali than Akmenes
cement, as alkali environment in fresh concrete may destroy the air bubbles.
2) Although Sika-S can entrain more air than GYQ (for example by using
Anläggningscement the air content in Sika-S and GYQ are 28.9% and 24.1%,
respectively), the air contents in the small size range are almost the same when
compared with the air content in real volume as shown in the figures above; for
example, with Anläggningscement the total air volume below 300 μm are 3.0 ml
and 3.2 ml for GYQ and Sika-S respectively measured after one hour.
3) By replacing cement with slag, the air content generally decreased. Furthermore,
the effect of slag on the change of air volume was larger for GYQ than for Sika-S.
4) Normally, the air content decreased after one hour regardless of what kinds of
AEAs. For GYQ used in Anläggningscement the total air content decreased while
the air content of smaller air bubbles increased.
5) Sika-S acted well with Akmenes cement (kept air bubbles more stable) while
GYQ acted well with Anläggningscement and Akmenes cement with slag. We
may conclude that, GYQ is more suitable for low alkali cements while Sika-S is
suitable for moderate ones.

CHALMERS, Civil and Environmental Engineering, Master’s Thesis 2012:99 36
5 Discussion
5.1 Discussion on the tests and the results
5.1.1 Discussion on the limitation of the tests
The measurements were supposed to imitate the practical situation of mixing and
transporting the concrete with total air content measured by the gravimetric method. A
drawback is that there is no standardized procedure for evaluating the air stability.
Hence, a modified mortar test procedure (based on EN 196-1) was used. Although it
would be closer to the actual situation if we keep mixing during the whole process,
the speed of the mixer was too high as compared with the actual rotating bucket on a
concrete truck. Also mixing the mortar test for ten seconds may bring some extra air
bubbles in, which may bring the following measurement to deviate more from the
reality. So the method used in this study should also be taken into account when
interpreting the results.
Furthermore, for the AVA tests only one apparatus was available and one test took
about a half hour, so it was impossible to conduct two measurements at the same time.
In order to offset it, every AEA with the certain dosage was mixed and tested twice
for verification. However, it is not as good as measuring the same batch of mortar
twice by using two sets of AVA at the same time under the same condition.
5.1.2 Discussion on the results
In the comparison of four AEAs, it seems that BASF always showed a different
behaviour compared with the other three AEAs. GYQ showed a good ability to
stabilizing air bubbles at a normal dosage, but at the dosage 0.15%C it showed large
increasing of air content along with the time which was strange comparing with the
results at dosages 0.3%C and 0.45%C. As we know that powder is harder to weigh
accurately and dilute uniformly than solution, especially at the small dosage. When
the tests come to the small dosage 0.15%C everything in the test was more sensitive,
which may influence the results of GYQ.
The measurement results differ between GM and AVA, the total air content measured
by AVA is generally higher while better agreement is found when comparing the air
content up to 0.35 mm air bubbles. The reason for this may be due to the different
characteristics of measurements by GM and AVA and that the AVA is sensitive when
the air contains large bubbles and when measuring large air contents. Sampling in the
upper portion of the mortar for the AVA test could be another reason, because the
upper portion may contain more large air bubbles. However, no clear explanation can
be provided.
At the maximum air content, the spacing factors kept very stable, which are more
stable than at normal dosages. That may be due to the large amount of air bubbles in
the mortar, which may decrease the sensibility of spacing factor under the condition
of the maximum air content.
The changes of air void system in fresh mortar are more significant for Sika-S than for
GYQ with different cementitious materials when measured immediately. However
after one hour it also became significant for GYQ.
The aim of this study is to find a sustainable way to improving the stability of
entrained air bubbles in concrete and then reducing the usage of fine particles by
entraining more amount of stable air bubbles. From Figure 4.4 and Figure 4.17, it

CHALMERS, Civil and Environmental Engineering, Master’s Thesis 2012:99 37
seems that Sika-S can meet all the requirements like producing the most air bubbles
with good stability especially at high dosages.

CHALMERS, Civil and Environmental Engineering, Master’s Thesis 2012:99 38
6 Conclusion and Further Studies
6.1 Conclusions
At the first stage, four kinds of AEAs were compared on their abilities of entraining
and stabilizing the air bubbles in concrete.
At the normal dosages, both BASF and GYQ revealed a good capability of stabilizing
the air bubbles in concrete while Sika 88 L and Sika-S seem more sensitive to the
mixing before tests. For BASF, it also showed a little increase of air content within
the first hour. According to the measurements by AVA, BASF can produce the most
efficient air (with the bubble size <0.3 mm) among the four AEAs immediately after
mixing but decreased a lot after one hour. For the other AEAs, the contents of
efficient air increased after one hour. It can be concluded from these comparisons that
all AEAs show their good abilities on entraining and stabilizing the air bubbles while
Sika-S and Sika 88 L are little more sensitive at normal dosage.
When comparing the maximum air content, Sika-S shows the best ability of both
entraining and stabilizing a high volume of air bubbles. Although Sika 88 L can
entrain a large amount of air bubbles as Sika-S, it cannot stabilize them well along
with the time. GYQ and BASF showed their ability of stabilizing the air bubbles but
the maximum air content they can entrain in the concrete is less than Sika-S and Sika
88 L. It is obvious that Sika-S is the best choice for entraining high volume of air with
a satisfactory stability.
At the second stage, three kinds of cementitious materials with two AEAs have been
compared also on their abilities of entraining and stabilizing the air bubbles in
concrete.
GYQ can entrain and stabilize similar amount of efficient air in both
Anläggningscement and Akmenes cement, but less amount of efficient air when 1/3 of
Akmenes cement was replaced with slag. Sika-S entrained less efficient air in
Akmenes cement than in Anläggningscement, but when blended slag in Akmenes
cement the entrained efficient air increased immediately after mixing but significantly
decreased with time.
6.2 Future studies
The works in this study are only the first part of the whole study which aims at
replacing the fine aggregates with the improved air bubbles. To achieve this goal the
methodology for evaluating the air bubble stability should be further developed so
that it is possible to more realistically simulate the real situation. In addition to testing
the air in the fresh concrete, measurements should also be made on the hardened
concretes. This should include both fresh and hardened properties of concrete, such as
air content, air pore structure, strength and durability. Moreover, it is valuable to
investigate how the fine particles can be reduced in concrete. It should also be
interesting to examine how the other fine particles like quartz powder, fly ash, and
lime stone filler influence the air entraining and which effect of admixtures, such as
superplasticizer and viscosity modifiers, may have when entraining a high volume of
air in concrete.

CHALMERS, Civil and Environmental Engineering, Master’s Thesis 2012:99 39
7 References
Cement and concrete resources, Design and Control of Concrete Mixtures, EB001,
PCA-fundamentals of concrete, chapter 8 pp130
EN 196-1:2005: Methods of testing cement-Part 1: Determination of strength
Integrated Material and Construction Practices for Concrete Pavement, U.S.
Department of transportation, FHWA Publication No. HIF-07-004, 56 pp
Dodson, V.H. (1990): Concrete Admixtures, Van Nostrand Reinhold, New York.
Fagerlund, G. (1990): “Air-Pore Instability And Its Effect On Concrete Properties,”
Nordic Concrete Research, No. 9,Nordic Concrete Federation, Oslo, pp. 34–52.
Hover, K.C. (1989): “Some Recent Problems with Air-Entrained Concrete”, Cement,
Concrete, and Aggregates, ASTM,Vol. 11,No. 1, pp. 67–72.
Kosmatka, S.H., and Panarese, W.C. (1994): Design and Control of Concrete
Mixtures, Portland Cement Association, 13th ed., Skokie, Illinois.
Kqlaots I., Hurt R.H., Suuberg E.M. (2004): Size distribution of unburned, carbon in
coal fly ash and its implications, Fuel 83 (1) pp 223– 230.
Lianxiang Du, and Kevin J. Folliard (2005): Mechanisms of air entrainment in
concrete, Cement and Concrete research 35, 1463-1471.
Mielenz, R.C., Wolkodoff, V.E., Backstrom, J.S., and Flack, H.L. (1958): Origin,
evolution, and effects of the air void system in concrete: Part 1. Entrained air in
unhardened concrete, J. Am. Concr. Inst. 30 (1), pp 95–121.
Mindess, S., Young, F., and Darwin, D. (2003): concrete, second edition, Pearson
Education, Inc. and Upper Saddle River, NJ 07458, 169 pp
Myers, D. (1999): Surfaces, Interfaces, and Colloids: Principles and Applications,
2nd ed., Wiley-VCH, New York.
Nagi, M. A., Okamoto, P. A., Kozikowski, R. L., and Hover, K. (2007): Evaluating
Air-Entraining Admixture for Highway Concrete, Washington D.C.
Powers, T.C. (1949): The air requirement of frost-resistant concrete, Proc. Highw.
Res. Board 29, pp184– 211.
Powers, T.C. (1954): Void spacing as a basic for producing air-entrained concrete, J.
Am. Concr. Inst. 25 (9), pp 741–760.
Powers, T.C. (1968): The Properties of Fresh Concrete, John Wiley & Sons, New
York,
Tattersall, G.H. (1976): Relationships between the British standard tests for
workability and the two-point test, Mag. Concr. Res. 28 (96) pp 143– 147.
Whiting, D. A., and Nagi, Mohamad A. (1998): Manual on Control of Air Content in
Concrete, EB116, National Ready Mixed Concrete Association and Portland
Cement Association, 42 pp.
Yan Shang, Changwen Miao, Jiaping Liu and Qianping Ran (2010): Influencing
Factors of Air void Characteristics in Hardened Concrete, 2nd
International
Symposium on Service Life Design for Infrastructure 4-6 {October}.

CHALMERS, Civil and Environmental Engineering, Master’s Thesis 2012:99 40
Appendix A
Table A.1 Properties of Anläggning and Akmenés cements
Name Anläggning Akmenés
Type CEM I42,5N CEMI42,5R
(MH/SR/LA)
Chemical properties
[wt %]
=0,66*K2O+Na2O
[%]
Lime (CaO) [%] 64.6 61,7
Silicon (SiO2) [%] 22.5 20,13
Aluminum (Al2O3) [%] 3.4 4,57
Iron (Fe2O3) [%] 4.2 3,22
Magnesium (MgO) [%] 0.89 3,5
Sulphate (SO3) SS-EN 196-2 [%] 2.3 3.02
Potassium (K2O) [%] 0.62 1,07
Sodium (Na2O) [%] 0.06 0,18
Alkali eq. (Na2Oeq.) [%] 0.47 0.89
Water-soluble chloride (Cl-) SS-EN
196-2 [%] <0,01 0.002
Water-soluble chromic Cr(6+) SS-
EN 196-10 [mg/kg] [ppm] <2 <2
Mineral
composition [wt %]
(C3S) [%] 54.3 54.2
(C2S) [%] 23.4 16,9
(C3A) [%] 2.0 6,7
(C4AF) [%] 12.6 9,8
Physical data
Specific surface(blaine) SS-EN
196-3 [m2/kg]
317 414
Density (compact) ASTM C188
[kg/m3] 3200 3140
Initial setting, SS-EN 196-3 [min] 151 158
Volume resistance [mm] 0.7 1.0

CHALMERS, Civil and Environmental Engineering, Master’s Thesis 2012:99 41
Standard consistency, 196-3 [%] 25.2 28.0
Compressive
strength [MPa]
SS-EN 196-1
1 day 11.3 23.1
2 day 21.4 37.1
7 day
28 day 57.5 60.3
Loss on ignition, SS-EN 196-2 [%] 1.1 1.1
Particle size
distribution [wt %]
125 µm 99.9
63 µm
98.9
32 µm
82.4
16 µm
48.6
8 µm
26.6
4 µm
14.7
2 µm
8.1
1 µm
4.1
0,5 µm
1.4
Particle size
distribution [wt %]
125 µm 99.9
63 µm 93.2
32 µm 71.0
15 µm 41.7
8 µm 24.0
5 µm 14.5
3 µm 7.2
2 µm 3.5
1 µm 0.5

CHALMERS, Civil and Environmental Engineering, Master’s Thesis 2012:99 42
Appendix B
Table B.1 Stability of Air in fresh concrete (0.15%C)
AEA Dosage
Air content[%]
0 min 15min 30min 45min 60min
GYQ 0.15%C 9.34 9.72 10.02 10.27 9.89
Sika-S 0.15%C 9.77 9.3 9.6 9 9.33
Sika 88 L 0.15%C 10.69 10.5 10.32 10.13 10.51
BASF 0.15%C 10.18 9.83 10.54 10.63 10.48
Figure B.1 Stability of air in fresh concrete (0.15%C)
Figure B.2 Comparison of stability of air in fresh concrete (0.15%C)
8
9
10
10
11
12
13
14
14
15
16
0 15 30 45 60
Air
Co
nte
nt[
%]
Time[min]
Air_G[%]
Air_S[%]
Air_L[%]
Air_B[%]
0.70
0.75
0.80
0.85
0.90
0.95
1.00
1.05
1.10
0 15 30 45 60
Air
/Air
t=0
Time[min]
Air/Airt=0_G
Air/Airt=0_S
Air/Airt=0_L
Air/Airt=0_B

CHALMERS, Civil and Environmental Engineering, Master’s Thesis 2012:99 43
Table B.2 Stability of air in fresh concrete (0.3%C)
AEA Dosage
Air content[%]
0 min 15min 30min 45min 60min
GYQ 0.3%C 11.32 11.07 10.8 10.9 11.32
Sika-S 0.3%C 11.33 10.85 10.4 10.45 10.17
Sika 88 L 0.3%C 12.68 12.08 11.89 11.31 11.38
BASF 0.3%C 11.53 11.46 11.83 12.4 12.04
Figure B.3 Stability of air in fresh concrete (0.3%C)
Figure B.4 Comparison of stability of air in fresh concrete (0.3%C)
8
9
10
10
11
12
13
14
14
15
16
0 15 30 45 60
Air
Co
nte
nt[
%]
Time[min]
Air_G[%]
Air_S[%]
Air_L[%]
Air_B[%]
0.70
0.75
0.80
0.85
0.90
0.95
1.00
1.05
1.10
0 15 30 45 60
Air
/Air
t=0
Time[min]
Air/Airt=0_G
Air/Airt=0_S
Air/Airt=0_L
Air/Airt=0_B

CHALMERS, Civil and Environmental Engineering, Master’s Thesis 2012:99 44
Table B.3 Stability of air in fresh concrete (0.45%C)
AEA Dosage
Air content[%]
0 min 15min 30min 45min 60min
GYQ 0.45%C 13.36 13.02 12.52 12.53 12.59
Sika-S 0.45%C 15.57 13.98 12.87 12.44 11.99
Sika 88 L 0.45%C 15.53 14.18 14.14 13.57 13.63
BASF 0.45%C 13.44 13.03 12.58 13.15 12.81
Figure B.5 Stability of air in fresh concrete (0.45%C)
Figure B.6 Comparison of stability of air in fresh concrete (0.45%C)
8
9
10
10
11
12
13
14
14
15
16
1 2 3 4 5
Air
Co
nte
nt[
%]
Time[min]
Air_G[%]
Air_S[%]
Air_L[%]
Air_B[%]
0.70
0.75
0.80
0.85
0.90
0.95
1.00
1.05
1.10
0 15 30 45 60
Air
/Air
t=0
Time[min]
Air/Airt=0_G
Air/Airt=0_S
Air/Airt=0_L
Air/Airt=0_B

CHALMERS, Civil and Environmental Engineering, Master’s Thesis 2012:99 45
Table B.4 Stability of air in fresh concrete at maximum air content
AEA Dosage
Air content[%]
0 min 15min 30min 45min 60min
GYQ 3.9%C 25.33 22.92 22.4 21.9 22.13
Sika-S 4.5%C 32.12 32.31 31.72 31.53 31.13
Sika 88 L 3.9%C 30.59 27.09 25.37 24.78 24.72
BASF 3.0%C 21.4 19.7 19.74 19.88 19.93
Figure B.7 Stability of air in fresh concrete at maximum air content
Figure B.8 Comparison of stability of air in fresh concrete at maximum air
content
18
21
24
27
30
33
0 15 30 45 60
Air
Co
nte
nt[
%]
Time[min]
GYQ
Sika-S
Sika 88 L
BASF
0.80
0.84
0.88
0.92
0.96
1.00
1.04
1.08
0 15 30 45 60
Air
/Air
t=0
Time [min]
GYQ
Sika-S
Sika 88 L
BASF

CHALMERS, Civil and Environmental Engineering, Master’s Thesis 2012:99 46
Table B.5 Air content measured by gravimetric method on the same sample
(Limitation)
AEA Dosage Air content (Immediately) [%] Air content (One hour) [%]
GYQ 3%C 24.14 20.29
Sika-S 3%C 28.88 28.41
Sika88L 3%C 28.55 20.99
BASF 3%C 20.96 18.22
Here 0.12% GYQ, 0.45%Sika-S, 2% Skia 88 L and 1.1% BASF solutions were used..
Figure B.9 Size distribution of Air in fresh concrete (3%C, immediately)
Figure B.10 Size distribution of air in fresh concrete (3%C, one hour later)
0
3
6
9
12
15
18
21
24
27
30
50 75 100 125 150 200 300 500 1000 2000
Pe
rce
nta
ge
[%]
Air size[μm]
GYQ(0)
Sika-S(0)
Sika88-L(0)
BASF(0)
0
3
6
9
12
15
18
21
24
27
30
50 75 100 125 150 200 300 500 1000 2000
Pe
rce
nta
ge
[%]
Air size[μm]
GYQ(1)
Sika-S(1)
Sika88-L(1)
BASF(1)

CHALMERS, Civil and Environmental Engineering, Master’s Thesis 2012:99 47
Table B.6 Comparison of air content measured by gravimetric method and AVA (Immediately)
Cement AEA Dosage Air content[%] Air content(<2mm)[%] Air content(<0.35mm)[%]
Anläggningscement
(1st)
GYQ(0.6%) 0.3%C 11.63 15.8 10.6
Sika-S(0.45%) 0.3%C 11.94 17.3 11.3
Sika88-L(2%) 0.2%C 12.19 7.9 1.8
BASF(1.1%) 0.3%C 11.24 15.6 10.8
Anläggningscement
(2nd)
GYQ(0.6%) 0.3%C 11.7 17.1 11.6
Sika-S(0.45%) 0.3%C 13.2 16.1 9.6
Sika88-L(2%) 0.2%C 11.35 16.3 11.3
BASF(1.1%) 0.3%C 11.77 16.4 14.3
Anläggningscement
GYQ(1.2%) 3%C 24.14 28.6 21
Sika-S(0.45%) 3%C 28.88 36.7 29.2
Sika88-L(2%) 3%C 28.55 32.2 22.9
BASF(1.1%) 3%C 20.96 22 16.8
CEMΙ42,5R GYQ(1.2%) 3%C 24.75 32.8 28.5
Sika-S(0.45%) 3%C 29.4 34.4 27.5
CEMⅠ42, 5R+Slag GYQ(1.2%) 3%(C+S) 21.46 23.5 20.1
Sika-S(0.45%) 3%(C+S) 28.86 37.7 31.2

CHALMERS, Civil and Environmental Engineering, Master’s Thesis 2012:99 48
Table B.7 Comparison of air content measured by gravimetric method and AVA (One hour later)
Cement AEA Dosage Air content[%] Air content(<2mm)[%] Air content(<0.35mm)[%]
Anläggningscement
(1st)
GYQ(0.6%) 0.3%C 11.49 15.3 9.7
Sika-S(0.45%) 0.3%C 11.48 15.7 10.2
Sika88-L(2%) 0.2%C 11.86 11.2 8.8
BASF(1.1%) 0.3%C 12.12 11.9 9.4
Anläggningscement
(2nd)
GYQ(0.6%) 0.3%C 11.58 20.1 15.2
Sika-S(0.45%) 0.3%C 12.46 21.9 14.6
Sika88-L(2%) 0.2%C 11.6 19.8 14.3
BASF(1.1%) 0.3%C 12.25 13.7 11.6
Anläggningscement
GYQ(1.2%) 3%C 20.29 25.7 21.7
Sika-S(0.45%) 3%C 28.41 32.1 24.2
Sika88-L(2%) 3%C 20.99 23.8 18.8
BASF(1.1%) 3%C 18.22 21.6 18
CEMΙ42,5R GYQ(1.2%) 3%C 21.03 22.7 19.8
Sika-S(0.45%) 3%C 28.19 32.3 25.7
CEMⅠ42, 5R+Slag GYQ(1.2%) 3%(C+S) 18.55 24 14.4
Sika-S(0.45%) 3%(C+S) 27.63 47.5 31.2

CHALMERS, Civil and Environmental Engineering, Master’s Thesis 2012:99 49
Figure B.11 Relationship of air content measured between AVA (<2 mm) and
gravimetric method
Figure B.12 Relationship of air content measured between AVA (<0.35 mm) and
gravimetric method
y = 1.173x + 1.5366
R² = 0.819
0
5
10
15
20
25
30
35
40
45
50
0 5 10 15 20 25 30 35 40 45 50
Air
Co
nte
nt
(<2
mm
,fro
m A
VA
)[%
]
Air content (Gravimetric Method)[%]
y = 0.9863x - 0.8168
R² = 0.8376
0
5
10
15
20
25
30
35
40
45
50
0 10 20 30 40 50
Air
Co
nte
nt
(<0
.35
mm
,fro
m A
VA
)[%
]
Air content (Gravimetric Method)[%]