stability and run-off conditions - startsida - sgi · stability and run-off conditions ... 4.4...
TRANSCRIPT

LINKÖPING 2005
STATENS GEOTEKNISKA INSTITUTSWEDISH GEOTECHNICAL INSTITUTE
Repor
t 68
Stability and run-off conditions– Guidelines for detailed investigation of slopesand torrents in till and coarse-grained sediments
KARIN RANKKA
JAN FALLSVIK


STATENS GEOTEKNISKA INSTITUTSWEDISH GEOTECHNICAL INSTITUTE
RapportReport No 68
LINKÖPING 2005
Stability and run-off conditions– Guidelines for detailed investigation ofslopes and torrents in till and coarse-grainedsediments
KARIN RANKKA
JAN FALLSVIK

SGI Report No 682
Swedish Geotechnical InstituteSE–581 93 Linköping
SGI Information serviceTel: +46 13 20 18 04Fax: +46 13 20 19 09E-mail: [email protected]: http://www.swedgeo.se
0348-0755SGI-R--05/68--SE
123031-0309-0545
Rapport/Report
Order
ISSNISRN
Project number SGIDnr SGI

Stability and run-off conditions 3
Preface
These guidelines for carrying out detailed investigations of the stability and run-off conditions in slopes and torrents in till and coarse-grained sediments, have beendeveloped by the Swedish Geotechnical Institute (SGI).
The Swedish Rescue Services Agency (SRSA) and SGI have financed thedevelopment of the guidelines.
The following persons have both scientifically and technically reviewed the report:
- Siegfried Sauermoser, Forsttechnischer Dienst für Wildbach und Lawinen-verbauung, Innsbruck, Austria.
- Hans Alexandersson, The Swedish Meteorological and Hydrological Institute,Norrköping. Chapter 6.
- Gerhard Markart, The Austrian Federal Institute for Forest Research, Innsbruck,Austria. Chapter 5.
- Rolf Larsson, SGI. Chapter 4.- Leif Viberg, SGI.- Göran Sällfors, Chalmers University of Technology. Chapter 4.
Information has been provided by Wolfgang Gattermayr, Wasserwirtschaft, Amtder Tiroler Landesregierung, Innsbruck and Johan Åsell, Åre kommun.
The authors wish to thank all who have taken part in the development of theseguidelines.
Linköping, February 2005
Karin Rankka and Jan Fallsvik

SGI Report No 684

Stability and run-off conditions 5
Contents
Preface ....................................................................................................... 3
Summary ....................................................................................................... 8
1 Introduction .................................................................................................... 121.1 Background ............................................................................................. 121.1.1 SRSA funding for prevention of landslides and debris flows
in till and coarse-grained sediments ........................................................ 141.2 Objective ................................................................................................. 14
2 Destructive mass movements .................................................................... 152.1 Landslides ............................................................................................... 152.2 Debris flows in torrents ........................................................................... 16
2.2.1 Definition of a torrent .................................................................. 182.2.2 Soil material distribution along the bottom of a torrent .............. 18
3 General description for guidelines on detailed investigations ............ 203.1 Landslides and shallow erosion in open slopes ...................................... 203.2 Debris flows in torrents ........................................................................... 20
4 Slope stability analysis .................................................................................. 224.1 Introduction ............................................................................................. 224.2 Shear strength in till and coarse-grained sediments ................................ 234.3 Field investigation ................................................................................... 25
4.3.1 Introductory study prior to field investigation ............................ 254.3.2 Levelling and positioning ............................................................ 254.3.3 Groundwater and pore pressure ................................................... 254.3.4 Sounding and seismic measurements .......................................... 264.3.5 Sampling ...................................................................................... 264.3.6 Density determination ................................................................. 27
4.4 Vegetation, erosion and boulders ............................................................ 274.5 Laboratory investigation ......................................................................... 284.6 Extended investigation ............................................................................ 284.7 Calculation of the safety factor ............................................................... 284.8 Recommended safety factors .................................................................. 284.9 Documentation of results from the investigation .................................... 30
SGI Report No 686
5 Run-off conditions .......................................................................................... 315.1 Catchment area ........................................................................................ 315.2 Run-off coefficients ................................................................................ 33
5.2.1 Typical values of run-off coefficients ......................................... 345.2.2 Choosing the right run-off coefficient ......................................... 365.2.3 Examples of run-off coefficients from Sweden ........................... 39
5.3 Run-off velocities ................................................................................... 405.3.1 Run-off velocities in natural streams and channels ..................... 405.3.2 Run-off velocities on a natural ground surface ........................... 44
5.4 Run-off time ............................................................................................ 445.5 Formulas for run-off flow ....................................................................... 455.6 Run-off distances .................................................................................... 46
6 Precipitation .................................................................................................... 476.1 Introduction ............................................................................................. 476.2 Different types of precipitation ............................................................... 48
6.2.1 Convective precipitation .............................................................. 486.2.2 Orographical precipitation ........................................................... 486.2.3 Frontal precipitation .................................................................... 496.2.4 Combination of precipitation types ............................................. 49
6.3 Design precipitation ................................................................................ 496.3.1 Return period for design precipitation ......................................... 496.3.2 Design duration ........................................................................... 506.3.3 Precipitation records .................................................................... 50
6.4 Recommendations ................................................................................... 516.5 Example of design precipitation for Mörviksån in Åre .......................... 52
7 Masses transported by a debris flow ......................................................... 537.1 Available masses ..................................................................................... 53
7.1.1 Available masses that can be transported in one debris flow ...... 537.1.2 Total sediment potential .............................................................. 55
7.2 Deposition areas ...................................................................................... 557.3 Transportation capacity ........................................................................... 57
7.3.1 Example of calculated transportation capacity ............................ 59
8 Field investigation in torrents ..................................................................... 618.1 Introduction ............................................................................................. 618.2 Introductory study prior to field investigations ...................................... 628.3 Survey of maps and photos ..................................................................... 62
8.3.1 Topographical or similar maps .................................................... 628.3.2 Black and white aerial photos ...................................................... 628.3.3 Geological maps .......................................................................... 638.3.4 Geomorphological maps .............................................................. 638.3.5 Infrared (IR) coloured aerial photos ............................................ 638.3.6 Ortho-photos ................................................................................ 64
8.4 Route preparation .................................................................................... 64

Stability and run-off conditions 7
8.5 Measuring instruments and other equipment .......................................... 648.6 Field investigation methodology in torrents ........................................... 658.7 Discussion with citizens, land owners and staff at the municipality ...... 66
9 Documentation of the detailed investigation ......................................... 699.1 Landslides ............................................................................................... 69
9.1.1 Report 1 ....................................................................................... 699.1.2 Report 2 ....................................................................................... 69
9.2 Torrents ................................................................................................... 749.2.1 Report 1 ....................................................................................... 749.2.2 Report 2 ....................................................................................... 76
10 References ..................................................................................................... 78References to literature mentioned in the report ..................................... 78Suggestions for further studies ............................................................... 80
Appendix A ..................................................................................................... 82
Appendix B ..................................................................................................... 90
Appendix C ..................................................................................................... 92
SGI Report No 688
Summary
Introduction
This report is a guideline for detailed investigations of the stability and run-offconditions in slopes and torrents1 in till and coarse-grained sediments. Theguidelines are intended to serve as a guide not only for geotechnical engineers butalso for the landowners and local and central authorities facing problems relatingto such conditions.
The type of investigations needed varies considerably between the two types ofmovement, landslide and debris flow, that can occur in slopes and torrents. Hence,the report is divided into two parts; one for landslides and the other for debris flows.
In regard to both landslides and debris flows, the following main parts are describedin this report:
• Field investigations• Run-off conditions• Calculation methods• Documentation
Many areas with prerequisites for landslides and/or debris flows have satisfactorystability and therefore it is recommended that the investigations give a limitedextent. The aim is to determine whether a real problem exists.
Mass movements in Sweden
Sweden has long experience of slope stability analysis in clay and silt sedimentsdue to several large landslides that damaged railway tracks and other infrastructuresin the early 20th century. General stability mapping of the landslide hazard in areaswith clay and silt sediments has been carried out by the Swedish Rescue Services
1 A torrent is a gully-formed area in which a stream is flowing and this stream will sometimestransport soil material, as a debris flow, from higher to lower altitudes, see Chapter 2.2.1.

Stability and run-off conditions 9
Agency since 1987. The mapping method is described by Fallsvik & Viberg(1989).
However, mass movements in Sweden also occur in slopes and torrents in till andcoarse-grained soils such as gravel and sand. These mass movements are mostlytriggered by long periods of rainfall or by heavy rainfalls. After heavy rainfalls inthe 1990’s, causing many problems in terrain with a sharp relief, a need for moreknowledge and instruction concerning investigation methods to finding areas indanger was identified.
Two different types of mass movement, landslides and debris flows, may be foundin these areas. These movements can be extensive causing severe impact anddamage in the vicinity.
Detailed investigation of the landslide hazard
The detailed investigation of the landslide hazard aims at determining the slopestability in areas with potential risks of landslides and erosion. The slope stabilityis expressed mainly by a safety factor and by a description of the possibility oferosion and concentration of water.
The safety factor has to be calculated using well-proven computer programs. Thedata input to the calculations should be based on field investigations of thetopography, the stratigraphy, the soil type, the groundwater and pore pressuresituation, and the shear strength of the soil.
The investigation of the erosion hazard is based on a field investigation of thevegetation situation, the grain size distribution and the possibility of concentrationof water flow. Boulders in the slope should also be investigated.
The requirements on safety factors differ depending on the type of land use, thehazards involved, the type of investigation performed (rough estimate, detailed orin-depth) and the type of stability analysis performed. The requirements are ingeneral accordance with those used for investigating the stability conditions inclay, silt and sand sediments (see Swedish Commission on Slope Stability, 1995).
Detailed investigation of the debris flow hazard
In the case of torrents, there are mainly two types of problem; high water discharge,which may cause debris flow, and unstable slopes towards the bottom of the torrent.

SGI Report No 6810
The debris flow hazard thus depends on the volume and velocity of water and thevolume of transportable soil material. Landslides in slopes towards the torrent maybring soil material and trees down to the bottom of the torrent, causing dammingof the brook. During high discharges in the brook, this material may once againbegin to move and cause severe erosion and damage downstream.
Detailed investigation of a torrent and its catchment area mainly consists of adetermination of the run-off conditions, the design rainfall (involving rain intensity,duration and total amount of precipitation), the peak discharge and the availableand transportable amount of solid material.
The run-off conditions determine how the rainwater will proceed after it hasreached the vegetation or the ground. The conditions are influenced mainly by thegeology, the soil type, the vegetation cover, the topography, the groundwaterconditions, the type of precipitation and the shape of the catchment area. Thedifferent conditions are investigated from maps, air photos interpreted in stereo anda careful field study.
The precipitation conditions can be analysed from measurements performed by theSwedish Meteorological and Hydrological Institute, SMHI, close to the area. Thesemeasurements are, however, most often made only once a day and in the case oftorrents mostly rainfalls with shorter duration, up to a few hours, are of interest. Forsuch rainfalls, the Dahlström method (Dahlström, 1979) may be used. Thepossibility of a larger amount of rain at higher altitudes than the measuring levelalso has to be considered.
The peak discharge and its duration may be calculated with different empiricalrelations. The run-off conditions, rain intensity and size of the catchment area areinput to these calculations. The transportation capacity of the debris flow may alsobe calculated using empirical relations. Mainly, the peak discharge and theinclination of the bottom of the torrent determine the transportation capacity. Theamount of transportable soil material along the bottom and banks of the torrent alsoaffect the transportation capacity. The amount and position of the material have tobe evaluated in the field.

Stability and run-off conditions 11
The calculations give the peak discharge and the amount of material that can betransported by a one debris flow for different positions along the torrent.
Documentation of the content and results of the detailed investigation
The content and the results of the detailed investigation should be documented intwo separate reports:
• Report 1: Results of field and laboratory investigations.• Report 2: Assumptions, analysis, calculations and, if there is a need for
preventive measures, suggestions and rough estimates for type, position anddesign of such measures.

SGI Report No 6812
1.1 BACKGROUND
In Sweden, most problems with mass movements have occurred in areas with clayand silt sediments. Landslides with the most severe consequences have occurred inquick clay areas. General stability mapping of the landslide hazard in areas withclay and silt sediments has been carried out by the Swedish Rescue ServicesAgency since 1987. The mapping method is described by Fallsvik & Viberg(1989).
However, mass movements in Sweden also occur in slopes and torrents in till andcoarse-grained sediments like gravel and sand. These mass movements are mostlytriggered by a long period of rainfall or by heavy rainfalls. After a number of heavyrainfalls in the 1990’s, causing many problems in terrain with a sharp relief a needfor more knowledge and instruction concerning investigation methods to findingareas in danger was identified.
Two different types of mass movement, landslides and debris flows, may occur inthese areas. These movements can be very extensive, causing severe impact anddamage in the vicinity. Even though mass movements in these soils most commonlyoccur in the least populated areas of Sweden, there is a need for a general stabilitymapping method and guidelines on how to carry out detailed stability investigationsof these slopes. These methods and guidelines should as far as possible beanalogous to the existing general stability mapping method for slopes in clay andsilt sediments.
Areas in Sweden with prerequisites for landslides and debris flows in coarse-grained sediments are• slopes with soil cover and an inclination greater than 17 degrees• all gullies and torrents• slopes with poor vegetation cover• areas with scars from erosion, landslides and debris flows
Chapter 1.
Introduction

Stability and run-off conditions 13
Thus, by analogy, the stability investigations for slopes and torrents in till andcoarse-grained sediments are planned to be performed in the following main stages:
• Preparatory study• Stage 1 – General stability mapping• Stage 2 – Detailed stability investigation• Stage 3 – Projecting and design of preventive measures
The preparatory study and the general stability mapping are planned to be carriedout on a municipal level. The preparatory study delimits the parts of the municipalitieswhere the general stability mapping is to be carried out.
The purpose of the general stability mapping is to indicate where detailedinvestigations are required. On commission by the Swedish Rescue ServicesAgency (SRSA), the Swedish Geotechnical Institute (SGI) in co-operation withChalmers University has developed a method for survey mapping (Stage 1) ofslopes in till and coarse-grained soils, Viberg et al. (2004). The mapping methodhas a structure similar to the existing method for clay and silt areas. The objectiveof the mapping method is to identify areas in risk of landslides and/or debris flowsand consequently where a detailed investigation is necessary.
The survey mapping method is intended to be used for slopes and torrents in till andcoarse-grained sediments in Sweden. The most common soil to be mapped will betill, which comprises a large range of compositions – from fine-grained to stony andboulder-rich types. Talus formations and sand and gravel sediments will be rarer.Bedrock slopes are not included in the method.
Guidelines for detailed stability investigations (Stage 2) of mass movements in tilland coarse-grained sediments are presented in this report. The correspondingdirection for slope stability investigations in clay and silt sediments can be foundin the Swedish Commission on Slope Stability, Directives for slope stabilityinvestigation, Report 3:95, (1995).
On behalf of SRSA, guidelines for project planning and design of preventivemeasures (Stage 3) have been developed by SGI. The guidelines are presented byRankka & Fallsvik (2003).
SGI Report No 6814
1.1.1 SRSA funding for prevention of landslides and debris flows in tilland coarse-grained sediments
The bodies responsible for performing and financing the detailed investigations arethe landowners, e.g. affected municipalities, real estate owners and/or boards ofroad and railroad administrations as well as private land ownvers.
Nevertheless, on application, the SRSA can subsidise part of the costs for planning,designing and performing the preventive measures found to be necessary in Stages2 and 3. Only municipalities can apply for subsidies.
1.2 OBJECTIVE
The guidelines given in this report are planned to be used for directing detailedinvestigations (Stage 2) in slopes and torrents in till and coarse-grained sedimentsin Sweden. The guidelines will form the course of action for both the landownersand those performing the detailed investigations.
Furthermore, the guidelines will form the basis for decision-making by SRSA oneconomic contribution towards necessary preventive measures.

Stability and run-off conditions 15
Chapter 2.
Destructive mass movements
There are many types of flow or mass movement involving water and sedimentsthat can occur on steep slopes and along torrents (for a definition, see Chapter 2.2.1)in mountainous and hilly areas. They include mud flows, debris flows, granularflows, flash floods, debris avalanches and landslides. The classification differs inthe literature and it is relatively difficult for an untrained person to distinguish onephenomenon from another. In this report, we will concentrate on two types of massmovement; landslides and debris flows.
2.1 LANDSLIDES
Landslides are here defined as rapid mass movements where sliding occurs alonga surface which, in till and coarse-grained soils, often is planar, although it mayhave other shapes. The sliding masses often come to a stop close to the bottom ofthe slide. They have more or less the same structure as before the slide, unlike debrisflows that undergo extremely large deformations during the flow. If the watercontent is sufficient and the slope inclination very high, the masses may proceeddownwards as a debris flow, see Chapter 2.2. A landslide that originates in rockyand granular masses and thus has a high content of granular material is often definedas a debris avalanche (Coussot & Meunier, 1996).
The sliding surface is mostly shallow, up to a few metres in depth, and is most oftentriggered by one or more of the following factors:
- high pore pressure in the soil due to intense rainfalls after periods of long-termprecipitation and/or snow melt
- shear stress exceeding the shear strength of the soil- a critical slope inclination- thawing of frozen ground- clear-cutting or insufficient vegetation cover- human activity- falling or rolling pieces of rock from the slope above

SGI Report No 6816
Landslides can occur both in slopes along the side of a torrent and in slopes notconnected to torrents, i.e. so-called open slopes. Scars from landslides createpossibilities of water infiltration, thereby increasing pore pressure and possiblycausing new slides. Debris flows triggered by a landslide often cause intenseerosion and create channels in the slopes. These channels form the basis for newtorrents or gullies.
2.2 DEBRIS FLOWS IN TORRENTS
According to Coussot & Meunier (1996) a debris flow is an event during which alarge volume of a highly concentrated viscous water-debris mixture flows througha stream channel. Debris flows usually follow pre-existing drainage ways, but canmove down hill-slopes and across unobstructed fan surfaces in almost any directionbecause flows tend to build there own channels as levees form at the lateralboundaries of the flow (Costa, 1984). The flow can be extremely destructive andtransport both large boulders and trees. The triggering factor for a debris flow ismost often an intense rainfall in an area characterised by poor run-off conditions,thus leading to a very quick run-off and a high peak discharge in the stream.Because of sparse rainfall data in most mountain areas, the intensity or duration ofprecipitation required to mobilize side-slope materials is poorly known (Costa,1984).
There are many types of water/debris mixture flow, differing mainly in regard toflow, sediment concentration, deposit structure and type of sediment. Theclassification of a debris flow according to its concentration of sediments differs inthe literature, but values between 50 and 90% of total volume are given by Coussot& Meunier (1996). Flows with a volume of water above 40% are denoted streamflows (Lorenzini & Mazza (2004).
Coussot & Meunier (1996) also describe a debris flow as a transient flow withalmost periodic surges and state that the velocity is approximately the same for thesolid particles as for the water. On the other hand, in flash floods the coarsest solidparticles have a mean velocity differing significantly from that of the water-solidsuspension that flows around it. After a debris flow event, lateral levees left by theflood may be seen on the sides of the stream. Usually, such levees are not formedby landslides.
Along the same torrent, different types of water-debris mixture flow may occurdepending on the precipitation (and thus the flow), the inclination and the availableamount of material in different longitudinal sections.
Stability and run-off conditions 17
Many different classification systems have been proposed by authors such asVarnes (1978), Costa (1984), Coussot (1992), Coussot & Meunier (1996), Hungr& Jakob (2005). According to Costa (1984) three principal types of flow appeardepending on the amount of water, the current velocity, the bottom inclination ofthe torrent and the supply of loose soil material. These are:
1. Water flood (flash flood, clear-water flood) occurs when the volume andcurrent of water are of such a magnitude that the soil material forms only a smallpart of the total volume. Suspended soil particles tumble downwards. Whendeposited, sediments are generally stratified and sorted to poorly sorted.
2. A mud flood or hyperconcentrated flood consists of a rapid water currentcontaining a high amount of suspended soil particles, which is mainly transporteddownwards as a bedload. The trigger of a mud flood could be an extreme watercurrent along a torrential creek-gully, which can bring into motion existing soil ordebris accumulated along the gully. The bottom material originates in many casesfrom older landslides, debris flows or mud flood events, as well as from weathering,glacial transportation and alluvial transportation. When deposited, sediments aregenerally poorly sorted with a weak stratification and no sharp defined marginsexist.
3. A debris flow consists of a more or less coherent viscous mass of soil and waterin rapid movement down a slope or torrent. During the movement, the debris flowtends to increase in volume and the deposition process results in the formation oflobes with irregular surfaces (Lorenzini & Mazza, 2004). The trigger of a debrisflow could be a severe water flow and/or a landslide in saturated soils higher up inthe slope. When deposited, there is no separation of debris flows into solid andliquid components as in water and mud flows. Levees and lobes of poorly sorteddebris are formed.
Some characteristics of the different types of the above mentioned flows aredescribed in Table 1.
In the literature, mud floods and debris flows are often combined in the same groupof flow types – “debris flows” – the vocabulary also chosen in this guide.
Material from a landslide deposited along the bottom of a torrent may, if the watercurrent in the torrent on the particular occasion is high enough, be transportedfurther downstream, following the torrent as a debris flow.

SGI Report No 6818
On its propagation, the debris flow causes erosion. As a rule, the debris flow createsan erosion channel along which additional soil material as well as parts of thepresent vegetation (turf, bushes, complete trees, logs, branches, etc.) will beloosened, broken and successively assembled by the debris flow. Along its path andin its final accumulation area, a debris flow can cause severe damage to buildings,structures, forests, fields, pastures and domestic animals, as well as loss of humanlife.
2.2.1 Definition of a torrent
A torrent is a gully-formed area containing a stream that sometimes will transportsoil material, as a debris flow for instance, from higher to lower altitudes. InAustria, for instance, torrents are defined in law.
Torrents are most often formed in soil, in solid rock or in a deep and wide fissurebetween two mountains, due to repeating extreme high water discharge duringintense precipitation. Torrents are often found in steep slopes in erodible till andcoarse-grained soil material, see Figure 1. Torrents may also be formed by repeateddebris flows in a scar from an earlier landslide.
2.2.2 Soil material distribution along the bottom of a torrent
Along the bottom of a torrent the inclination varies. On steep sections, the watercurrent will be fast, and hence is characterised by high kinetic energy. Dependingon the bottom inclination, torrents can be divided into three characteristic types ofsection with respect to the ability of the water current to generate and maintain adebris flow:
Eroding sections – On steep sections with a high discharge and erodible materialalong the bottom or the banks, erosion may bring soil in suspension, which cancontinue as a debris flow.
Table 1. Some characteristics of different flow types, after Costa (1984).
Flow type Proportion of solid Densitymaterial [weight %] [t/m3]
Water flood (flash flood) 1 – 40 1.01 – 1.3
Mud flood (hyperconcentrated flows) 40 – 70 1.3 – 1.8
Debris flow 70 – 90 1.8 – 2.6

Stability and run-off conditions 19
Transport sections – On moderate steep sections the suspended soil material canremain in transport mode.
Deposit sections – In less inclined areas the suspended soil material will bedeposited.
The type of section for a specific position in the torrent may vary depending on theseasonal and occasional stream discharge conditions. However, as to triggering andconsequences of debris flows, the peak discharge conditions are of primary interest.
Figure 1. Torrent formation in Kittelfjäll, community of Vilhelmina.(Photo: K. Rankka)

SGI Report No 6820
Chapter 3.
General description for guidelineson detailed investigations
In these guidelines, detailed investigation of the hazard of mass movements inslopes and torrents is divided into two main categories; landslides and debris flows.These two categories require different field investigations, different types of datainput and presentations. A general description of the required detailed investigationsis presented below.
3.1 LANDSLIDES AND SHALLOW EROSION IN OPEN SLOPES
The landslide and shallow erosion hazard is normally affected by the followingparameters, which all require investigation throughout the area:
• the inclination of the slope• the type, strength and depth of the soil• the groundwater condition• the type, cover, height and position of vegetation• the possibility of infiltration of run-off water• man-made features of the slope, such as ditches, culverts, roads and other
structures.
The hazard is mainly presented as a factor of safety, F, as well as by a descriptionof the possibility of erosion and concentration of water. The investigation identifiesareas with a high landslide hazard and areas in danger of being hit by sliding massesor material transported by debris flows.
A more detailed description is given in Chapter 4.
3.2 DEBRIS FLOWS IN TORRENTS
The debris flow hazard in torrents is mainly affected by the volume of water andthe peak discharge that can reach the torrent on a single occasion and the volumeof soil material that is available to, and transportable by, the water flow. The debrisflow hazard is therefore dependent on the following parameters, which all requireinvestigation throughout the catchment area:

Stability and run-off conditions 21
• size, shape and topography of the catchment area• run-off conditions• precipitation (amount, duration, intensity and return period)• amount of soil material available to a debris flow• peak discharge
To calculate the peak discharge, it is first necessary to determine the run-offconditions, which in turn will determine the proportion of the precipitation that willrun off directly to the brook and the rate at which it will flow in different parts ofthe catchment area. The run-off conditions are determined by field investigationand empirical equations. The time it takes for the most remote water-droplet in thearea to flow down to the lower parts of the area determines the duration of the designrainfall. The design rainfall has to be estimated based on measurements performedin or close to the area, preferably at different altitudes. The Swedish Meteorologicaland Hydrological Institute stores precipitation measurement records from about800 stations spread throughout the country. The amount of precipitation fallingwithin a short period of time, normally a few hours, can be determined using amethod developed by Dahlström (Dahlström, 1979), see Chapter 6.4.
By conducting a field investigation, it is possible to evaluate the amount of soilmaterial available for the peak discharge to transport further downstream. Thetransport capacity of the peak discharge may be determined with the aid of anempirical method.
The debris flow hazard is given by the peak discharge, the volume of transportablemasses, the transport capacity of the peak discharge and the stability and erosionconditions in the surrounding slopes.
A more detailed description is given in Chapters 5, 6, 7 and 8.

SGI Report No 6822
< 2o
17o< 250 m
soil>17o
Chapter 4.
Slope stability analysis
4.1 INTRODUCTION
The aim of a detailed investigation in slopes is to determine the slope stability ofareas which have either been identified in general stability mappings as havingpotential landslide hazards or designated for new construction on or close to steepslopes. The slope stability is expressed mainly by a safety factor, as well as by adescription of the possibility of erosion and concentration of water.
Many areas with prerequisites for landslides and/or debris flows have satisfactorystability and it is therefore recommended that the preparatory study will be givena limited scope. The aim at that stage is to determine whether a real problem exists.
In the general stability mapping, Stage 1, only slopes that fulfil all the followingrequirements are selected as areas in need of further investigation, see alsoFigure 2.
• Settlements within the areas. The buildings shall be situated closer than 250 mfrom the toe of the slope if the ground surface behind the crest of the slope is flat(inclination less than 2 degrees).
• Slopes with a minimum inclination of 17 degrees.• Slopes with soil cover.
Note that in areas below the toe of the slope with an inclination larger than 2o
material from a debris flow may remain in transport mode.
Figure 2. Areas in need of slope stability investigation.

Stability and run-off conditions 23
These guidelines also apply to areas where exploitation is planned.
With the aid of rough calculations and topographical considerations, a number ofcritical sections are selected. In this selection, the slope inclination, the estimatedsoil depth, the vegetation cover and scars from earlier events are used as guides. Thedistance between two investigated sections over a potential landslide area shouldnormally be less than 50 metres.
Field and laboratory investigations in these sections are intended to provide generalinformation on the following parameters:
• Topography of the ground surface• Soil conditions – soil type, soil layers, soil depth, geometry of underlying
bedrock, bedrock outcrops• Soil strength• Groundwater and pore pressure conditions• Soil moisture• Vegetation – type and cover• Traces of earlier landslides and erosion• Boulders in dangerous positions
4.2 SHEAR STRENGTH IN TILL ANDCOARSE-GRAINED SEDIMENTS
The shear strength in coarse-grained tills and coarse-grained sediments is mostlyregarded as a direct function of the effective normal stress, σ'N, along the slidingsurface and the friction angle, φ', according to the Mohr-Coulomb formula:
'tan' φστ N=
The friction angle is not a constant but varies with mineral composition, relativedensity, stress situation, grain strength, grain shape and boundary conditions in thespecific loading situation. The fact that the friction angle decreases with increasingnormal stress should be taken into account in slope stability analyses. A densemultiple-graded soil has generally a higher friction angle compared to a single-graded soil, see Table 2.
The friction angle may be determined in laboratory tests, but it is most oftendetermined through empirical relations. Different empirical relations are found inLarsson (1989a).

SGI Report No 6824
The angle of friction can be derived empirically from the grading and the relativedensity, as outlined in Table 2. Tills are generally referred to as multiple-gradedsoils. Due to their genesis, being formed by and below the glaciers, they cannormally be considered as having a high relative density. Exceptions are redepositedmaterials, such as slide or erosion debris. Sediments, like sand and gravel, havebeen deposited by water or gravitational processes. Gravitational processes mostlygive rise to sediments with a low relative density, whereas water processes yielddifferent densities. The relative density is the actual density in relation to themaximum density to which the material can be compacted.
In clay till (Sw: lermorän) both undrained and drained behaviour need to beinvestigated. The undrained shear strength may be determined by CPT, see Chapter4.3.4, field vane or by pressuremeter (see Larsson, 2001).
The drained shear strength in fine-grained soils is most often determined by theMohr-Coulomb formula:
'tan'' φστ Nc +=
Different empirical relationships for linking the undrained shear strength, cu, theeffective friction angle and the cohesion intercept, c', with other soil properties havebeen proposed by authors such as Jacobsen (1970) and Hartlén (1974). Testsperformed by Larsson (2001) show that the empirical relations mostly used inSweden for clay may be used also for clay till. The cohesion intercept, c’, is thenevaluated from the undrained shear strength as 0.1cu and the friction angle is set to30 degrees.
Table 2. Schematic variation of friction angle in coarse-grained soils with gradingand relative density. The values apply to cases with low normal stresses,i.e. shallow slip surfaces in slopes. At increasing normal stresses, thevalues of the friction angles approach those for a low relative density.(From Larsson, 1989a).
Type of soil Angle of friction, φφφφφ', at different relative densities
Low Normal High
Single-graded 27° 32° 37°
Medium-graded 29° 35° 41°
Multiple-graded 30° 37° 44°
Stability and run-off conditions 25
4.3 FIELD INVESTIGATION
Field investigations are both important and compulsory. They must be performedin accordance with recommended standard procedures, if such exist. Before thefield investigation is carried out, a thorough introductory study should be carriedout in the office.
4.3.1 Introductory study prior to field investigation
The introductory study prior to the field work consists of the following items:
• interviews with local inhabitants and persons representing local authorities• retrieving reports from earlier geotechnical investigations (or others of interest)
in the vicinity• defining the extent of the area to be investigated• survey of maps• stereo air photo interpretation, including studies of traces from earlier slides and
soil movements• estimation of the number and distribution of field test sections and points
The survey of maps and air photos should follow the guidelines given in Chapter8.3.
4.3.2 Levelling and positioning
For determination of the geometry of the ground surface, a levelling is performed.A map with an equidistance of 1 metre or less between the isometric lines may alsobe used, if available. All points to be investigated shall be positioned.
4.3.3 Groundwater and pore pressure
An assessment of the groundwater condition in critical parts of the slope area shouldbe performed. Readings from open ground water pipes with filter tips installed inthe soil layers should be used. The measurements should be carried out for asufficiently long time to enable seasonal and temporary rain-induced variations tobe studied and extreme values to be determined.
If only a few or no measurements of the ground water conditions can be carried out,the ground water conditions must be estimated by making cautious and unfavourableassumptions. The possibility of artesian ground water pressures has to be taken intoaccount.

SGI Report No 6826
Wet sections in the slope subsurface and/or sections covered by water demandingplants may indicate high groundwater tables, see Chapter 5.2. In these sections,ground water measurements are of special importance.
4.3.4 Sounding and seismic measurements
Sounding or different types of seismic measurement should be used to determinethe soil stratigraphy and the soil depth. The distance between the sounding testpoints along the profiles should normally not exceed 50 metres. One point shouldbe located at the crest of the slope and one at the toe.
Soil-rock drilling and/or seismic reflection or refraction measurements may beused to determine the soil depth. For information on different types of seismicmeasurement, the reader is referred to for instance Möller et al. (2000) and Dahlinet al. (2001). Depending on the coarseness and stiffness of the soil layers, CPT ordynamic probing may be used in order to determine the stratigraphy in sand, graveland fine-grained till.
In clay till, cone penetration tests, CPT, may sometimes be used. The CPT providesinformation on the stratigraphy and the shear strength parameters (both drained andundrained). In soils with a high heterogeneity, it is recommended that a relativelylarge number of tests be performed in order to obtain the variation and results thatare representative for the bulk of the soil mass (Larsson, 2001).
Geotechnical investigations using a drill rig may be difficult to perform in steepslopes. In Austria, for example, excavators and drill rigs equipped with climbingrods and wires are used. When investigations are very expensive to carry out anda rough evaluation indicates that the stability is unsatisfactory, a cost-benefitanalysis may show that it is more economical to relocate the endangered objects.
4.3.5 Sampling
Sampling should be carried out in all types of soil. Where it is possible to performCPTs, the sampling can be reduced to what is required to verify the preliminaryclassifications from the sounding results. In some areas, sampling with a screwauger may be possible, whereas in other areas test pits must be dug in which the soilconditions can be further investigated. The test pits can be dug by an excavatorequipped with climbing rods and wires.
The relative distance between the test points along the profiles should normally notexceed 50 metres.

Stability and run-off conditions 27
4.3.6 Density determination
The density of the different soil layers may be measured with the aid of a watervolume meter in the different soil layers in the test pits. A coarser estimation of thedensity of the soil layers can also be made according to Table 3. This estimation isbased on the type of soil and the location of the groundwater table.
4.4 VEGETATION, EROSION AND BOULDERS
The stability conditions in steep slopes are affected by the type and cover ofvegetation as well as by the possibilities for concentrations of the water flow. Adense cover of shrubs and trees slows down the surface run-off and also reduces thepore pressures. Clear-cutting may therefore lead, after some time, to higher porepressures and hence an increased hazard of slips and landslides. Removal ofvegetation cover during construction in steep slopes should be performed with caresince it may lead to surface erosion. It is of great importance that the run-off waterbe diverted to other areas until the vegetation is re-established. It is advisable to re-plant the vegetation before the next winter season. For further details of vegetationand run-off, see Chapter 5.
Wheel tracks in steep slopes may lead, and thus concentrate, water to sensitiveareas. Scars from uprooted trees may introduce more water into the soil. Theseaspects have to be studied during the field investigation and the consequencesanalysed.
Large boulders in the area and the risk of boulders loosening and falling should beinvestigated.
Table 3. 1 Typical bulk density values for sand, gravel and till in different groundwater conditions. (After Larsson, 1989b).
Type of soil Bulk density [t/m3]
Saturated soil (ρρρρρm) Soil situated above ground water level (ρρρρρ)
Sand and gravel 2.0 – 2.3 1.6 – 2.0
Till 2.1 – 2.4 1.8 – 2.3

SGI Report No 6828
4.5 LABORATORY INVESTIGATION
Laboratory investigations on samples taken in the field are performed mainly inorder to determine the soil type (grain size distribution) and the natural watercontent.
4.6 EXTENDED INVESTIGATION
In the guidelines for slope stability investigations of clay, silt and sand sediments(see Swedish Commission on Slope Stability, 1995) also extended and supplementaryinvestigations following the detailed investigation are described. These investigationsaim at:
• giving the basis for a more thoroughly slope stability calculation• giving the size of the area at risk• giving the basis for a consequence analyses• giving the basis for planning of preventive measures
For areas in till and coarse-grained sediments an extended investigation mayinclude a determination of the pore pressure situation in the whole slope includingits seasonal variation and prognosis of its extreme values. It may also include adeeper investigation of the soil properties, the presence and extension of layers anddepth to bedrock. Such investigations are though not described in this report.
4.7 CALCULATION OF THE SAFETY FACTOR
Slope analyses are normally carried out by using well-proven computer programs.Slip surfaces of planar, circular and arbitrary shapes should be considered. For tillswith considerable clay contents, e.g. clay tills, both drained and undrainedbehaviour should be considered (so called combined analysis) for each slice. Forsoil layers containing coarser types of till as well as sand or gravel, it is sufficientto perform drained analysis.
The drained and combined analyses should be carried out for the most unfavourablegroundwater and pore pressure conditions.
4.8 RECOMMENDED SAFETY FACTORS
The recommendations concerning safety factors differ depending on the type ofland use, the consequences involved, the type of investigation (rough estimate ordetailed) and the type of stability analysis. The requirements are in generalaccordance with those used for investigating the stability conditions in clay, silt and

Stability and run-off conditions 29
sand sediments. However, there are a number of modifications relating to thedifficulty of obtaining accurate and relevant shear strength properties in the typesof soil considered in this document.
Depending on the direct consequences of a landslide for human life, buildings andstructures, the slope stability calculations should be carried out with differentrequirements. Four different types of area depending on land use are employed:
- New exploitation areasWhen planning areas on, above, beside or below slopes with the intention of newexploitation with buildings and structures, i.e. dwellings, hotels, commercialareas, schools, industrial areas, roads, ski-lift installations, dams, major drainagesystems, sewers and cables etc., the demands on the required safety factor (F)are the highest. Also rebuilding and extension of existing buildings andstructures fall into this category.
- Built-up areasThe requirements are slightly lower for areas that are already built-up, e.g. areasincluding present buildings and structures. However, these requirements areonly applicable as long as there are no factors or actions that reduce stability.Restrictions therefore often have to be imposed.
- Other areasThe requirements are even lower for areas containing only buildings andstructures of less importance and which are visited by people only duringdaytime. This category involves local streets, parking lots, garages, secondarysewers and cables, parks, pedestrian and bicycle paths, sports grounds and skipistes.
- Open countryIn open country areas, there are no demands.
For unexploited slopes facing torrents, from which landslides can release soilmasses that become involved in future debris flows, a geotechnical inspectionand a rough estimate of the stability conditions and hence the volume of themasses involved in a possible landslide should be made. This is sufficient toform a basis for an estimation of the volume of soil masses available for transportby future debris flows in the torrent.

SGI Report No 6830
The recommended lowest safety factors (F) are given in Table 4 in a similar wayto investigation of the stability conditions in clay, silt and sand sediments (seeSwedish Commission on Slope Stability, 1995).
The recommended levels of the safety factor (F) may in some cases be slightlyhigher or lower depending on the amount of favourable and unfavourableprerequisites. Prerequisites that should be regarded are the type and amount of fieldand laboratory tests, the geometry and condition of the slope, ground- and porewater situations, the soil properties, the consequences of a slide, the type andextension of slope stability analyses. If a calculated F-factor is acceptable accordingto the table, no further investigation is normally required, provided that all thepreconditions are fulfilled.
4.9 DOCUMENTATION OF RESULTS FROM THEINVESTIGATION
Recommendations for documentation of results from detailed investigations inslopes are presented in Chapter 9.1.
Table 4. Recommended safety factor (F) in different investigation stages depen-ding on type of land use and slope stability analysis method. (Modifiedafter Swedish Commission on Slope Stability (1995)).
Investiga- Soil Intended or present type of land usetion stage Conditions New Present buildings Other Nature areas
exploitation and structures areas (if the surroundingareas are notaffected)
Geotech- Till Insufficient1 Fcφ > 1.50 Fcφ > 1.45 Fcφ > 1nicalinspectionand rough Sand and Insufficient1 Fφ > 1.50 Fφ > 1.45 Fφ > 1estimate gravel
Detailed Till Fcφ and FCOMB Fcφ and FCOMB Fcφ and FCOMB Fcφ and FCOMBinvestiga- > 1.45 ≥ 1.40 ≥ 1.40 > 1tion
Sand and Fφ ≥ 1.35 Fφ ≥ 1.3 Fφ ≥ 1.3 Fφ > 1gravel
1 At least a detailed investigation has to be carried out for new exploitation.

Stability and run-off conditions 31
Chapter 5.
Run-off conditions
The risk of erosion, debris flows and shallow landslides is dependent on the run-off conditions in the area. The run-off conditions determine how the rainwater willproceed after it has reached the vegetation or the ground, for instance how muchof the water will be left in the crowns of the trees, how much will penetrate the soilor bedrock and how fast the rainwater will flow on the surface. The run-offconditions are influenced by the following parameters:
• vegetation cover (type, amount, evapotranspiration)• topography and shape of the catchment area• geology• amount and location of brooks in the catchment area• soil conditions (type, thickness, structure, pore volume, hydraulic conductivity)• inclinations of slopes, of bottom of the torrent and of brooks (large and small
scale)• drainage and infiltration characteristics• ground water and soil moisture content• precipitation condition (intensity, duration and distribution over the year)• land use (roads, ski pistes, artificial drainage, buildings, structures, meadows,
forests)
It is obvious that the run-off conditions in a catchment area (see Chapter 5.1) arenot constant but vary both during the year and with specific conditions. The run-off conditions are often expressed by a dimensionless run-off coefficient, which isdescribed in Chapter 5.2. Furthermore, the amount of water that runs off directlyinto a brook may be calculated using various formulas, which are described inChapter 5.5.
5.1 CATCHMENT AREA
A catchment area is defined as the land area, usually horizontally projected, fromwhich all run-off water enters the same stream, upstream of the point of interest.The boundary of the catchment area is called the watershed.

SGI Report No 6832
The watershed configuration, and hence the extent of the catchment area, can beillustrated by drawing a line by hand with guidance from the elevation contour lineson a detailed topographical map (a map which shows the inclination and height ofthe ground by elevation lines) with a scale of 1:20 000 or preferably larger and thedifferences between the elevation lines nor more than 10 meters. If a detailed digitaltopographical map is available, the watershed can be drawn by using the existingtools for construction of the watershed line in a– geographic information system ,i.e. ARC-Info, MAP-info etc. The horizontally projected size of the catchmentarea, A, may be determined either with a planometer or, better, by using a GIS.
From a run-off point of view, a small catchment area (< 10 km2) behaves in adifferent way to a large catchment area (> 100 km2). Progressively smaller andsteeper basins have the potential to transport an increasingly larger percentage oferoded material by mass-wasting processes such as debris flows (Costa, 1984).This is because of the following aspects:
• Rainstorms drop proportionally larger volumes of water on smaller basins• Smaller basins are usually the highest, where snowpacks accumulate and can
melt rapidly in the spring,• Hillsides in smaller basins have steep slopes resulting in greater instability of
surficial materials
The probability of a large catchment area being completely covered by a showerwith a high intensity is low. The run-off from a small catchment area is also moresensitive to changes in land use. In larger catchment areas, this sensitivity will besuppressed due to a higher water storage effect in the watercourse, as well as inlakes and ponds. Also the shape of the catchment area plays an important role.Figure 3 shows two different shapes of catchment area. Provided all otherconditions are the same, all the water from the long area will reach the stream muchfaster compared with the wide area. However, the flow will differ much more alongthe stream bed in the long area compared with the wide area. The highest run-offvalues are from heart-shaped catchment areas, since the water droplets have thesame distance to flow from nearly every point in the catchment area (Sauermoser,2004).

Stability and run-off conditions 33
5.2 RUN-OFF COEFFICIENTS
Most often, the run-off condition is expressed by a dimensionless run-off coefficient,Ψ, which is normally considered to have a constant value, although in reality thisis usually not the case. The run-off coefficient expresses how much of the totalamount of rainwater will run off directly over the surface (surface run-off) withoutinfiltrating the soil or remaining in the tree crowns or in bushes. The coefficient isa number between 0 and 1, where 1 indicates that all rainfall runs off directly. Thedimensionless run-off coefficient is used in different formulas and models for run-off calculations, see Chapter 5.5.
Mostly, the run-off coefficient is assumed to be independent of the rain intensityfrom the point when a constant run-off is reached. A constant run-off is reachedafter overcoming run-off delay effects at the beginning of the rain event, e.g. initialabstraction. Kohl & Markart (2002) showed that this assumption is valid for rainintensities from 30 to 120 mm per hour on research plots with sizes between 75 and100 m2. Recent experiments by Kohl & Markart for rain intensities of approximately100 mm per hour covering larger areas (400 m2), showed that generally this schemefits and therefore the assumption seems realistic (Markart, 2004). For rain intensitiesbelow 10 mm per hour, they found that the run-off coefficient slowly increases withincreasing rain intensity.
Figure 3. Different shapes of catchment area.
Wide-shaped catchment area
Long-shaped catchment area

SGI Report No 6834
5.2.1 Typical values of run-off coefficients
Markart et al. (2004) presented results from artificial irrigation tests on slopescovered with different types of vegetation. Some typical values of run-off coefficientsmeasured in their study are presented in Appendix A. The run-off coefficient varieswidely depending on the type of vegetation, land use, penetrability of water throughthe ground surface, thickness of the soil layer and permeability of the soil layers.The highest run-off coefficients are found for thin and dense soil layers with a highmoisture content and where the vegetation consists of grazed grasses, extensivelyused grassland containing a high amount of dead biomasses in the litter layer andshort-growing herbs. A low surface run-off is achieved with shrubs, trees and a non-smooth soil surface. Dense soil, mostly found in clay-rich soils from crystallinemountains, leads to a high number of river channels and gullies, while porous soil,mostly found in limestone mountains, leads to a low number of river beds(Sauermoser, 2004).
Grazing is not recommended as erosion protection or on slopes where the run-offneeds to be reduced. This is due to the fact that grazing most often leads to a densegrass cover that makes it difficult for the water to infiltrate the ground. The use ofgrazing as landslide protection is, however, suitable on slopes where the pore waterpressure needs to be reduced. However, the grazing has to be planned carefully.Heavy animals, such as cows, often destroy the soil surface and form paths whichcan be the starting point for rain infiltration. A small number of sheep grazing fora brief period is to be preferred. Grazing may reduce the growth of unwantedspecies, such as nettle, raspberry and different types of brushwood, and therebyincrease the possibilities for desired species to grow.
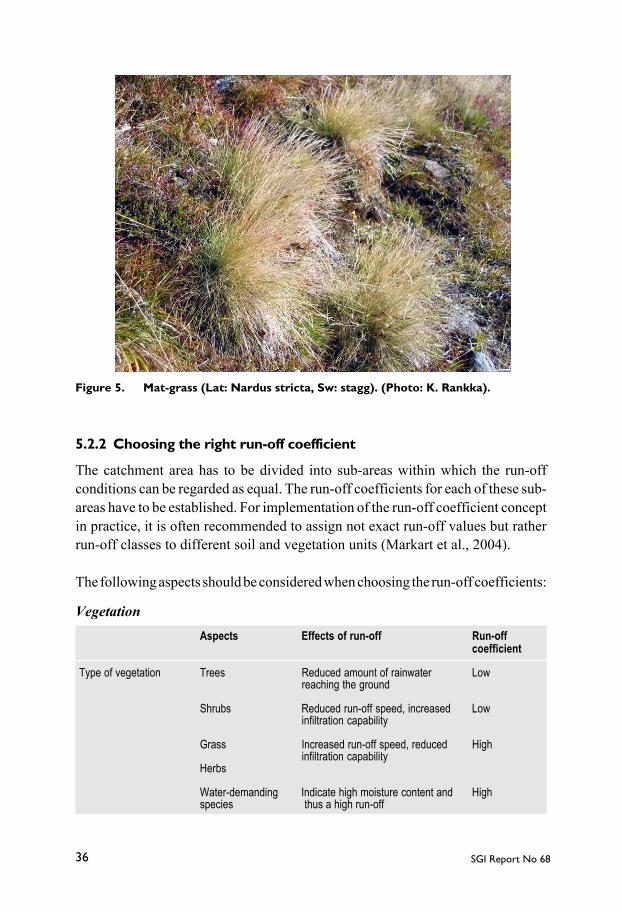
By looking at the different species growing in an area, an indication of the soilmoisture content and run-off conditions may be obtained. Three-leaved rush (Lat:Juncus trifidus, Sw: klynnetåg) requires very little nourishment and prefers a dryand exposed habitat in the Swedish mountains, see Figure 4. However, most of theother species in the Juncus family, such as three-flowered rush (Lat: Juncustriglumis ssp triglumis, Sw: lapptåg) and two-flowered rush (Lat: Juncus biglumisSw: polartåg), prefer wet soil conditions. The species mat-grass (Lat: Nardusstricta, Sw: stagg) forms a dense root system and acts like a thatched roof, therebyeffectively preventing infiltration and giving a high run-off coefficient, Figure 5.
In the case of woody vegetation, many species from the salix family indicate wetsoil conditions. Species found in Table 5, common in the Swedish mountains , allindicate a high moisture content and thus a high run-off coefficient. For areas

Stability and run-off conditions 35
Table 5. Example of species common in the Swedish mountains (Fjällen),which prefer wet soil conditions.
Species
English name (Eng) Latin name(Lat) Swedish name (Sw)
Alpine saw-wort Sausurea alpina Fjällskära
Marsh marigold Caltha palustris Kabbeleka
Wood horsetail Equisetum sylvaticum Skogsfräken
Alpine garden angelica Angelica archangelica ssp archangelica Fjällkvanne
Three-flowered rush Juncus triglumis ssp triglumis Lapptåg
Bog bilberry Vaccinium uliginosum ssp microphyllum Odon
Greyleaf willow Salix glauca Ripvide
Tea-leaved willow Salix phylicifolia Grönvide
Globeflower Trollius europaeus Smörboll
Woolly willow Salix lanata Ullvide
outside the mountains an investigation of growing species and there requirementof water has to be analysed.
Figure 4. Two species indicating high run-off conditions.
Three-leaved rush (Lat: Juncus trifidus,Sw: klynnetåg). Photo: G. Markart
Wood horsetail (Lat: Equisetaceae sylvaticum,Sw: skogsfräken) are found on moist and oftenpoor soils. Photo: G. Markart
SGI Report No 6836
5.2.2 Choosing the right run-off coefficient
The catchment area has to be divided into sub-areas within which the run-offconditions can be regarded as equal. The run-off coefficients for each of these sub-areas have to be established. For implementation of the run-off coefficient conceptin practice, it is often recommended to assign not exact run-off values but ratherrun-off classes to different soil and vegetation units (Markart et al., 2004).
The following aspects should be considered when choosing the run-off coefficients:
Figure 5. Mat-grass (Lat: Nardus stricta, Sw: stagg). (Photo: K. Rankka).
VegetationAspects Effects of run-off Run-off
coefficient
Type of vegetation Trees Reduced amount of rainwater Lowreaching the ground
Shrubs Reduced run-off speed, increased Lowinfiltration capability
Grass Increased run-off speed, reduced Highinfiltration capability
Herbs
Water-demanding Indicate high moisture content and Highspecies thus a high run-off

Stability and run-off conditions 37
Aspects Effects of run-off Run-offcoefficient
Vegetation cover Dense An area with a dense vegetation Lowcover of shrubs and trees, welltreated meadows and combinationsof trees, shrubs and herbs. Not forextensively used grassland. Thesetypes of areas give good possibilityfor infiltration.
Sparse High
Grazing, maintenance Grazing May both increase and reduce High and lowrun-off, see Chapter 5.2.1.According to Markart et al. (2004),uniform grazing with light animalsincreases the run-off coefficient byapproximately 0.1 – 0.2.
Maintenance To achieve the desired vegetation Lowtype and cover, maintenance of thearea may be necessary.
Aspects Effects of run-off Run-offcoefficient
Type of bedrock Presence of fractures Reduced run-off due to possibility Lowof infiltration
Weathered surface Reduced run-off since surface is Lownot smooth
Type of soil Coarse-grained Reduced run-off since surface is Lownot smooth
Fine-grained Reduced possibility of infiltration Highand mostly forms a smooth surfacewhich increases run-off
Porosity – high High porosity increases possibility Lowof infiltration
Permeability – high High permeability increases Lowpossibility of infiltration
Thickness – large Large thickness increases Lowpossibility of infiltration
Soil and bedrock condition

SGI Report No 6838
Inclinations of slopes (large and small scale)Steep slopes have both higher run-off coefficients and shorter run-off timescompared to lesser steep slopes, all other factors being similar. For areas wellcovered by vegetation, the effect of inclination is, however, of minor importance(Markart, 2004). The average inclination of the slopes in the catchment areashould be studied. Nevertheless, it is important not only to look at the averageinclination but to identify possible depression points where water can be storedfor shorter or longer periods. Occurrences of depression points reduce the run-off coefficient.
DrainageDrainage channels that lead the water away from a slope reduce the run-offcoefficient in the slope, but may increase the run-off coefficient for the wholearea. It is of great importance for the channels to be designed correctly, to becleaned and to be regularly checked regarding their function.
Soil moisture contentThe surface run-off increases when the soil moisture content is high. Duringsnow melt and after long periods of rainfall, the run-off coefficient is thereforeoften very high.
Artificial snow is stiffer than natural snow and thereby melts slower, which isboth positive and negative. The positive effect is that less snow melts at the sametime on warm days compared to natural snow. The negative effects are that moresnow deposited on the slope has to melt and that the stiff artificial snow coveracts as a very high run-off area. Run-off water will overflow on top of the stiffsnow cover and thereby run off very quickly. A run-off coefficient of about 0.9can be assumed for run-off on artificial snow.
Precipitation (intensity, duration and time of the year)As mentioned earlier, Kohl and Markart (2002), found that the run-off coefficientincreases with increasing rain intensity up to about 10 mm per hour. For higherintensities the values are fairly constant. When choosing a suitable value for therun-off coefficient, the possible types of rain in the area should be studied. Thepossibility of intense precipitation during snow melt and after long periods ofrainfall (mostly during the autumn) also has to be taken into account.

Stability and run-off conditions 39
Land use (roads, ski pistes, meadows, artificial drainage, buildings,structures, forests)Different types of land use have a significant effect on the run-off coefficient.The construction of a ski piste, for example, destroys the soil structure andvegetation cover, and thereby most often increases the run-off coefficient. Itmay take years and a great deal of effort to achieve good infiltration again.
Scars from wheels and ditches not protected from erosion may be the startingpoint for a debris flow. Roads have high run-off coefficients since the soil hasbeen compacted.
5.2.3 Examples of run-off coefficients from Sweden
No direct measurements of run-off coefficients in catchment areas have beenperformed in Sweden. Indirect measurements were carried out in the catchmentareas of Bergebäcken and Fjällvallen in the municipality of Åre by Wilén et al.(1993). The catchment areas, each with a size of about 0.65 km2, are characterisedby:
• relatively flat slopes• lack of deep gullies and valleys• vegetation in the direction from the lower altitudes with spruce forest, birch
forest, heather moors and a bare mountain region above the tree-line• a number of ski pistes in the catchment area of Bergebäcken• depression points, small ponds
Average run-off coefficients for the whole catchment areas were estimated bymeasuring the precipitation and the water discharge in the central brooks. Thecoefficient for Bergebäcken was estimated to be 0.36 and for Fjällvallen 0.41. Thecoefficients were estimated as average values for precipitation during the summermonths of 1989 to 1991.
A detailed investigation of the run-off and stability conditions in Mörviksravinenin the municipality of Åre, was performed by SGI in 2003 on commission from themunicipality of Åre (see Rankka & Fallsvik, 2003 and 2004). The run-offcoefficient used in the investigation varied between 0.15 and 0.6, with a mean valueof 0.3.

SGI Report No 6840
5.3 RUN-OFF VELOCITIES
The run-off velocity in a catchment area depends on the inclination of the slopesand the stream bottom, the type of vegetation cover, the smoothness and roughnessof the ground surface and the cross-section area of the brook. The run-off velocityhas to be determined in order to decide what rain duration to use in calculating thedesign water discharge.
The run-off velocity of interest is the velocity of the most remote raindrops in thecatchment area during their flow down to the point of interest, for instance theselected position of a sedimentation dam. The time it will take for these drops to runthrough the catchment area, down to the dam, the run-off time, determines theduration of the rainfall to be used as design rainfall, see Chapter 6.3.
The run-off velocity may differ between flows in natural streams, channels andsurface run-off.
5.3.1 Run-off velocities in natural streams and channels
Calculations according to Manning formula for channel flowAccording to the Manning formula, the velocity of water at fully developedturbulent steady flow in pipes or channels can be calculated as:
IMRv 3/2= [m/s]
where M= Manning coefficient [m1/3/s]R = A/P [m2/m]A = wet area [m2]P = wet perimeter [m]I = bottom gradient [height/length]
The Manning formula requires the flow to be unaffected either by damming belowthe place of interest or by overcritical flow above. The formula requires measurementsof the wet area (width and height of flow) and the wet perimeter during earlierdebris flows. If no measurements have been made during the earlier debris flow,traces in the river bed may be found and investigated to obtain relevant data, butonly for a few weeks after the event.
The use of the Manning formula in the context of brooks may be discussed since,among other things, it has been developed for clean water. According to Rickenmann

Stability and run-off conditions 41
(1999) the mean velocity of debris flows and clear water can, however, be describedin an initial approximation with almost the same formulae. The values should beaccepted with caution and used only to obtain an estimate of the flow velocity.
One difficulty with the Manning formula is the choice of the Manning coefficient,M. Zeller (1974) recommends values of 5 to 25 for the Manning coefficient in steep,rocky natural terrain. Zeller’s guidelines are used by the Forsttechnischer Dienstfür Wildbach und Lawinenverbauung in Austria (Sauermoser, 2004). Chow (1959)and French (1985) presented extensive tables of values for the Manning coefficientfor various types of channels, streams and rivers. A few of these values useful inthe case of natural streams are presented in Table 6. Rickenmann (1999) mentionedthat the peak flow velocity of debris flows may be estimated with a Manningcoefficient equal to 10.
Table 6. Some values of the Manning coefficient according to French (1985)for natural streams
Description of stream Manning coefficient, M
Mountain streams, no vegetation in channel, banks usually steep,trees and brush along banks submerged at high stages
- Bottom: gravel, cobbles and few boulders 20 – 25- Bottom: cobbles with large boulders 14 – 20
Streams on plains- Clean, straight, full stage, no rifts or deep pools 30 – 33- Very weedy, reaches, deep pools or floodways with heavy stands 6 – 10of timber and underbrush
Rickenmann (1999) suggests a semi-theoretical value of the Manning coefficient,M, as a function of the flow as:
15/1)Q(077.0M1 = [–]
where: Q = water or debris flow [m3/s]
The factor 0.077 is based on debris flow records from Italy, Switzerland, USA,China and New Zealand. With the formula suggested by Rickenmann, a flow valueof 4 m/s gives a value of the Manning coefficient of 12.

SGI Report No 6842
According to experiences in Austria, the Manning formula generally gives excessivevelocities in calculations of debris flow velocities in brooks. For this reason, inAustria, a velocity higher than 6 m/s is never used (Sauermoser, 2003). It shouldalso be taken into account that during high flood, the flow consists of both waterand debris, which gives a low velocity in comparison with clean water.
An adjustment of the formulas and values given above to Swedish conditions isdesirable.
Calculations based on the transverse inclination ofthe stream surface in a bendThe flow velocity in a natural stream or in a channel can be determined empiricallyusing a formula suggested by Haiden (Sauermoser, 2004). The formula is based onthe transverse inclination, due to centripetal acceleration, of the stream surface,which occurs when the water flows through a bend. The velocity is calculated as:
srghv ⋅⋅=max [m/s]
where h = the vertical uplift of the water, according to Figure 6, [m]s = the width of the flow, according to Figure 6, [m]r = the bending radius of the brook at the point of observation, [m]g = gravity acceleration [m/s2]
The mean water flow velocity in the section is determined as:
2maxv
vmean = [m/s]
and the flow:
meanvAQ ⋅= [m3/s]
where A = cross section area, according to Figure 6, [m2]

Stability and run-off conditions 43
The use of the formula suggested by Haiden requires that traces in the brook fromearlier events can be measured, see Chapter 8.6.
Measurements of run-off velocitiesRun-off velocities in natural streams may be measured during heavy rainfalls. Themeasurements have to be related to the intensity and duration of the precipitation.
Wilén et al. (1993) gives results from measurements of water discharges in thebrooks of Bergebäcken and Fjällgårdsbäcken in the municipality of Åre. Themeasurements were made using a V-shaped Tomson weir and took placecontinuously during the snow-free periods of 1989-1991. The results were relatedto the amount, duration and intensity of precipitation. The mean flow velocitythroughout the catchment areas was found to be 0.08 m/s (mean value for bothbrooks). The catchment areas are characterised by uniform moderately inclinedslopes with no gully or valley formation, some flat and some wet areas with highwater storage capacity and relatively good vegetation cover.
Values according to experiencesAccording to Sauermoser (2002 and 2003) the flow velocity for catchment areasformed like a gully with steep slopes can be estimated to be approximately 2 m/s.This velocity corresponds to a mean value for the conditions along the brook,through areas of talus, forest areas with water saturated soil, and moors.
Calculation of flow during earlier eventsThe flow (m3/s) in different sections along the brook may be calculated if thevelocity and wet area have been determined. The calculation of high water flow ispresented in Chapter 5.5.
h
s
A
Figure 6. Section for determination of flow velocity and flow.
SGI Report No 6844
5.3.2 Run-off velocities on a natural ground surface
The run-off velocity on a natural ground surface, outside streams, is dependent onthe same factors as the run-off conditions (see Chapter 5). Measurements of the run-off velocity on natural ground surface may be performed using trace substances,such as fluorescence.
5.4 RUN-OFF TIME
The run-off time is the time it takes for the most remote water droplet to run (ormore strictly: which takes the longest time to run) through the catchment area to thepoint of interest, for instance to a sedimentation dam. The run-off time, T, may becalculated as the run-off distance, L, for the most remote droplets, divided by therun-off velocity, v, using the formula:
vLT = [s]
where: L = run-off distance [m]v = run-off velocity [m/s]
Alternatively, the run-off time may also be calculated according to differentempirical formulas. According to Bergtahler (1986) the run-off time may becalculated as:
Hampel: T = 27.8 ·A0.5 [minutes]Kreps: T = 52.2·A0.4 [minutes]Kirpich: T = 0.0195·L1.155·H-0.385 [minutes]
where: A = catchment area down to the selected dam position [km2]L = run-off distance from the outermost part of the
catchment area [m]H = difference in altitude between the outermost part of the
catchment area and the point of interest [m]
The Hampel and Kreps formulas have been developed for situations in the innerarea of the Alps with moderate rain intensities and large catchment areas. TheKirpich formula has been developed for very heavy precipitation values in the Alps.

Stability and run-off conditions 45
5.5 FORMULAS FOR RUN-OFF FLOW
The so called rational method (also called the Zeller method) is one of the simplestand best known methods routinely applied in hydrology (Kohl & Markart, 2002)for run-off calculations. The rational method expresses the peak run-off flow, HQ,in a specific position along the brook as:
HQ = ψ · I · A [m3/s]
where ψ = run-off coefficient [–]I = rain intensity [m/s]A = catchment area [m2]
The rational method is valid for heavy rainfall and therefore requires a goodknowledge of the rain intensity and duration for short periods (Sauermoser, 2002).Such precipitation records are seldom available and an estimation procedure hasto be used, see Chapter 6.
For precipitation with long duration, about 24 hours, in large catchment areas, amethod suggested by Hampel may be used. According to Hampel (1984) the peakrun-off flow may be calculated as:
−⋅⋅⋅=
240014.0 5.0
150uHAhHQ ψ [m3/s]
where ψ = run-off coefficient [–]h150 = rain height for rainfall of long duration with 150-year
return period [mm]A = catchment area [km2]Hu = height above sea level for lowest part of the torrent [m]
Both the Hampel and Zeller methods are empirical equations constructed for asituation applying to specific places. Calculations of run-off flow should thereforealways be checked against flow records, see Chapter 5.3.1.

SGI Report No 6846
5.6 RUN-OFF DISTANCES
The distances over which the masses may be transported depends on the bottominclination and on the grain size distribution within the flow. Rickenmann (1999)gives a simplified formula for the possible transportation distance, Lf, from the apexof the fan:
3/115 sf VL ⋅= [m]
where: Vs = solid material volume [m3]
Rickenmann (1999) points out, however, that the formula should not be usedsince the scatter between predicted and observed values is too high. Sauermoser(2004) says that this formula is not used in practice. In Austria, the run-offdistance is set to the point where the torrent reaches the main, usuallyperpendicularly oriented, stream unless the flow has left the channel somewherealong the debris cone (Sauermoser, 2004).

Stability and run-off conditions 47
Chapter 6.
Precipitation
6.1 INTRODUCTION
In most cases, debris flows following torrents are triggered by heavy rainfalls, e.g.rainfalls with a high intensity, especially if they follow a long period of rain or snowmelt.
Typically, the cause of precipitation is uplift of warm air, e.g. a vertical movement,of a warm mass of air within the atmosphere. Condensation of water vapour andhence formation of clouds and further rain is often due to these different types ofuplift. Briefly, in the context of uplift of warm air masses, the following physicalconditions are important:
• Warm air is lighter than cold air.
• The ability of an air mass to contain water vapour is reduced through loweringof the air temperature.
• At higher altitudes the air pressure is lower. When an air mass is movingupwards, it will adopt the same pressure as the surrounding atmosphere. Whenthe air pressure decreases, also the temperature will decrease and hence theatmosphere’s ability to contain water vapour also decreases. The water therebycondenses into water droplets forming clouds, and further to precipitation.
• Condensation and, higher up, freezing of cloud droplets causes the release oflatent heat, which warms the air and amplifies the vertical motions.
In general, three different types of precipitation due to uplift are distinguished:convective, orographical and frontal uplift, see Figure 7. These are described in thefollowing sections.

SGI Report No 6848
6.2 DIFFERENT TYPES OF PRECIPITATION
6.2.1 Convective precipitation
On sunny days, the subsurface is heated by solar radiation. In its turn, the heatedsubsurface warms the lower parts of the atmosphere. However, different parts ofthe landscape, such as forests, grasslands, lakes etc., are heated by the sun todifferent degrees, depending on their different reflective abilities. Over these areaswhere the subsurface becomes relatively warmer, also the lower parts of the airmass will become warmer than in the surroundings. Therefore, on warm days, socalled convection cells are formed in the atmosphere where the relatively lighterwarm air is forced upwards. The vertically lifted warm air will be chilled due tothe lower air pressure (see above), leading to condensation of air moisture, andthereby the development of cumulonimbus clouds, generating showers that may becombined with thunder.
The cumulonimbus clouds give rise to a high precipitation intensity. However, theclouds will follow the present general wind direction in the area, and becausecumulonimbus clouds have a small horizontal size, the convective type of rainnormally has a relatively short duration, from a few minutes to 2 – 3 hours.
6.2.2 Orographical precipitation
In hilly terrain and mountainous regions, precipitation may also be triggered by socalled orographical2 uplift. In this case, an air mass is forced to higher altitudes dueto the topography, i.e. the wind blows the air over the mountain ridge. For the samereason as in convective cells, the uplift results in condensation, creating water dropsand hence rain fall, often heavy once.
Figure 7. The three main types of precipitation.
2 Orography, that part of physical geography, which deals with different aspects connected toa sharp subsurface relief like mountains, hills, slopes etc
Convective precipitation Orographical precipitation Front precipitation

Stability and run-off conditions 49
6.2.3 Frontal precipitation
A front constitutes the boundary between two air masses with different temperatures.There are cold fronts and warm fronts depending on the direction in which thedifferent air masses migrate. In both cases, the warmer and hence lighter air masswill be forced up over the colder and heavier air mass. Here again, the uplift resultsin condensation, creating water drops and hence rain. However, in this case the rainwill have a long duration but a moderate or low intensity.
6.2.4 Combination of precipitation types
When a front reaches a mountain range or hilly terrain, the effects of frontal upliftand orographical uplift will be combined, so the rain intensity will be higher on theslopes which are directed to the windward side. On the slopes on the leeward side,however, the rain intensity will be relatively lower.
However, a case of more intense precipitation is the combination between convectiveand orographical precipitation. The latter may occur when a powerful convectivecell, containing warm and humid air of tropical origin, is moved by a strong windupwards over hilly terrain or the slopes of a mountain ridge. In this case, theprecipitation may reach very high intensities, although the duration is often shortor moderate.
6.3 DESIGN PRECIPITATION
To estimate the risk of debris flows and to judge their maximum volumes, thedesign precipitation for the chosen return period has to be established. Three factorshave to be determined regarding the design precipitation: the return period, theduration and the intensity.
6.3.1 Return period for design precipitation
The return period states the time within which the chosen rain intensity and durationwill occur once, statistically. For instance, a return period of 50 years means arainfall that will occur once in 50 years, statistically.
The return period has to be decided for each project, but it is advisable to choosea period of at least 100 years. In Austria, for instance, a return period of 150 yearsis often used in detailed investigations but for hazard mapping a return period of 100years is used.

SGI Report No 6850
6.3.2 Design duration
To establish the design precipitation, the so-called design duration must be knownfor the selected catchment area. The design duration equals the run-off timerequired for the “drop of water”, which has the longest way (or strictly; which takesthe longest time to pass) through the catchment area. Chapter 5.4 describes how tocalculate the run-off time.
6.3.3 Precipitation records
To determine the design precipitation based on precipitation records, it is importantthat the measurements have been carried out in a place that is representative alsofor the catchment area in mind. The place should be close to the catchment area, atthe same altitude and on the same side of high mountains, etc. Furthermore,precipitation records should have been kept for several years.
Information on the precipitation conditions for short durations is rather sparse inmost mountain areas. The Swedish Meteorological and Hydrological Institute(SMHI) has performed long series of measurements of precipitation in its nationwidenetwork of weather stations. About 800 stations with precipitation measurementswere in operation at the beginning of 2001 (Alexandersson & Karlström, 2001).Most of them, more than 700, are manually read stations and readings areperformed only once a day, so there is a lack of information concerning the durationof short rainfalls. However, many of the stations have been used for precipitationmeasurements since the 19th century. The weather stations are unevenly spreadover the country, with a higher density in the southern part of Sweden. If they hadbeen evenly spread, the average distance between the stations would have been23 km. In the most northern part, however, the distances may be more than 60 km.
Furthermore, it is possible that the closest weather stations are not positioned atsites that are representative. The three main types of precipitation described above,in particular the combination between orographical and convective rains, generatedifferent precipitation conditions locally in the landscape. Due to the orographicaluplift, more rain will most probably fall on the higher altitudes within a catchmentarea. Thus, for the specific purpose of gathering local information on the precipitationconditions (rain height and duration) at different altitudes within a selectedcatchment area, often the data from weather stations is not sufficient.
Stability and run-off conditions 51
6.4 RECOMMENDATIONS
Different approaches may be used in handling the problems outlined above. InSweden, a method for calculating the regional distribution of intense precipitationwith duration from 3 minutes to 96 hours with return periods of up to 10 years(extrapolation up to, for instance, 100 and 150 years is possible) has been developedby Dahlström3 (1979). The method is based on continuous time series of precipitationrecords carried out at a number of places in Sweden together with monthly regionaldistribution of convective precipitation and annual mean precipitation in the areastudied. The method requires either precipitation data from a weather station withmeasurements made once a day between the years 1931 and 1960, or a coefficientfor different regions in Sweden. Subsequently, the method has been somewhatmodified to give a better fit to measured values and longer return periods. Onrequest, SMHI can perform calculations according to the Dahlström method forselected areas, precipitation duration and return periods.
In areas with large altitude differences within the catchment area, it is recommendedto find extra and more local sources of precipitation data. Occasionally, theprecipitation may have been measured by local agents other than SMHI, such aslocal authorities, ski piste operators, fire brigades, local military staff, researchers,consultants, contractors etc. and even private persons interested in meteorology.Otherwise, the investigator has to perform his own series of measurements,preferably at different altitudes in the catchment area. These measurements shouldbe carried out for at least two years.
These extra measurements performed at a minimum of one extra altitude will formthe basis for modelling the precipitation at any other altitude.
SMHI has analysed differences in monthly mean rain heights at different altitudesfor a number of places in Sweden (Alexandersson, 2003). As an average, anincrease of 7% per 100 m of altitude, is given as a guideline. However, it is notrecommended to transfer this value to precipitation with short duration, sinceslowly moving frontal rainfall gives a more significant increase in precipitationamount with altitude, compared with showers (heavy rains with short duration).Showers in warm fronts at high altitudes are more insensitive to topographydifferences, but they sometimes cause very heavy cloudbursts (Alexandersson,2004).
3 The equations used in the Dahlström-method are briefly described in APPENDIX C

SGI Report No 6852
In Austria a similar method as the Dahlström method is used to estimate the regionaldistribution of intense precipitation with short duration (Gattermayer, 2004).
6.5 EXAMPLE OF DESIGN PRECIPITATIONFOR MÖRVIKSÅN IN ÅRE
The Dahlström method has been applied to the catchment area of Mörviksån in Åre.The altitudes within the catchment area range from 380 to 1450 m above sea level.The closest SMHI weather station is situated in Duved, about 15 km west ofMörviksån, at almost the same altitude as the lower parts of the selected catchmentarea. The design duration for a rainfall was calculated as 60 minutes, and hence thedesign precipitation for the return period of 150 years was calculated by SMHI as46 mm according to the modified Dahlström method.
Due to the effects of the orographical uplift, a higher precipitation was estimatedto fall at higher altitudes. Long-term precipitation records had never been carriedout at higher altitudes within, or in the vicinity of, the catchment area. However,precipitation measurements had been carried out by Wilén et al (1993) during thesnow-free period of the years 1990 – 91 simultaneously at two sites – on the shoreof Lake Åre in the lower part of the catchment area (altitude 380 m) and inUllådalen 8 km west of the catchment area (altitude 695 m). On most precipitationoccasions, these measurements indicated a higher amount of precipitation inUllådalen than in Åre. With these measurements as guidance for short durationrainfalls, a precipitation increase of 2% per 100 m of altitude change was estimatedup to 1000 m altitude. Over that altitude, no further increase in rain intensity wasestimated.

Stability and run-off conditions 53
Chapter 7.
Masses transported by a debris flow
The amount of masses transported by a debris flow will depend on the available soilmasses in the torrent and the transportation capacity of the debris flow.
7.1 AVAILABLE MASSES
There is no existing method for determining the exact amount of available massesfor a debris flow. The calculation of mass volume should comprise two parts:
• Available masses that can be transported in one debris flow• The total sediment potential in the torrent, i.e. the total mass volumes that are
available for repeated debris flows.
7.1.1 Available masses that can be transported in one debris flow
The available masses have to be estimated in the field. The amount of debris thatcan be transported is a function of the critical shear stress in the riverbed during ahigh flood and it is primarily connected to the inclination, see Chapter 7.3. Thedebris masses come from bank erosion along the sides of the brook, bottom erosionalong the bottom of the brook and material that may reach the brook by landslidesand debris flows from the surrounding slopes. By studying traces from formerdebris flows the amount of eroded material can be estimated.
Fine-grained material is more easily carried by water than by coarse-grainedmaterial. Therefore, the availability of masses in deposits made up of fine-grainedmaterial should be regarded as higher than that from coarse-grained deposits. It isimportant to determine the depth to bedrock. Places where the soil depth is limited,where the brook flows on bedrock or bedrock is found in the slopes, should bemarked.
For slopes facing the torrent, the stability has to be calculated roughly, seeChapter 4. For slopes that are found to be unstable, the amount of material thatcould reach the brook has to be estimated. It is also necessary to take into accountthe number of landslides that might occur during the same time rain fall.

SGI Report No 6854
The estimated available material in Mörviksån in the municipality of Åre is givenin Table 7. One part of Mörviksån is shown in Figure 8. Traces from earlier erosioncan be seen along the right side of the brook. Material has been deposited along thebottom and on the left side (from the photographer) of the brook during earlierdebris flows. This material may be further transported during a high flow.
Figure 8. The stream Mörviksån.
Table 7. Estimation of available masses for one section in Mörviksån.
Type of erosion Available masses Comments
Bank erosion ≈2 m3/m Depth and width 1.5 m each, left side
Bottom erosion ≈1.5 m3/m Depth 0.5 m with an average width of 3 m
Landslide, debris flow from 0 The possibility of landslide materialside slopes reaching the brook is limited

Stability and run-off conditions 55
7.1.2 Total sediment potential
The material sources for debris flows in a catchment area may in some places bealmost endless, while in others the sources are limited. In some catchment areas,the potential is very high, much higher than the amount that can be transported inone event, and it is therefore to be expected that there will be many more events inthe future. A rough estimate of the total sediment potential in the catchment areashould therefore be given.
Knowledge of the total amount of masses is essential when plans are being madefor suitable preventive measures. Check dams, for instance, are built to prevent thebrook from eroding deeper along its bottom. The soil depth along the torrent shouldtherefore be investigated. If the material along the bottom is limited there is no needfor check dams.
7.2 DEPOSITION AREAS
Generally, the bottom inclination varies along the stream within the catchmentarea. Material eroded and transported in one place may, on its way furtherdownstream, enter an area where the inclination is lower. A lower inclinationmeans that the transport capacity of the water decreases and some of the transportedmaterial may settle. Some places along the stream are therefore erosion areas, whileothers are deposition areas. The amount of material that is settled in the depositionareas will depend on the bottom inclination, the type of bottom material, the waterflow (volume and velocity), the cross section area and the size and shape of thetransported material.
The inclination of the bottom of the stream has to be determined. This may be doneusing maps, preferably with high resolution and contour lines having an equidistanceof 1 metre. During a field investigation, it is important to measure the bottominclination and to mark deposition as well as erosion areas, see Chapter 8.6.
The examples shown here in Figure 9 and Figure 10 are from deposition areas alongMörviksån in Åre and in the Stor-Grova gully in Kittelfjäll.

SGI Report No 6856
Figure 9. Deposition area in Mörviksån. (Photo: K. Rankka).
Figure 10. Deposition area in Stor-Grova in Kittelfjäll (Photo: J. Fallsvik)

Stability and run-off conditions 57
7.3 TRANSPORTATION CAPACITY
The amount of material that can be transported by the water flow (see Chapter 5.5)depends on the bottom inclination, the grain size distribution, the high waterdischarge and the duration of the high water discharge.
Methods for estimation of the transport capacity have been suggested by differentresearchers.
Ikeya (1989) suggested that the total volume of transported sediment, Vs, becalculated as:
AHQ18Vs ⋅⋅= [m3]
where: HQ = high water discharge [m3/s]A = the part of the catchment area that has a bottom inclination
of the river bed greater than 10 degrees [m2]
Ikeya´s method is useful for catchment areas between 0.5 and 5 km2. The factor 18is based on measurements of debris flows in Japan. According to other researchers,the inclination is the most important factor for transport capacity. Therefore,Ikeya’s formula may be questionable.
Hampel has suggested different methods of calculating the transport capacity fora debris flow. One method is based, among other things, on the inclination and grainsize distribution of the alluvial fan and the longitudinal distance for bed loadtransport (transportation of material along the bottom of the torrent). The totalvolume of transported sediment, Vs, is calculated according to the equation givenon the next page (see Hampel, 1969 and 1980).
The abrasion coefficient is a factor accounting for the abrasion (weathering) of soilparticles during the bed load transport. Over a long bed load transport distance, theparticle size will become smaller due to weathering and thus the volume of thesediment transported will be reduced. The Central Alps are built up mostly fromcrystalline bedrock and the Chalk Alps are built up from limestone. The equationis based on a precipitation with a return period of 100 years and a duration of 24hours. It is also based on readings referring to a torrent with an altitude of about2 300 m. The estimation of the mean grain size and the abrasion is difficult andhence the formula has not been widely used (Sauermoser, 2004).

SGI Report No 6858
a
da
s c
dIhhAV
a4.042.01
65.1
100 6.355
23001
10
−
⋅−
−⋅
=[m3]
where: A = catchment area [km2]h100 = rain height with a return period of 100 year [mm]h = height above sea level for outflow of water course on
alluvial fan [m]da = mean grain size in alluvial fan [m]a = longitudinal distance for bed load transport [km]I = inclination of the alluvial fan [height/length]c = abrasion coefficient (Central Alps: 0.66, Chalk Alps: 0.80)
Another method of determining the total volume of sediment that may be transported,Vs, by the high water flow suggested by Hampel (see Hampel, 1990) is given as:
Th
dmIIHQV ms ⋅
⋅⋅
−⋅=1.12
5.2 6.0[m3]
where: I = bottom inclination of stream [height/length]HQ= high water flow [m3/s]m = factor according to Table 8dm = mean grain size [m]h = height of discharge [m]T = time of duration of precipitation [s]
Table 8. Factor m according to Hampel (1990).
Bottom inclination, I 0.0 0.1 0.2
Factor m 1 0.8 0.5
Hampel found that the width of the river bed and the depth of the flow have far fromthe same influence on transport capacity as inclination and therefore he reduced hisformula to one variable – inclination. According to Hampel (1990), a simplifiedcalculation of the total volume of sediment that may be transported, Vs, by the highwater flow when the inclination exceeds 5% may then be derived as:
Stability and run-off conditions 59
THQIVs ⋅⋅⋅= 6.1250 [m3]
where I = bottom inclination [height/length]T = time of duration for precipitation [s]HQ = high water flow [m3/s]
Most often, the bottom inclination, I, varies along the stream. This means that thetransportation capacity also differs. When calculating the transport capacity usingthe methods suggested by Hampel, it is therefore inadvisable to use the meaninclination of the bottom. Instead, a longitudinal section of the bottom should bedrawn and based on the need to divide the stream into parts with almost the sameinclination. The transport capacity for each part may then be calculated. The lengthof the different parts should be at least 40 metres.
It has to be pointed out that all the equations presented are empirical and are basedon situations at specific places in Austria or Japan. The results should therefore betaken cautiously and always compared with measured volumes from earlier events.
Chapter 7.3.1 presents results from calculation of transport capacities for Mörviksånin the municipality of Åre.
7.3.1 Example of calculated transportation capacity
Calculation of the total volume of sediment that can be transported to the alluvialfan in a high water flow with a return period of 100 years has been performed withthe aid of a number of methods for Mörviksån. The results are given in Table 9. Theresults show large differences between the methods. It is important to understandthat the calculation of total sediment transport capacity is approximate and givesonly a rough estimate of the possible amount of material that can be transported.The calculated values should always be compared with measured volumes fromearlier events.
As a comparison to the calculated values of transport capacity, some figures fromthe debris flow in June 2003 are given. According to the municipality of Åre, about3000 m3 of soil material was excavated after the event from the sedimentation dam,the channel and surrounding areas, while another 1 000 – 2 000 m3 was estimatedto have flowed into Åresjön. The precipitation was statistically a 20-year eventaccording to the Dahlström method, see Chapter 6.4.

SGI Report No 6860
Table 9. Sediment discharge capacity for Mörviksån according todifferent methods.
Method Input Sediment discharge Reference Commentscapacity, Vs [m3]
Ikeya HQ = 14 m3/s 76 000 Modified after 63% of A is classifiedA = 3.34 km2 Bertilsson as rock and the volume
& Persson (1995) is corrected for this.
Hampel 6 < I < 8 % 16 000 – 37 000 Bertilsson The value of the inclinationFirst 0.72< c <0.80 & Persson (1995) of the alluvial fan stronglyequation h100 = 88.1 mm influences the results.
A = 4.4 km2
ad = 420 asla = 1.7 kmda = 2 mm
Hampel HQ =14 m3/s 11 000 Rankka & Fallsvik Return period 150 yearsThird T = 60 minutes (2003, 2004)equation

Stability and run-off conditions 61
Chapter 8.
Field investigation in torrents
8.1 INTRODUCTION
A field investigation of the entire catchment area has to be carried out both for thetorrent and for the surrounding slopes within the same catchment area. The purposeof the investigation is to:
• estimate the amount of transportable soil material• investigate traces of earlier incidents• investigate the run-off conditions• investigate erosion, transportation and deposition areas, and• establish contacts with people living or working in the area
If information on past debris flow events is available (or can be gathered), this isthe most reliable source for a detailed investigation (Rickenmann, 1999). A fieldinvestigation should therefore be performed directly after an event or, if that is notpossible, during the snow-free period of the year, preferably during a high flow. Aninvestigation directly after an event provides much valuable input to the designcriteria:
• the type of soil transported by the debris flow• an estimate of the amount of transported material, for instance from the amount
of excavated material in the deposition area• an estimate of the velocity of the debris flow in different parts of the brook
derived from measurements of the highest water level (see Chapter 5.3)• unstable areas along the brook and in slopes indicated by scars• the run-off distance of the debris flow along the alluvial fan• the direction of the debris flow• information from people living in the area (see Chapter 8.7).
However, a field investigation is important and necessary even if it is not performeddirectly after a debris flow event. Before the field investigation is carried out anintroductory study should be undertaken in the office.

SGI Report No 6862
8.2 INTRODUCTORY STUDY PRIORTO FIELD INVESTIGATIONS
An introductory study in the office prior to the field investigation is aimed atplanning the investigation and determining points of interest for a more detailedinvestigation. The planning includes aspects such as the way in which differentparts of the catchment area are reached and the number of days required. The workconsists of a survey of maps and photos, route preparation and preparation ofmeasuring instruments and other equipment.
8.3 SURVEY OF MAPS AND PHOTOS
The extent of the catchment area of the whole brook has to be determined andmarked on a map with a scale preferably of 1:5000, but no smaller than 1:20 000.The extent may be determined from ordinary topographical maps, but an airialphoto investigation in stereo provides better accuracy. Below is presented a list ofsuitable maps and the parameters that can be determined from them.
8.3.1 Topographical or similar maps
Topographical maps with a scale of 1:50 000 (called “Topografisk karta”) areavailable from Lantmäteriet (the Swedish Land Survey). Other maps with largerscales, preferably 1:10 000 (for instance “Fastighetskartan”), may also be availablefrom Lantmäteriet. The municipality may also have its own large-scale maps. Themaps are studied in order to determine the following parameters:
• extent of the catchment area• topography• brooks• wetlands• land use• infrastructure
8.3.2 Black and white aerial photos
An investigation of stereo aerial photos (vertical projection and stereo models) mayyield valuable information if performed by a skilled person. Airial photos areavailable with different scales and different ages from Lantmäteriet. Most commonare the photos with a scale of 1:30 000 taken from a height of 4600 metres(“normalhöjdsbilder”). However, the best results are obtained from photos with ascale of 1:10 000 taken from a height of 2000 metres. The following aspects maybe studied from aerial photos:

Stability and run-off conditions 63
• topography• bedrock, soil type and soil cover• scars and deposits from landslide, erosion, debris flow and talus• extent of the catchment area• wetlands• land use• infrastructure• vegetation (cover and type)
8.3.3 Geological maps
Geological maps are available from the Swedish Geological Survey (Sverigesgeologiska undersökningar). For southern Sweden and the coastline of Norrland,the maps have a scale of 1:50 000. For other regions, the scale varies between1:200 000 and 1:250 000. The following aspects may be studied from geologicalmaps:
• type of soil and bedrock• thickness of soil deposits• bare rock
8.3.4 Geomorphological maps
Geomorphological maps are available for some parts of the Swedish mountainousarea as well as for some other places. Some are distributed by the University ofStockholm (Naturgeografiska institutionen) and others by the Swedish GeologicalSurvey. The scale of the maps varies. The following information is given on thegeomorphological maps:
• scars and deposits from landslides, erosion, debris flows and talus• type of scar and deposit (levée, loobe, alluvial fan, bank erosion/bottom erosion,
talus etc.)• recent deposits or deposits from the last ice age• river bed system• inclination• wetlands, springs
8.3.5 Infrared (IR) coloured aerial photos
Infrared (IR) coloured photos are available from “Lantmäteriet”. IR photos withstereo models enable the same information as for black and white aerial photos tobe extracted, but the IR photos offer better possibilities for detection and analysis,

SGI Report No 6864
especially of vegetation, moisture and bare rock.
8.3.6 Ortho-photos
Ortho-photos are often used by the municipality for land use planning andvisualisation of planned roads or buildings. These photos provide the followinginformation of interest:
• vegetation cover (if in colour)• infrastructure and buildings• bare rock or soil• ponds• brooks
8.4 ROUTE PREPARATION
The field investigation should always start from the highest point of the catchmentarea and proceed downwards. The reason is that it is easier to understand theprocesses going on in the catchment area if the investigator follows the same routeas the water. If the main brook is divided into several small brooks, each brookshould be followed from the source to the mouth. It should be noted, however, thatnot only the brook area/areas should be investigated but the whole catchment area.
The information and points of interest found during the survey of different mapsshould be marked on a map with a scale no smaller than 1:10 000. To make itpossible to refer to a specific point along the brook, the brook should be divided intoseveral parts, each with a length of 100 metres. The division starts at the lowestpoint of the brook. A mark is drawn on the map at a distance of 100 metres fromthis point, which is called hectometre 1. Marks are then placed at intervals of100 metres from hectometre 1 and numbered consequently. If the main brookdivides into smaller brooks, these should have their own hectometre divisions. Adivision of Mörviksån is given as an example in Appendix B.
Ways of reaching different parts of the catchment area should be investigated inadvance. Some parts may be accessible by car or by chair lifts. Many parts areprobably only accessible on foot or by horse. In any case, a walk from the top tothe bottom of the catchment area will be necessary.
8.5 MEASURING INSTRUMENTS AND OTHER EQUIPMENT
The recommended measuring instruments and equipment that should be broughtfor the field investigation are described in Table 10.
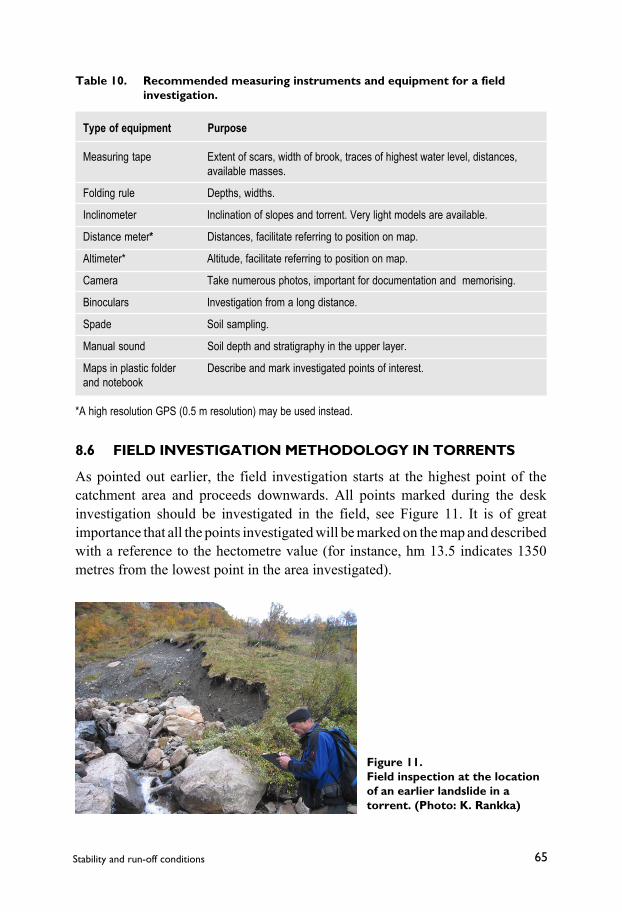
Stability and run-off conditions 65
8.6 FIELD INVESTIGATION METHODOLOGY IN TORRENTS
As pointed out earlier, the field investigation starts at the highest point of thecatchment area and proceeds downwards. All points marked during the deskinvestigation should be investigated in the field, see Figure 11. It is of greatimportance that all the points investigated will be marked on the map and describedwith a reference to the hectometre value (for instance, hm 13.5 indicates 1350metres from the lowest point in the area investigated).
Table 10. Recommended measuring instruments and equipment for a fieldinvestigation.
Type of equipment Purpose
Measuring tape Extent of scars, width of brook, traces of highest water level, distances,available masses.
Folding rule Depths, widths.
Inclinometer Inclination of slopes and torrent. Very light models are available.
Distance meter* Distances, facilitate referring to position on map.
Altimeter* Altitude, facilitate referring to position on map.
Camera Take numerous photos, important for documentation and memorising.
Binoculars Investigation from a long distance.
Spade Soil sampling.
Manual sound Soil depth and stratigraphy in the upper layer.
Maps in plastic folder Describe and mark investigated points of interest.and notebook
*A high resolution GPS (0.5 m resolution) may be used instead.
Figure 11.Field inspection at the locationof an earlier landslide in atorrent. (Photo: K. Rankka)

SGI Report No 6866
Table 11 presents parameters suggested for investigation in the field. It may be usedas a check list during the field investigation.
The need for determination of soil depth, grain size distribution with depth, andground water conditions has to be considered. For slopes not directly threateningsettlements by a landslide, it may be sufficient to estimate the soil depth in the fieldand to investigate the grain size distribution and ground water condition in theupper layer. A spade and manual sound are suitable for this purpose. For slopesdirectly threatening settlements more detailed investigations are required, seeChapter 4. As for the soil depth at the bottom of the brook, it is sufficient to performan estimation in the field and to make a map survey. If the soil depth is estimatedto be great, it will be necessary to determine the exact depth and grain sizedistribution before the construction of any preventive measures, such as checkdams and sedimentation dams.
8.7 DISCUSSION WITH CITIZENS, LAND OWNERSAND STAFF AT THE MUNICIPALITY
People living in or near the area may have valuable information on aspects such asearlier events, precipitation and soil condition. An interview with these people maybe a good investment. Landowners should be contacted to obtain information onclear-cutting and other forest work planned.
Staff at the municipality should be contacted at an early stage of the investigation.Often they have maps and information of significant value for the investigation.They may also have experience of construction works and results from earliergeotechnical investigations in or close to the area.

Stability and run-off conditions 67
Table 11. Parameters to be investigated in the field.
Position in area Parameter Purpose
Area with small inclination Soil – grain size distribution at surface,
approximate thickness Run-off (velocity, water storage capacity)
Bare rock – position and extent Run-off
Wet areas Capacity for water storage
Inclination Mass transport capacity, slope stability
Steep slopes Inclination Slope stability(see also Chapter 4)
Soil – grain size distribution, thickness Slope stability, shear strength, sources ofmaterial that may be brought to the brook.Soil sampling should be performed.
Groundwater, pore pressure Slope stability
Vegetation (type, position and condition) Run-off, critical areas, wet areas,vegetation limit altitude.
Traces Unstable areas, erodible soil
Trees – types, position, inclination Inclined trees may indicate slopemovements (drunken forest). Tree andforest level.
Streams, ditches Run-off, ground water condition, possibilityof gully formation and thereby debris flows
Avalanche tracks Run-off, possibility of gully formation
Brook Inclination of the whole longitudinal section Calculation of velocity, transportationcapacity, slope stability
Trees – condition, position and inclination Possibility of falling trees that can block the(also fallen trees) brook and cause damming. Inclined trees
may indicate slope movements (sometimescalled drunken forest).
Amount and type of available masses in Available masses, transport capacity,bottom and along sides possibility of blocking of the brook
Traces from earlier events Unstable areas, erodible soil, sources ofErosion, debris flows, deposition next debris flow, deposition areas
Wet areas, ponds, lakes High pore pressure, possibility of waterstorage, rapid run-off
Soil/bedrock Sources of mass movements, water flowvelocities, erodibility,
Width, water flow height during earlier Calculation of water flow velocity andevents and possible highest water level capacity
cont. next page

SGI Report No 6868
Table 11. Continued.
Position in area Parameter Purpose
Alluvial fan Inclination, extent History of earlier events, input to calculationof transport capacity
Soil condition, stratigraphy, soil depth History of earlier events, sources of newmass movements
Settlements In danger
Bridges Bottom inclination Velocity of stream
Size Flow capacity
Roads Ditches – size and position Capacity, is drainage going to the rightplace
Run-off Derivation of run-off water
Culverts, pipes Bottom inclination Velocity of stream
Size Flow capacity
Ski pistes Vegetation cover Run-off, indication of wet areas
Drainage Right place and way
Soil condition Slope stability, erosion
Inclination Slope stability, erosion

Stability and run-off conditions 69
The detailed investigation should be documented in two separate reports:
• Report 1: Results of field and laboratory investigations.• Report 2: Interpretations, evaluations, analysis, calculations and, if there is a
need for preventive measures, suggestions and rough estimates for type,position and design of such measures.
Since the detailed investigation often forms an important basis for purchasingcontractors when performing preventive measures, it is practical to report theresults of the investigations in two separate documents.
9.1 LANDSLIDES
9.1.1 Report 1
In this report, the introductory study prior to the field investigation and the fieldinvestigation carried out on the slope should be described and documented. Adescription of the documents used in the introductory study should be given, e.g.maps, aerial photos, earlier investigations etc. Also the results should be presented.The results of the field and laboratory investigations should be presented indrawings – ground plan and sections with a geotechnical legend.
9.1.2 Report 2
In this report, all interpretations, evaluations, analysis, calculations, data and, ifthere is a need for preventive measures, suggestions and rough estimates for type,position and design of such measures are given. The following documentationshould be provided:
• A technical fact sheet for slope stability investigations, see Table 12.• Detailed description of all calculations.
The data used and the results of calculations for the sliding surfaces found to bemost critical. For rough estimates based on calculations carried out “by hand”,
Chapter 9.
Documentationof the detailed investigation

SGI Report No 6870
the parameters and diagrams used should be reported. If computer programs areused to ensure the possibility of following and analysing the calculations, thefollowing information should be reported:- the computer program (name)- calculation method (drained, undrained, combined, Janbu, Bishop, etc.)- search routines used for the most critical sliding surface- input data- offprints from the calculations
• Drawings showing calculated sections, soil layer geometry used and values ofshear strengths used, pore pressures and densities as well as other parametersessential for the calculations such as external loads and surface water levels.Also the sliding surface found to be most critical should be presented in thedrawings
• Description of the need for preventive measures and the type, position anddesign (size, height, inclination, etc.) of them.

Stability and run-off conditions 71
Table 12. Technical fact sheet for slope stability investigations (3 pages). (Modi-fied after the Swedish Commission on Slope Stability, 1995).

SGI Report No 6872

Stability and run-off conditions 73

SGI Report No 6874
9.2 TORRENTS
9.2.1 Report 1
In this report, the introductory study prior to the field investigation and the fieldinvestigation carried out in the torrent should be described. The report shouldcontain four parts.
1. Introductory study prior to field investigationIn this part, a description should be given of the documents used in the introductorystudy: maps, air photos, earlier investigations, etc. Also a short description of theresults should be presented.
2. Description of the run-off conditions in the catchment areaA careful description of the run-off conditions in the whole area should bepresented. Table 13 may serve as a guide for the description. Note that theconditions should be described for all the different parts in the area, not as meanvalues for the whole area. The catchment area is normally divided into differentsub-areas where the run-off conditions can be regarded as equal.
Table 13. Parameters influencing the run-off conditions.Each sub-area should be described.
Parameter Description
Vegetation cover Type, amount, evapotranspiration
Topography,geometry of Inclinations of slopes and bottom of torrent (large and small scale),the catchment area shape of the catchment area and sub-areas
Soil conditions Type, thickness, structure, pore volume, hydraulic conductivity
Drainage and infiltration Position, type, possibility of damming/blockingcharacteristics
Ground water and soil Wet areas, water-demanding plants, storage capacity of run-off water,moisture content estimated groundwater table
Brooks Amount, size, inclination and position
Land use Type (roads, ski pistes, artificial drainage, buildings, structures,meadows, forests, grazing, etc.)

Stability and run-off conditions 75
3. Signs of earlier eventsSigns of earlier events found in the field should be marked on a map with a scaleno smaller than 1:10 000 according to the legend given in Figure 12. A descriptionof the amount of soil masses that have slid or been transported during earlier eventsshould be given. As an example, the signs of mass movements found inMörviksravinen, municipality of Åre, are given in Appendix B.
If traces of the high water level in the river bed during an earlier event have beeninvestigated, the results and the position of traces investigated should be describedand documented. The description should consist of a written part and sectiondrawings of the wet areas, see Figure 13.
Figure 12. Legend for maps used for documentation of the stability and run-offconditions in torrents.

SGI Report No 6876
Figure 13. Wet area, A, for one section investigated in Mörviksravinen, Årekommun (after Rankka & Fallsvik, 2003). Distances in cm.
Interpretation section no 5Hectometer 16,3I = 10o
A = 3,1 m2
4. Available soil masses in the torrentA careful description of the available soil masses in each hectometre divisionshould be given. The description should also involve an estimation of the amountof material that can be transported in one event, based on traces from earlier debrisflows and estimations made in the field.
5. Description of field testsIf field tests using test pits, sounding, seismic measurements, soil sampling orgroundwater measurements have been carried out, they should be described. Thedescription should consist of a written part and a map and cross-sections showingthe results.
Also a description of measurements of precipitation and run-off, if taken, shouldbe given.
6. Discussions with citizens, landowners and staff in the municipalityThe results from discussions with people in the vicinity are given.
9.2.2 Report 2
In this report, all interpretations, evaluations, analysis, calculations, data and, ifthere is a need for preventive measures, suggestions and rough estimates for type,position and design of such measures are given. The following documentationshould be provided:
• A technical fact sheet for torrents, see Table 14.• Detailed description of all calculations (data, interpretations, evaluations,
analysis, methods, results)

Stability and run-off conditions 77
Table 14. Technical fact sheet for torrents. (Modified after the Swedish Commis-sion on Slope Stability, 1995)
• Description of the need for preventive measures. Type, position and design(size, height, inclination, etc.).

SGI Report No 6878
References
References to literature mentioned in the report
Alexandersson, H. & Eggertsson-Karlström, C. (2001). Temperaturen ochnederbörden i Sverige 1961-1990. Referensnormaler – utgåva 2. Meteorologi, nr 99.Swedish Meteorological and Hydrological Institute, Norrköping.
Alexandersson, H. (2003). Personal contact. Swedish Meteorological and HydrologicalInstitute, Norrköping.
Alexandersson, H. (2004). Personal contact. Swedish Meteorological and HydrologicalInstitute, Norrköping.
Bergtahler, J. (1986). Anwendungsbereich der Hochwasserformeln, Wildbach undLawinenverbau, Zeitschrift 103, 50 Jahrgang.
Bertilsson, Å. & Persson, B. (1995). Erosionsrisker i Åre-Duved området.Examensarbete 1995:9, Avdelningen för mark- och vattenresurser. Institutionen föranläggning och miljö. Kungliga Tekniska Högskolan. Stockholm.
Chow, V., T. (1959). Open-channel hydraulics. McGraw-Hill. Tokyo
Costa (1984). Physical geomorphology of debris flows. In Developments andapplications of geomorphology. Eds Costa, J., E., & Fleisher, P., J. Springer Verlag.
Coussot, P. (1992). Rheologie des laves torrentielles. Collection Etude, SerieMontagne, no 5. Grenoble.
Coussot, P. & Meunier, M., (1996). Recognition, classification and mechanicaldescription of debris flows. Earth-science Reviews 40.
Dahlin, T., Larsson, R., Leroux, V., Svensson, M. & Wisén, R., (2001). Geofysik isläntstabilitetsutredningar. Statens geotekniska institut. Rapport 62. Linköping.
Dahlström, B. (1979). Regional fördelning av nederbördsintensitet – en klimatologiskanalys, (Title in English: Regional distribution of precipitation intensity– a climatological analysis). Byggforskningen, Rapport R18:1979.
Fallsvik, J. & Viberg, L. (1989). Early stage landslide and erosion risk assessment– a method for a national survey in Sweden. Arbeitstagung – ErdwissenschaftlicheAspekte des Umweltschutz, Vienna.
French, R. H., (1985). Open Channel Hydraulics. McGraw-Hill.

Stability and run-off conditions 79
Gattermayr, W. (2004). Personal contact. Wasserwirtschaft, Amt der TirolerLandesregierung, Innsbruck.
Hampel, R. (1969). Geschiebetrieb und Ausgleichgefälle in Wildbächen. Wildbach undLawinenverbau 33.
Hampel, R. (1980). Geschieberechnung für Gefahrenzonenplane in Wildbachgebieten.Proceedings International Society Interpraevent.
Hampel, R. (1984). Der Aufbau von Hochwasserformeln. Wildbach undLawinenverbau. Zeitschrift, Sonderheft, Juni 1984. 48 Jahrgang. Imst.
Hampel, R. (1990). Geschiebefracht und Geschiebetrieb, Wildbach und Lawinenverba.Zeitschrift 114, August 1990, 54 Jahrgang. Imst.
Hartlén, J. (1974). Skånska moränlerors hållfasthets- och bärighetsegenskaper.Avhandling. Chalmers Tekniska Högskola. Institutionen för geoteknik medgrundläggning. Göteborg.
Hungr, O. & Jakob, M. (2005). Debris-flow hazard and related phenomena. SpringerPraxis Books.
Ikeya, H. (1989). Debris flow and its countermeasures in Japan. Bulletin of theInternational Association of Engineering Geology, no 40. Paris.
Jacobsen., M. (1970). Strength and deformation properties of preconsolidated moraineclays. Danish Geotechnical Institute, Bulletin No 27. Copenhagen.
Kohl, B. & Markart, G. (2002). Dependence of surface runoff on rain intensity –results of rain simulation experiments. Flood Estimating Conference. Bern.
Larsson, R. (1989a). Hållfasthet i friktionsjord. Information 8. Statens geotekniskainstitut. Linköping.
Larsson, R. (1989b). Jords egenskaper. Information 1. Statens geotekniska institut.Linköping.
Larsson, R. (2001). Investigations and load tests in clay till. Report 59. Statensgeotekniska institut. Linköping.
Lorenzini, G. & Mazza, N. (2004). Debris flow – Phenomenology and rheologicalmodelling. WIT Press.
Markart, G., Kohl, B.,Soiter, B., Schauer, T. Bunza, G., Stern & R. (2004).Provisorische Geländeanleitung zur Anschätzung des Oberlächenabflusses aufalpinen Boden-/Vegetationseinheiten bei konvektiven Starkregen. Research report.Bundesministerium für Land- und Forstwirtschaft, Umwelt und Wasserwirtschaft.BFW-Dokumentation; Schrifenreihe des Bundesamtes und Forschungszentrums fürWald, Wien.
Markart, G. (2004). Personal contact. The Austrian Federal Institute for ForestResearch, Innsbruck.
Möller, B., Larsson, R., Bengtsson, P.-E. & Moritz, L. (2000). Geodynamik ipraktiken. Statens geotekniska institut. Information nr 17. Linköping.

SGI Report No 6880
Rankka, K., Fallsvik, J. (2003). Förstärkningsåtgärder för slänter och raviner i moränoch annan grov sedimentjord. Räddningsverket. FoU rapport. Karlstad.
Rankka, K., Fallsvik, J. (2003). Detailed investigation of the stability and run-offconditions in the catchment area of the stream Mörviksån. Swedish GeotechnicalInstitute. Commission No 11802. Linköping. (made on commission from themunicipality of Åre).
Rankka, K., Fallsvik, J. (2004). Detaljerad utredning av stabilitets- ochavrinningsförhållanden i Mörviksravinens avrinningsområde, Åre. Statensgeotekniska institut. Uppdrag nummer 11802. Linköping. (Utförd på uppdrag av Årekommun).
Rickenmann, D. (1999). Empirical Relationships for Debris Flows. Natural Hazards19, pp 47-77. Kluwer Academic Publisher.
Sauermoser, S. (2002). Personal communication. Forsttechnischer Dienst für Wildbachund Lawinenverbauung, Innsbruck, Austria.
Sauermoser, S. (2003). Personal communication. Forsttechnischer Dienst für Wildbachund Lawinenverbauung, Innsbruck, Austria.
Sauermoser, S. (2004). Personal communication. Forsttechnischer Dienst für Wildbachund Lawinenverbauung, Innsbruck, Austria.
Swedish Commission on Slope Stability (1995). Directives for Slope StabilityInvestigations, Report 3:95. Linköping.
Varnes, D.J. (1978). Slope movement types and processes. In Landslides, Analysis andControl. Transportation Research Board. Special Report 176. Washington DC.
Viberg, L., Fallsvik, J., Rankka, K., Sällfors, G. & Gustafsson, M. (2004).Översiktlig kartering av stabilitetsförhållandena i raviner och slänter i morän ochgrov sedimentjord. Metodbeskrivning. FoU rapport, Räddningsverket. Karlstad.
Wilén, P., Eurenius, L. & Anderberg, J. (1993). Avrinning och erosion i Åredalen.Slutrapport. VBB Viak AB och Geo Information consult AB. Östersund.
Zeller, J. (1974). Starkniederschläge und ihr Einfluss auf Hochwasserereignisse BerichtNr. 126. Eidg Anstalt für Forstliches Versuchswesen, Birmensdorf.
Suggestions for further studies
Davies, T. (1997). Using hydroscience and hydrotechnical engineering to reduce debrisflow hazards. First international conference on Debris Flow Hazards Mitigation:Mechanics, prediction and assessment. Edited by Cheng-lung Chen. San Francisco.
Fiebiger, G. (1997). Structures of debris flow countermeasures. First internationalconference on Debris Flow Hazards Mitigation: Mechanics, prediction andassessment. Edited by Cheng-lung Chen. San Francisco.
Hampel, R. (1984). Der Aufbau von Hochwasserformeln. WLV Zeitschrift, Sonderheft,Juni 1984. 48 Jahrgang. Imst.
Stability and run-off conditions 81
Heumader, J. (2000). Technical debris-flow countermeasures in Austria – a review.Debris-Flow Hazards Mitigation: Mechanics, prediction and assessment. Rotterdam.
Hübl, H. (1995). Muren: Prozesse und Ablagerungsformen. Bedeutung für dieGefahrenzonenplanung Diss. Universität für Bodenkultur, Wien.
Hungr, O., Morgan, C. & Kellerhals, R. (1984). Quantitative analysis of debristorrent hazards for design of remedial measures. Canadian Geotechnical Journal, 21,pp 663-677.
Interpraevent. International Research Society. Homepage http://www.wasser.ktn.gv.at/interpraevent/index_en.htm
Kettl, W. (1984). Vom Verbauungsziel zur Bautupenentwicklung – Wildbachverbaaungin Umbruch. Wildbach und Lawinenverbau. Zeitschrift. 1984. Wörgl.
Markart, G., Sauermoser, S., Kohl, B. & Stern, R. (2002). Land use change and theeffect of mountain forests in Alpine catchments. Proceeding of the symposium“Ecological and economic benefits of mountain forests”. Innsbruck.
Rankka, K. (2002). Slå rot och väx upp eller Vegetation som förstärkningsmetod.Litteraturstudie. FoU rapport. Räddningsverket. Karlstad.
Smart, J. (1983). Sediment transport on steep slopes. Mitteilungen der Versuchsanstaltfür Wasserbau, Hydrologie und Glaziologie, Nr 64. Zürich.
VanDine, D.F. (1996). Debris Flow Control Structures for Forest Engineering. Res. Br.,B.C. Ministry of Forests Research Program, British Columbia, Work Paper 08/1996.

SGI Report No 6882
APPENDIX A
Examples of run-off factor classes for typical regions in alpine areas are given inthe following pages. The run-off factor classes translated to run-of coefficients aregiven in Table A1. The values have been evaluated by Markart et al. (2004) fromtests on slopes in Austria. All photos are from the paper by Markart et al (2004).Permission for publishing the photos and values has been given by the authors.Table A1. Run-off factor classes translated to run-of coefficients
Run-off factor class Run-off coefficients1 0 – 0.102 0.11 – 0.303 0.31 – 0.504 0.51 – 0.755 > 0.75
1) Spruce-wood without ground-covering undergrowth
Type of soil Use Hydrologic characteristics Run-off factor class
Silicate brown earth, None Wetting resistance after drying up 2coarse grained, loose
Like above, however Pasture Wetting resistance after drying up, 3surface layer infiltration prevented by cattleconsolidated by footstep, infiltration in porescattle footstep or through columns of root tubes

Stability and run-off conditions 83
2) Forest stand with afforestation by spruce, larch and cembran pine(partly grazes, partly with broom heath)
3) Spruce-wood with adenostyles (Lat:Adenostyles alliariae, not found in Sweden)
Type of soil Use Hydrologic characteristics Run-off factor class
Talus with silicieous None Almost no wetting resistance due to 1(rich in silica) brown dense undergrowth, coarse grained soilearth, coarse grained, with loose structure, rapidloose, soil on slope infiltration into deeper soil layersdebris
Type of soil Use Hydrologic characteristics Run-off factor class
Gleyic soil on None Coarse grained soil with high amount 4carbonaceous substrate, of fine particles gives low possibilitymean to large soil depth, of infiltration, infiltration primarily onlyhigh amount of fine though macro pores (e.g. tubes madeparticles, cohesive by worms and other animals.)
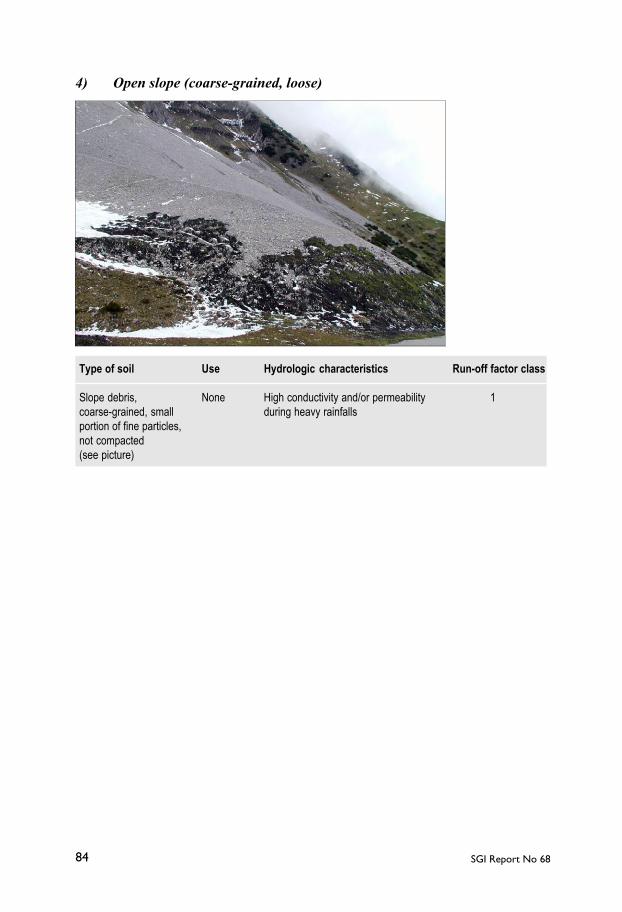
SGI Report No 6884
4) Open slope (coarse-grained, loose)
Type of soil Use Hydrologic characteristics Run-off factor class
Slope debris, None High conductivity and/or permeability 1coarse-grained, small during heavy rainfallsportion of fine particles,not compacted(see picture)

Stability and run-off conditions 85
5) Heather moor (Lat:Calluna vulgaris, Sw: ljung) in combination with matgrass (Lat: Nardus stricta, Sw: stagg) and dwarf-shrubs (covering lessthan 50% of the area)
Type of soil Use Hydrologic characteristics Run-off factor class
Shallow to middle deep No Mat grass limits the infiltration 3brown earth and/or podsol, (straw roof effect)high portion of coarsegrained particles, looseskeleton reaching top ofsoil, area covered bymat grass < 50%
As above, however high Pasture Mat grass limits the infiltration 4portion of fine particles (straw roof effect), no preferential infiltration
ways since the portion of fine particles ishigh and therefore high run-off capacity

SGI Report No 6886
6) Alpine meadow with edelweiss (Lat: Leontopodium alpinium).Short pasture in the middle of summer and/or early autumn)
Type of soil Use Hydrologic characteristics Run-off factor class
Deep-brown earth, Hayfield, pasture Small run-off potential in the spring and 3loose, upper soil shows (2 weeks a year) early summer, grazing in late summercrumbly blocky structure leads to a compaction of the topsoil
As above, crumbly Hayfield Small run-off potential 2structure morepronounced

Stability and run-off conditions 87
7) Alpine meadow with dwarf willow (Lat: Salix herbacea, Sw: dvärgvide)with short pasture in the middle of summer and/or early autumn
Type of soil Use Hydrologic characteristics Run-off factor class
Shallow to mean deep Hayfield, short Small to middle run-off 3brown earth, partially pasture, intensively potential in spring and earlygraded maintained (fertilised summer, increased run-off
and drained.) in late summer due to grazing(footstep damage) and agricultureactivities (soil compression)
As above Hayfield, short High to extreme run-off potential 4 – 5pasture, no due to mat of roots in the uppermostmaintaining, soil layersintensively grazed

SGI Report No 6888
8) Graded skipiste with plants indicating high humidity e.g. rushes(Lat: Juncus, Sw: tåg) and thistles (Lat: Cirsium, Sw: tislar)
Type of soil Use Hydrologic characteristics Run-off factor class
Middle deep Anthrosol1, Ski piste, grazed Poor retention capacity during heavy 4 – 5silty- sandy, gleyic soil, rain falls due to high moisture content.slope water course, Very high run-off potentialat least partlypermanently wetted
1 Anthrosol: Soils that have been modified profoundly by human activities,for example partial removal, cutting and filling and waste disposal.
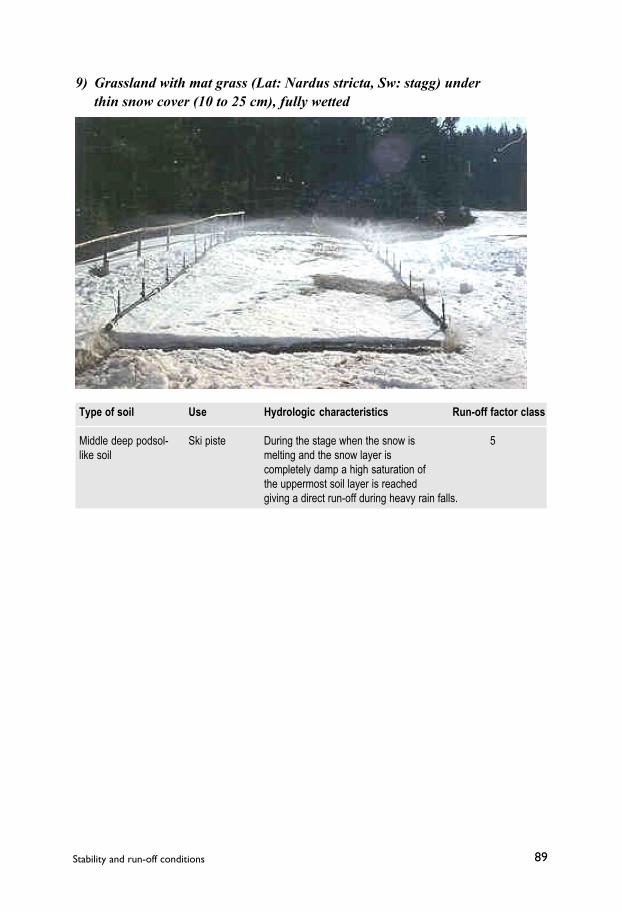
Stability and run-off conditions 89
9) Grassland with mat grass (Lat: Nardus stricta, Sw: stagg) underthin snow cover (10 to 25 cm), fully wetted
Type of soil Use Hydrologic characteristics Run-off factor class
Middle deep podsol- Ski piste During the stage when the snow is 5like soil melting and the snow layer is
completely damp a high saturation ofthe uppermost soil layer is reachedgiving a direct run-off during heavy rain falls.

SGI Report No 6890
APPENDIX B
Plan showing results from field investigations in the Mörviksravinen torrent, munici-pality of Åre. (From Rankka & Fallsvik, 2003).

Stability and run-off conditions 91
Plan showing the catchment area of Mörviksån (borderline in red) and a division ofthe total area into 10 sub areas (1a – 6b).

SGI Report No 6892
APPENDIX C
In the Dahlström method (see Dahlström, 1979), a so-called regional parameter,Z, has been developed to reflect the pattern of convective precipitation in Sweden.Series of precipitation from the different weather stations have been analysed,using stations read both continuously and once daily. The regional and time-dependent patterns of intense precipitation have been related to each other. Thefollowing formula has been developed for calculating statistics on precipitationintensity and duration. The formula gives the precipitation intensity standardisedto the period 1931-60 with a duration of between 3 minutes and 96 hours and returnperiods of between 1 month and 10 years (extrapolation up to, for instance, 100 and150 years is possible).
where F(x, T, Z) = precipitation intensity [mm/h]x = duration of the precipitation [h]T = return period [months]Z = regional parameter given for different regions in Sweden or
calculated (see below)
TTTA 17.1)( 47.0 −⋅=
vNNNZ −+⋅= )(5.0 87
where N7, N8 are mean precipitation in the two months with the highestfrequency of convective precipitation (mostly July, August).Nv is the mean precipitation in the month with a lower shower activitythan in the summer (mostly May)
372.032.0)(+
−=T
TB
01.0167.0167.01.01)(+−
−⋅+=x
xxC
b´ = –0.72
However, in special regions :
TTTA 19.1)( 47.0 −⋅= and b´ = – 0.68

Stability and run-off conditions 93
STATENS GEOTEKNISKA INSTITUTSWEDISH GEOTECHNICAL INSTITUTE
Serien ”Rapport” ersätter våra tidigare serier: ”Proceedings” (27 nr), ”Särtryckoch Preliminära rapporter” (60 nr) samt ”Meddelanden” (10 nr).
The series ”Report” supersides the previous series: ”Proceedings” (27 Nos),”Reprints and Preliminary Reports” (60 Nos) and ”Meddelanden” (10 Nos).
RAPPORT/REPORTNo År/Year
1. Grundvattensänkning till följd av tunnelsprängning 1977P. Ahlberg & T. Lundgren
2. Påhängskrafter på långa betongpålar 1977L. Bjerin
3. Methods for reducing undrained shear strength of soft clay 1977K.V. Helenelund
4. Basic behaviour of Scandinavian soft clays 1977R. Larsson
5. Snabba ödometerförsök 1978R. Karlsson & L. Viberg
6. Skredriskbedömningar med hjälp av elektromagnetisk 1978fältstyrkemätning - provning av ny metod.J. Inganäs
7. Förebyggande av sättningar i ledningsgravar -en förstudie 1979U. Bergdahl, R. Fogelström, K.-G. Larsson & P. Liljekvist
8. Grundläggningskostnadernas fördelning 1979B. Carlsson
9. Horisontalarmerade fyllningar på lös jord 1981J. Belfrage
10. Tuveskredet 1977-11-30. Inlägg om skredets orsaker 1981

SGI Report No 6894
RAPPORT/REPORTNo År/Year
11a. Tuveskredet - geoteknik 1984
11b. Tuveskredet - geologi 1981
11c. Tuveskredet - hydrogeologi 1981
12. Drained behaviour of Swedish clays 1981R. Larsson
13. Long term consolidation beneath the test fillsat 1981Väsby, SwedenY.C.E Chang
14. Bentonittätning mot lakvatten 1982T. Lundgren, L. Karlqvist & U. Qvarfort
15. Kartering och klassificering av lerområdens 1982stabilitetsförutsättningarL. Viberg
16. Geotekniska fältundersökningar 1982Metoder - Erfarenheter - FoU-behov.E. Ottosson (red.)
17. Symposium on Slopes on Soft Clays 1983
18. The Landslide at Tuve November 30 1977 1982R. Larsson & M. Jansson
19. Släntstabilitetsberäkningar i lera 1983Skall man använda totalspänningsanalys,effektivspänningsanalys eller kombinerad analys?R. Larsson
20. Portrycksvariationer i leror i Göteborgsregionen 1983J. Berntson
21. Tekniska egenskaper hos restprodukter från 1983kolförbränning - en laboratoriestudieB. Möller, G. Nilson

Stability and run-off conditions 95
RAPPORT/REPORTNo År/Year
22. Bestämning av jordegenskaper med sondering - 1983en litteraturstudieU. Bergdahl & U. Eriksson
23. Geobildtolkning av grova moräner 1984L. Viberg
24. Radon i jord 1984- Exhalation - vattenkvot- Årstidsvariationer- PermeabilitetA. Lindmark & B. Rosén
25. Geoteknisk terrängklassificering för fysisk planering 1984L. Viberg
26. Large diameter bored piles in non-cohesive soils 1984Determination of the bearing capacity and settlementfrom results of static penetration tests (CPT) andstandard penetration test (SPT).K. Gwizdala
27. Bestämning av organisk halt, karbonathalt 1985och sulfidhalt i jordR. Larsson, G. Nilson & J. Rogbeck
27E. Determination of organic content, carbonate content 1987and sulphur content in soilR. Larsson, G. Nilson & J. Rogbeck
28. Deponering av avfall från kol- och torveldning 1986T. Lundgren & P. Elander
28E. Environmental control in disposal and utilization of 1987combustion residuesT. Lundgren & P. Elander
29. Consolidation of soft soils 1986R. Larsson

SGI Report No 6896
RAPPORT/REPORTNo År/Year
30. Kalkpelare med gips som tillsatsmedel 1987G. Holm, R. Tränk & A. Ekström
Användning av kalk-flygaska vid djupstabilisering av jordG. Holm & H. Åhnberg
Om inverkan av härdningstemperaturen på skjuvhållfasthetenhos kalk- och cementstabiliserad jordH. Åhnberg & G. Holm
31. Kalkpelarmetoden 1986Resultat av 10 års forskning och praktisk användningsamt framtida utveckling.H. Åhnberg & G. Holm
32. Two Stage-Constructed Embankments on Organic Soils 1988• Field and laboratory investigations• Instrumentation• Prediction and observation of behaviourW. Wolski, R. Larsson et al.
33. Dynamic and Static Behaviour of Driven Piles 1987(Doctoral thesis)Nguyen Truong Tien
34. Kalksten som fyllningsmaterial 1988J. Hartlén & B. Åkesson
35. Thermal Properties of Soils and Rocks 1988(Doctoral thesis)J. Sundberg
36. Full-Scale Failure Test on a Stage-Constructed 1989Test Fill on Organic SoilW. Wolski, R. Larsson et al.
37. Pore Pressure Measurement - 1989Reliability of Different SystemsM. Tremblay
38. Behaviour of Organic Clay and Gyttja 1990R. Larsson

Stability and run-off conditions 97
RAPPORT/REPORTNo År/Year
39. Gruvavfall i Dalälvens avrinningsområde - 1990Metallutsläpp och åtgärdsmöjligheterRAPPORT TILL DALÄLVSDELEGATIONEN
T. Lundgren & J. Hartlén
40. Shear Moduli in Scandinavian Clays 1991- Measurement of initial shear modulus with seismic cones- Empirical correlations for the initial shear modulus in clayR. Larsson & M. Mulabdic´
41. Övervakningssystem - Släntbeteende - Skredinitiering 1992Resultat från ett fullskaleförsök i NorrköpingB. Möller & H. Åhnberg
42. Piezocone Tests in Clay 1991R. Larsson & M. Mulabdic´
43. Footings with Settlement-Reducing Piles 1993in Non-Cohesive SoilPhung Duc Long
44. Agnesbergsskredet 1994R. Larsson, E. Ottosson & G. Sällfors
45. Agnesbergsskredet - Skredförebyggande åtgärder 1994H. Sandebring & E. Ottosson
46. R&D for Roads and Bridges 1995International Seminar on Soil Mechanicsand Foundation EngineeringB. Rydell (Editor)
47. Geotechnical Properties of Clay at Elevated Temperatures 1995L. Moritz
48. Cement och kalk för djupstabilisering - 1995En kemisk - fysikalisk studie av stabiliseringseffekterH. Åhnberg, S-E. Johansson, A. Retelius, C. Ljungkrantz,L. Holmqvist & G. Holm
49. Jormaterialet silt - 1995geotekniska egenskaper och deras bestämningR. Larsson

SGI Report No 6898
50. Modelling of Groundwater Conditions in Silt and Fine Sands. 1996A study of induced groundwater changes based on laboratoryand full-scale field tests(Doctoral thesis)M. Tremblay
51. Parameter Study of Solar Heating Systems with 1995Seasonal Ground Storage in MoraineM. Lehtmets
52. Solvärmesystem med säsongslager. 1997En simulerings- och kostnadsstudieA. Gabrielsson
53. Heat storage in soft clay. 1997Field tests with heating (70 oC) and freezing of the soilA. Gabrielsson, M. Lehtmets, L. Moritz & U. Bergdahl
54. Investigations and load tests in silty soils. 1997Results from a series of investigations in silty soils in Sweden.R. Larsson
55. Radon i bostäder. 1997Markradonhaltens betydelse för riskklassificering.B. Rosén, B-M. Ek, J. Ek & H. Mattson
56. Skredet i Vagnhärad. 1998Teknisk/vetenskaplig utredning om skredets orsaker.H. Andersson, P.-E. Bengtsson, C. Berglund, R. LarssonG. Sällfors & A.-L. Högberg–Högsta
57. Skredet i Ballabo, Västerlanda 1999H. Andersson, E. Ottosson & G. Sällfors
58. Skredriskanalys i Göta älvdalen – Metodbeskrivning 2000C. Alén, P-E. Bengtsson, B. Berggren, L. Johansson.& Å. Johansson
59. Investigations and Load Tests in Clay Till. Results from 2001a series of investigations and load tests in the test fieldat Tornhill outside Lund in southern Sweden.R. Larsson
RAPPORT/REPORTNo År/Year

Stability and run-off conditions 99
60. Kolloiders betydelse för hållfasthet och hållfasthet och 2001föroreningstransport i jord.A-M. Fällman, O. Holby & K. Lundberg
61. Long-term effects of excavations at crests of slopes 2003Pore pressure distribution – Shear strength properties– Stability – EnvironmentR. Larsson & H. Åhnberg
61S Effekter av avschaktningar av släntkrön 2003Portryckssituation – Hållfasthetsegenskaper – Stabilitet – MiljöR. Larsson & H. Åhnberg
62. Geofysik i släntstabilitetsutredningar. 2001T. Dahlin, R. Larsson, V. Leroux, M. Svensson & R. Visén
63. Settlements and shear strength increase below embankments 2003– long-term observations and measurement of shear strengthincrease by seismic cross-hole tomographyR. Larsson & H. Mattsson
64. Mechanical properties of residues as unbound road materials 2003– experimental tests on MSWI bottom ash, crushed concrete andblast furnace slagM. Arm
65. Quick clay in Sweden 2004K. Rankka, Y. Andersson-Sköld, C. Hultén, R. Larsson,V. Leroux & T. Dahlin
66. Compaction- and strength properties of stabilised and 2004unstabilised fine-grained tillsP. Lindh
67. On Bayesian decision analysis for evaluating 2004alternative actions at contaminated sitesJ. Norrman
RAPPORT/REPORTNo År/Year

Statens geotekniska institutSwedish Geotechnical Institute
SE-581 93 Linköping, SwedenTel 013–20 18 00, Int + 46 13 201800Fax 013–20 19 14, Int + 46 13 201914
E-mail: [email protected] Internet: www.swedgeo.se