sri lanka’s trade policies: back to protectionism · sri lanka’s trade policies: back to...
TRANSCRIPT

ASARC Working Paper 2011/03
DRAFT 21 JAN 2011
Sri Lanka’s Trade Policies: Back to Protectionism
Garry Pursell* and F.M. Ziaul Ahsan**
ABSTRACT
In 1977 Sri Lanka was the first of the South Asian countries to decisively move away from the protectionist import-substitution trade policies that for many years had damaged their economic efficiency and hobbled their economic growth. Albeit with back-tracking episodes, Sri Lanka’s liberalising trade policy reforms-especially reductions in the average level of import tariffs- were broadened and extended during the following 23 years. Together with other economic reforms this supported the rapid growth of manufactured exports, and made it possible for the economy to grow at moderate to high rates despite continuing political turmoil and civil war. Protectionist pressures began to build in 2001, however, and starting in November 2004, the relatively open trade policies of the past were explicitly and systematically reversed. By 2009, mainly through the proliferation of a variety of para-tariffs, Sri Lanka’s tariff policies were just as protective as they had been more than 20 years earlier. The principal purpose of this paper is to describe, quantify and analyse these developments. The paper concludes by pointing out the serious potential damage of the protectionist trade policies to Sri Lanka’s future economic growth, and the resulting subversion of its preferential trade agreements, especially the agreements with India (ILFTA), Pakistan (PSFTA) and with the South Asian countries as a group (SAFTA). It also comments on the resulting breaches of Sri Lanka’s WTO commitments (especially in agriculture), and the more general issues that the unfettered use of para-tariffs by Sri Lanka and Bangladesh raise for the world multilateral trading system. JEL Codes: F13, F14, F15,O11, O19. Keywords: Import substitution, Tariff, Protectionism, Trade Agreements, GATT WTO, Determinants of Development, Sri Lanka *Visiting Fellow, Australia South Asia Research Centre, The Australian National University.
Email:[email protected] **F.M. Ziaul Ahsan is affiliated with the Policy Research Institute of Bangladesh (PRIB)
We are grateful to Sarath Rajapatirana, Prem-Chandra Athukorala, and Dushni Weerakoon for useful suggestions in the early stages of our preparation of this paper. However we are entirely responsible for the empirical research and how the results of this research are interpreted in the paper.

Garry Pursell and F.M. Ziaul Ahsan
2 ASARC WP 2011/03
Acronyms
APTA Asia Pacific Trade Agreement
CD Customs Duty
Cess Commodity exports subsidy scheme
EPZ Export Processing Zone
FDI Foreign direct investment
GATT General Agreement on Trade and Tariffs
GSTP Global System of Trade Preferences
IFI International Financial Institution
ILFTA India (Sri) Lanka Free Trade Agreement
IS Import subsitution
MFN Most Favored Nation
MUV Manufactures Unit Value
NBT Nation Building Tax
NTB Non‐Tariff Barrier
ODCs Other duties and charges
PAL Ports and Airports Development Levy
PSFTA Pakistan Sri Lanka Free Trade Agreement
QR Quantitative restriction
RIDL Regional Infrastructure Development Levy
SAFTA South Asia Free Trade Agreement
SCL Special Commodity Levy
SRL Social Responsibility Levy
SUR (Customs ) surcharge
T&C Textiles and clothing
TPR Total protective rate
USTR Office of the United States Trade Representative
VAT Value added tax
WTO World Trade Organization

Sri Lanka’s Trade Policies: Back to Protectionism
ASARC WP 2011/03 3
SRI LANKA’S TRADE POLICIES: BACK TO PROTECTIONISM
1. Introduction
Starting in 1977 Sri Lanka was the first of the South Asian countries to decisively move away from the inward looking and highly interventionist economic policies that had been in place and hobbled their economic growth since the mid-1950s. Gradual reform got under way in the rest of South Asia about 10 years later, during the second half of the 1980s. Sri Lanka’s initial reforms which began in 1977 and continued into 1978,1 were wide ranging, and as well as the liberalisation of its trade policies, included the removal of administrative controls over domestic prices, reductions in and targeting of food subsidies, the relaxation of credit controls, the opening of previously fenced off sectors to the private sector, active encouragement of foreign direct investment in place of the previous highly restrictive policies, and later on (in the early 1990s) the privatisation of public sector firms. But trade policy liberalisation was a basic and essential part of the 1977/78 policy package and continued with some backtracking during the 1980s and 1990s. It included an initial sharp devaluation along with unification of the exchange rate, drastic cuts in the scope of the import licensing system, the abolition of state enterprise monopolies over the import of a number of key commodities, the use of tariffs rather than QRs to control imports, simplifications of the tariff structure, the removal of export taxes and controls that had previously impeded commodity exports, the establishment of export processing zones, and streamlining of Customs procedures for exporters.
The response of exports and the economy to the 1977/78 reform package was very fast. In particular exports of manufactured goods responded immediately and grew very rapidly, at around 20% annually2 between 1976 and 1984 (Table 1 and Figs 1 and 2). Growth slowed drastically during the next five years, but then accelerated to an average rate of 16% between 1989 and 2000. From 10% of total exports during 1976 industrial exports increased to over a third during 1984 and to more than three quarters by 2000. Of these new exports, the largest and fastest growing were garments, but exports of other labour intensive products also expanded rapidly, most from a very low base and others from scratch. In 2000 garments were about 65% of manufactured exports:3 the rest included textiles, rubber goods, processed diamonds, light engineering products, travel goods, and a wide variety of others. As emphasised by Athukorala, foreign firms have been involved in the development of these new export industries in many ways, both directly by investing in fully owned subsidiaries or joint ventures with local businesses, and less directly by providing marketing links, technology and general “know how”.
During the years following the 1977/78 reforms up to 2000, tariffs continued to fall, albeit with backtracking episodes. It can be plausibly argued that export expansion and economic growth during this period would have been faster if there had been earlier and more decisive cuts in the level and dispersion of tariffs which continued to provide high protection
1 This account of Sri Lanka’s initial and later trade policy reforms up to about 2004 relies mainly on the comprehensive discussions in Cuthbertson and Athukorala (1991), Athukorala and Rajapatirana (2000), Athukorala and Jayasuriya (2004), World Bank (2004) and Athukorala (2007).Other early discussions are in Gunatilleke (1994) and Rupasinghe (1994). 2 Exponential growth rates in constant 2008 US dollars: see Table 1. 3 These shares are calculated after excluding exports of surplus by- products of the petroleum refining industry from total manufactured exports.

Garry Pursell and F.M. Ziaul Ahsan
4 ASARC WP 2011/03
to IS industries.4 But even if this had been done, Sri Lanka’s civil conflict and its related economic costs, together with deficiencies in other domestic economic policies and in maco-economic management, made it unlikely that the economy could have grown at anything approaching the early very high rates of many East and South East Asian countries. In any case by 2001 the moderate economic growth actually experienced proved insufficient to outweigh protectionist pressures that were always present.5 One early sign of things to come was the imposition in February 2001 of a “temporary” 40% surcharge on Customs duties which effectively cancelled a previous general reduction of scheduled duties in 2000.6 Opposition to liberal trade policies were strengthened by the crisis economic conditions which followed the Tamil Tiger attack on Colombo airport in July 2001.
Reflecting these pressures, during 2001-04 import policies became more restrictive, especially tariff protection of import substitution agricultural sectors. Starting gradually during that period and continuing to the present there has been a major reversal of the basically liberal trade policies of the previous 24 years, and from late 2004 a deliberate move back to import-substitution protectionism in both agriculture and manufacturing. In a 2007 paper Athukorala warned that the political climate had become more receptive to protectionist policies, but considered that “major domestic and international constraints make it unlikely that there will be a sharp reversal of policies to embrace more closed-door policies” (2007, p.373). However one of a number of key protectionist tools — an import tax called a Cess — was already being deployed in November 2004,7 and by 2007 it and other para-tariffs had transformed the Sri Lankan tariff system. This protectionist trend continued and intensified during 2007-09. Despite some modest relaxations after June 2010, Sri Lanka has now reversed many years of relatively open trade policies. The principal purpose of this paper is to describe and analyse these developments, pointing out the serious potential damage to Sri Lanka’s future economic growth, the resulting subversion of its preferential trade agreements, especially the agreements with India (ILFTA) and Pakistan (PSFTA), and the breaches of its WTO commitments (particularly in agriculture). The paper also discusses the more general issues that the unfettered use of para-tariffs by Sri Lanka, Bangladesh and other countries raise for the world multilateral trading system.
The discussion is organised as follows. Section 2 summarises and comments on the evolution of trade policies during the 1980s, 1990s and up to late 2004. Section 3 describes the main features of the protectionist post-2004 import tax structure, especially the key new role of para-tariffs. Section 4 reports the results of our empirical estimates of the greatly increased average protection rates resulting from the new structure. Section 5 describes the very large number and wide dispersion of the resulting total protective rates. Section 6 reports our empirical findings on the consequences of the new structure for Sri Lanka’s principal
4 As argued for example by Cuthbertson (2003). 5 In many Asian countries including China and most recently India, very fast and sustained economic growth has created constituencies for the maintenance of liberal trade policies in manufacturing, but eventually in most of the early liberalisers rising real wages created strong pressures for subsidies and protection of agriculture. Sri Lanka’s recent experience suggests that it has the worst of both worlds i.e. economic growth that is not sufficiently fast to offset protectionist forces in manufacturing, but fast enough for farm constituencies to feel threatened and to press for agricultural protection. 6 The top normal Customs duty rate was reduced from 35% to 25%, but this reduction was exactly offset by the 40% surcharge. The surcharge was also applied across the board to all other Customs duties. 7 USTR (2006). USTR’s reports on Sri Lanka (contained in its annual reports on world trade barriers) are the only publications we have found that at an early stage noticed (and subsequently followed) the new protectionist direction of Sri Lanka’s trade policies. Since its 2004 overview report on South Asian trade policies (World Bank 2004), the World Bank does not seem to have been paying much attention to Sri Lanka’s trade policies, nor do the other IFIs.

Sri Lanka’s Trade Policies: Back to Protectionism
ASARC WP 2011/03 5
preferential trade agreements. Section 7 describes and provides preliminary quantitative evaluations of some liberalising reforms introduced between June 2010 and January 2011 which we have not been able to fully incorporate in our empirical analysis. Section 8 comments on the likely consequences of Sri Lanka’s new protectionist trade policies for the efficiency and growth of its economy. Section 9 concludes by discussing the implications of Sri Lanka’s unfettered and so far largely unnoticed use of para-tariffs for its relations with its preferential trading partners, and more generally for people and institutions such as the WTO supportive of an open world trade order.
2. Trade policies, 1977/78 to late 2004
The export oriented development paradigm that Sri Lanka followed for approximately 25 years following its 1977/78 reforms, has much in common with the better known stories of rapid export development in East and South East Asia. For a number of reasons it proved to be particularly suitable for Sri Lanka. In particular:
It was labour intensive and generated rapid employment growth along with rapidly growing exports
It required quite low investments in physical capital which facilitates participation by domestic entrepreneurs, while neither local nor foreign firms needed to put large sums at risk in a highly uncertain and changing political and economic environment. This has been especially important in Sri Lanka in view of the long running civil conflict which worsened after 1983 and only came to a problematic conclusion in 2009.
It dramatically reduced the reliance of the economy on its traditional primary product exports, especially tea, rubber and coconut products (Fig 1). Primary products accounted for approximately three quarters of Sri Lanka’s total exports in 1976, but that share had declined to around 18% in 2000. Exporters of these commodities have not only faced a long term decline in their real prices in world markets, but have had to contend with continuing high world price volatility.
It was consistent with Sri Lanka’s comparative advantage viz a viz developed and more developed countries, to which the bulk of its manufactured exports have been directed. It is no accident that in 2009 its giant less-developed neighbour India only accounted for around 5% of Sri Lanka’s exports, despite its proximity, India’s low industrial tariffs, and ILFTA.
It has been one of the principal driving forces behind Sri Lanka’s moderate economic growth since 1977. Helped along in the latter stages by the 2003-2007 world trade boom, real GDP grew at an average rate of 4.9% between 1977 and 2007 (World Bank 2008), and held up at 6% during 2008. These growth rates were maintained despite the continuous, economically costly, and highly disruptive civil conflict, and despite external shocks including the 1997/98 Asian financial crisis, the 2004 tsunami, the turbulence in world commodity markets during 2007-2008, and the global financial crisis of 2008.
The most important components of the policy reforms that started in 1977 were the liberalisation of import policies and the accompanying exchange rate unification and devaluation. Without these the other reforms would have been ineffective. In particular Sri Lanka’s own experience and the early experiences of many other developing countries — notably India — indicate that efforts to get rapid export growth under way by the use of elaborate duty neutralisation schemes, free trade zones, tax holidays and other export

Garry Pursell and F.M. Ziaul Ahsan
6 ASARC WP 2011/03
subsidies, will be futile if there is not restriction-free access to imported inputs over reasonably low tariffs, and if the exchange rate is propped up at overvalued rates by import compressing policies.8 Consequently import liberalisation promotes export expansion and also contributes to faster economic growth, since the economic rate of return on exports is generally much higher than the economic rate of return on the import substitution production that is either eliminated or never occurs because of the removal of QRs and declining tariffs.
Following the initial reforms of 1977 and 1978, QRs had a much reduced and declining role (Fig 3) and export taxes on the principal agricultural commodities (tea, rubber and coconut products) were further reduced until for all practical purposes they were removed in 1993(Fig 4). The removal of export taxes helped exports of these products but did not halt their declining share of total exports and of the economy.
There was some back tracking from the 1977/78 tariff reforms during 1979 and the first few years of the 1980s, the main features of which were increases in tariffs protecting established IS industries and reductions in tariffs on their imported inputs. From about 1982 for the rest of the 1980s and during the 1990s until 2000, unweighted average tariffs steadily declined (Fig 5). Initially these reductions included cuts in tariffs on final goods (see Athukorala and Jayasuriya 2004, p6), but later on most of the decline in average tariffs was due to tariff cuts — including cuts to zero — on intermediate inputs and equipment not produced in Sri Lanka, especially when these products were used as inputs by local IS industries which the government had decided to protect. These changes had two divergent effects. On the one hand low tariffs discouraged local production of many intermediate and capital goods which would have required higher tariff protection to be profitable, and in this sense reduced the overall protectiveness9 of the tariff system.10 On the other hand, with the same tariffs on final products, the cuts of intermediate input tariffs increased the effective protection of established local producers and could have offset or more than offset the reductions in protection to value added that would have resulted from reductions in final product tariffs.11 Starting in 1989 there were renewed attempts to rationalise the tariff structure, but the probability is that the protection levels that the structure made available to established import substitution industries between 1979 and 2000 remained about the same, or at best fell only slightly.12
8 For a description and analysis of the export policies of India and the other South Asian countries before and after trade liberalisation see World Bank (2004), Vol II, Chapter 4. 9 In this and later discussion “protectiveness” is used loosely to refer to the extent to which tariffs enable domestic prices to exceed cif prices. 10 As in other countries very low or zero tariffs on some intermediate inputs very likely made it unprofitable to produce them locally, even though in some cases it may have been profitable and economically efficient to do so had there been a less distorted tariff structure and exchange rate. 11 For a theoretically consistent approach to evaluating and measuring trends in trade restrictiveness see Anderson and Neary (1994). 12 Athukorala and Jayasuriya (2004, Table 2) report the results of some studies of the nominal and effective protection of import competing manufacturing done for 1981, 1991, 1994 and 2002. According to these studies both NPRs and EPRs came down slowly over this period but were still quite high in 2002. However all these studies used tariffs to measure the nominal protection of both finished products and tradeable inputs and therefore estimate nominal and effective protection that was available from the tariff structure, not implicit protection rates that take account of the actual differences between domestic and border prices. Especially in the case of the predominantly export-oriented sector 32 (textiles, wearing apparel and leather products) very likely implicit domestic-market protection rates of the sector were quite low over the whole period, or at least after 1991. Because of the importance of this sector, allowing for this would reduce the apparent decline in the weighted average NPR and EPR of the manufacturing sector as a whole, especially between 1994 and 2002.

Sri Lanka’s Trade Policies: Back to Protectionism
ASARC WP 2011/03 7
Despite the continuation after the 1977/78 reforms of moderate to high tariff protection of IS industries in the domestic market, until 2000 there was a clear long term downward trend in the overall protectiveness of the trade regime. This was mainly due to the steadily increasing share of manufactured exports in total exports and industrial production, which in turn meant that there was a corresponding increase in the share of tradable GDP that was exposed to international competition without the support of substantial protection or subsidies i.e. with zero or low effective protection. Fig 6 shows two indicators of this trend. The top line is the ratio of total manufactured exports to the total value added of a sample of larger “organised sector” firms surveyed annually by the Central Bank. Between 1976 and 2000, this ratio increased by a factor of 6.5, from 0.30 to 1.95, probably corresponding (very approximately) to an increase in the share of value added contributed by manufactured exports in total manufacturing value added from say 6-8 percent in 1976 to perhaps 40-50% in 2000.13 The bottom line in Fig 6 shows the share of “non-dutiable” imports in total imports, where “non-dutiable” imports are mainly raw material inputs , parts, components and equipment used by exporting firms located in free trade zones or exporters importing duty free under bonded warehouse arrangements.14 This share increased from 28% in 1978 to about 70% in 2000, providing another indirect indication of the expansion in the role of exporting firms in the economy. Manufactured exports were already growing very rapidly during 1978 (the first year for which the non-dutiable import data is available) so the increase from the pre-reform period in non-dutiable imports would have been even greater than indicated by this series.
Although empirical confirmation is not available in Sri Lanka, studies in other countries indicate that the share of manufacturing production that competes at approximately world prices typically extends beyond the production that is directly exported and may include some or most of the domestic sales of exporting firms, and also the sales of local firms that supply direct exporters with intermediate inputs. As regards the first of these — especially in large-number industries such as T&C — competitive pressures force firms to approximately equalise gross margins on exports with gross margins on production for the domestic market i.e. by setting domestic prices at approximately the same level as their export prices plus import duties on inputs that would have been exempt or refunded if the same products had been exported.15 This means that the domestic prices of exporters in such industries normally exceed their export prices, but are below the prices at which they could theoretically sell if they were able to take full advantage of the protection available from tariffs i.e. the tariffs are redundant and overstate — perhaps considerably — the excess of domestic prices over border prices.16 If local firms produce inputs which are supplied to exporters, these also must be sold at prices and on terms which from the exporting firm’s perspective are competitive with the prices and terms on which the inputs could be imported, usually duty free. Consequently some part of the “domestic” sales of input supplying firms
13 These are rough guesstimates only, because (1) the Central Bank value added estimates are less than total manufacturing value added since its survey does not include smaller manufacturing firms (2) the manufactured exports estimates are from the trade statistics and are complete (3) there are no separate estimates of value added in manufactured exports. For some earlier years the Central Bank used to publish “value of output” statistics for the same sample of larger manufacturing firms, but this series is unreliable owing to the likelihood of double counting. 14 This data is from Athukorala and Rajapatirana (2000), Table 4.1. We have not been able to update this series. 15 For a discussion of this phenomenon in Pakistan’s garment sector see Pursell (2007). 16 For many export-oriented firms in Asia the domestic market is treated as a residual market to dispose of surplus production or cancelled export orders, as a consequence of which domestic prices at times may be lower than export prices. If domestic prices are much above export prices there is also a strong temptation to illegally divert products which benefit from duty neutralisation schemes and export incentives to the domestic market. Reports of both these practices abound in the T&C industries of the South Asian countries, including Sri Lanka.

Garry Pursell and F.M. Ziaul Ahsan
8 ASARC WP 2011/03
are in fact indirect exports competing at world prices and for which tariffs are also redundant.17
The period of rapid export growth and increasing openness of the Sri Lankan economy peaked and came to an end in 2000. This is apparent from the slowing of export and general trade growth after 2000 (Table 1 and Figs 1, 2 and 6) and from the steep downward turn in trade/GDP shares during 2001-2009 (Fig 7). The initial sharp decline in exports and imports during 2001 and 2002 was associated with the July 2001 Tamil Tiger attack on Colombo airport which deterred foreign buyers (especially garment buyers): this was followed just two months later by the 9/11 attacks in the US which further undermined buyer confidence. Subsequently, starting in about 2003 export growth picked up and Sri Lanka participated to some extent in the boom in world trade which continued until the global crisis of 2008. However during these five or so years of unprecedented opportunity for export growth, Sri Lanka’s exports increased only modestly by comparison with the export expansion of many other developing countries: for example between 2003 and 2008 India’s exports increased three times in nominal US dollars, compared with a corresponding increase of about 60% in Sri Lanka.
As already noted, in November 2004 Sri Lanka explicitly reversed its earlier commitment to open trade policies with the issue of a long list of products that would henceforth be subject to a para-tariff called a Cess. The restrictiveness of its import policies steadily increased during the following years. The rest of this paper describes and analyses the new protective structure, beginning with a description in the next section of the import tax system as it was during 2009 up to early June 2010.
3. The new import tax structure: main features18
Sri Lanka probably holds the world record for the complexity of its tariff system. Imports into most countries are typically subject to three import taxes: customs duties, an indirect tax such as VAT which is also imposed on domestic sales, and frequently excise duties — also imposed on domestic sales — aimed at raising revenue and/or discouraging consumption of a few products such as cigarettes and alcoholic drinks. In addition in some countries there are anti-dumping duties, but while these greatly complicate the import tax treatment of the products to which they are applied, even in India (which is by far the world’s most active anti-dumper) relatively few tariff lines are affected. By contrast, in addition to customs duties
17 In order to encourage “backward integration” from direct exports to local production of inputs used by exporters, many governments have arrangements under which indirect exporters receive the same benefits as direct exporters, in particular duty free access to imported materials and other inputs. Sri Lanka began providing import duty rebates for domestic firms selling to EPZs in 1982. 18 The tariff schedule analysed and discussed in this paper <Tariff Guide Excel 2009.xls> was downloaded from the Sri Lankan Customs department website and interpreted with the aid of the file <Tariff Calculator 2009.xls>. In September 2010 these two files were still on the website and apparently had not been changed since they were first posted some time in 2009. This is despite some announcements of changes to the various import taxes during 2009 and 2010, including especially the abolition of the Customs Surcharge (SUR) tax in June 2010 and cuts in the number of tariff lines subject to the Cess also announced in June 2010. This suggests that the files we have used for our calculations, although they appeared to be current when most of our calculations were done in September 2010, in fact represented the import tax situation from early 2009 up to about early June 2010. As of early January 2011 the RIDL tax had also been abolished and further revisions to the Cess taxes had been announced. However the “Tariff Guide” file had been removed from the Customs department website and had not been replaced. Until that is once again available it is not possible to comprehensively update our quantitative analysis. However we have made some rough estimates of the situation in January 2011 which are discussed in section 7 of the paper.

Sri Lanka’s Trade Policies: Back to Protectionism
ASARC WP 2011/03 9
(CDs)19 during 2009 and up to June 2010 the Sri Lankan tariff schedule included nine other import taxes that are imposed or potentially imposable on imports of individual products. By early January 2011 some changes had been made to the CD structure and two of these additional import taxes had been removed, but that still left seven other import taxes, and the extreme complexity and protectiveness of the system had only been reduced to a minor extent. The following discussion deals with the system as it was during 2009 up to June 2010. For reasons given below, we believe that the principal points that come out of this discussion have not been affected in major ways by the changes introduced since then.
During 2009 there were five normally applied CD rates or “slabs”: zero, 2.5%,6%, 15% and 28% (Table 2). In 2000 the top rate was cut from 35% to 25%, but afterwards is was gradually increased until a new top rate of 30% was announced in June 2010, while at the same time the CD rate of 2.5% which applied to large number of tariff lines was abolished and put at zero. The CD structure has always been deliberately escalated, with the maximum rate applied to products (mainly final consumer goods) that the government wishes to protect, and lower rates on intermediate goods, raw materials and equipment of which there is no competing domestic production and /or which are used as inputs by established local industries.
Of the other nine taxes, in 2009 four (referred to hereafter as “para-tariffs”) add to whatever protection is provided to domestic production by customs duties, because they are only applied to imports and there is no domestic equivalent. These are the Ports and Airports Development Levy (PAL), the Customs Surcharge (SUR), the Commodity Export Subsidy Scheme (Cess),20 and the Regional Infrastructure Development Levy (RIDL). Information on the incidence, nominal rates, and estimated average protectiveness of these four para-tariffs during 2009 is in Tables 3 and 4.
The 2008 budget removed VAT from a number of domestically produced products, but according to the 2009 “Tariff Guide” broadly similar products would be subject to VAT were they to be imported, so for these products the VAT on imports effectively became another para-tariff. In order to quantify the resulting extra protection an exact list of the domestically produced exempt products would be needed. As this was not available this para-tariff is not allowed for in the total protection rates estimated for this paper.
In addition to the VAT, there are three other import taxes for which there are domestic equivalent or approximately equivalent taxes, and which provisionally have been judged to be roughly neutral in terms of protectiveness. These are the Social Responsibility Levy (SRL), the Nation Building Tax (NBT), and Excise duties. A more detailed look at how the domestic equivalents of these import taxes operate in practice might change this assessment21.
19 The acronyms used for the various import taxes in this paper are the same as in the Sri Lankan Customs department website. 20 Despite this official title, the objectives and role of the Cess are to provide extra protection to local import substitution industries and to raise revenue. It has nothing to do with promoting or subsidising exports. 21 For example according to the Inland Revenue Department “There is a great deal of articles and services which are not liable to [the nation building] tax” (download dated Jan 18, 2009 from the Inland Revenue Department website), but the 2009 Tariff Guide lists only 17 of 6520 import tariff lines as exempt from the NBT. The nominal tax rate (when applied to imports) was 3% which after adjusting for the tax’s complex tax base was equivalent to an average rate of 4.20% of cif prices over all HS tariff lines. This suggests that the NBT on imports is also being used to provide extra protection to the local production of some products, but as far a we know information to check on this possibility is not publicly available.
Garry Pursell and F.M. Ziaul Ahsan
10 ASARC WP 2011/03
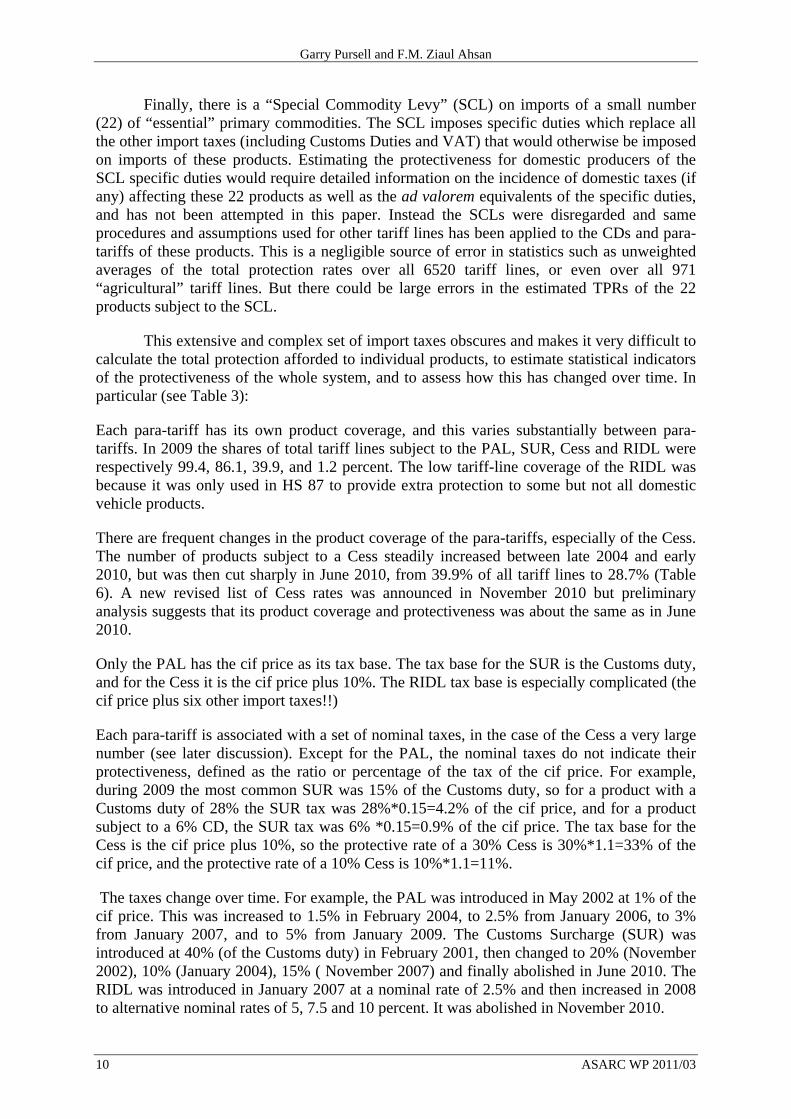
Finally, there is a “Special Commodity Levy” (SCL) on imports of a small number (22) of “essential” primary commodities. The SCL imposes specific duties which replace all the other import taxes (including Customs Duties and VAT) that would otherwise be imposed on imports of these products. Estimating the protectiveness for domestic producers of the SCL specific duties would require detailed information on the incidence of domestic taxes (if any) affecting these 22 products as well as the ad valorem equivalents of the specific duties, and has not been attempted in this paper. Instead the SCLs were disregarded and same procedures and assumptions used for other tariff lines has been applied to the CDs and para-tariffs of these products. This is a negligible source of error in statistics such as unweighted averages of the total protection rates over all 6520 tariff lines, or even over all 971 “agricultural” tariff lines. But there could be large errors in the estimated TPRs of the 22 products subject to the SCL.
This extensive and complex set of import taxes obscures and makes it very difficult to calculate the total protection afforded to individual products, to estimate statistical indicators of the protectiveness of the whole system, and to assess how this has changed over time. In particular (see Table 3):
Each para-tariff has its own product coverage, and this varies substantially between para-tariffs. In 2009 the shares of total tariff lines subject to the PAL, SUR, Cess and RIDL were respectively 99.4, 86.1, 39.9, and 1.2 percent. The low tariff-line coverage of the RIDL was because it was only used in HS 87 to provide extra protection to some but not all domestic vehicle products.
There are frequent changes in the product coverage of the para-tariffs, especially of the Cess. The number of products subject to a Cess steadily increased between late 2004 and early 2010, but was then cut sharply in June 2010, from 39.9% of all tariff lines to 28.7% (Table 6). A new revised list of Cess rates was announced in November 2010 but preliminary analysis suggests that its product coverage and protectiveness was about the same as in June 2010.
Only the PAL has the cif price as its tax base. The tax base for the SUR is the Customs duty, and for the Cess it is the cif price plus 10%. The RIDL tax base is especially complicated (the cif price plus six other import taxes!!)
Each para-tariff is associated with a set of nominal taxes, in the case of the Cess a very large number (see later discussion). Except for the PAL, the nominal taxes do not indicate their protectiveness, defined as the ratio or percentage of the tax of the cif price. For example, during 2009 the most common SUR was 15% of the Customs duty, so for a product with a Customs duty of 28% the SUR tax was 28%*0.15=4.2% of the cif price, and for a product subject to a 6% CD, the SUR tax was 6% *0.15=0.9% of the cif price. The tax base for the Cess is the cif price plus 10%, so the protective rate of a 30% Cess is 30%*1.1=33% of the cif price, and the protective rate of a 10% Cess is 10%*1.1=11%.
The taxes change over time. For example, the PAL was introduced in May 2002 at 1% of the cif price. This was increased to 1.5% in February 2004, to 2.5% from January 2006, to 3% from January 2007, and to 5% from January 2009. The Customs Surcharge (SUR) was introduced at 40% (of the Customs duty) in February 2001, then changed to 20% (November 2002), 10% (January 2004), 15% ( November 2007) and finally abolished in June 2010. The RIDL was introduced in January 2007 at a nominal rate of 2.5% and then increased in 2008 to alternative nominal rates of 5, 7.5 and 10 percent. It was abolished in November 2010.

Sri Lanka’s Trade Policies: Back to Protectionism
ASARC WP 2011/03 11
The nominal rates of the various import taxes on individual products are frequently increased or reduced, taxes on some products are temporarily waived, and others are exempted. This is particularly the case for the Cess which from the beginning was used as a selective protective instrument, but selectivity and apparently ad hoc changes have also occurred in the PAL and the SUR, which it seems were originally intended to be uniform across-the-board taxes. As a result, in 2009 13.9% of tariff lines were exempt from the general SUR tax rate of 15%, while the PAL tax on 39 products was set at 2% instead of the general 5% rate, and was exempted for 38 products.
By 2009 just under a quarter of the total number of tariff lines (half of agricultural lines and a fifth of industrial lines) had a specific component (Tables 3 and 5 and Fig 8), compared to just 1.2% in January 2004 and 5.9% in the case of agriculture. This major policy change was partly implemented by expanding the number of specific CDs, but mainly by the use of specific Cesses. Of the total number of tariff lines (2601) subject to a Cess, 32.4% were alternative-specific (i.e. the higher of an ad valorem rate or a specific amount per physical unit) and 21.1 % were specific-only (i.e. a specific amount per physical unit). In addition some of the RIDL taxes protecting selected auto products were indirectly specific, because their tax base included specific excise taxes. The use of specific import taxes — strongly discouraged by the WTO — is a classic method for insulating domestic producers from fluctuations in world prices, while at the same time making it very difficult to measure the protectiveness of a country’s tariff system. For this reason the estimates of the overall protectiveness of the Sri Lankan tariff system reported below are approximations that rely on some arbitrary short cuts for quantifying the many specific import taxes.
4. The new import tax structure: average levels
Tables 4-8 and Figs 9, 12, and 13 summarise some statistics on the protectiveness of the new tariff structure during 2009 until June 2010, and how this had changed since earlier estimates were made for November 2002 and January 2004. A number of liberalising changes were made to the system during and following June 2010, but the data needed to rigorously quantify these were not available at the time of completing this paper in January 2011. Preliminary estimates of the likely effects of these reforms (discussed in section 6 below) suggest that they simplified and reduced the protectiveness of the system, but only to a minor extent. Protectiveness as measured by rough estimates of average protection levels in January 2011 (see the last column of Table 8 and Fig 9) remained very high and para-tariffs (especially the Cess) continued to have a somewhat reduced but still major role.
The Customs duty and para-tariffs in place during 2009-June 2010 and analysed in the section, refer to imports from MFN sources: the import taxes that would be faced by imports from countries that have preferential trade agreements with Sri Lanka are discussed separately in section 5 below. The total protection rate (TPR) in 2009 is the sum of the protection provided by Customs duties and para-tariffs i.e.
TPR=CD+PAL+SUR+Cess+RIDL,
where all these import taxes are expressed as percentages of the cif price. In November 2002 and February 2004 the Cess and the RIDL didn’t exist, so for those years TPR=CD+PAL+SUR. A number of points are apparent from these calculations:
As measured by unweighted average TPRs, protection went up slightly between late 2002 and early 2004, but then doubled or more than doubled between 2004 and 2009 (Fig 9). The average TPR for agricultural tariff lines increased from 28.1% to to

Garry Pursell and F.M. Ziaul Ahsan
12 ASARC WP 2011/03
49.6%, for industrial tariff lines from 10.7% to 24.1%, and for all tariff lines from 13.4% to 27.9%. These average protection rates are very high by world standards and have clearly reversed Sri Lanka’s previously relatively open trade policies.
This is also apparent from a long term comparison (Fig 5) according to which the new high TPRs in 2009 contrast with the long term declining trend in average tariffs which started in about 1982 and terminated in 2000. The very high average protection levels of 2009 have not been seen in Sri Lanka since 1987 and before.
Nearly all of the dramatic increase in the average protectiveness of the import tax system is attributable to the extra protection provided by para-tariffs. Comparing the situation in November 2002, January 2004 and 2009 (Table 8) average Customs duties went up, but by only a few percentage points. In 2009 average Customs duties were low to moderate by general developing country and Sri Lanka’s own earlier standards, but were less than half the actual average protectiveness of the system after allowing for the para-tariffs (Figs 12 and 13).
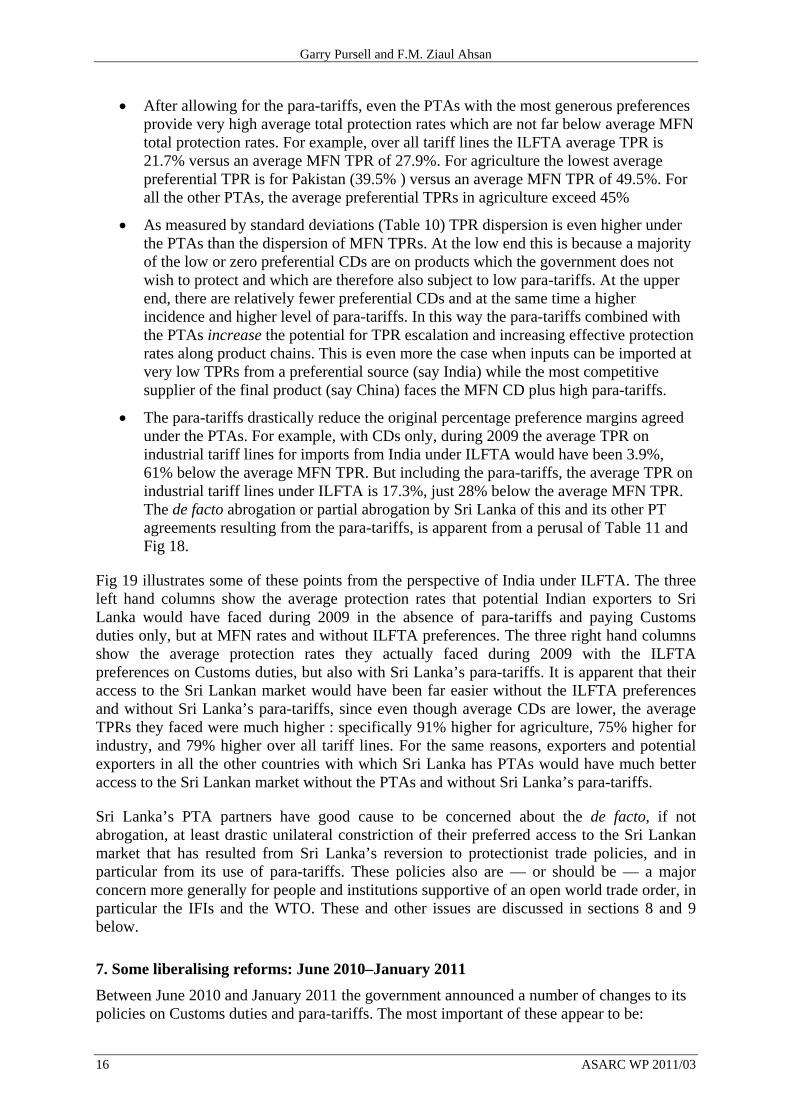
The role of para-tariffs in increasing TPRs is illustrated for a few selected agricultural and industrial products in Table 9 and Figs 10 and 11. These compare TPRs in 1999, when there were no para-tariffs, with TPRs for the same products in 2009. In 1999 the normal maximum CD was 35% , and this had been cut to 28% by 2009. Despite this — after including the new para-tariffs — the TPRs on all these products were much higher in 2009. For example, the TPR on fruit juices increased from 35% (CD only) in 1999 to 75.7% (CDs plus para-tariffs) in 2009, and there were similar increases for other agricultural products e.g. chicken meat from 30% to 70.2%. Among industrial products the toilet soap protection rate went up from 30% to 64.7%, bicycles from 20% to 43.4%, and motor car tyres from 30% to 48.2%. Even though throughout the period Sri Lanka continued to have a large, highly competitive export oriented garment industry, the clothing TPR was increased from 10% in 1999 to 53% in 2009. Likewise, the TPR on textile fabrics which had been cut to zero in 199722 had increased to 38% by 2009.
The most protective of the para-tariffs in 2009 was the Cess, followed by the PAL, SUR, and RIDL (Table 4 and Fig 12). As measured by average protection rates over all tariff lines, the protectiveness of the Cess (8.8%) was not much less than the protectiveness of Customs duties (12.1%). In addition, as are Customs duties, the Cess is used selectively by setting high cess rates on finished products that the government wishes to protect and either exempting or setting low Cess rates on intermediate inputs (see later discussion). The PAL tax raises the general TPR level and contributes to the distortion of relative incentives, but because it is imposed at a uniform ad valorem rate in relation to cif prices on practically all tariff lines, it is less distortionary than the other para-tariffs.23 In contrast to the PAL, because its tax base is Customs duties which are steeply escalated, the SUR further widens tariff escalation. However its aggregate protective impact was relatively minor in 2009. The overall protective impact of the RIDL was quite small because it is only applied to imports of auto products which are listed in HS 87 of the Customs tariff schedule. But
22 Customs duties on textile fabrics were abolished in 1997 in order to streamline fabric imports by garment exporters and to eliminate (or at least reduce) the incentive for illegal diversion of duty free fabrics imported under FTZ and bonded warehouse arrangements to the domestic market. The reintroduction of protective import taxes on fabrics by the imposition of para-tariffs has reversed these reforms. 23 Like a uniform tariff, on its own a 5% PAL on both finished products and tradeable inputs corresponds to protection to value added (effective protection ) at the same rate of 5%.

Sri Lanka’s Trade Policies: Back to Protectionism
ASARC WP 2011/03 13
because there was no RIDL on imported materials, parts and components of these products, it greatly widened the processing margins available to local producers.
In 2009 there were large numbers of specific CDs and many more specific Cesses, so estimating statistics such as average TPRs would be meaningless unless these are included. For the estimates of unweighted average protection rates discussed above, we used the ad valorem component of the “alternative” specific taxes, and we assumed that the nominal equivalent of all specific-only taxes was 30%. This last assumption means that the protective rate of a specific-only CD is 30%, and the protective rate of a specific-only Cess is 33% since the tax base for the Cess is the cif price plus 10%. 30% seemed the most plausible nominal rate to assume to quantify the specific-only taxes, because the ad valorem component of more than half of the “alternative” specific taxes (CDs and Cesses) were 30% or more. We also did some spot checks of the ad valorem equivalents of products subject to specific-only import taxes, using Indian export unit values during Indian FYs 08/09 and 09/10 as approximations of Sri Lankan cif prices. Most of these comparisons gave ad valorem equivalents of roughly 25% to 35% e.g. using Indian export unit values of cotton and polyester fabrics to evaluate the specific-only Cesses on imports of these products.
Ideally world prices would be estimated to calculate the ad valorem equivalents of all the specific-only CDs and Cesses, but this would be a very large and time consuming task since it would mean looking in detail at 52 cases of specific-only CDs and 550 cases of specific-only Cesses (Table 5). Instead we ran an alternative version of the estimates assuming that all the specific-only taxes are equivalent to nominal rates of 15%. The results of this exercise for unweighted average TPRs are shown in Table 7. It can be seen that this alternative assumption reduces the average TPRs, but only slightly — by approximately 1.5 percentage points over all tariff lines and for industrial tariff lines, and by about 1.9 percentage points for agricultural tariff lines. Considering that the use of the ad valorem component of alternative-specific taxes almost certainly under-estimates their average protectiveness,24 we think that the 30% assumption for specific-only taxes gives a plausible approximation of the overall protectiveness of the new structure.
5. The new import tax structure: distribution
Sri Lanka’s tariff structure has always been steeply escalated, starting with the initial 6-band system which replaced most QRs in 1977. This imposed high CDs (up to 100%) on “final” goods and other locally produced goods that the government wished to protect, and lower CDs on raw materials and “essential” imports (Cuthbertson and Athukorala (1991) p.363). As noted previously, the normally applied top rate came down to 35% by the mid 1990s, but the lower rates were also reduced (Table 2). This pattern persisted during the 2000s after the introduction of para-tariffs and continued into the new high-protection era. In 2009 we estimate the standard deviation of TPRs over all tariff lines at 23.5%, as against an unweighted average TPR of 27.9%. In that year there was an apparently simple structure of Customs duties with just five normal rates (zero, 2.5, 6, 15 and 28 percent) with a low-to-moderate unweighted average CD rate over all tariff lines of just 12.1%. But generalisations about the protective structure without allowing for the protective para-tariffs are meaningless. After allowing for them the protective structure is complex in the extreme, with 75 different 24 By definition the ad valorem component of an “alternative” specific duty is the minimum estimate of its protectiveness. In 2009 there were 210 alternative-specific CDs and 843 alternative-specific Cesses. There were 12 indirectly specific RIDL taxes which we treated case-by case using the same assumption in evaluating specific CDs and Cesses. It is highly probable that the specific component of some of these taxes exceeded the ad valorem component.

Garry Pursell and F.M. Ziaul Ahsan
14 ASARC WP 2011/03
total protective rates ranging from zero to more than 90% ! The resulting range of TPRs are illustrated in Figs 14, 15 and 16. Note in particular:
The large number (42%) of industrial tariff lines with low TPRs of below 10%. In part this reflects the government’s preference for protecting the value added of local import substitution firms by providing low input tariffs. Even so IS producers are also protected by high final product TPRs, as is apparent from the fact that almost a third (32.2%) of industrial tariff lines had TPRs of 35% or higher, with many clustering in a range of 35% to 60%, and some as high as 70% to 85%.
Almost 40% of agricultural TPRs are within a range of 70% to 80%, while only a few (6.7% of the total) are below 10%. In part these very high tariffs protecting IS agricultural production reflect the fact that by comparison with manufacturing, tradeable inputs are generally a small proportion of total production costs. Consequently final product tariffs have to be high to give high protection to value added. Food processing is an exception, but if protection levels for the primary agricultural inputs used by processors are high, then the final processed products also “need” high protection.
The TPRs on almost half (46.1%) of agricultural tariff lines25 exceed 50%, clearly breaching Sri Lanka’s Uruguay Round commitment which bound nearly all agricultural tariffs at 50% (see later discussion).
The Cess on its own is a major contributor to the wide dispersion of TPRs. 2601 tariff lines (39.9% of the total number of lines) are subject to a Cess. We estimate that about half of these Cesses provide protection (in addition to whatever protection is provided by Customs duties and other para-tariffs) of either 33% or 38.5% , while the other half provide additional protection at nine different rates ranging from 1.1% to 27.5% of cif prices (Fig 17). As noted previously high Cess rates are frequently fixed when Customs duties are also high. For example the TPRs of 431 tariff lines (6.6% of the total) is 70.2%, which is the sum of CD(28%), SUR(4.2%), PAL (5%) and Cess (33%). Conversely there is generally no Cess on products with low or zero CDs, while Cesses at varying rates below the top two levels seem to be fixed on a case to case basis in order to provide what are apparently considered to be appropriate import tax rates on imports under Sri Lanka’s preferential trade agreements, especially the agreements with India (ILFTA) and Pakistan (PSFTA). As discussed below, the Cess was introduced to provide protection against, and revenue from, preferential imports on which CDs were going to zero under these agreements. In this way it is a second, flexible and discretionary Customs duty which is used by the government to tax imports from preferential sources in whatever way it considers appropriate, while at the same time providing extra protection against MFN imports.
6. The new protectionism and Sri Lanka’s PTAs
Sri Lanka is a signatory to five preferential trade agreements,26 three of which (GSTP, SAFTA and APTA) are agreements with groups of countries, and two of which (ILFTA with India and PSFTA with Pakistan) are bilateral. Of these only the bilateral agreements with 25 This share is calculated defining HS 01-24 as “agriculture”. The share of tariff lines breaching the AOA binding would differ slightly had we used the WTO definition of “agriculture”. The principal difference is that the definition used in this paper includes HS 03 (fish and crustaceans etc), which is not included in the WTO definition. 26 We refer to these as “preferential” trade agreements (PTAs) as better reflecting the reality that the so-called “free” trade agreements (FTAs) are very far from free.

Sri Lanka’s Trade Policies: Back to Protectionism
ASARC WP 2011/03 15
India and Pakistan, and SAFTA seemed at one stage to have the potential for providing significant preferential margins for these countries’ exports to Sri Lanka, and the concomitant potential for lowering the overall level of import-substitution protection. In the case of ILFTA this was because, starting on March 1, 2003, the CDs on imports from India of more than half Sri Lanka’s tariff lines were scheduled to decline in steps and reach zero on March 1, 2008. In the case of Pakistan the bilateral agreement became operational on June 12, 2005 and provided for similar reductions in CDs on imports from Pakistan, down to zero after June 12, 2010. The original Sri Lankan negotiators gave these concessions on 81.6% of Sri Lanka’s tariff lines (Table 10), possibly thinking that Pakistan would not be a particularly competitive supplier. SAFTA became effective from January 1, 2006 and in its second phase (2008-2013) Sri Lanka was supposed to reduce its preferential CDs on imports from “non-LDC” SAFTA countries (India and Pakistan) to a range of 0-5% by 2013, and from SAFTA “LDC” countries (Bangladesh, Nepal, Maldives and Bhutan) to a range of 0-5% by 2011. The scope and potential effects of the other two PTAs (GSTP and APTA) were from the beginning (and so far remain) minimal.
The nationalist government that came to power in April 2004 explicitly rejected Sri Lanka’s previously open trade policies, and the intensification of the civil war in the following years increased revenue needs. As in many other countries, to meet these needs it was politically convenient to raise import taxes rather than domestic taxes. In this regard the scheduled reductions in Customs duties agreed under Sri Lanka’s PTAs were seen as undercutting both objectives, by reducing protection for domestic industries, and reducing revenue from import taxes. The way out was to expand the use of para-tariffs, especially the Cess, on the argument that the PTA agreements applied only to Customs duties. In 2006 this was explained as follows: “Cesses will be used in the future to mitigate the negative impact of the increased preference for imports from India and Pakistan to maintain tax revenue”.27 From the government’s viewpoint, the use of the Cess and the other three para-tariffs therefore kills four birds with one (or more accurately with four!) stones. Firstly, para-tariffs can be set at whatever levels are desired to block or limit imports from MFN sources. Likewise, they can be set at any desired level to control imports from PTA countries, especially imports from India and Pakistan. Thirdly, since Customs duty reductions under the PTAs have proceeded as originally agreed, the government can argue that some margin of preference for these products is being maintained (even if the para-tariffs are on their own prohibitive!). Fourthly, the para-tariffs are a separate and important source of revenue from imports which reduces the need for revenue from unpopular domestic indirect or direct taxes.
Tables 10 and 11 and Fig 18 compare some statistics on the average protectiveness of Sri Lanka’s PTAs during 2009, after allowing for the para-tariffs.28 In this year CDs on tariff lines subject to preferences (70.5% of the total number of lines) under ILFTA had come down to zero, and CDs on tariff lines subject to preferences (81.6% of the total) under PSFTA had been reduced by 60%. A number of major points are apparent from these comparisons:
Under every PTA, the para-tariffs more than double the average protection rate available from Customs duties alone
27 Statement by Lal de Mel, Co-Chair of Sri Lanka’s Tariff and Trade Cluster, as reported by Lanka Business Online, March 26, 2006. 28 The averages are over all of Sri Lanka’s tariff lines, including the tariff lines for which there are no preferences. The number of tariff lines subject to CD preferences during 2009 under the various PTAs is given in Table 9.
Garry Pursell and F.M. Ziaul Ahsan
16 ASARC WP 2011/03
After allowing for the para-tariffs, even the PTAs with the most generous preferences provide very high average total protection rates which are not far below average MFN total protection rates. For example, over all tariff lines the ILFTA average TPR is 21.7% versus an average MFN TPR of 27.9%. For agriculture the lowest average preferential TPR is for Pakistan (39.5% ) versus an average MFN TPR of 49.5%. For all the other PTAs, the average preferential TPRs in agriculture exceed 45%
As measured by standard deviations (Table 10) TPR dispersion is even higher under the PTAs than the dispersion of MFN TPRs. At the low end this is because a majority of the low or zero preferential CDs are on products which the government does not wish to protect and which are therefore also subject to low para-tariffs. At the upper end, there are relatively fewer preferential CDs and at the same time a higher incidence and higher level of para-tariffs. In this way the para-tariffs combined with the PTAs increase the potential for TPR escalation and increasing effective protection rates along product chains. This is even more the case when inputs can be imported at very low TPRs from a preferential source (say India) while the most competitive supplier of the final product (say China) faces the MFN CD plus high para-tariffs.
The para-tariffs drastically reduce the original percentage preference margins agreed under the PTAs. For example, with CDs only, during 2009 the average TPR on industrial tariff lines for imports from India under ILFTA would have been 3.9%, 61% below the average MFN TPR. But including the para-tariffs, the average TPR on industrial tariff lines under ILFTA is 17.3%, just 28% below the average MFN TPR. The de facto abrogation or partial abrogation by Sri Lanka of this and its other PT agreements resulting from the para-tariffs, is apparent from a perusal of Table 11 and Fig 18.
Fig 19 illustrates some of these points from the perspective of India under ILFTA. The three left hand columns show the average protection rates that potential Indian exporters to Sri Lanka would have faced during 2009 in the absence of para-tariffs and paying Customs duties only, but at MFN rates and without ILFTA preferences. The three right hand columns show the average protection rates they actually faced during 2009 with the ILFTA preferences on Customs duties, but also with Sri Lanka’s para-tariffs. It is apparent that their access to the Sri Lankan market would have been far easier without the ILFTA preferences and without Sri Lanka’s para-tariffs, since even though average CDs are lower, the average TPRs they faced were much higher : specifically 91% higher for agriculture, 75% higher for industry, and 79% higher over all tariff lines. For the same reasons, exporters and potential exporters in all the other countries with which Sri Lanka has PTAs would have much better access to the Sri Lankan market without the PTAs and without Sri Lanka’s para-tariffs.
Sri Lanka’s PTA partners have good cause to be concerned about the de facto, if not abrogation, at least drastic unilateral constriction of their preferred access to the Sri Lankan market that has resulted from Sri Lanka’s reversion to protectionist trade policies, and in particular from its use of para-tariffs. These policies also are — or should be — a major concern more generally for people and institutions supportive of an open world trade order, in particular the IFIs and the WTO. These and other issues are discussed in sections 8 and 9 below.
7. Some liberalising reforms: June 2010–January 2011
Between June 2010 and January 2011 the government announced a number of changes to its policies on Customs duties and para-tariffs. The most important of these appear to be:

Sri Lanka’s Trade Policies: Back to Protectionism
ASARC WP 2011/03 17
Changes to the CD schedule which increased the maximum normal rate from 28% to 30% and replaced the previous 2.5% slab with zero (Table 2).
New Cess schedules announced in June 2010 and again in November 2010
Abolition of the SUR tax in June 2010
Abolition of the RIDL tax in January 2011
As of the time of writing this paper none of these changes had been incorporated in a new publicly available comprehensive tariff schedule, so we have not been able to systematically re-estimate statistics on the overall protectiveness of the revised system. However the following comments seem pertinent:
The resulting changes to the average level of CDs are very minor, since the effect of the large number of tariff lines (2087 according to the 2009 “Tariff Guide”) which were reduced from 2.5% to zero, was offset by the many tariff lines (we estimate about 1523) that were increased from 28% to 30%. This is confirmed by the 2010 WTO TPR report, which estimates the new average CD over all tariff lines at 11.5% compared to 12.1% in 2009, while the average CD for agricultural tariff lines actually increased by about a percentage point (Table 8).
The resulting widening of the CD structure to four basic rates (zero, 5, 15 and 30 percent) further increases escalation, especially when combined with para-tariffs.
The June 2010 and November 2010 revisions of the Cess list substantially reduced overall tariff line coverage from 39.9% to 28%, but most of the eliminated Cesses were very low. In all 727 Cesses were cancelled in June 2010 and another 51 in November 2010, but more than half of these (356) were from the electrical machinery chapter of the tariff schedule (HS85). The nominal rates of many of these were just 1% and they averaged just 3.1%. Consequently the protectiveness of the average Cess went up (from approximately 22% to 26%), and there was only a minor reduction in the average of the extra protection provided when measured over all tariff lines (from 8.8% to 7.3%-see Table 6). Note also that the Cess’s tariff line coverage in agriculture increased, from 56.1% to 57.1%, while its average protectiveness for the agricultural sector remained the same in November 2010 (16.4%) as it had been in 2009.
By concentrating the Cess changes on the elimination of Cesses at the bottom end of the distribution of Cess rates, these reforms to the Cess system also contributed to increased escalation of TPRs along processing chains. Very few tariff lines with Cesses at the top end of the distribution (providing extra protection of 38.5% and 33% of the cif price) were removed.
However the abolition of the tariff surcharge (SUR) had more substantive effects, by reducing average industrial protection by 1.3% and average agricultural protection by 3.6% (Table 4). This change also reduced the escalation of TPRs, since — as noted previously — the base for the SUR was the Customs duty. Thus if the CD rate was zero, the SUR was also zero, but the SUR was 4.2% of the cif price if the CD was 28%.
Finally, in January 2011 the RIDL was removed. Previously this tax had only been applied to a small number of HS 87 (automobile) tariff lines, so the effect of its abolition on average TPRs over all tariff lines is tiny (about 0.32% of cif prices —

Garry Pursell and F.M. Ziaul Ahsan
18 ASARC WP 2011/03
Table 4). However the effects on the protection rates of the specific products from which it was lifted may be more substantial.29
To sum up, the reforms introduced during June 2010-January 2011 have somewhat simplified the import tax system by removing one basic rate (“slab”) from the CD structure, by abolishing the SUR and the RIDL, and by reducing the number of tariff lines subject to a Cess. The protectiveness of the system has also been moderately cut, according to our rough estimates30 by about 4 percentage points as measured by unweighted average total and industrial TPRs, and by about 2 percentage points in the case of agriculture (see Table 5). But despite these reforms the system remains extremely complex and non-transparent, and as of January 2011 was still providing very high and variable levels of protection to import substitution industries that the government wishes to protect. For these reasons we do not believe the recent changes warrant any basic revisions to our assessments of the system (section 8 and 9 below) which were originally based on the CD structure and para-tariffs as they were in 2009 up to early 2010.
8. Sri Lanka’s new protectionism: consequences for economic efficiency and growth
For a number of related reasons, we believe that Sri Lanka’s present protectionist import tax structure has serious costs for Sri Lanka’s economic welfare and growth, both in the recent past, currently, and in the foreseeable future unless present policies are rapidly unwound.
A special concern is that, as discussed in section 2 and illustrated in Figs 6 and 7, the country’s openness to international trade as measured by trade/GDP ratios has drastically declined since 2000, with an especially sharp drop between 2008 and 2009 .This declining share of trade in the economy is consistent with the move to protectionist trade policies, especially after 2004. These policies are intended to cut imports (or at least slow their growth), but in the process also pull resources out of export industries, appreciate the real exchange rate (or slow the devaluation rate), and slow export growth. Protectionist import policies — especially of unprocessed and processed agricultural products and a range of manufactured consumer products including consumer durables — also add to domestic prices and increase the difficulty of managing inflation and the fiscal deficit. This in turn puts upward pressure on interest rates and the real exchange rate.
Although other factors have also been important, the new protection policies are key to understanding the evolution of Sri Lanka’s real exchange rate, which appreciated by just over 25% between late 2004 and July 2010 (Fig 20). Note especially the sharp real appreciation between July 2007 and October 2008, a period when exports needed help as the GFC crisis unfolded. The appreciation of the REER index occurred despite a weighted average nominal devaluation over the 2004-2010 period of approximately 8%. This marked divergence between the trends in the nominal and real exchange rate was attributable to considerably higher inflation in Sri Lanka than the average inflation rate in the 24 countries included in the Central Bank’s NEER and REER indices. The continuing appreciation of Sri Lanka’s real exchange rate during these years is probably the principal explanation31 of the slow growth of exports relative to their potential and relative to GDP. Conversely, the real appreciation
29 About the same time as the removal of the RIDL the government also published a new CD structure and rules for the auto sector. These changes would also need to be considered as well as the removal of the RIDL in order to assess the resulting net changes to the protection levels of these products. 30 How these estimates were made is described in the notes to Table 5. 31 The other principal explanation is probably the deterrent effects of the worsening civil conflict on investment (especially FDI) in export industries.

Sri Lanka’s Trade Policies: Back to Protectionism
ASARC WP 2011/03 19
should have expanded imports, but this development was blocked by steadily increasing import protection.
Following the end of the civil conflict in 2009, there have been signs that private investment including FDI is reviving. But while the present policy stance and import tax structure persists, there is a serious danger that capital (including foreign capital) and labour will be disproportionately pulled into highly protected import substitution manufacturing industries with low or negative economic rates of return. Likewise, there is a serious danger that capital, labour and land will be attracted to high cost and highly protected import substitution farming and agricultural processing activities.32
As was the case during the South Asian “License Raj” regimes of the distant past, the revival of discretionary, ad hoc protectionism in Sri Lanka brings with it opportunities for substantial economic rents for favoured firms, especially if they have or develop market power behind high tariff and para-tariff barriers to import competition. A special danger is domestic or foreign direct investment in industries in which the final product is protected by CDs and para-tariffs (say against imports from China) while inputs can be imported over zero or low tariffs under Sri Lanka’s PTAs (say from India under ILFTA).33
Despite recent simplifications, the import tax and protective system is non-transparent, complex, constantly changing, and unpredictable. This combination is likely to deter long term business commitments, both in production and trade. Related to this, the system appears to be highly discretionary (by whom and how is it decided to fix a Cess on a given product, and at what rate?). In such systems financial success disproportionately goes to people and groups with lobbying skills and access to bureaucrats, politicians and other knowledgeable insiders.
The new trade policies have sharply increased the government’s public finance reliance on trade taxes, reversing many years of successful efforts to instead use domestic and trade-neutral taxes (Fig 21). This increase was especially apparent following the large scale use of para-tariffs after 2004. By 2009 the shares of revenue from protective import taxes in total indirect tax receipts and total tax receipts were respectively 41.5% and 32.1 %, more than double their shares in 2002, and well above the maximum levels recorded since 1981. During 2008 about half of Customs duty revenue was from protective import taxes, of which approximately 21% was from CDs, and about 29% from para-tariffs. As in many other countries, such reliance strengthens the hand of opponents of trade policy liberalisation, who typically argue that cuts in protective import taxes will not only hurt domestic industries but involve losses of government revenue. Seldom mentioned is the fact that revenue will decline as imports are replaced by firms which set up behind the high tariff barriers, and which typically import many of their inputs over zero or low tariffs. This was a major problem for Sri Lanka’s public finances prior to the 1977/78 reforms (see Athukorala and Rajapatirana 2000, ch. 3), and there is a serious danger that the same problem could re-emerge unless the present protective trade policies are reversed.
32 Because of the sensitivity of domestic food prices, the long run political sustainability of these policies is questionable. For discussions of this issue and more generally of long run trends in Sri Lanka’s agricultural trade policies see Bandara and Jayasuria (2009) and Gulati and Pursell (2009). 33 Jayasuria and Weerakoon (2002) have pointed out that FDI induced by Sri Lanka’s regional PTAs may be welfare enhancing, but this assumes that the foreign firms’ sales in the domestic market are not heavily protected.

Garry Pursell and F.M. Ziaul Ahsan
20 ASARC WP 2011/03
9. Sri Lanka’s use of para-tariffs: implications for its PTA partner countries and for the WTO
As noted in section 5, one major reason for Sri Lanka’s use of para-tariffs rather than Customs duties to increase or at least maintain existing protection levels, has been to bypass the various PTAs which require tariffs (understood to include only Customs duties) on products which are the subject of “concessions”, to go down by agreed “preference margins” from MFN tariffs, eventually to zero. Using para-tariffs in this way clearly breaches the spirit of all these agreements, but is formally consistent with ILFTA and probably with SAFTA. However it appears to formally breach both PSFTA and APTA.
As regards the bilateral agreement with India (ILFTA), Art II defines “tariffs” as CDs only and does not mention para-tariffs, so India would have no formal reason for objecting to Sri Lanka’s use of them. In addition Sri Lanka could possibly use ILFTA’s safeguards provision (Art VIII) and/or the balance of payments provision (Art X) to justify its para-tariffs, by arguing that it uses them to avoid ” injury” to local industries and to manage its balance of payments deficit. But the para-tariffs are clearly inconsistent with the broad objectives of ILFTA as set out in Art I.
Unlike ILFTA, the SAFTA agreement defines para-tariffs (Art 1(6)), provides that “concessions” made under the agreement can in principle include para-tariffs, and has as a basic objective “the elimination of tariffs, para-tariffs, and any other equivalent measures” (Art 3 (d)). However the various lists of concessions actually made under SAFTA including Sri Lanka’s, cover only Customs duties: none of them include para-tariffs. Art 7 (4) requires that NTBs and para-tariffs should be notified each year to a SAARC “Committee of Experts”, but other than a requirement that they be examined by the Committee to see whether they are compatible with WTO provisions, and the possibility of “recommending” their elimination, it seems that SAFTA provides no effective formal constraint on their use by Sri Lanka or any of the other SAFTA members.
However Sri Lanka’s para-tariffs are clearly contrary to not just the spirit but also the text of the bilateral agreement with Pakistan (PSFTA), signed in 2002. This agreement (1) defines para-tariffs (Art II (2)) (2) states that the objective of the agreement (Art III) is the “elimination of tariffs, para-tariffs and non-tariff barriers” (3) agrees “not to make any increase in the existing para tariffs ...or introduce new additional para-tariffs , without mutual consent” , and (4) implies (in Art III (2) ) that all NTBs and “any other equivalent measure on the movement of goods and services “ is to be eliminated from the date of entry into force of the agreement i.e. on June 12, 2003. Thus Pakistan has had many reasons to object to the para-tariff imposed on its exports by Sri Lanka: but has it? On its side, when Pakistan introduced a set of para-tariffs (called Regulatory Duties) in 2008, it only applied them to imports from MFN sources and explicitly excluded its PTA partner countries, including Sri Lanka.
Like SAFTA, APTA treats “border charges and fees” which have “a tariff-like effect” (i.e. para-tariffs) separately from tariffs, and provides that concessions can be made on these. Art 9 states that signatories agree to maintain the value of the concessions they make and agree not to “abrogate or reduce the value of ...concessions by any charge or measure ...other than those existing before the entry into force of the agreement”. If this condition is breached Art 10 deals with procedures to re-establish the agreed preference margins. It seems that no APTA members — certainly not Sri Lanka — have actually given separate concessions on para-tariffs, but Art 9 prohibits para-tariffs being used to annul or reduce any kind of concession, including concessions on CDs. In that case at least some of Sri Lanka’s para-

Sri Lanka’s Trade Policies: Back to Protectionism
ASARC WP 2011/03 21
tariffs breach Art 9, by annulling or offsetting its CD concessions, unless the para-tariffs existed before APTA was signed in 2007.34
As far as we know, none of Sri Lanka’s PTA partners have so far formally objected to Sri Lanka’s use of para-tariffs, even though they are yet another setback to many years of efforts to free up regional trade, especially trade between the South Asian countries. One possible reason is that, starting on a large scale well before Sri Lanka , in about 1997, Bangladesh has routinely used para-tariffs as flexible, discretionary and non-transparent instruments for providing extra protection to selected industries.35 A second reason is probably that from India’s perspective the two affected export markets — Bangladesh and Sri Lanka — are too small to warrant much negotiating effort. This is also very likely the attitude of China and Korea in APTA.
However the now well documented unconstrained misuse of para-tariffs by Bangladesh and Sri Lanka does illustrate the importance of dealing effectively with this long-standing issue at the WTO. If a large scale misuse on the Bangladesh and Sri Lankan pattern were to spread to many countries, tariff bindings and therefore the entire GATT/WTO process would be meaningless.36
Para-tariffs (known as “Other Duties and Charges” (ODCs) in WTO terminology) were recognised as a problem from the beginning of the GATT in 1947.37 Art II: 1(b) of the GATT says that when a product is subject to a “concession” (meaning a binding setting a maximum Customs duty), it will also be exempt from “all other duties or charges....in excess of those imposed on the date of this agreement”. ODCs were understood to mean duties and charges that discriminate against imports, and in order to implement the agreement GATT signatories were supposed to list the ODCs in force at the time of the bindings made during the various GATT negotiations. In practice, however, very few countries provided ODC lists.
To deal with this lack of transparency, during the Uruguay Round an “Understanding on the Interpretation of Article II:1(b) “ was reached, under which WTO members agreed to list in their UR schedules ODCs existing on April 15 1994. We have checked the WTO website for Sri Lanka’s commitments on ODCs, but none of the principal schedules listing products with tariff bindings mention any commitments on ODCs. The only exception is a list of products with modified bindings under Art XXVIII dated May 2006. 21 of the products on this list (which includes both agricultural and non-agricultural products) give 10% in the ODC column.
Sri Lanka has bound only about a quarter of its non-agricultural tariff lines, so there is no effective WTO constraint on the level either of Customs duties or para-tariffs of the other three quarters. However as discussed in this paper, after allowing for the extra protection provided by large numbers of para-tariffs, the unweighted average industrial-product TPR is more than double the corresponding average CD rate, and more to the point, the TPRs are widely distributed with many in excess of 50% (Fig 15). As the average of Sri Lanka’s bound industrial tariffs is just 21.1%, we think it highly likely that a careful look would show that many applied industrial TPRs exceed their bound levels. This is unambiguously the case in 34 A random check of two products on which Sri Lanka has given APTA preferences indicates that the total protective effect of three para-tariffs (PAL, SUR and Cess) had drastically increased the (preferential) TPRs on these products and had reduced the percentage margin of preference. 35 Bangladesh’s para-tariffs are discussed in Daly, Khan and Oshikawa (2001) and World Bank (2004) Vol II. We understand that they were still being extensively used during 2010 (personal communication from Zaidi Sattar, Policy Research Institute of Bangladesh). 36 For some suggestions on how this problem might be handled at the WTO see Sen (2010). 37 This background is discussed by Friedheim (1999), who points out (p.88) that “A tariff binding would be meaningless if other charges on imports could be varied at will”.

Garry Pursell and F.M. Ziaul Ahsan
22 ASARC WP 2011/03
agriculture, where nearly all of Sri Lanka’s tariff lines are bound at 50%. According to our estimates (Section 5 above and Fig 14) during 2009 up to early June 2010 almost half (46%) of applied agricultural TPRs exceeded 50%, and about 40% were within a range of 70% to 80%. For reasons discussed previously, we do not believe that the import policy changes made during and after June 2010 will have greatly changed this situation.
The WTO’s periodic Trade Policy Review reports on the trade policies of individual member countries are intended to provide independent, objective and detailed descriptions of the current state of, and recent trends in, these policies, and the extent to which the country is compliant with the various GATT/WTO agreements. Based on these detailed description and analyses, the reports are also supposed to provide summary assessments on trends in the overall protectiveness and transparency of the country’s trade regime. The most recent Trade Policy Review report on Sri Lanka (WTO 2010) was published on November 30, 2010 after we had completed and written up most of the analysis of this paper. Chapter III, section (iv) of the WTO review includes a very detailed description and analysis of Sri Lanka’s many ODCs, and also (Table III.8) useful but hard-to-interpret calculations (done by the Sri Lankan Customs department) of the resulting average “Total duty rates” over all tariff lines and disaggregated by product groups, sectors and processing stages. The average “Total duty rates” are similar to but slightly higher than our TPRs. For example:
Our estimates
(average Total Protective Rate) % of cif WTO report estimates (average “Total
duty rate”) % of cif Agriculture (HS 01-24) 49.6 52.2
Industry (HS 25-97) 24.1 27.4
All tariff lines 27.9 31.0
The main reason for these differences is that whereas our estimates include Customs duties and four import taxes that we have treated as protective para-tariffs (see Table 3), the WTO estimates include Customs duties and all eight import taxes except the VAT. Another reason is that the WTO estimates exclude specific-only import taxes, of which there are a large number, especially among the Cesses.
The way the WTO report defines “Total duty rates” by excluding one non-protective import tax (the VAT) but aggregating CDs with four protective import taxes and three import taxes that are probably non-protective, blurs a very important distinction. In our view it is symptomatic of a serious and quite general failure of the report to recognise and confront Sri Lanka’s use of para-tariffs to vastly increase both the average level and dispersion of total protection rates. One result of this failure is that much of the report’s long and detailed discussion and quantification of CDs and their structure is irrelevant, since as we have shown in our paper, CDs account for less than half the protection actually available. This failure to acknowledge and allow for the para-tariff “elephant in the room” is especially apparent in the executive summary. This opens with the statement that “Sri Lanka has a fairly open and transparent trade regime, characterized by ...in general, relatively low tariffs”, and downplays the impact of “import surcharges and other charges” because “they have been taken mostly for revenue purposes” (WTO 2010, Summary p.vii). As discussed in this paper, in our opinion the Sri Lankan trade regime is neither open nor transparent, after allowing for para-tariffs the protection available is very high, and the principal reason for the large scale us of para-tariffs is not revenue generation, but to provide a protection-increasing instrument which the government hopes will pass under the radar of Sri Lanka’s PTA partners and the WTO. It is disappointing that this strategy so far appears to be succeeding, especially as regards the WTO.

Sri Lanka’s Trade Policies: Back to Protectionism
ASARC WP 2011/03 23
References Anderson, J. & P. Neary (1994), “Measuring trade restrictiveness of trade policy”, World
Bank Economic Review 8(1), 151-169. Athukorala, P-C. (2007). “Outward-Oriented Policy Reforms and Industrialisation in Sri Lanka”.
Economic Papers 26(4), 372-391 December. Athukorala, P-C. & S. Rajapatirana (2000). Liberalization and Industrial Transformation: Sri Lanka
in International Perspective. Oxford University Press. New Delhi. Athukorala, P-C., and S. Jayasuriya (2004). “Complementarity of Trade and FDI Liberalisation in
Industrial Growth: Lessons from Sri Lanka”. ASARC Working Paper 2004-10. Bandara, J. & S.Jayasuriya (2007). Sri Lanka. Chapter 11 of K. Anderson & W. Martin (eds)
Distortions to Agricultural Incentives in Asia.TheWorld Bank. Cuthbertson, A.G. & P-C. Athukorala (1991). ‘Sri Lanka’, in D. Papageorgiou, M. Michaely & A.M.
Choksi, Liberalizing Foreign Trade: The Experience of Indonesia,Pakistan and Sri Lanka, Vol 5, Basil Blackwell,Cambridge.
Cuthbertson, S. (2003). Tariff and trade policy framework for Sri Lanka in 2003. Paper prepared for National Seminar, Colombo, July 2003. Draft report prepared for Economic and Social Commission for Asia and the Pacific (ESCAP).
Daly, M., M.A. Khan & M. Oshikawa (2001). “Tariff and Non-Tariff Barriers to Trade and Economic Development in Bangladesh”. Journal of World Trade 35(2): 253-273.
Edwards,C. (1993). Protectionism and Trade Policy in Manufacturing and Agriculture. Sri Lanka.Report Prepared for submission to the World Bank and the Presidential Tariff Commission, Sri Lanka.
Friedheim, T. (1999). “Domestic Taxes and Administrative and Technical Barriers to Trade in Goods and Services”. Chapter 8 of B. Blarel, G. Pursell & A. Valdes (eds), Implications of the Uruguay Round for South Asia: the Case of Agriculture. Allied Publishers, New Delhi,for the World Bank.
Government of India, Ministry of Commerce and Industry, Directorate General of Foreign Trade, Export-Import Data Bank. At http://dgft.delhi.nic.in
Government of Sri Lanka, Department of Census and Statistics. National Accounts of Sri Lanka (various years).
Gulati, A. & Pursell G. (2009). “India and Other South Asian Countries”. Chapter 10 of Kym Anderson (ed.), Distortions to Agricultural Incentives: A Global Perspective. The World Bank.
Gunatilleke, G. (1994). “Sri Lanka”. Chapter 6 of S.P. Gupta, W.E. James & R.K. McCleary (eds) South Asia as a Dynamic Partner. Macmillan India.
Jayasuriya, S. & Weerakoon, D. (2002). “Foreign Direct Investment and Economic Integration in the SAARC Region”. Chapter 8 of T.N. Srinivasan (ed.) Trade, Finance and Investment in South Asia. Social Science Press, New Delhi.
Pursell, G. (2007). “Pakistan-India Trade: Impact on the Textile Sector”. Chapter 7 of Z.F. Naqvi & P. Schuler (eds), The Challenges and Potential of Pakistan-India Trade. The World Bank.
Pursell, G. (2010). “Trade Policies in South Asia”, in R. Jha (ed.), Routledge Handbook of South Asian Economics (forthcoming 2011).
Rupesinghe, K. (1984). Export Oriented industrialisation and its consequences on welfare in Sri Lanka. Third World Seminar Publications, Universitetet i Oslo.
Sen, A. (2010). “The World Trade Organisation and Preferential Agreements”. Economic and Political Weekly, July 10, 2010. Vol XLV No 28.
USTR (2006 and subsequent years). Annual Reports on Foreign Trade Barriers. Published at <ustraderep.gov>
World Bank (2004), Trade Policies in South Asia: An Overview, Report No. 29949, in three volumes, Washington DC, September.
World Bank (2008). Country Assistance Strategy for Sri Lanka. Report No. 43471-LK. May. WTO (1995) Trade Policy Review Report on Sri Lanka. 1995. WTO (2004).Trade Policy Review Report on Sri Lanka. 2004. WTO (2010). Trade Policy Review Report on Sri Lanka. 2010.

Garry Pursell and F.M. Ziaul Ahsan
24 ASARC WP 2011/03
Table 1
Percent annual average growth rates of exports, imports and net private transfers for four periods between 1976 and 2009. In constant 2008 $US: deflator the World Bank MUV index
Total exports Total imports Total exports
+ imports Industrial exports
Net private transfers
(mainly worker remittances)
1976-84 4.3 12.5 8.8 19.7 57.7
1984-89 -4.4 -3.1 -3.6 2.9 -2.4
1989-2000 12.1 10.8 11.4 16 10.6
2000-2009 2.9 5.5 4.4 2.6 10.9
Table 2 Sri Lanka: ad valorem customs duty rates % for selected dates between 1995 and 2010
Feb 1995 1999 Nov 2002 Jan 2004 2009 Jun 2010
0 0 0 0 0 0 2.5 2.5 5 5 5 6 6
10 10 10 12 15 15 15
20 20 20 25 27.5 28 30 30
35 35
Number of normal CD rates
4 6 7 6 5 4 Above normal CD rates %
50 75 75 75 75 75 75 100 100 100 100 100 100 126
Unweighted average CD
20 n.a. 9.6 11.25 12.1 11.5
Notes: Refers to ad valorem MFN customs duties only. Excludes ad valorem component of alternative specific duties. Does not allow for duty waivers and exemptions.
Sources: WTO (1995), WTO (2004), World Bank 2004, WTO (2010), authors' calculations. The "above normal" CDs are for alcoholic drinks and tobacco products except in 1995 when they were also applied to selected vehicles.

Table 3
List of import taxes in force during 2009 until June 2010
Abbreviation % coverage Nominal Tax base Specific taxesof tariff lines rates % % of tariff lines
Protective taxesCustoms duty CD 88.3 0, 2.5,6,15, or 28 Cif price 4.0Ports and airports development levy PAL 99.4 2 or 5 Cif price 0Surcharge SUR 86.1 15 Customs duty 0Commodity export subsidy scheme Cess 39.9 Various Cif price +10% 21.4Regional infrastructure development levy RIDL 1.2 5,7.5 or 10 Cif price & 6 other import taxes 0.2Non-protective (?) taxesValue added tax VAT 91.2 12 or 20 Cif price & 4 other import taxes 0Social Responsibility Levy SRL 100 2 Cif price & 2 other import taxes 0Nation building tax NBT 99.7 3 Cif price & 4 other import taxes 0Excise tax Excise 4.1 Various Cif price +10% & 4 other import taxes 1.3Alternative taxSpecial commodity levy SCL 0.3 Specific only Specific only 0.3
Notes:
(1) There are three exceptional high ad valorem CD rates of 75%, 100%, and 250% applied to tobacco products, alcoholic drinks etc.
(2) The normal PAL tax is 5% : only a few products are taxed at 2%
(3) The normal VAT is 12%. Only a few products are taxed at 20%
(4) The SCL replaces all other import taxes for imports of 22 specified "essential" agricultural products
(5) Most specific duties are "alternative" duties i.e. the higher of an ad valorem rate or a specific amount.
(6) In June 2010 the maximum normal CD was increased to 30%, the SUR was abolished and the Cess coverage was reduced
(7) In November 2010 the RIDL was abolished
(8) In January 2011 the NBT was reduced from 3% to 2%

Table 4 Unweighted averages of MFN import taxes during 2009 to early June 2010 (% of cif)
No of
Non-protective
import taxes Customs
duty
Protective para-tariffs TPR Total
HS lines VAT SRL NBT Excise Sub- total (CD) PAL SUR Cess RIDL
Sub- total
(CD+ para tariffs)
(all import taxes)
Agriculture 972 18.07 0.57 4.80 0.60 24.05 24.56 5.00 3.56 16.43 0.00 24.99 49.55 73.60
Industry 5548 15.92 0.29 4.10 3.22 23.53 9.95 4.94 1.34 7.46 0.37 14.11 24.06 47.58 All tariff lines 6520 16.24 0.33 4.20 2.83 23.60 12.12 4.95 1.67 8.79 0.32 15.73 27.86 51.46
For explanations of the individual import taxes see Table 3. All the import tax rates in this Table are expressed as percentages of the cif price. The TPR (Total Protective Rate) column shows the unweighted averages of the total protection provided to each product by the sum of Customs duties and protective para-tariffs. The Total (all import taxes) column shows the unweighted average of the total of all the import taxes -including the non-protective import taxes-pertaining to each HS tariff line. Where there is an "alternative" CD, Cess or RIDL (i.e. a tariff that is the greater of a specific amount or an ad valorem rate) we have used the ad valorem rate. Where the CD, Cess or RIDL is specific only, we have assumed that it is 30%. See text for a discussion of the treatment of specific import taxes. "Agriculture" is defined as HS 01-24, "Industry" as HS 27-97.
Table 5 Number of tariff lines with specific import taxes during 2009-early June 2010
Agricultural tariff lines Non-agricultural tariff lines All tariff lines Duty Type Alternative
specific Specific Only Total Alternative
specific Specific Only Total Alternative
specific Specific Only Total
Customs Duty (CD) 57 50 107 153 2 155 210 52 262
Cess 350 62 412 493 488 981 843 550 1393
RIDL 0 0 0 0 12 12 0 12 12
Excise Duty (ED) 0 12 12 41 33 74 41 45 86
SCL 0 22 22 0 0 0 0 22 22
At least one specific tax (CD + Cess + RIDL)
399 72 471 621 500 1121 (unique 1109)
1020 572 1592 (unique 1580)
At least one specific tax (CD + Cess + RIDL + ED + SCL)
399 93 492 662 512 1174 (unique 1169)
1061 605 1666 (unique 1661)

Table 6 Estimates of Changes in Protection Provided by Cesses Resulting from Announcements of Changes
to Coverage and Rates During 2009 and 2010
2009 (from
Tariff Guide) June 2010 November
2010
Number of Tariff lines with Cess Average
Tariff lines with Cess Average
Tariff lines with Cess Average
tariff lines Number % of total protection Number % of total protection Number % of total protection
from Cesses from Cesses from Cesses
% of cif % of cif % of cif
Agriculture HS 01-24 972 545 56.1 16.4 563 57.9 17.0 555 57.1 16.4
Industry HS 25-98 5548 2056 37.1 7.5 1311 23.6 5.7 1268 22.9 5.6
All tariff lines HS 01-98 6520 2601 39.9 8.8 1874 28.7 7.4 1823 28.0 7.3
Notes: The estimates for June 2010 and November 2010 assume the same number and distribution of tariff lines given in the 2009 "Tariff Guide". The 2009 "Tariff Guide" was downloaded from the the Customs department website, as were the revised lists of Cesses announced in June 2010 and November 2010. The protection provided by the Cesses has been calculated with respect to the cif price after allowing for the tax base for the Cess which is the cif price plus 10%. Thus the protection provided by a cess with a nominal announced rate of 30% is 30%*1.1=33%. For reasons discussed in the text we have used the ad valorem component of alternative specific Cesses n calculating their protective rate. We have assumed that the ad valorem equivalent nominal protective rate of specific-only Cesses is 30%, so all of these are assumed to have a protective rate with respect to the cif price of 33%. The protection averages are with respect to all tariff lines as listed in the 2009 "Tariff Guide". The averages include tariff lines without a Cess.
Table 7 Unweighted average TPRs on alternative assumptions about the nominal advalorem equivalent of specific-only import taxes
(mainly CDs and Cesses)
All assumed to be 15% nominal All assumed to be 30% nominal
CDs Para-tariffs TPR CDs Para-tariffs TPR
Agriculture 23.8 23.9 47.7 24.6 25.0 49.6
Industry 9.9 12.7 22.6 10.0 14.1 24.1
All tariff lines 12.0 14.3 26.3 12.1 15.7 27.9

Table 8 Sri Lanka November 2002, January 2004, 2009 and Jan 2011: estimated unweighted averages of protection from tariffs and para-tariffs
Nov-02 Jan-04 2009 Jan 2011
Customs Para- Total Customs Para- Total Customs Para- Total Customs Para- Total
duties tariffs protective duties tariffs protective duties tariffs protective duties tariffs protective
rate rate rate rate
Agriculture 21.1 5.2 26.3 24.6 3.5 28.1 24.56 25.0 49.6 25.4 21.4 46.8
Industry 7.6 2.5 10.1 8.8 1.9 10.7 9.95 14.1 24.1 9.1 10.6 19.7
All tariff lines 9.6 2.9 12.5 11.3 2.1 13.4 12.12 15.7 27.9 11.5 12.2 23.7 Notes: All protective rates are pecentages of cif prices. Ports and Airports Development Levy (PAL). Base is cif price. 1% in November 2002 and January 04, 5% in 2009 and January 2011. Tariff surcharge (SUR). Base is Customs duty. 20% in Nov 02, 10% in Jan 04, 15% in 2009. Abolished June 2010. Cess: various rates on cif price +10%. Did not exist in Nov 02 and Jan 04. Includes lare numbers of alternative-specific and specific-only import taxes. Regional Infrastructure Development Levy (RIDL). Base cif price and various other import taxes. Protects some automotive products in HS 87. Did not exist in 2002 and 2004. Abolished November 2010. In 2009 and January 2011 no allowance has been made for the Special Commodity Levy (SCL)-see discussion in the text. For some agricultural products , the VAT was also used as a para-tariff in 2009, but estimates of its protective incidence are not available. Estimates for 2009 include the ad valorem component of alternative -specific customs duties, cesses and RIDL taxes. There were only a few specific-only customs duties in November 02 and January 04: these have not been included . In 2009 all the specific-only taxes are assumed to be 30%, equivalent to 33% of cif prices in the case of specific -only cesses. The estimates for January 2011 are rough approximations only, since the Customs department had not published a revised up to date comprehensi ve "Tariff Guide" to replace the 2009 Tariff Guide. We have used the 2010 WTO TPR report' s estimates of average CDs as of June 2010 (WTO (2010) Table III.2) and have assumed the average protective rates for the PAL was the same as estimated for 2009 (see Table 4). However we have taken account of changes in the tariff line coverage and rates of the Cess (Table 6). As both the SUR and the RIDL had been abolished by January 2011 the para-tariffs column is the sum of the estimated average protection from the PAL and the Cess. As in 2009 all the specific-only taxes are assumed to be 30%, equivalent to 33% of cif prices in the case of specific-only Cesses.
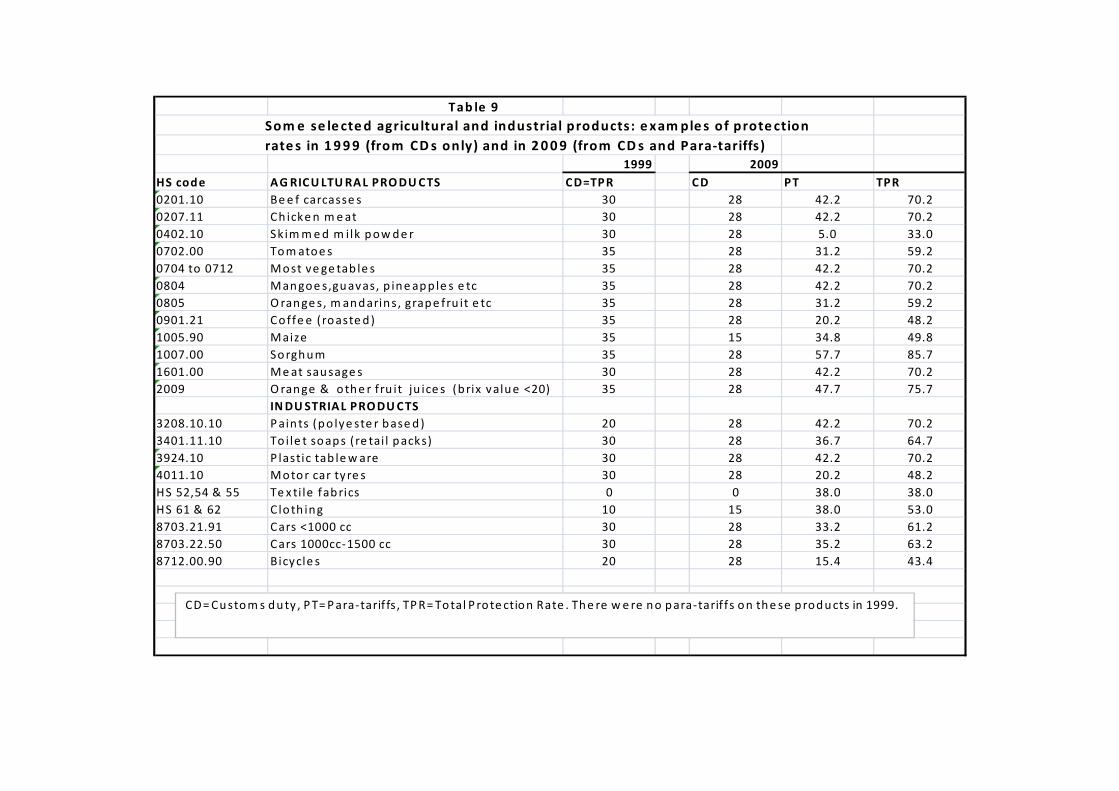
Tab le 9 Som e se le cted agricultural and industrial products: exam ple s of prote ction rate s in 1999 (from CD s only) and in 2009 (from CD s and Para‐tariffs)
1999 2009HS code AGRICULTURAL PRODUCTS CD=TPR CD PT TPR0201.10 Bee f carcasse s 30 28 42.2 70.2
0207.11 Ch icken meat 30 28 42.2 70.2
0402.10 Sk immed m ilk powde r 30 28 5.0 33.0
0702.00 Tomatoe s 35 28 31.2 59.2
0704 to 0712 Most ve ge tab le s 35 28 42.2 70.2
0804 Mangoe s,guavas, p ine app le s e tc 35 28 42.2 70.2
0805 O range s, mandarins, grape fru it e tc 35 28 31.2 59.2
0901.21 Coffe e ( roaste d) 35 28 20.2 48.2
1005.90 Maize 35 15 34.8 49.8
1007.00 Sorghum 35 28 57.7 85.7
1601.00 Meat sausage s 30 28 42.2 70.2
2009 O range & othe r fru it ju ice s (b rix value <20) 35 28 47.7 75.7
INDUSTRIAL PRODUCTS3208.10.10 Pain ts (po lye ste r based) 20 28 42.2 70.2
3401.11.10 To i le t soaps ( re tai l packs) 30 28 36.7 64.7
3924.10 P lastic tab lew are 30 28 42.2 70.2
4011.10 Motor car tyre s 30 28 20.2 48.2
HS 52,54 & 55 Te x ti le fabrics 0 0 38.0 38.0
HS 61 & 62 Cloth ing 10 15 38.0 53.0
8703.21.91 Cars <1000 cc 30 28 33.2 61.2
8703.22.50 Cars 1000cc‐1500 cc 30 28 35.2 63.2
8712.00.90 Bicycle s 20 28 15.4 43.4
CD=Custom s duty , PT=Para‐tarif fs , TPR=Total Prote ction Rate . The re were no para‐tarif fs on the se products in 1999.

Garry Pursell and F.M. Ziaul Ahsan
30 ASARC WP 2011/03
Table 10 Sri Lankan tariff ines with a preference under its PTAs during 2009
Number of tariff lines with a preference Agriculture Industry All lines GSTP 16 75 91 APTA 15 490 505 SAFTA 300 4512 4812 SAFTA LDCs 316 3812 4128 PSFTA 647 4671 5318 ILFTA 155 4443 4598 Total no. of tariff lines 972 5548 6520
Percent of tariff lines with a preference Agriculture Industry All lines GSTP 1.6 1.4 1.4 APTA 1.5 8.8 7.7 SAFTA 30.9 81.3 73.8 SAFTA LDCs 32.5 68.7 63.3 PSFTA 66.6 84.2 81.6 ILFTA 15.9 80.1 70.5
Source: Tariff Guide 2009. The preferences are on Customs duties only. No preferences are given on para-tariffs which are applied at the same rates regardless of the origin of the imports. This table just counts the number of tariff lines on which there is some kind of preference. The amounts of the preferences vary as between tariff lines and preferential trade agreements. "Agriculture" is defined as HS 01-26, "Industry" as HS-27-97
Table 11
Unweighted average protection rates under Sri Lanka's PTAs
Averages TPR: CD Para- TPR Standard tariffs deviation
AGRICULTURE MFN 24.6 25.0 49.5 34.2
GSTP 24.5 25.0 49.5 34.2 APTA 24.5 25.0 49.4 34.2 SAFTA (India and Pakistan) 23.4 24.8 48.3 34.5 SAFTA LDCs (e.g. Bangladesh) 21.2 24.5 45.6 35.8 PSFTA (Pakistan) 15.8 23.7 39.5 34.7 ILFTA (India) 22.2 24.6 46.9 35.6 INDUSTRY MFN 9.9 14.1 24.1 19.9 GSTP 9.9 14.1 24.0 19.8 APTA 9.7 14.1 23.8 19.7 SAFTA (India and Pakistan) 8.6 13.9 22.5 19.1 SAFTA LDCs (e.g. Bangladesh) 5.7 13.6 19.2 18.4 PSFTA (Pakistan) 5.9 13.6 19.5 18.2 ILFTA (India) 3.9 13.3 17.3 18.2 ALL TARIFF LINES MFN 12.1 15.7 27.9 24.4 GSTP 12.1 15.7 27.8 24.3 APTA 11.9 15.7 27.6 24.3 SAFTA (India and Pakistan) 10.8 15.6 26.3 23.9 SAFTA LDCs (e.g. Bangladesh) 8.0 15.2 23.2 23.8 PSFTA (Pakistan) 7.4 15.1 22.5 22.7 ILFTA (India) 6.7 15.0 21.7 24.1
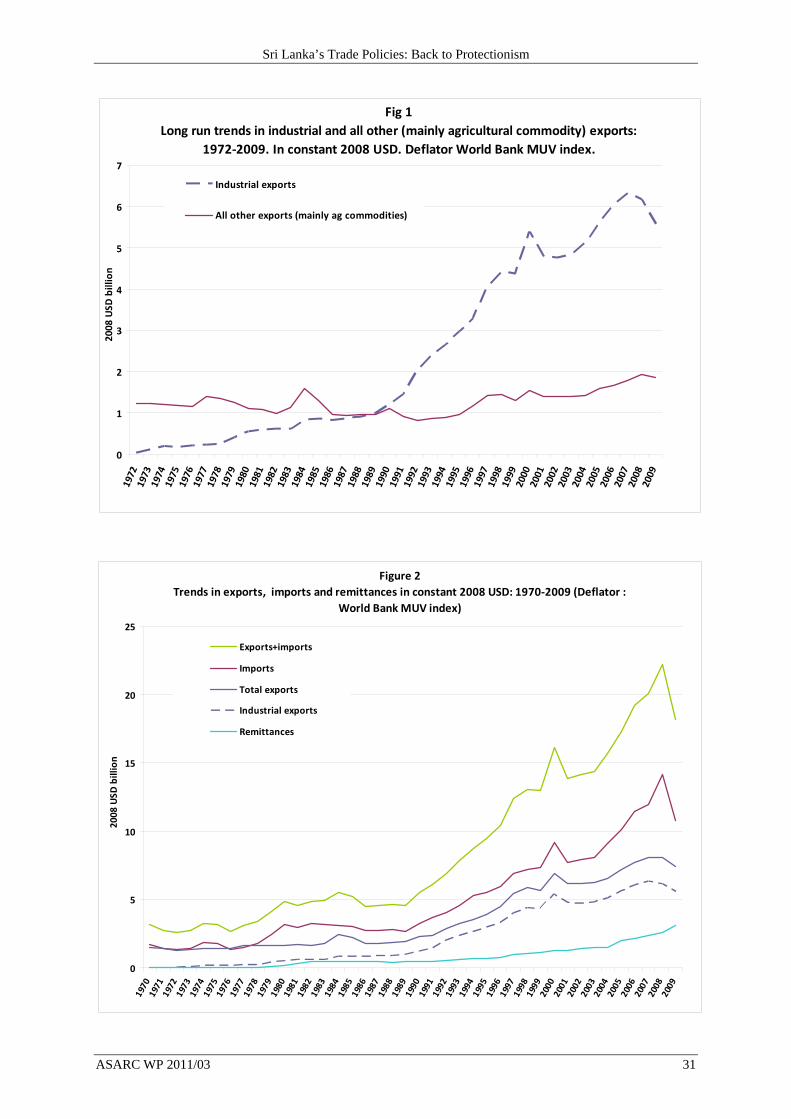
Sri Lanka’s Trade Policies: Back to Protectionism
ASARC WP 2011/03 31
Fig 1Long run trends in industrial and all other (mainly agricultural commodity) exports:
1972‐2009. In constant 2008 USD. Deflator World Bank MUV index.
0
1
2
3
4
5
6
7
1972
1973
1974
1975
1976
1977
1978
1979
1980
1981
1982
1983
1984
1985
1986
1987
1988
1989
1990
1991
1992
1993
1994
1995
1996
1997
1998
1999
2000
2001
2002
2003
2004
2005
2006
2007
2008
2009
2008
USD
billion
Industrial exports
All other exports (mainly ag commodities)
Figure 2Trends in exports, imports and remittances in constant 2008 USD: 1970‐2009 (Deflator :
World Bank MUV index)
0
5
10
15
20
25
1970
1971
1972
1973
1974
1975
1976
1977
1978
1979
1980
1981
1982
1983
1984
1985
1986
1987
1988
1989
1990
1991
1992
1993
1994
1995
1996
1997
1998
1999
2000
2001
2002
2003
2004
2005
2006
2007
2008
2009
2008
USD
billion
Exports+imports
Imports
Total exports
Industrial exports
Remittances

Garry Pursell and F.M. Ziaul Ahsan
32 ASARC WP 2011/03
Fig 3Sri Lanka 1987-2009: percent of tariff lines subject to QRs
0
2
4
6
8
10
12
14
16
1987
1988
1989
1990
1991
1992
1993
1994
1995
1996
1997
1998
1999
2000
2001
2002
2003
2004
2005
2006
2007
2008
2009
% o
f HS li
nes
Sources: 2009 from Sri Lanka's 2009 "Tariff Guide" ; 2004 from the WTO Trade Policy Review report on Sri Lanka for 2004; 1998 and before as reported in World Bank (2004). The trends as shares of HS tariff lines are approximate only, owing to differences in measures included as QRs and changes in HS definitions . HS lines subject to QRs in 2004 and 2009 include import licensing related to health and safety, SPS and technical standards. In particular the licensing requirement for many used/second hand products (e.g. consumer appliances, vehicles, machines) is probably formally justified on health and safety and similar grounds. Most tariff lines listed in Sri Lanka's tariff schedule are at HS 6-digit level, but some are at 8-digit level.
Fig 4Export tax collection rate on non‐industrial exports 1972‐2009
0
5
10
15
20
25
30
35
40
45
50
1972
1973
1974
1975
1976
1977
1978
1979
1980
1981
1982
1983
1984
1985
1986
1987
1988
1989
1990
1991
1992
1993
1994
1995
1996
1997
1998
1999
2000
2001
2002
2003
2004
2005
2006
2007
2008
2009
Percen
t
The principal export taxes were at different rates which varied from year to year on exports of tea, rubber and coconut products. Exports of these products accounted for nearly all non-industrial exports. Export tax revenue from the Central Bank Annual Report (various issues) statistical appendices. The jump in the aggregate rate in 1978 was affected by the 1977-78 Rupee devaluation and changes in export prices.

Sri Lanka’s Trade Policies: Back to Protectionism
ASARC WP 2011/03 33
Fig 5Sri Lanka 1982-Jan 2011: Estimates of unweighted average tariffs over all
tariff lines
0
5
10
15
20
25
30
35
40
45
1982
1983
1984
1985
1986
1987
1988
1989
1990
1991
1992
1993
1994
1995
1996
1997
1998
1999
2000
2001
2002
2003
2004
2005
2006
2007
2008
2009
2010
Jan 2
011
Ave
rage
tari
ff %
Sources: For 2009 authors' estimates using the 2009 "Tariff Guide" published on the Customs department website. Includes para-tariffs assuming that specific-only tariffs and cesses are all 30% (see text). For January 2011 estimate see notes to Table 5. The estimates for 2002 and 2004 are respectively as of November 2002 and January 2004: source World Bank (2004) Vol II Chapter 3. They include para-tariffs and the ad-valorem components of compound tariffs but exclude specific-only Customs duties. The estimates for 1997 and before are as reported in World Bank (2004) : they include customs duties and the ad valorem component of compound tariffs, but not specific-only tariffs and para-tariffs. However before 2004 there were only a few specific tariffs and para-tariffs were much less protective than they became after 2004. Most of the tariffs are at HS 6-digit level, but some are at 8-digit level. When groups of products are defined at 8-digit level, there is no corresponding separate tariff at the 6-digit level.
Fig 6Export orientation of Sri Lankan manufacturing: Indicators 1972‐2009
0
0.25
0.5
0.75
1
1.25
1.5
1.75
2
1972
1973
1974
1975
1976
1977
1978
1979
1980
1981
1982
1983
1984
1985
1986
1987
1988
1989
1990
1991
1992
1993
1994
1995
1996
1997
1998
1999
2000
2001
2002
2003
2004
2005
2006
2007
2008
2009
Manufactured exports/value added inmanufacturingNon‐dutiable imports/total imports

Garry Pursell and F.M. Ziaul Ahsan
34 ASARC WP 2011/03
Fig 7Exports, imports, total trade and remittances as percent of GDP, 1970‐2009
‐10
0
10
20
30
40
50
60
70
80
901970
1971
1972
1973
1974
1975
1976
1977
1978
1979
1980
1981
1982
1983
1984
1985
1986
1987
1988
1989
1990
1991
1992
1993
1994
1995
1996
1997
1998
1999
2000
2001
2002
2003
2004
2005
2006
2007
2008
2009
Percen
t of GDP
(Exports+Imports) as % of GDPImports as % of GDPNon‐POL imports as % of GDPExports as % of GDPIndustrial exports as % of GDPNet remittances as % of GDP
0.6 0.7 1.2 1.2
24.8
0
5
10
15
20
25
30
1998 2001 Mch 2003 Jan 04 2009 to June 2010
Percent of tariff lines
Fig 8Specific CDs and specific para‐tariffs 1998‐2009: Percent
shares of total tariff lines

Sri Lanka’s Trade Policies: Back to Protectionism
ASARC WP 2011/03 35
26.328.1
49.646.8
10.1 10.7
24.1
19.7
12.5 13.4
27.9
23.7
0
10
20
30
40
50
60
Nov 2002
2003 Jan 2004
2005 2006 2007 2008 2009 2010 Jan 2011
Total protective rate %
Fig 9Sri Lanka : unweighted average total protective rates from tariffs and para‐tariffs Nov 2002, Jan 2004, 2009 and Jan
2011
Agricultural tariff lines
Industrial tariff lines
All tariff lines
0 2 0 4 0 6 0 8 0 1 0 0
B e e f c a r c a s s e s 1 9 9 9
B e e f c a r c a s s e s 2 0 0 9
C h i c k e n m e a t 1 9 9 9
C h i c k e n m e a t 2 0 0 9
S k im m e d m i l k p o w d e r 1 9 9 9
S k im m e d m i l k p o w d e r 2 0 0 9
T o m a t o e s 1 9 9 9
T o m a t o e s 2 0 0 9
M o s t v e g e t a b l e s 1 9 9 9
M o s t v e g e t a b l e s 2 0 0 9
T r o p i c a l f r u i t s 1 9 9 9
T r o p i c a l f r u i t s 2 0 0 9
C i t r u s f r u i t s 1 9 9 9
C i t r u s f r u i t s 2 0 0 9
C o f f e e ( r o a s t e d ) 1 9 9 9
C o f f e e ( r o a s t e d ) 2 0 0 9
M a i z e 1 9 9 9
M a i z e 2 0 0 9
S o r g h u m 1 9 9 9
S o r g h u m 2 0 0 9
M e a t s a u s a g e s 1 9 9 9
M e a t s a u s a g e s 2 0 0 9
F r u i t j u i c e s 1 9 9 9
F r u i t j u i c e s 2 0 0 9
P r o t e c t i o n r a t e %
F i g 1 0S e l e c t e d a g r i c u l t u r a l p r o d u c t s : t o t a l p r o t e c t i o n
r a t e s i n 1 9 9 9 a n d 2 0 0 9
C u s t o m s d u t y
P a r a ‐ t a r i f f s

Garry Pursell and F.M. Ziaul Ahsan
36 ASARC WP 2011/03
0 20 40 60 80 100
P ain ts (p o lye ste r base d ) 1 9 9 9
P ain ts (p o lye ste r base d ) 2 0 0 9
To ile t so ap s (r e ta il pac ks) 1 9 9 9
To ile t so ap s (r e ta il pac ks) 2 0 0 9
P lastic tab le ware 1 9 9 9
P lastic tab le ware 2 0 0 9
M o to r c ar ty r e s 1 9 9 9
M o to r c ar ty r e s 2 0 0 9
Te x tile fab r ic s 1 9 9 9
Te x tile fab r ic s 2 0 0 9
C lo th in g 1 9 9 9
C lo th in g 2 0 0 9
Car s < 1 0 0 0 c c 1 9 9 9
Car s < 1 0 0 0 c c 2 0 0 9
Car s 1 0 0 0 c c ‐1 5 0 0 c c 1 9 9 9
Car s 1 0 0 0 c c ‐1 5 0 0 c c 2 0 0 9
B ic yc le s 1 9 9 9
B ic yc le s 2 0 0 9
P ro tec t io n ra te %
F ig 1 1Se le cte d indus tr ia l products : total prote ction rates in
1999 and 2009
C u stom s d u ty
P a ra ‐ta r iffs
1 2 .1 2
1 .6 7
4 .9 5
8 .7 9
0 .3 2
2 7 .8 5
0
5
1 0
1 5
2 0
2 5
3 0
CD SUR PA L C ESS R ID L TO TA L
Protection rate %
F ig 12Sri Lanka 2009 : Contributions of custom s dutie s and
ind iv idual para‐tariffs to ave rage prote ctive rate ove r all tariff line s

Sri Lanka’s Trade Policies: Back to Protectionism
ASARC WP 2011/03 37
24.58
10.27 12.12
24.97
13.7915.73
0
10
20
30
40
50
60
Ag Industry All
Total protective rate %
Fig 13Sri Lanka 2009: Shares of Customs duties and para‐tariffs in average total protective rates
Customs duties Para‐tariffs
0
5
10
15
20
25
30
35
Distribution %
Total protection rate from tariffs and para‐tariffs %
Fig 14Sri Lanka 2009: Agricultural tariff lines. Distribution of total
protection rates from tariffs and para‐tariffs

Garry Pursell and F.M. Ziaul Ahsan
38 ASARC WP 2011/03
0
5
10
15
20
25
30
35
Distribution%
Total protection rate from tariffs and para‐tariffs %
Fig 15Sri Lanka 2009: Industrial tariff lines.Distribution of total
protection rates from tariffs and para‐tariffs
0
5
1 0
1 5
2 0
2 5
3 0
% of total number of HS 8‐digit tariff lines
Total prote ction rate pe rce nt
F ig 16Sr i Lanka 2009 : A ll tar iff line s. D istr ibution of total
prote ction rate s from custom s dutie s and para ‐tar if fs

Sri Lanka’s Trade Policies: Back to Protectionism
ASARC WP 2011/03 39
Fig 17Distribution of extra protection provided by Cesses
to 2601 products in 2009
10.8
0.3
9.5
0.0
15.7
0.7
4.5 4.6 3.9
44.2
5.6
0
5
10
15
20
25
30
35
40
45
50
1.1 2.2 5.5 6.6 11 13.2 16.5 22 27.5 33 38.5
Protection rate %
Percen
t share of tariff lines with a Ce
ss
Fig 18Unweighted average protection rates in 2009 : average CDs, average para‐tariffs, and average TPRs. Comparisons of MFN averages with averages under Sri Lanka's PTAs.
0 5 10 15 20 25 30 35 40 45 50 55
MFNGSTPAPTA
SAFTA (India and Pakistan)SAFTA LDCs (e.g. Bangladesh)
PSFTA (Pakistan)ILFTA (India)
ALL TARIFF LINES
MFNGSTPAPTA
SAFTA (India and Pakistan)SAFTA LDCs (e.g. Bangladesh)
PSFTA (Pakistan)ILFTA (India)
INDUSTRY
MFNGSTPAPTA
SAFTA (India and Pakistan)SAFTA LDCs (e.g. Bangladesh)
PSFTA (Pakistan)ILFTA (India)AGRICULTURE
Protection rate %
Customs duties
Para‐tariffs

Garry Pursell and F.M. Ziaul Ahsan
40 ASARC WP 2011/03
Fig 19 Sri Lanka 2009: Comparisons of unweighted average total protection rates faced by Indian exporters (1) without ILFTA but no para‐tariffs (2) with ILFTA and
para tariffs
24.6
9.912.1
22.2
3.96.7
0
0
0
24.6
13.3
15
0
5
10
15
20
25
30
35
40
45
50
MFN MFN MFN ILFTA ILFTA ILFTA
Ag Ind All Ag Ind All
Protection rates %
Para‐tariffs
Customs duties
0
10
20
30
40
50
60
70
80
90
100
110
120
130
NEER and REER indices 24 countries
Fig 20Sri Lanka NEER and REER Indices Jan 2003-Jly 2010.
(2006=100, increase=devaluation)
REER index
NEER index

Sri Lanka’s Trade Policies: Back to Protectionism
ASARC WP 2011/03 41
Fig 21Protective import taxes 1981‐2009: Collection rate on total
imports and shares in government tax revenue
0
5
10
15
20
25
30
35
40
45
1981
1982
1983
1984
1985
1986
1987
1988
1989
1990
1991
1992
1993
1994
1995
1996
1997
1998
1999
2000
2001
2002
2003
2004
2005
2006
2007
2008
2009
Percen
t
Share % of indirect taxes
Share % of total taxes
% of total imports