sri lanka labour force survey - 2013 · sri lanka labour force survey (lfs) is designed to measure...
TRANSCRIPT

According to the table 1, the esti-
mated economically active popu-
lation was about 8.86 million in
the first Quarter 2013. Of which
64.1 percent were males and 35.9
percent were females. Out of the
economically inactive population
25.2 percent were males and 74.8
percent were females (Table 2) . Table 1 : Economically active population by gender - First quarter 2013
Sri Lanka Labour Force Survey - 2013
Highlights
Department of Census and Statistics Ministry of Finance and Planning, Sri Lanka
Labour Force ... (Economically Active Population)
Sri Lanka Labour Force Survey (LFS) is designed to measure
the levels and trends of employment, unemployment and
labour force in Sri Lanka. LFS is being conducted quarterly,
since the first quarter of 1990.
The field work of the survey for the first quarter of 2013 was
done in January, February and March covering the whole
island
Number of persons (age 15 &
above) who were employed or
unemployed during the refer-
ence week
Labour force expressed as a
percentage of population age
15 year and over
Labour Force ...
(Economically Active Population)
For the first time of LFS history, Considered age group was 15 years and above for the
working age population
Introduced new occupation and industry classifications
(SLSCO 2008 and SLSIC Rev.4)
Inside
Labour force participation
rate (LFPR) ...
Table 2 : Economically inactive population by gender - First quarter 2013
Labour Force 1
Employment 2
Unemployment 3
Selected Labour
Force Indicators
4
1st Quarter - 2013
ISSN 1391- 3050 Issue No.60
Table 3 : LFPR by gender and year (Excluding Northern province.)
Referring the table 3, It is
important to note that,
male participation to the
labour force was almost
twice as that of females.
Table 3 provides the information
on LFPRs since year 2008.
Figure 1 : Distribution of Economically
active/Inactive population-
First quarter 2013
64%
36%
25%
75%
Male Female
Economically ActiveEconomically Inactive
Sector Economically active population
Total % Male % Female %
Sri Lanka 8,861,919 100.0 5,683,067 64.1 3,178,852 35.9
Urban 1,399,832 100.0 962,828 68.8 437,004 31.2
Rural 7,096,526 100.0 4,512,589 63.6 2,583,936 36.4
Estate 365,561 100.0 207,649 56.8 157,912 43.2
Sector Economically inactive population
Total % Male % Female %
Sri Lanka 7,494,262 100.0 1,888,595 25.2 5,605,667 74.8
Urban 1,525,170 100.0 413,719 27.1 1,111,451 72.9
Rural 5,723,157 100.0 1,394,254 24.4 4,328,902 75.6
Estate 245,936 100.0 80,621 32.8 165,314 67.2
Table4 : LFPR by age group and gender -First quarter 2013
Age group
(Years) Total Male
Fe-
male
Sri Lanka 54.2 75.1 36.2
15 - 19 17.2 23.5 10.9
20 - 24 56.1 74.7 40.6
25 - 29 66.1 93.5 43.2
30 - 34 66.9 95.2 42.8
35 - 39 70.4 97.3 46.9
40 - 44 73.4 96.5 53.5
45 - 49 69.9 94.4 49.8
50 - 54 67.5 92.2 46.0
55 - 59 59.9 82.4 38.8
60+ 29.7 46.2 16.3
Year Total Male Female
2008 55.1 76.1 36.6
2009 54.1 74.7 36.2
2010 53.4 75.0 34.4
2011 53.4 74.2 35.0
2012 53.0 75.2 33.5
2013 Q1 54.6 75.0 37.0 Considering the table 4, the distribution of LFPR by age
group and by gender depicts more male participation com-
pared to female in all age groups. Highest rate for male was
reported from age group 35-39 years, while that of females
was reported from the age group of 40– 44 years.
Labour force participa-
tion rate is 54.6% for
the first three month of
2013
Most of the employees
have recorded from
non-agriculture sector.
Unemployment rate for
the study period is
4.6%.
2
Employment ... Employed ...
During the reference pe-
riod, persons, who
worked as paid employ-
ees, employers, own ac-
count workers (self em-
ployed), or contributing
family workers are said
to be employed.
This includes persons
with a job but not at
work during the refer-
ence period
Reference Period : Previous
week of the survey week
According to the
table 6, more em-
ployers were in
non-agriculture
sector than in
agriculture sector.
But contributing
family workers
were highly con-
centrated in agri-
culture sector.
Employment
Status
Sri Lanka Sector
Agriculture Non-Agriculture
No. % No. % No. %
Sri Lanka 8,451,187 100.0 2,384,795 28.2 6,066,392 71.8
Employee 4,749,815 100.0 689,346 14.5 4,060,470 85.5
Public 1,308,136 100.0 90,000 6.9 1,218,136 93.1
Private 3,441,679 100.0 599,345 17.4 2,842,334 82.6
Employer 268,847 100.0 25,463 9.5 243,384 90.5
Own Account
Worker 2,637,198 100.0 1,143,087 43.3 1,494,111 56.7
Contributing
Family Worker 795,327 100.0 526,899 66.2 268,428 33.8
Table 5 shows the percentage distribution of employed
population by main industry from second quarter 2012 to
first quarter 2013. The total number of employed persons in
Sri Lanka was estimated as about 8.5 million in first quar-
ter 2013. Of which, about 44.9 percent engaged in services
sector, 28.2 percent in agriculture sector, and 26.9 percent
in Industries sector.
Table 6 : Percentage distribution of employed population by employment status and
Agriculture/ Non- Agriculture sector – First Quarter 2013
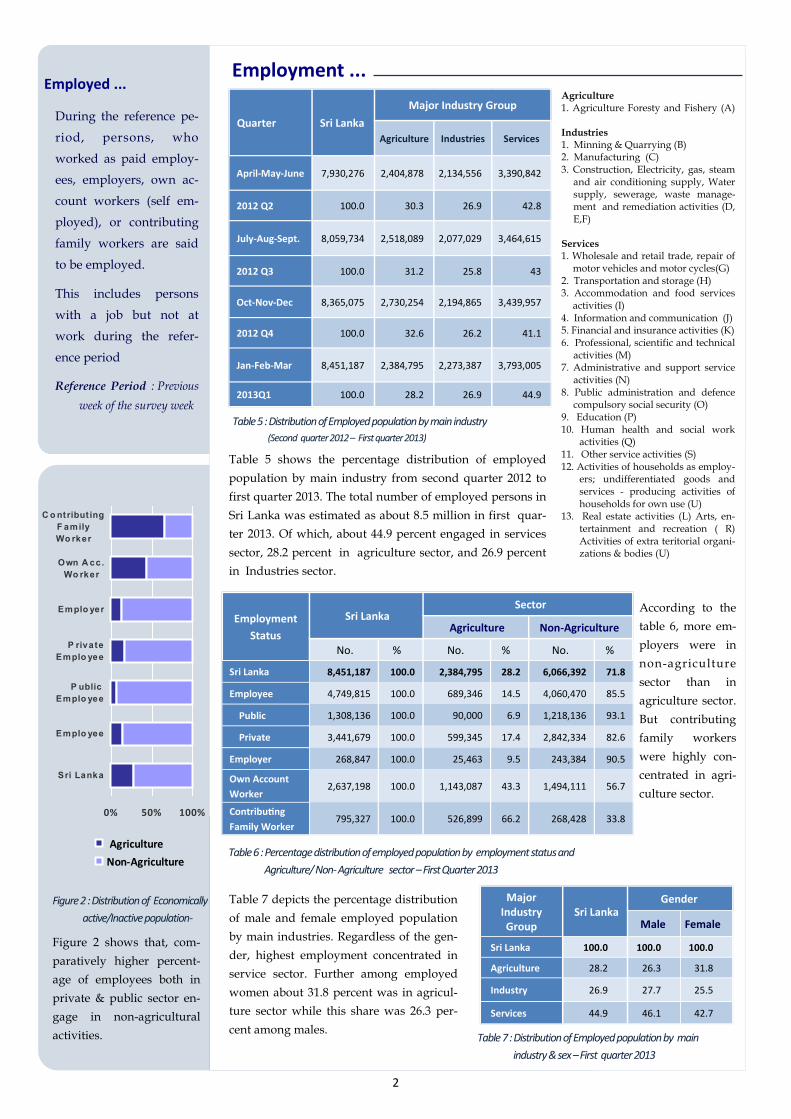
Figure 2 : Distribution of Economically
active/Inactive population-
Figure 2 shows that, com-
paratively higher percent-
age of employees both in
private & public sector en-
gage in non-agricultural
activities.
Major Industry Group
Sri Lanka Gender
Male Female
Sri Lanka 100.0 100.0 100.0
Agriculture 28.2 26.3 31.8
Industry 26.9 27.7 25.5
Services 44.9 46.1 42.7
Table 7 : Distribution of Employed population by main
industry & sex – First quarter 2013
Table 7 depicts the percentage distribution
of male and female employed population
by main industries. Regardless of the gen-
der, highest employment concentrated in
service sector. Further among employed
women about 31.8 percent was in agricul-
ture sector while this share was 26.3 per-
cent among males.
Table 5 : Distribution of Employed population by main industry
(Second quarter 2012 – First quarter 2013)
Quarter Sri Lanka
Major Industry Group
Agriculture Industries Services
April-May-June 7,930,276 2,404,878 2,134,556 3,390,842
2012 Q2 100.0 30.3 26.9 42.8
July-Aug-Sept. 8,059,734 2,518,089 2,077,029 3,464,615
2012 Q3 100.0 31.2 25.8 43
Oct-Nov-Dec 8,365,075 2,730,254 2,194,865 3,439,957
2012 Q4 100.0 32.6 26.2 41.1
Jan-Feb-Mar 8,451,187 2,384,795 2,273,387 3,793,005
2013Q1 100.0 28.2 26.9 44.9
Agriculture 1. Agriculture Foresty and Fishery (A) Industries 1. Minning & Quarrying (B) 2. Manufacturing (C) 3. Construction, Electricity, gas, steam
and air conditioning supply, Water supply, sewerage, waste manage-ment and remediation activities (D, E,F)
Services 1. Wholesale and retail trade, repair of
motor vehicles and motor cycles(G) 2. Transportation and storage (H) 3. Accommodation and food services
activities (I) 4. Information and communication (J) 5. Financial and insurance activities (K) 6. Professional, scientific and technical
activities (M) 7. Administrative and support service
activities (N) 8. Public administration and defence
compulsory social security (O) 9. Education (P) 10. Human health and social work
activities (Q) 11. Other service activities (S) 12. Activities of households as employ-
ers; undifferentiated goods and services - producing activities of households for own use (U)
13. Real estate activities (L) Arts, en-tertainment and recreation ( R) Activities of extra teritorial organi-zations & bodies (U)
0% 50% 100%
Sri Lanka
Emplo yee
P ublic
Emplo yee
P rivate
Emplo yee
Emplo yer
Own A cc.
Wo rker
C o ntribut ing
F amily
Wo rker
Agriculture
Non-Agriculture
3
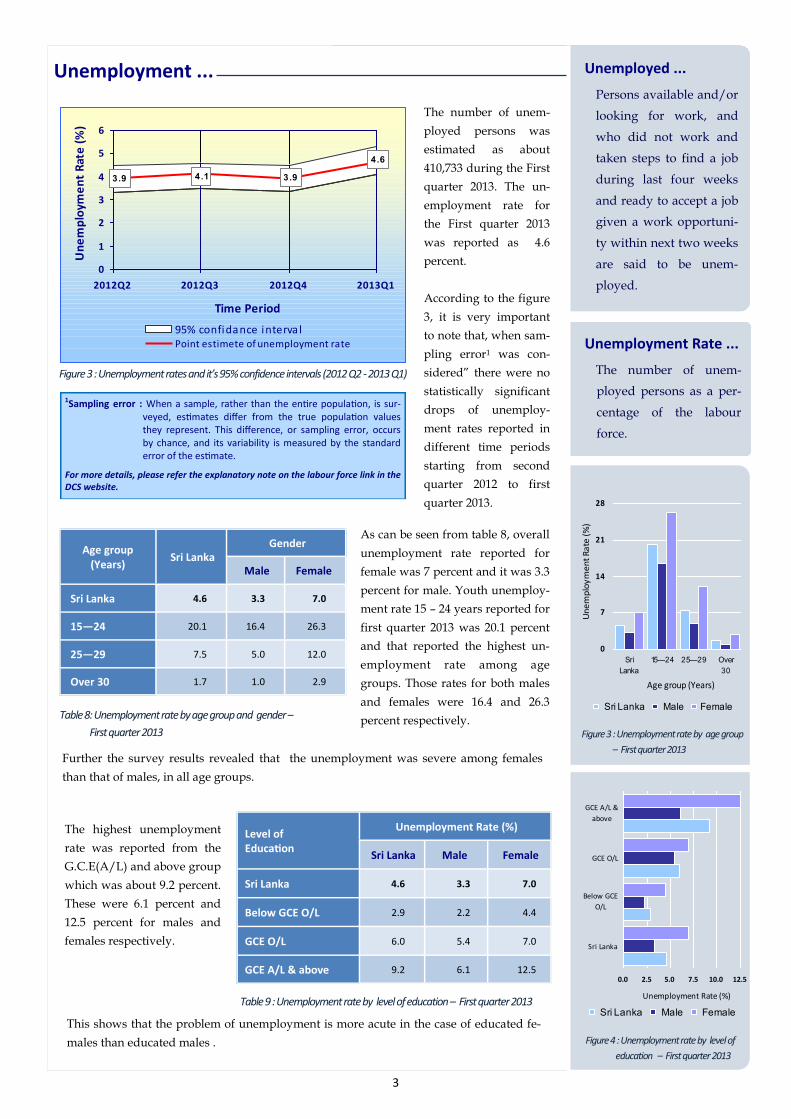
Figure 3 : Unemployment rates and it’s 95% confidence intervals (2012 Q2 - 2013 Q1)
Unemployment ... Unemployed ...
Persons available and/or
looking for work, and
who did not work and
taken steps to find a job
during last four weeks
and ready to accept a job
given a work opportuni-
ty within next two weeks
are said to be unem-
ployed.
Unemployment Rate ...
The number of unem-
ployed persons as a per-
centage of the labour
force.
The number of unem-
ployed persons was
estimated as about
410,733 during the First
quarter 2013. The un-
employment rate for
the First quarter 2013
was reported as 4.6
percent.
According to the figure
3, it is very important
to note that, when sam-
pling error1 was con-
sidered” there were no
statistically significant
drops of unemploy-
ment rates reported in
different time periods
starting from second
quarter 2012 to first
quarter 2013.
Age group (Years)
Sri Lanka Gender
Male Female
Sri Lanka 4.6 3.3 7.0
15—24 20.1 16.4 26.3
25—29 7.5 5.0 12.0
Over 30 1.7 1.0 2.9
Table 8: Unemployment rate by age group and gender –
First quarter 2013
Level of Education
Unemployment Rate (%)
Sri Lanka Male Female
Sri Lanka 4.6 3.3 7.0
Below GCE O/L 2.9 2.2 4.4
GCE O/L 6.0 5.4 7.0
GCE A/L & above 9.2 6.1 12.5
Table 9 : Unemployment rate by level of education – First quarter 2013
This shows that the problem of unemployment is more acute in the case of educated fe-
males than educated males .
As can be seen from table 8, overall
unemployment rate reported for
female was 7 percent and it was 3.3
percent for male. Youth unemploy-
ment rate 15 – 24 years reported for
first quarter 2013 was 20.1 percent
and that reported the highest un-
employment rate among age
groups. Those rates for both males
and females were 16.4 and 26.3
percent respectively.
Figure 4 : Unemployment rate by level of
education – First quarter 2013
1Sampling error : When a sample, rather than the entire population, is sur-veyed, estimates differ from the true population values they represent. This difference, or sampling error, occurs by chance, and its variability is measured by the standard error of the estimate.
For more details, please refer the explanatory note on the labour force link in the DCS website.
0.0 2.5 5.0 7.5 10.0 12.5
Sri Lanka
Below GCE
O/L
GCE O/L
GCE A/L &
above
Unemployment Rate (%)
Sri Lanka Male Female
0
7
14
21
28
Sri
Lanka
15—24 25—29 Over
30
Age group (Years)
Un
em
plo
ym
en
t R
ate
(%
)
Sri Lanka Male Female
Figure 3 : Unemployment rate by age group
– First quarter 2013
3.9 4.1 3.9
4.6
0
1
2
3
4
5
6
2012Q2 2012Q3 2012Q4 2013Q1
Time Period
Un
em
plo
yme
nt
Rat
e (
%)
95% confidance interva lPoint estimete of unemployment rate
Further the survey results revealed that the unemployment was severe among females
than that of males, in all age groups.
The highest unemployment
rate was reported from the
G.C.E(A/L) and above group
which was about 9.2 percent.
These were 6.1 percent and
12.5 percent for males and
females respectively.

4
Department of Census and
Statistics
Sri Lanka
4th and 5th Floors,
Rotunda Tower,
109, Galle Road, Colombo 03.
Sri Lanka
Sample Surveys Division
8th floor,
Unity plaza building,
Colombo 04, Sri Lanka
Phone: 011-2508689
Fax: 011-2508690
E-mail:
Vision of the DCS
“To be the leader in the
region in producing
timely statistical infor-
mation to achieve the
country’s development
goals.”
Mission of the DCS
“Making contribution
in the socioeconomic
development of the
country by providing
accurate timely
statistics, more
effectively by means of
new technology, and
utilizing the services of
dedicated staff under a
strategic leadership to
become a prosperous
nation in the globalized
environment.”
Selected Labour Force Indicators …
# has a job but not at work during the reference week
* Excluding Northern Province
**Whole island covered
Indicator Year
2008* 2009* 2010* 2011* 2012* 2011** 2012** 2013Q1**
Labour force participation rate
By Gender
Total 55.1 54.1 53.4 53.4 53.0 53.0 52.6 54.2
Male 76.1 74.7 75.0 74.2 75.2 74.0 75.0 75.1
Female 36.6 36.2 34.4 35.0 33.5 34.4 32.9 36.2
By residential sector
Total 55.1 54.1 53.4 53.4 53.0 53.0 52.6 54.2
Urban 50.8 48.4 46.8 48.5 48.7 47.8 48.4 47.9
Rural 55.7 54.9 54.4 54.2 53.9 53.8 53.5 55.6
Unemployment Rate
By Gender
Total 5.4 5.9 4.9 4.2 3.9 4.2 4.0 4.6
Male 3.7 4.3 3.5 2.7 2.9 2.7 2.8 3.3
Female 8.4 8.6 7.7 6.8 6.0 7.0 6.2 7.0
By selected age Group (Year)
20 – 29 13.7 15.4 13.8 12.4 11.1 12.3 11.3 13.6
20 – 24 18.1 21.4 19.1 18.0 16.7 17.7 16.8 20.7
25 – 29 9.5 10.3 9.2 7.5 6.5 7.6 6.6 7.5
By selected educational level
GCE A/L and above
Total 10.5 11.2 11.6 9.0 7.3 9.0 7.5 9.2
Male 6.0 7.0 7.8 5.4 4.3 5.4 4.5 6.1
Female 15.3 15.5 15.8 13.1 10.5 13.1 10.8 12.5
Employed population
By Gender
Total 7,628,683 7,579,835 7,696,142 7,883,817 7,791,831 8,186,305 8,118,362 8,451,187
Male 5,018,954 4,949,825 5,125,763 5,219,712 5,224,743 5,452,723 5,469,759 5,494,375
Female 2,609,729 2,630,010 2,570,379 2,664,105 2,567,089 2,733,582 2,648,603 2,956,812
By industry (Percentage)
Total 7,628,683 7,579,835 7,696,142 7,883,817 7,791,831 8,186,305 8,118,362 8,451,187
% 100.0 100.0 100.0 100.0 100.0 100.0 100.0 100.0
Agriculture 2,474,446 2,459,824 2,512,546 2,593,048 2,412,066 2,699,244 2,513,673 2,384,795
% 32.4 32.5 32.6 32.9 31.0 33.0 31.0 28.2
Industry 2,002,805 1,904,722 1,864,538 1,914,671 2,042,262 1,976,711 2,117,286 2,273,387
% 26.3 25.1 24.2 24.3 26.2 24.1 26.1 26.9
Services 3,151,432 3,215,289 3,319,059 3,376,099 3,337,503 3,510,350 3,487,403 3,793,005
% 41.3 42.4 43.1 42.8 42.8 42.9 43.0 44.9
By no. of hours worked per week (percentage)
Total 100.0 100.0 100.0 100.0 100.0 100.0 100.0 100.0
0# 7.2 7.9 6.0 5.3 4.6 5.2 4.5 3.1
1 – 9 2.1 2.2 1.7 1.8 1.2 1.7 1.2 1.8
10 – 39 28.9 28.8 28.4 29.7 25.6 29.9 26.0 27.2
40 & above 61.8 61.2 63.9 63.2 68.6 63.1 68.3 67.9