sri lanka labour force survey annual report_2011...vii summary statistics sri lanka labour force...
TRANSCRIPT
i
Sri Lanka Labour Force Survey
Annual Report - 2011
(With Provincial and District level data)
Department of Census and Statistics
Ministry of Finance and Planning

ii
iii
Sri Lanka Labour Force Survey
Annual Report - 2011
(With Provincial and District level data)
Department of Census and Statistics
Ministry of Finance and Planning
iv
ISBN 978 – 955 – 577 – 785 – 8
i
Preface
In the past, information on labour force characteristics, employment and unemployment etc. were collected through
labour force and socio - economic surveys conducted at five yearly time intervals. However, the employment and
unemployment data are required at very short intervals to monitor the programmes implemented in the employment
generating policies of the government. Therefore, to satisfy this need, the Department of Census and Statistics (DCS)
designed a labour force survey on a quarterly basis, to measure the levels and trends of employment, unemployment and
labour force in Sri Lanka on a continuous basis. This survey was commenced from the first quarter of 1990 and is being
continued by the DCS.
Though certain changes were made over the years to improve the accuracy and usefulness of the data, still the survey
concepts and methods are very similar to those introduced at the beginning of the survey in 1990.
Beginning in January 2006, some significant improvements were made to the labour force survey schedule in order to
fulfill the requirements of its users and also to provide additional information for the planning purposes. This revision
was made focusing on literacy, household economic activities, informal sector employment and underemployment etc.
This revised version was introduced for the survey conducted in 2006 first quarter, and it will be used in future as well.
Under the prevailing situation in Northern province, it was able to conduct the survey in that province successfully. So,
after a long time, DCS could publish this report covering the whole country.
The field work of the survey in fourth quarter of 2011 was not conducted since preparation of the enumeration stage of
population census 2011. Therefore no date collection was done during the fourth quarter of 2011. Hence, this report is
based on a sample of 17,620 housing units providing national, provincial and district level estimates with a stipulated
standard errors of labour force characteristics as reported in the relevant reference periods of each 9 months of the year
2011.
D.B.P. Suranjana Vidyaratna Director General
Department of Census & Statistics Department of Census & Statistics, 15/12, Maitland Crescent, Colombo 7.
09 /10/2012.

ii
iii
Acknowledgements
This “Annual Report of the Sri Lanka Labour Force Survey, 2011” with provincial and district level data is based on the
total annual sample of 17,620 housing units covering the entire country.
Planning and the execution of the survey in 2011 have done by the staff of the Sample Surveys Division under the direct
supervision of Mr. W. W. M. A. S. Premakumara, Director, Sample Surveys Division.
Field operation activities were organized by Mr. R.A.P. Kumarasinghe, Statistician of the Sample Surveys Division.
The computer data processing and final tabulations were made using microcomputers by Mrs. W.A.S.M.P. Gunasekara,
Mr. T.Thirugnanatheepan, Statistical Officer and Mr. M.B.M. Shiras, Statistical Assistant under the supervision of
Mr. P.A. Subawickrama, Statistician of the Sample Surveys Division.
Mr. K.M.R. Wickramasingha, System Analysist/Programmer Sample Surveys Division, developed the sample selection
programme.
This publication was organized and prepared by Mr. Priyadarshana Dharmawardena, Senior Statistician and Ms. C.
Jayawickrama, Senior Statistician under the supervision of Mr. W.W.M.A.S. Premakumara, Director of the Sample
Surveys Division. The preparation work of the report was assisted by Mrs. W.A.S.M.P. Gunasekara, Mrs. G.M.Y.D. de
Silva, Statistical officers and Mr. M.B.M. Shiras, Mrs. W.M.S.Nilushini Statistical Assistants.
The ICT Division, under the direction of Mr. S.A.S. Bandulasena, Acting Director and under the supervision of Mr.
Migara Fernando and Mr. Wasantha Weerasiri, Senior System Analyst/Programmers, was responsible for the survey
data entry and preparation of data entry and computer edits programmes. Data entry was decentralized and manual
editing, coding & data entry were done by responsible officers at District Secretariats in Gampaha, Kalutara, Kandy,
Matale, Galle, Matara, Kurunegala, Puttalam, Anuradhapura, Badulla, Ratnapura & Kegalle districts.
Sample Survey Division implemented the Sri Lanka Labour Force Survey programme, under the direction of Mr. G.Y.L.
Fernando, Director 2, Dept. of Census & Statistics.
District field staff of the Department who worked on the survey deserves a special word of thanks. They include District
Deputy Directors/ Senior Statisticians/ Statisticians and field Statistical Officers, who worked hard at the data collection
stage, to make this survey a success.
Printing of the survey materials were done at the Printing Division, under the supervision of Mr. W.C. Weerawansha,
Senior Statistician.
Finally, I wish to express my appreciation to all the respondents of the survey for their valuable co-operation.

iv
v
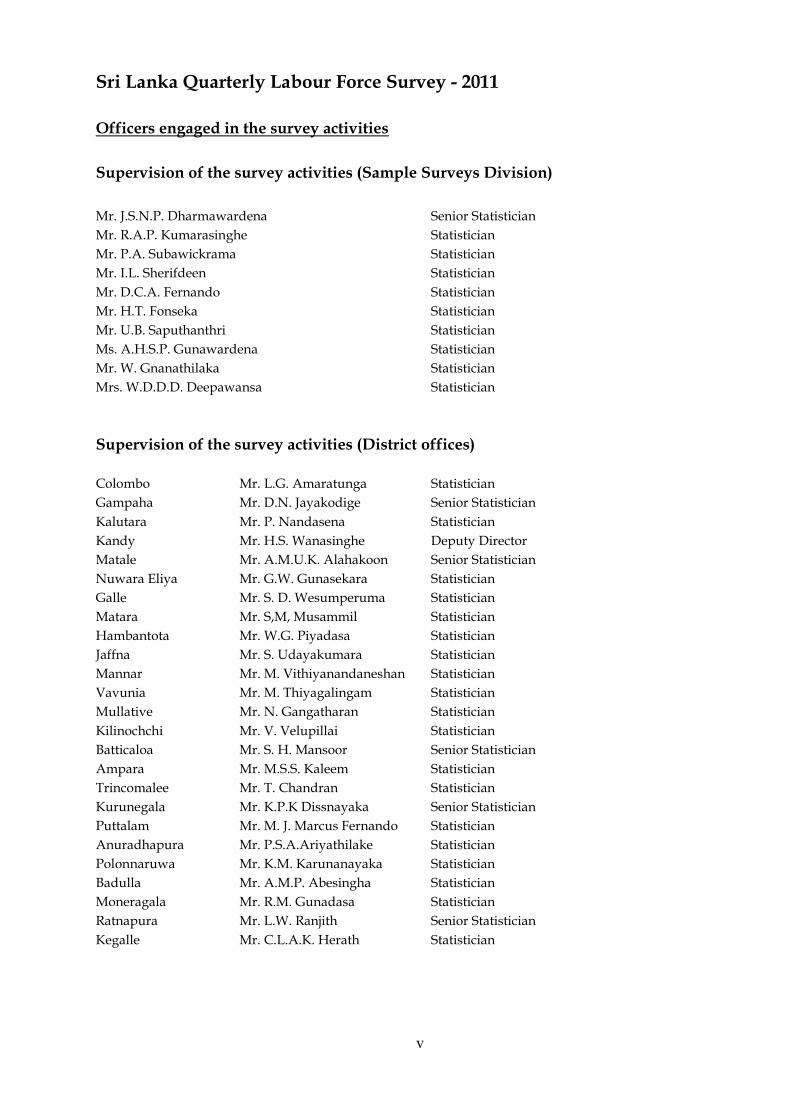
Sri Lanka Quarterly Labour Force Survey - 2011
Officers engaged in the survey activities
Supervision of the survey activities (Sample Surveys Division)
Mr. J.S.N.P. Dharmawardena Senior Statistician
Mr. R.A.P. Kumarasinghe Statistician
Mr. P.A. Subawickrama Statistician
Mr. I.L. Sherifdeen Statistician
Mr. D.C.A. Fernando Statistician
Mr. H.T. Fonseka Statistician
Mr. U.B. Saputhanthri Statistician
Ms. A.H.S.P. Gunawardena Statistician
Mr. W. Gnanathilaka Statistician
Mrs. W.D.D.D. Deepawansa Statistician
Supervision of the survey activities (District offices)
Colombo Mr. L.G. Amaratunga Statistician
Gampaha Mr. D.N. Jayakodige Senior Statistician
Kalutara Mr. P. Nandasena Statistician
Kandy Mr. H.S. Wanasinghe Deputy Director
Matale Mr. A.M.U.K. Alahakoon Senior Statistician
Nuwara Eliya Mr. G.W. Gunasekara Statistician
Galle Mr. S. D. Wesumperuma Statistician
Matara Mr. S,M, Musammil Statistician
Hambantota Mr. W.G. Piyadasa Statistician
Jaffna Mr. S. Udayakumara Statistician
Mannar Mr. M. Vithiyanandaneshan Statistician
Vavunia Mr. M. Thiyagalingam Statistician
Mullative Mr. N. Gangatharan Statistician
Kilinochchi Mr. V. Velupillai Statistician
Batticaloa Mr. S. H. Mansoor Senior Statistician
Ampara Mr. M.S.S. Kaleem Statistician
Trincomalee Mr. T. Chandran Statistician
Kurunegala Mr. K.P.K Dissnayaka Senior Statistician
Puttalam Mr. M. J. Marcus Fernando Statistician
Anuradhapura Mr. P.S.A.Ariyathilake Statistician
Polonnaruwa Mr. K.M. Karunanayaka Statistician
Badulla Mr. A.M.P. Abesingha Statistician
Moneragala Mr. R.M. Gunadasa Statistician
Ratnapura Mr. L.W. Ranjith Senior Statistician
Kegalle Mr. C.L.A.K. Herath Statistician
vi
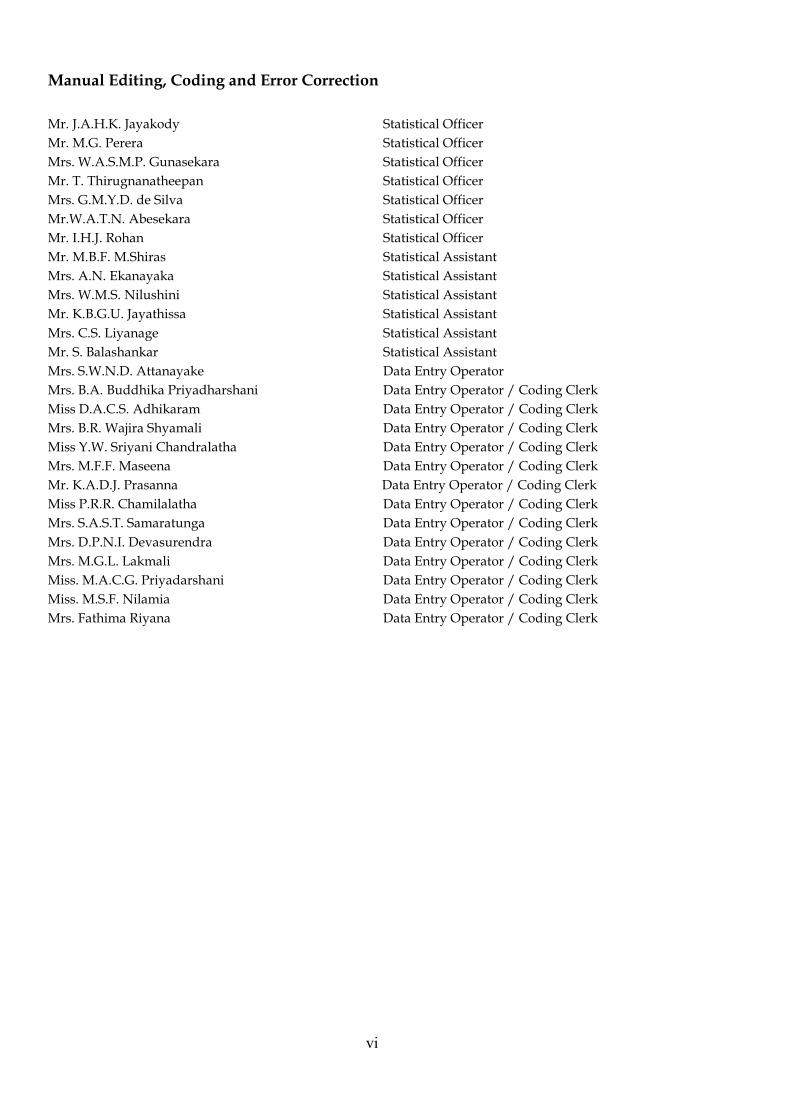
Manual Editing, Coding and Error Correction
Mr. J.A.H.K. Jayakody Statistical Officer
Mr. M.G. Perera Statistical Officer
Mrs. W.A.S.M.P. Gunasekara Statistical Officer
Mr. T. Thirugnanatheepan Statistical Officer
Mrs. G.M.Y.D. de Silva Statistical Officer
Mr.W.A.T.N. Abesekara Statistical Officer
Mr. I.H.J. Rohan Statistical Officer
Mr. M.B.F. M.Shiras Statistical Assistant
Mrs. A.N. Ekanayaka Statistical Assistant
Mrs. W.M.S. Nilushini Statistical Assistant
Mr. K.B.G.U. Jayathissa Statistical Assistant
Mrs. C.S. Liyanage Statistical Assistant
Mr. S. Balashankar Statistical Assistant
Mrs. S.W.N.D. Attanayake Data Entry Operator
Mrs. B.A. Buddhika Priyadharshani Data Entry Operator / Coding Clerk
Miss D.A.C.S. Adhikaram Data Entry Operator / Coding Clerk
Mrs. B.R. Wajira Shyamali Data Entry Operator / Coding Clerk
Miss Y.W. Sriyani Chandralatha Data Entry Operator / Coding Clerk
Mrs. M.F.F. Maseena Data Entry Operator / Coding Clerk
Mr. K.A.D.J. Prasanna Data Entry Operator / Coding Clerk
Miss P.R.R. Chamilalatha Data Entry Operator / Coding Clerk
Mrs. S.A.S.T. Samaratunga Data Entry Operator / Coding Clerk
Mrs. D.P.N.I. Devasurendra Data Entry Operator / Coding Clerk
Mrs. M.G.L. Lakmali Data Entry Operator / Coding Clerk
Miss. M.A.C.G. Priyadarshani Data Entry Operator / Coding Clerk
Miss. M.S.F. Nilamia Data Entry Operator / Coding Clerk
Mrs. Fathima Riyana Data Entry Operator / Coding Clerk
vii
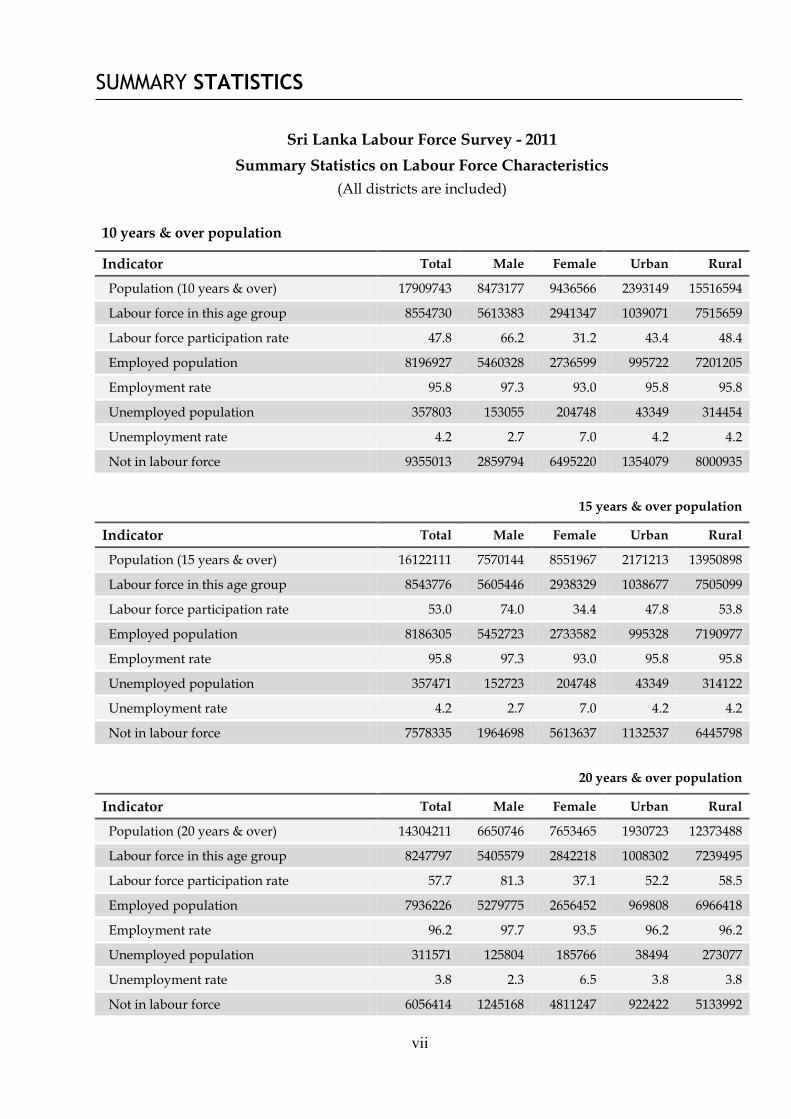
SUMMARY STATISTICS
Sri Lanka Labour Force Survey - 2011
Summary Statistics on Labour Force Characteristics
(All districts are included)
10 years & over population
Indicator Total Male Female Urban Rural
Population (10 years & over) 17909743 8473177 9436566 2393149 15516594
Labour force in this age group 8554730 5613383 2941347 1039071 7515659
Labour force participation rate 47.8 66.2 31.2 43.4 48.4
Employed population 8196927 5460328 2736599 995722 7201205
Employment rate 95.8 97.3 93.0 95.8 95.8
Unemployed population 357803 153055 204748 43349 314454
Unemployment rate 4.2 2.7 7.0 4.2 4.2
Not in labour force 9355013 2859794 6495220 1354079 8000935
15 years & over population
Indicator Total Male Female Urban Rural
Population (15 years & over) 16122111 7570144 8551967 2171213 13950898
Labour force in this age group 8543776 5605446 2938329 1038677 7505099
Labour force participation rate 53.0 74.0 34.4 47.8 53.8
Employed population 8186305 5452723 2733582 995328 7190977
Employment rate 95.8 97.3 93.0 95.8 95.8
Unemployed population 357471 152723 204748 43349 314122
Unemployment rate 4.2 2.7 7.0 4.2 4.2
Not in labour force 7578335 1964698 5613637 1132537 6445798
20 years & over population
Indicator Total Male Female Urban Rural
Population (20 years & over) 14304211 6650746 7653465 1930723 12373488
Labour force in this age group 8247797 5405579 2842218 1008302 7239495
Labour force participation rate 57.7 81.3 37.1 52.2 58.5
Employed population 7936226 5279775 2656452 969808 6966418
Employment rate 96.2 97.7 93.5 96.2 96.2
Unemployed population 311571 125804 185766 38494 273077
Unemployment rate 3.8 2.3 6.5 3.8 3.8
Not in labour force 6056414 1245168 4811247 922422 5133992
viii
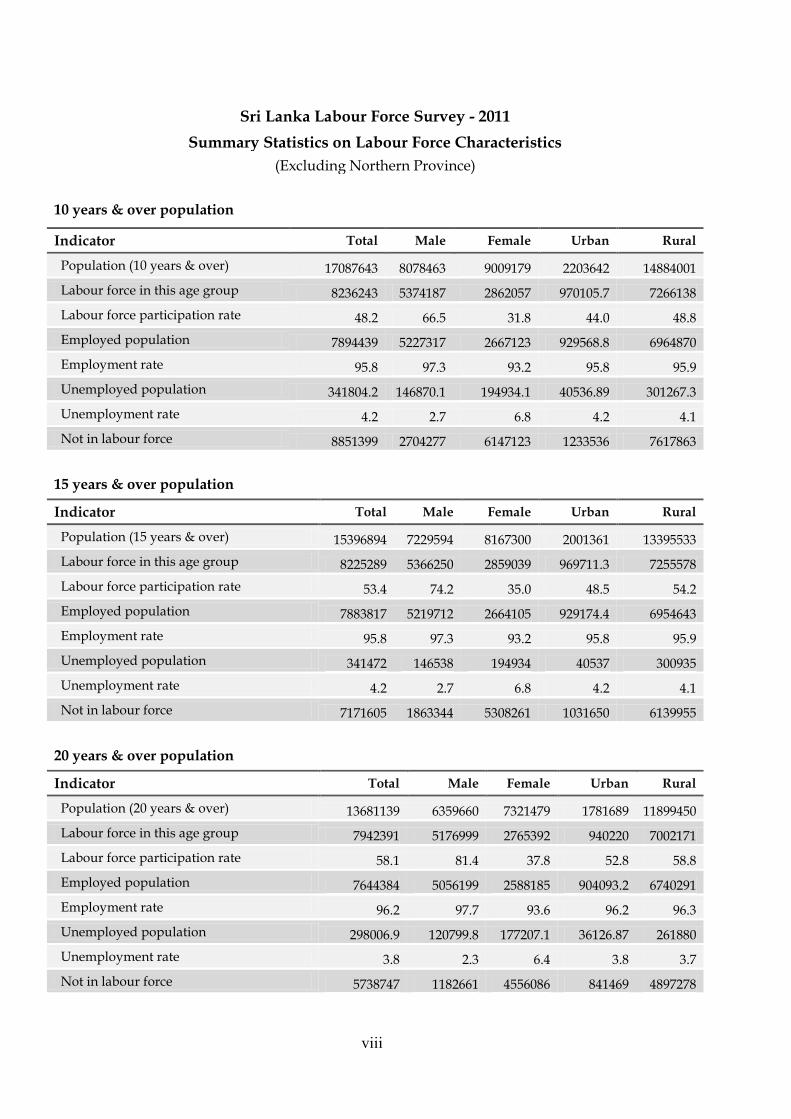
Sri Lanka Labour Force Survey - 2011
Summary Statistics on Labour Force Characteristics
(Excluding Northern Province)
10 years & over population
Indicator Total Male Female Urban Rural
Population (10 years & over) 17087643 8078463 9009179 2203642 14884001
Labour force in this age group 8236243 5374187 2862057 970105.7 7266138
Labour force participation rate 48.2 66.5 31.8 44.0 48.8
Employed population 7894439 5227317 2667123 929568.8 6964870
Employment rate 95.8 97.3 93.2 95.8 95.9
Unemployed population 341804.2 146870.1 194934.1 40536.89 301267.3
Unemployment rate 4.2 2.7 6.8 4.2 4.1
Not in labour force 8851399 2704277 6147123 1233536 7617863
15 years & over population
Indicator Total Male Female Urban Rural
Population (15 years & over) 15396894 7229594 8167300 2001361 13395533
Labour force in this age group 8225289 5366250 2859039 969711.3 7255578
Labour force participation rate 53.4 74.2 35.0 48.5 54.2
Employed population 7883817 5219712 2664105 929174.4 6954643
Employment rate 95.8 97.3 93.2 95.8 95.9
Unemployed population 341472 146538 194934 40537 300935
Unemployment rate 4.2 2.7 6.8 4.2 4.1
Not in labour force 7171605 1863344 5308261 1031650 6139955
20 years & over population
Indicator Total Male Female Urban Rural
Population (20 years & over) 13681139 6359660 7321479 1781689 11899450
Labour force in this age group 7942391 5176999 2765392 940220 7002171
Labour force participation rate 58.1 81.4 37.8 52.8 58.8
Employed population 7644384 5056199 2588185 904093.2 6740291
Employment rate 96.2 97.7 93.6 96.2 96.3
Unemployed population 298006.9 120799.8 177207.1 36126.87 261880
Unemployment rate 3.8 2.3 6.4 3.8 3.7
Not in labour force 5738747 1182661 4556086 841469 4897278
ix
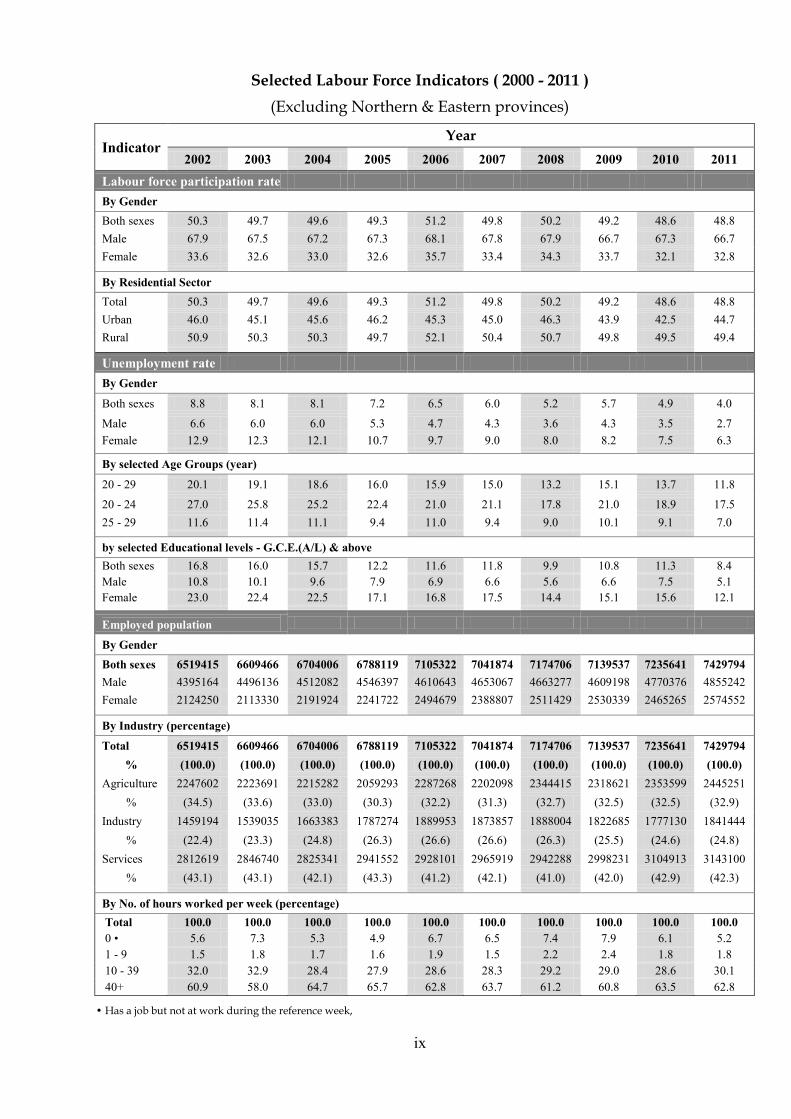
Selected Labour Force Indicators ( 2000 - 2011 )
(Excluding Northern & Eastern provinces)
Indicator Year
2002 2003 2004 2005 2006 2007 2008 2009 2010 2011
Labour force participation rate
By Gender
Both sexes 50.3 49.7 49.6 49.3 51.2 49.8 50.2 49.2 48.6 48.8
Male 67.9 67.5 67.2 67.3 68.1 67.8 67.9 66.7 67.3 66.7
Female 33.6 32.6 33.0 32.6 35.7 33.4 34.3 33.7 32.1 32.8
By Residential Sector
Total 50.3 49.7 49.6 49.3 51.2 49.8 50.2 49.2 48.6 48.8
Urban 46.0 45.1 45.6 46.2 45.3 45.0 46.3 43.9 42.5 44.7
Rural 50.9 50.3 50.3 49.7 52.1 50.4 50.7 49.8 49.5 49.4
Unemployment rate
By Gender
Both sexes 8.8 8.1 8.1 7.2 6.5 6.0 5.2 5.7 4.9 4.0
Male 6.6 6.0 6.0 5.3 4.7 4.3 3.6 4.3 3.5 2.7
Female 12.9 12.3 12.1 10.7 9.7 9.0 8.0 8.2 7.5 6.3
By selected Age Groups (year)
20 - 29 20.1 19.1 18.6 16.0 15.9 15.0 13.2 15.1 13.7 11.8
20 - 24 27.0 25.8 25.2 22.4 21.0 21.1 17.8 21.0 18.9 17.5
25 - 29 11.6 11.4 11.1 9.4 11.0 9.4 9.0 10.1 9.1 7.0
by selected Educational levels - G.C.E.(A/L) & above
Both sexes 16.8 16.0 15.7 12.2 11.6 11.8 9.9 10.8 11.3 8.4
Male 10.8 10.1 9.6 7.9 6.9 6.6 5.6 6.6 7.5 5.1
Female 23.0 22.4 22.5 17.1 16.8 17.5 14.4 15.1 15.6 12.1
Employed population
By Gender
Both sexes 6519415 6609466 6704006 6788119 7105322 7041874 7174706 7139537 7235641 7429794
Male 4395164 4496136 4512082 4546397 4610643 4653067 4663277 4609198 4770376 4855242
Female 2124250 2113330 2191924 2241722 2494679 2388807 2511429 2530339 2465265 2574552
By Industry (percentage)
Total 6519415 6609466 6704006 6788119 7105322 7041874 7174706 7139537 7235641 7429794
% (100.0) (100.0) (100.0) (100.0) (100.0) (100.0) (100.0) (100.0) (100.0) (100.0)
Agriculture 2247602 2223691 2215282 2059293 2287268 2202098 2344415 2318621 2353599 2445251
% (34.5) (33.6) (33.0) (30.3) (32.2) (31.3) (32.7) (32.5) (32.5) (32.9)
Industry 1459194 1539035 1663383 1787274 1889953 1873857 1888004 1822685 1777130 1841444
% (22.4) (23.3) (24.8) (26.3) (26.6) (26.6) (26.3) (25.5) (24.6) (24.8)
Services 2812619 2846740 2825341 2941552 2928101 2965919 2942288 2998231 3104913 3143100
% (43.1) (43.1) (42.1) (43.3) (41.2) (42.1) (41.0) (42.0) (42.9) (42.3)
By No. of hours worked per week (percentage)
Total 100.0 100.0 100.0 100.0 100.0 100.0 100.0 100.0 100.0 100.0
0 • 5.6 7.3 5.3 4.9 6.7 6.5 7.4 7.9 6.1 5.2
1 - 9 1.5 1.8 1.7 1.6 1.9 1.5 2.2 2.4 1.8 1.8
10 - 39 32.0 32.9 28.4 27.9 28.6 28.3 29.2 29.0 28.6 30.1
40+ 60.9 58.0 64.7 65.7 62.8 63.7 61.2 60.8 63.5 62.8
• Has a job but not at work during the reference week,
x
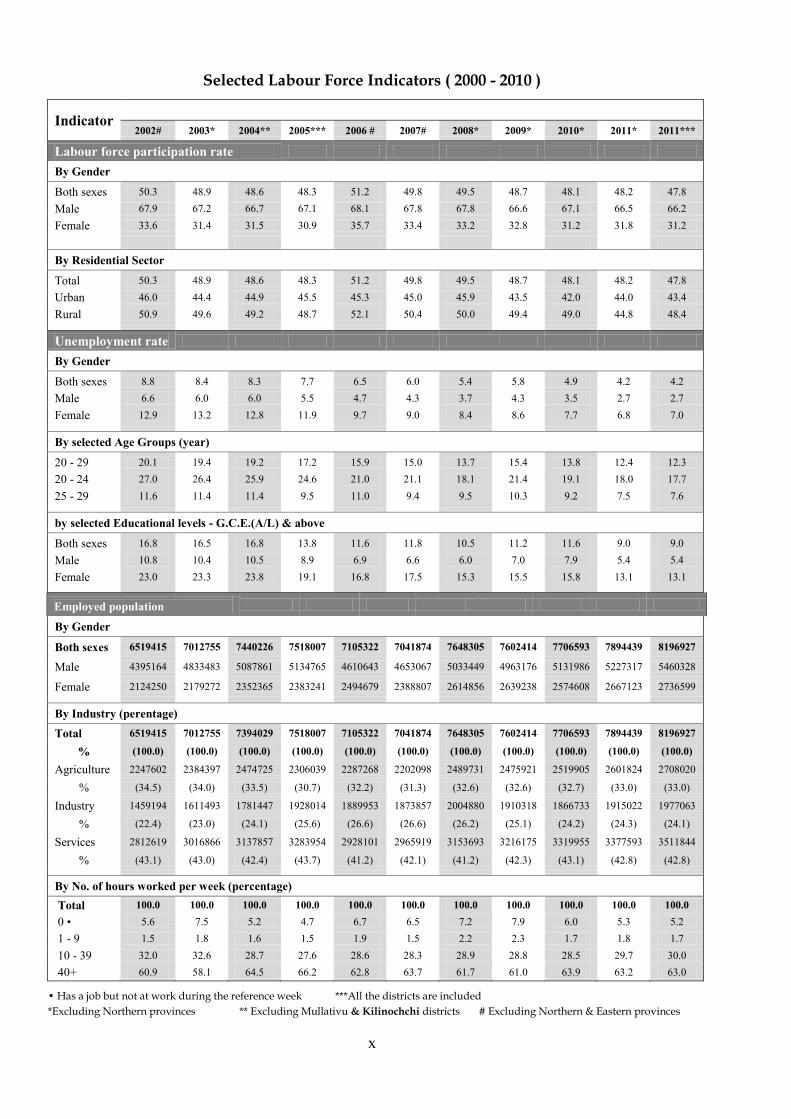
Selected Labour Force Indicators ( 2000 - 2010 )
Indicator
2002# 2003* 2004** 2005*** 2006 # 2007# 2008* 2009* 2010* 2011* 2011***
Labour force participation rate
By Gender
Both sexes 50.3 48.9 48.6 48.3 51.2 49.8 49.5 48.7 48.1 48.2 47.8
Male 67.9 67.2 66.7 67.1 68.1 67.8 67.8 66.6 67.1 66.5 66.2
Female 33.6 31.4 31.5 30.9 35.7 33.4 33.2 32.8 31.2 31.8 31.2
By Residential Sector
Total 50.3 48.9 48.6 48.3 51.2 49.8 49.5 48.7 48.1 48.2 47.8
Urban 46.0 44.4 44.9 45.5 45.3 45.0 45.9 43.5 42.0 44.0 43.4
Rural 50.9 49.6 49.2 48.7 52.1 50.4 50.0 49.4 49.0 44.8 48.4
Unemployment rate
By Gender
Both sexes 8.8 8.4 8.3 7.7 6.5 6.0 5.4 5.8 4.9 4.2 4.2
Male 6.6 6.0 6.0 5.5 4.7 4.3 3.7 4.3 3.5 2.7 2.7
Female 12.9 13.2 12.8 11.9 9.7 9.0 8.4 8.6 7.7 6.8 7.0
By selected Age Groups (year)
20 - 29 20.1 19.4 19.2 17.2 15.9 15.0 13.7 15.4 13.8 12.4 12.3
20 - 24 27.0 26.4 25.9 24.6 21.0 21.1 18.1 21.4 19.1 18.0 17.7
25 - 29 11.6 11.4 11.4 9.5 11.0 9.4 9.5 10.3 9.2 7.5 7.6
by selected Educational levels - G.C.E.(A/L) & above
Both sexes 16.8 16.5 16.8 13.8 11.6 11.8 10.5 11.2 11.6 9.0 9.0
Male 10.8 10.4 10.5 8.9 6.9 6.6 6.0 7.0 7.9 5.4 5.4
Female 23.0 23.3 23.8 19.1 16.8 17.5 15.3 15.5 15.8 13.1 13.1
Employed population
By Gender
Both sexes 6519415 7012755 7440226 7518007 7105322 7041874 7648305 7602414 7706593 7894439 8196927
Male 4395164 4833483 5087861 5134765 4610643 4653067 5033449 4963176 5131986 5227317 5460328
Female 2124250 2179272 2352365 2383241 2494679 2388807 2614856 2639238 2574608 2667123 2736599
By Industry (perentage)
Total 6519415 7012755 7394029 7518007 7105322 7041874 7648305 7602414 7706593 7894439 8196927
% (100.0) (100.0) (100.0) (100.0) (100.0) (100.0) (100.0) (100.0) (100.0) (100.0) (100.0)
Agriculture 2247602 2384397 2474725 2306039 2287268 2202098 2489731 2475921 2519905 2601824 2708020
% (34.5) (34.0) (33.5) (30.7) (32.2) (31.3) (32.6) (32.6) (32.7) (33.0) (33.0)
Industry 1459194 1611493 1781447 1928014 1889953 1873857 2004880 1910318 1866733 1915022 1977063
% (22.4) (23.0) (24.1) (25.6) (26.6) (26.6) (26.2) (25.1) (24.2) (24.3) (24.1)
Services 2812619 3016866 3137857 3283954 2928101 2965919 3153693 3216175 3319955 3377593 3511844
% (43.1) (43.0) (42.4) (43.7) (41.2) (42.1) (41.2) (42.3) (43.1) (42.8) (42.8)
By No. of hours worked per week (percentage)
Total 100.0 100.0 100.0 100.0 100.0 100.0 100.0 100.0 100.0 100.0 100.0
0 • 5.6 7.5 5.2 4.7 6.7 6.5 7.2 7.9 6.0 5.3 5.2
1 - 9 1.5 1.8 1.6 1.5 1.9 1.5 2.2 2.3 1.7 1.8 1.7
10 - 39 32.0 32.6 28.7 27.6 28.6 28.3 28.9 28.8 28.5 29.7 30.0
40+ 60.9 58.1 64.5 66.2 62.8 63.7 61.7 61.0 63.9 63.2 63.0
• Has a job but not at work during the reference week ***All the districts are included
*Excluding Northern provinces ** Excluding Mullativu & Kilinochchi districts # Excluding Northern & Eastern provinces
xi
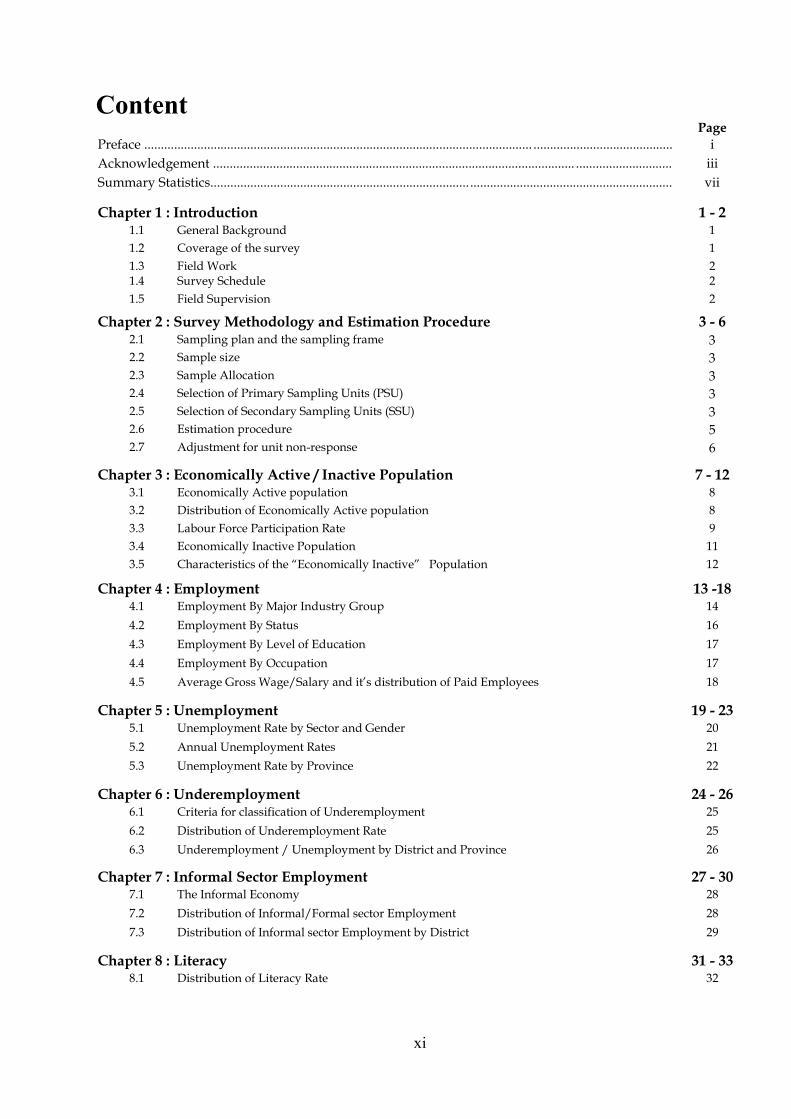
Content Page
Preface ..................................................................................................................... .......................................... i
Acknowledgement ............................................................................................................. ............................. iii
Summary Statistics.............................................................................. .............................................................
vii
Chapter 1 : Introduction 1 - 2 1.1 General Background 1
1.2 Coverage of the survey 1
1.3 Field Work 2 1.4 Survey Schedule 2
1.5 Field Supervision
2
Chapter 2 : Survey Methodology and Estimation Procedure 3 - 6 2.1 Sampling plan and the sampling frame 3 2.2 Sample size 3
2.3 Sample Allocation 3 2.4 Selection of Primary Sampling Units (PSU) 3
2.5 Selection of Secondary Sampling Units (SSU) 3 2.6 Estimation procedure 5
2.7 Adjustment for unit non-response
6
Chapter 3 : Economically Active / Inactive Population 7 - 12 3.1 Economically Active population 8
3.2 Distribution of Economically Active population 8
3.3 Labour Force Participation Rate 9
3.4 Economically Inactive Population 11
3.5 Characteristics of the “Economically Inactive” Population
12
Chapter 4 : Employment 13 -18 4.1 Employment By Major Industry Group 14
4.2 Employment By Status 16
4.3 Employment By Level of Education 17
4.4 Employment By Occupation 17
4.5 Average Gross Wage/Salary and it‟s distribution of Paid Employees
18
Chapter 5 : Unemployment 19 - 23 5.1 Unemployment Rate by Sector and Gender 20
5.2 Annual Unemployment Rates 21
5.3 Unemployment Rate by Province
22
Chapter 6 : Underemployment 24 - 26 6.1 Criteria for classification of Underemployment 25
6.2 Distribution of Underemployment Rate 25
6.3 Underemployment / Unemployment by District and Province 26
Chapter 7 : Informal Sector Employment 27 - 30 7.1 The Informal Economy 28
7.2 Distribution of Informal/Formal sector Employment 28
7.3 Distribution of Informal sector Employment by District 29
Chapter 8 : Literacy 31 - 33 8.1 Distribution of Literacy Rate 32

xii
xiii
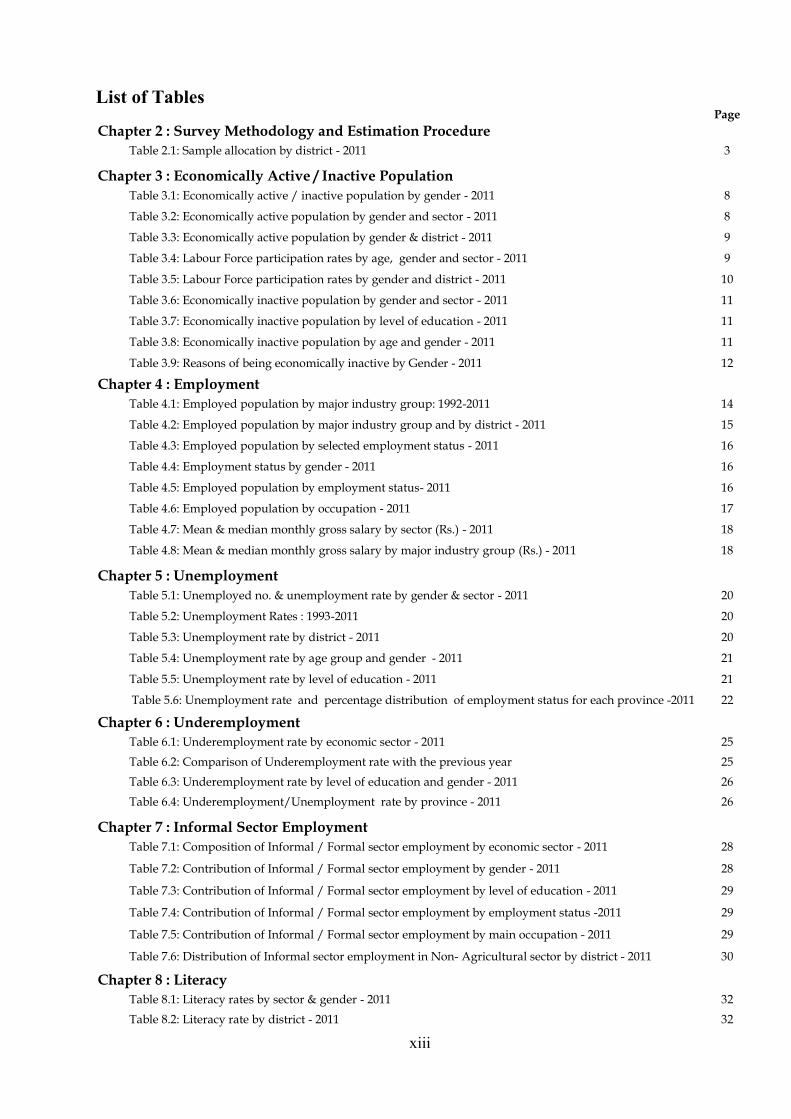
List of Tables Page
Chapter 2 : Survey Methodology and Estimation Procedure
Table 2.1: Sample allocation by district - 2011 3
Chapter 3 : Economically Active / Inactive Population
Table 3.1: Economically active / inactive population by gender - 2011 8
Table 3.2: Economically active population by gender and sector - 2011 8
Table 3.3: Economically active population by gender & district - 2011 9
Table 3.4: Labour Force participation rates by age, gender and sector - 2011 9
Table 3.5: Labour Force participation rates by gender and district - 2011 10
Table 3.6: Economically inactive population by gender and sector - 2011 11
Table 3.7: Economically inactive population by level of education - 2011 11
Table 3.8: Economically inactive population by age and gender - 2011 11
Table 3.9: Reasons of being economically inactive by Gender - 2011 12
Chapter 4 : Employment
Table 4.1: Employed population by major industry group: 1992-2011 14
Table 4.2: Employed population by major industry group and by district - 2011 15
Table 4.3: Employed population by selected employment status - 2011 16
Table 4.4: Employment status by gender - 2011 16
Table 4.5: Employed population by employment status- 2011 16
Table 4.6: Employed population by occupation - 2011 17
Table 4.7: Mean & median monthly gross salary by sector (Rs.) - 2011 18
Table 4.8: Mean & median monthly gross salary by major industry group (Rs.) - 2011 18
Chapter 5 : Unemployment
Table 5.1: Unemployed no. & unemployment rate by gender & sector - 2011 20
Table 5.2: Unemployment Rates : 1993-2011 20
Table 5.3: Unemployment rate by district - 2011 20
Table 5.4: Unemployment rate by age group and gender - 2011 21
Table 5.5: Unemployment rate by level of education - 2011 21
Table 5.6: Unemployment rate and percentage distribution of employment status for each province -2011 22
Chapter 6 : Underemployment
Table 6.1: Underemployment rate by economic sector - 2011 25
Table 6.2: Comparison of Underemployment rate with the previous year 25
Table 6.3: Underemployment rate by level of education and gender - 2011 26
Table 6.4: Underemployment/Unemployment rate by province - 2011 26
Chapter 7 : Informal Sector Employment
Table 7.1: Composition of Informal / Formal sector employment by economic sector - 2011 28
Table 7.2: Contribution of Informal / Formal sector employment by gender - 2011 28
Table 7.3: Contribution of Informal / Formal sector employment by level of education - 2011 29
Table 7.4: Contribution of Informal / Formal sector employment by employment status -2011 29
Table 7.5: Contribution of Informal / Formal sector employment by main occupation - 2011 29
Table 7.6: Distribution of Informal sector employment in Non- Agricultural sector by district - 2011 30
Chapter 8 : Literacy
Table 8.1: Literacy rates by sector & gender - 2011 32
Table 8.2: Literacy rate by district - 2011 32
xiv
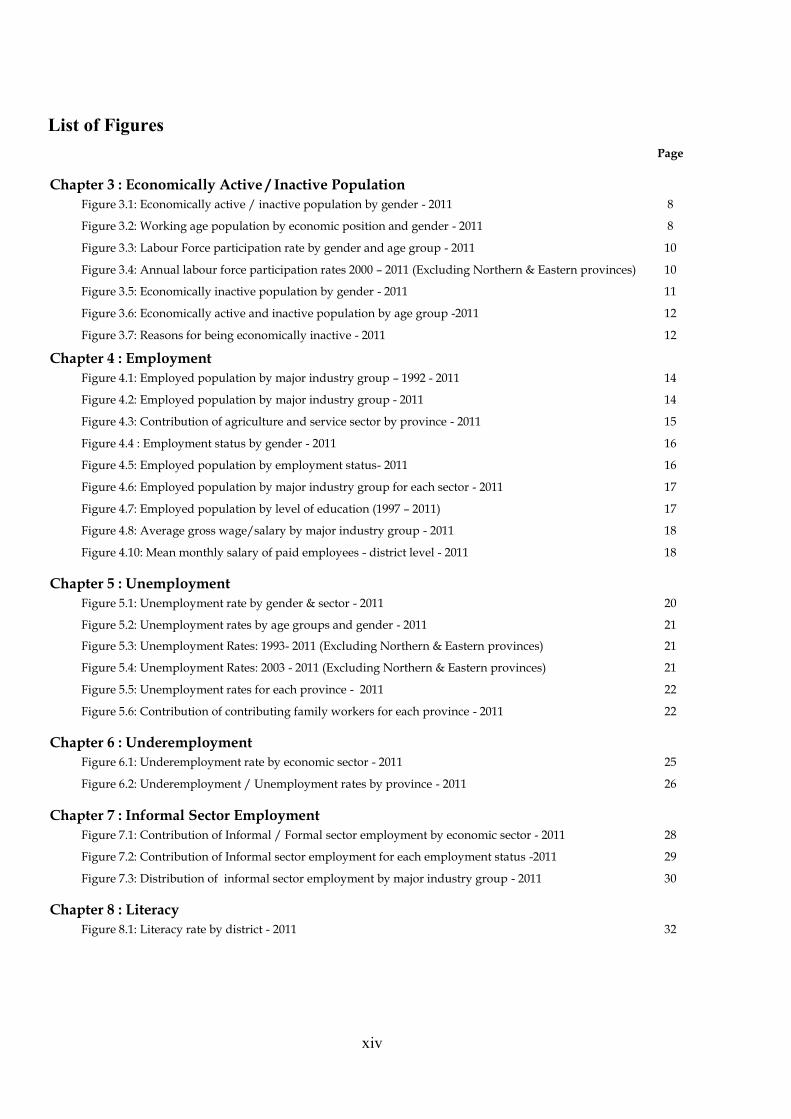
List of Figures
Page
Chapter 3 : Economically Active / Inactive Population
Figure 3.1: Economically active / inactive population by gender - 2011 8
Figure 3.2: Working age population by economic position and gender - 2011 8
Figure 3.3: Labour Force participation rate by gender and age group - 2011 10
Figure 3.4: Annual labour force participation rates 2000 – 2011 (Excluding Northern & Eastern provinces) 10
Figure 3.5: Economically inactive population by gender - 2011 11
Figure 3.6: Economically active and inactive population by age group -2011 12
Figure 3.7: Reasons for being economically inactive - 2011 12
Chapter 4 : Employment
Figure 4.1: Employed population by major industry group – 1992 - 2011 14
Figure 4.2: Employed population by major industry group - 2011 14
Figure 4.3: Contribution of agriculture and service sector by province - 2011 15
Figure 4.4 : Employment status by gender - 2011 16
Figure 4.5: Employed population by employment status- 2011 16
Figure 4.6: Employed population by major industry group for each sector - 2011 17
Figure 4.7: Employed population by level of education (1997 – 2011) 17
Figure 4.8: Average gross wage/salary by major industry group - 2011 18
Figure 4.10: Mean monthly salary of paid employees - district level - 2011
18
Chapter 5 : Unemployment
Figure 5.1: Unemployment rate by gender & sector - 2011 20
Figure 5.2: Unemployment rates by age groups and gender - 2011 21
Figure 5.3: Unemployment Rates: 1993- 2011 (Excluding Northern & Eastern provinces) 21
Figure 5.4: Unemployment Rates: 2003 - 2011 (Excluding Northern & Eastern provinces) 21
Figure 5.5: Unemployment rates for each province - 2011 22
Figure 5.6: Contribution of contributing family workers for each province - 2011
22
Chapter 6 : Underemployment
Figure 6.1: Underemployment rate by economic sector - 2011 25
Figure 6.2: Underemployment / Unemployment rates by province - 2011 26
Chapter 7 : Informal Sector Employment
Figure 7.1: Contribution of Informal / Formal sector employment by economic sector - 2011 28
Figure 7.2: Contribution of Informal sector employment for each employment status -2011 29
Figure 7.3: Distribution of informal sector employment by major industry group - 2011
30
Chapter 8 : Literacy
Figure 8.1: Literacy rate by district - 2011 32
xv
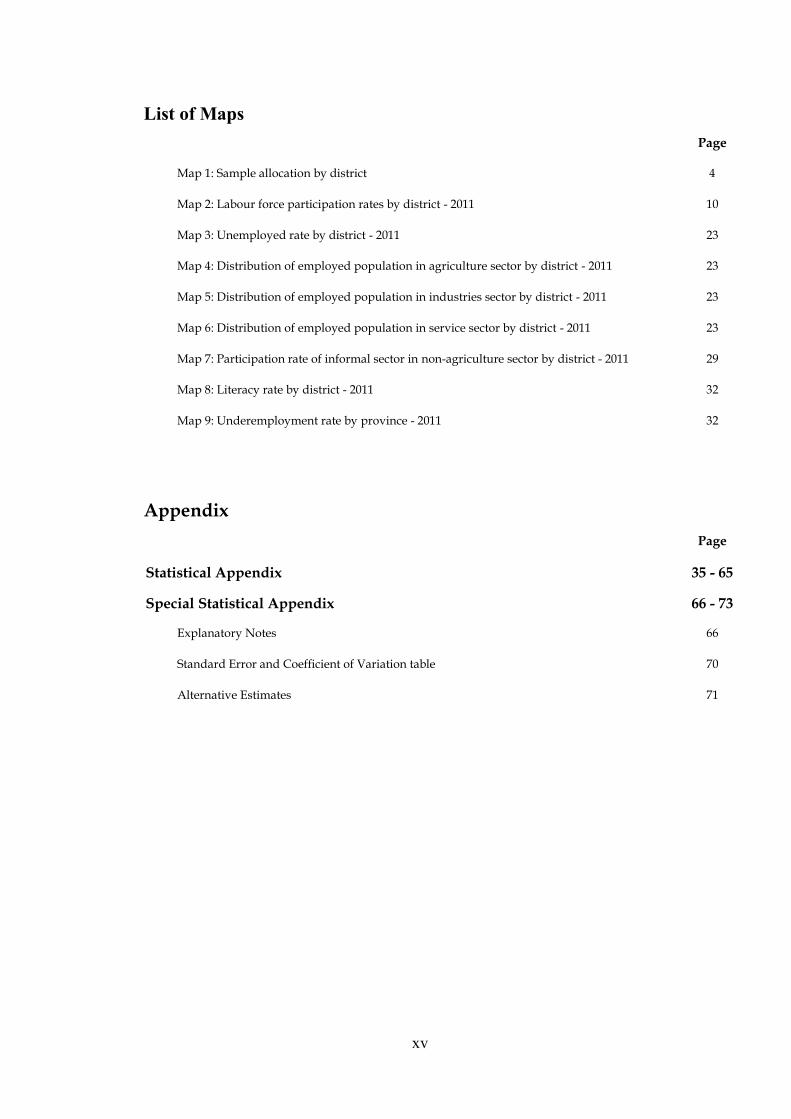
List of Maps
Page
Map 1: Sample allocation by district 4
Map 2: Labour force participation rates by district - 2011 10
Map 3: Unemployed rate by district - 2011 23
Map 4: Distribution of employed population in agriculture sector by district - 2011 23
Map 5: Distribution of employed population in industries sector by district - 2011 23
Map 6: Distribution of employed population in service sector by district - 2011 23
Map 7: Participation rate of informal sector in non-agriculture sector by district - 2011 29
Map 8: Literacy rate by district - 2011 32
Map 9: Underemployment rate by province - 2011 32
Appendix
Page
Statistical Appendix 35 - 65
Special Statistical Appendix 66 - 73
Explanatory Notes 66
Standard Error and Coefficient of Variation table 70
Alternative Estimates 71

xvi
List of Tables in Statistical Appendix
1. Historical table of labour force status (current) of the household population, 10 years of age and over
– Both sexes
1A. Historical table of labour force status (current) of the household population, 10 years of age and over
– Male
1B. Historical table of labour force status (current) of the household population, 10 years of age and over
– Female
2 labour force status (current) of the household population 10 years of age and over, by age – Both sexes
2A. labour force status (current) of the household population 10 years of age and over, by age – Male
2B. labour force status (current) of the household population 10 years of age and over, by age – Female
3. Historical table of currently employed persons by age groups (percentage) - Both sexes
3A. Historical table of currently employed persons by age groups (percentage) - Male
3B. Historical table of currently employed persons by age groups (percentage) - Female
4.. Historical table of currently employed persons by level of education (percentage) - Both sexes
4A. Historical table of currently employed persons by level of education (percentage) - Male
4B. Historical table of currently employed persons by level of education (percentage) - Female
5. Historical table of currently employed persons by employment status (percentage) - Both sexes
5A. Historical table of currently employed persons by employment status (percentage) - Male
5B. Historical table of currently employed persons by employment status (percentage) - Female
6. Currently employed persons by industry group – Both sexes ( Based on ISIC third revision)
6A. Currently employed persons by industry group – Male ( Based on ISIC third revision)
6B. Currently employed persons by industry group – Female ( Based on ISIC third revision)
6C. Historical table of currently employed population by major industry groups – Both sexes
6D. Historical table of currently employed population by major industry groups (percentage)
– Both sexes
7. Currently employed persons by occupation group – Both sexes ( Based on ISCO 88)
7A. Currently employed persons by occupation group - Male (Based on ISCO 88)
7B. Currently employed persons by occupation group – Female (Based on ISCO 88)
8. Currently employed persons by hours per week actually worked at the main job and major industrial
group (percentage) - Both sexes
9. Historical table of currently unemployed persons by age groups (percentage) - Both sexes
9A. Historical table of currently unemployed persons by age groups (percentage) - Male
9B. Historical table of currently unemployed persons by age groups (percentage) - Female
10. Historical table of currently unemployed persons by level of education (percentage) - Both sexes
10A. Historical table of currently unemployed persons by level of education (percentage) - Male
10B. Historical table of currently unemployed persons by level of education (percentage) - Female
11. Currently unemployed persons by sex and duration of unemployment
12. Labour force status (current) of the household population, 10 years of age and over by district
Both sexes
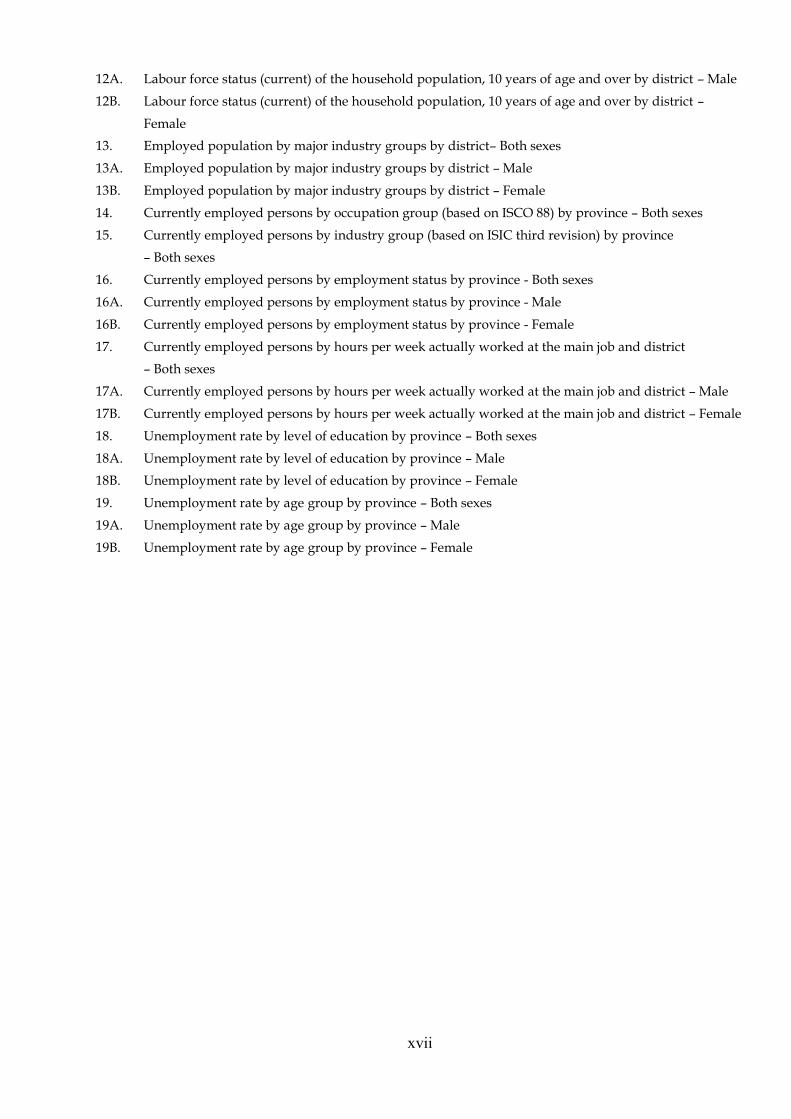
xvii
12A. Labour force status (current) of the household population, 10 years of age and over by district – Male
12B. Labour force status (current) of the household population, 10 years of age and over by district –
Female
13. Employed population by major industry groups by district– Both sexes
13A. Employed population by major industry groups by district – Male
13B. Employed population by major industry groups by district – Female
14. Currently employed persons by occupation group (based on ISCO 88) by province – Both sexes
15. Currently employed persons by industry group (based on ISIC third revision) by province
– Both sexes
16. Currently employed persons by employment status by province - Both sexes
16A. Currently employed persons by employment status by province - Male
16B. Currently employed persons by employment status by province - Female
17. Currently employed persons by hours per week actually worked at the main job and district
– Both sexes
17A. Currently employed persons by hours per week actually worked at the main job and district – Male
17B. Currently employed persons by hours per week actually worked at the main job and district – Female
18. Unemployment rate by level of education by province – Both sexes
18A. Unemployment rate by level of education by province – Male
18B. Unemployment rate by level of education by province – Female
19. Unemployment rate by age group by province – Both sexes
19A. Unemployment rate by age group by province – Male
19B. Unemployment rate by age group by province – Female

xviii
1
Chapter
Introduction
1.1 General Background
In the past, information on labour force
characteristics, employment, and unemployment
etc. were collected through the labour force and
socio-economic surveys conducted at five year
time intervals. But the government required the
employment and unemployment data at very
short intervals to monitor the progress of the
employment generating policies of the country.
Therefore to satisfy this need, the Department of
Census and Statistics (DCS) designed a Labour
Force Survey (LFS) as a quarterly basis to measure
the levels and trends of employment,
unemployment and labour force in Sri Lanka on a
continuous basis. This survey was commenced
from the first quarter 1990 with USAID technical
assistance and is being continued by the DCS.
Since 1990, DCS was able to continue this survey
quarterly, except the second quarter in 2001. It was
due to heavy work involved in the conduct of the
Census of Population and Housing in 2001. Again,
in 2005 due to Tsunami, LFS was not implemented
on quarterly basis as scheduled. Because the staff
of DCS were involved the activities of “Census of
Tsunami”, which was conducted in February 2005
to provide the information on impact of Tsunami.
Also the sample frame, used for Household survey
program had to be updated with the results of the
“Listing operation” conducted in Tsunami affected
districts. Hence in 2005 August LFS was
conducted as a special survey at one point of time.
Therefore, except in these two periods, DCS was
able to continue this task successfully since 1990.
The information collected from LFS serve as the
macro-economic indicators for monitoring the
current performance of the economy and they also
serve to evaluate government policies
andprograms, and therefore, LFS plays an
important role focusing several perspectives.
1.2 Coverage of the survey
LFS was conducted throughout the island during
the first quarter of 1990. Thereafter, till year 2003
North and Eastern provinces were not covered
from the survey due to the prevailed situation in
those areas. In 2003, DCS was able to conduct the
survey in Eastern province and in 2004 and 2005;
the survey covered all 25 districts in the island.
Although it was planned to conduct LFS covering
whole Island, it was not able to cover districts of
Northern & Eastern provinces completely in the
next two consecutive years. Further completed
schedules received from those were not sufficient
to give reliable estimates. Therefore annual
estimates of 2006 and 2007 did not include
Northern & Eastern provinces. After 2007, it was
able to complete the survey in Eastern province
successfully. In 2011, DCS was able to conduct LFS
in Northern Province properly. But during the
fourth quarter survey was not conducted due to
preparation of the population census.
Therefore, this report is based on a sample of
17,620 housing units, covering the entire country,
province providing national, provincial and
district level estimates with a stipulated standard
errors of labour force characteristics as reported in
the relevant reference periods of each 9 months of
the year 2011. This survey covers persons living in
housing units only and, it excludes the
institutional population.
Labour Force Survey - Annual Report 2011
3
1.3 Field Work
The field work of the survey for the year 2011 was
done in 9 months from January to October 2011.
Listing operation was also staggered over a period
of 9 months starting from November 2011 to
August 2011. For each primary sampling unit,
updating was done, about two months prior to the
scheduled interviewing. As such, for example, the
census blocks which were surveyed in January,
were updated in November.
Statistical officers of the DCS were involved in the
listing operation prior to the survey and also in the
survey data collection operation. Each statistical
officer is responsible to carry out all statistical
activities in a Divisional Secretariat to which
she/he is attached.
These officers were given training before they
were entrusted with the survey operations. A
Deputy Director/Senior Statistician/Statistician is
attached to each District Secretariat as the in
charge of statistical activities in that district
1.4 Survey Schedule
Current survey concepts and methods are very
similar to those introduced at the beginning.
However, some changes have been made over the
years to improve the accuracy and usefulness of
the data.
In 2006, some significant improvements1 were
made to LFS schedule to fulfill the requirements of
data users and also to provide additional
information for planning purposes. This was done
after carefully reviewing the LFS schedule with
technical assistance provided by the Economic and
Social Commission for Asia and the Pacific
(ESCAP) Adviser. That was revised focusing on
literacy, household economic activities, informal
sector employment and underemployment etc.
This revised version of the questionnaire has been
using since first quarter, 2006.
1.5 Field Supervision
Regular field supervisions were carried out
throughout the year to check the concepts and
definitions are being used by the enumerator
accurately.
1 See the attached questionnaire
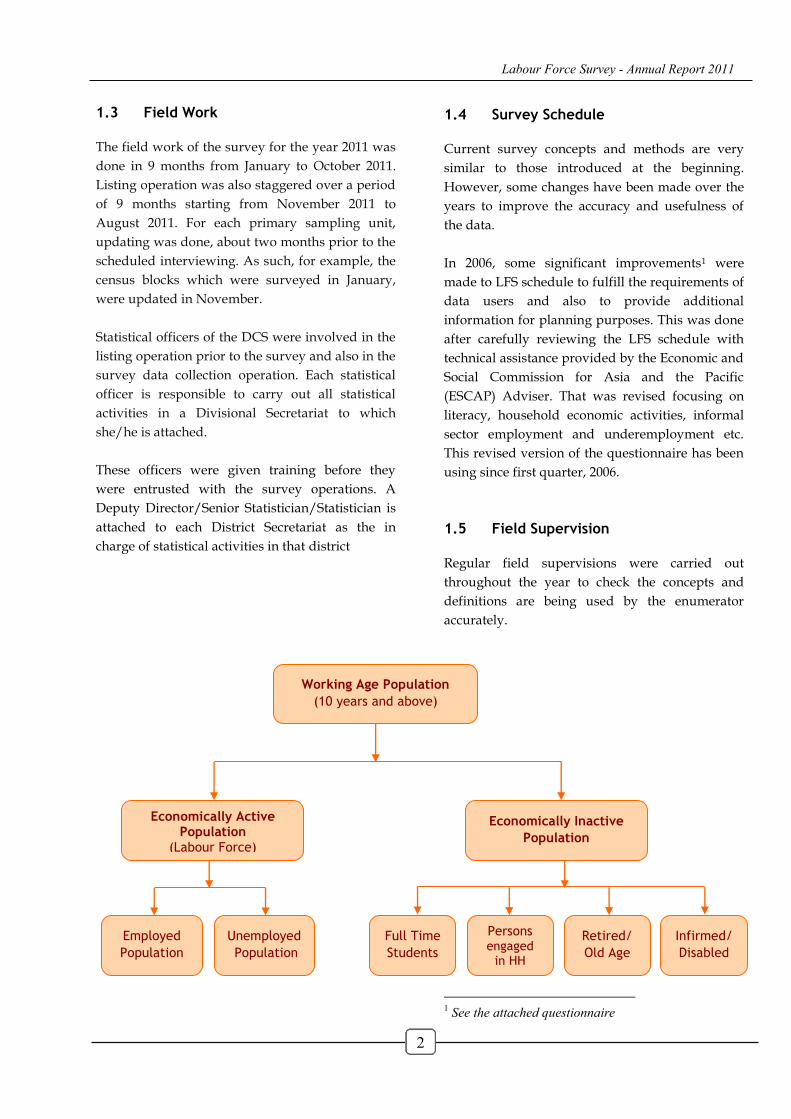
Working Age Population
(10 years and above)
Economically Active Population
(Labour Force)
Economically Inactive
Population
Employed
Population
Unemployed
Population
Full Time
Students
Retired/
Old Age
Persons engaged
in HH duties
Infirmed/
Disabled
2
Labour Force Survey - Annual Report 2011
4
Chapter
Survey Methodology &
Estimation Procedure
2.1 Sampling plan and the sampling
frame
Two stage stratified sampling procedure is
adopted to select a sample of 17,620 housing units
to be enumerated at the survey. The master
sampling frame prepared for 2001 – Census of
Population and Housing is used as the sampling
frame for the sample selection of LFS in 2011. This
main frame was updated after the Tsunami
incident in 2007 using quick count method.
2.2 Sample size
At the beginning the sample size was 2,000
housing units per quarter in areas other than
North and East, and the sample size was increased
to 4,000 housing units per quarter in 1996 and
continued thereafter. However, in 1992 and 1997,
an annual sample of 20,000 housing units was
selected to give reliable estimates by district level.
In 2004 again 20,000 housing units were selected
for the survey. However, in order to provide
district level estimates precisely, it was decided to
use 20,000 – 25,000 housing units as the annual
sample from 2006. As such, in 2011, the annual
sample of 17,620 housing units were selected.
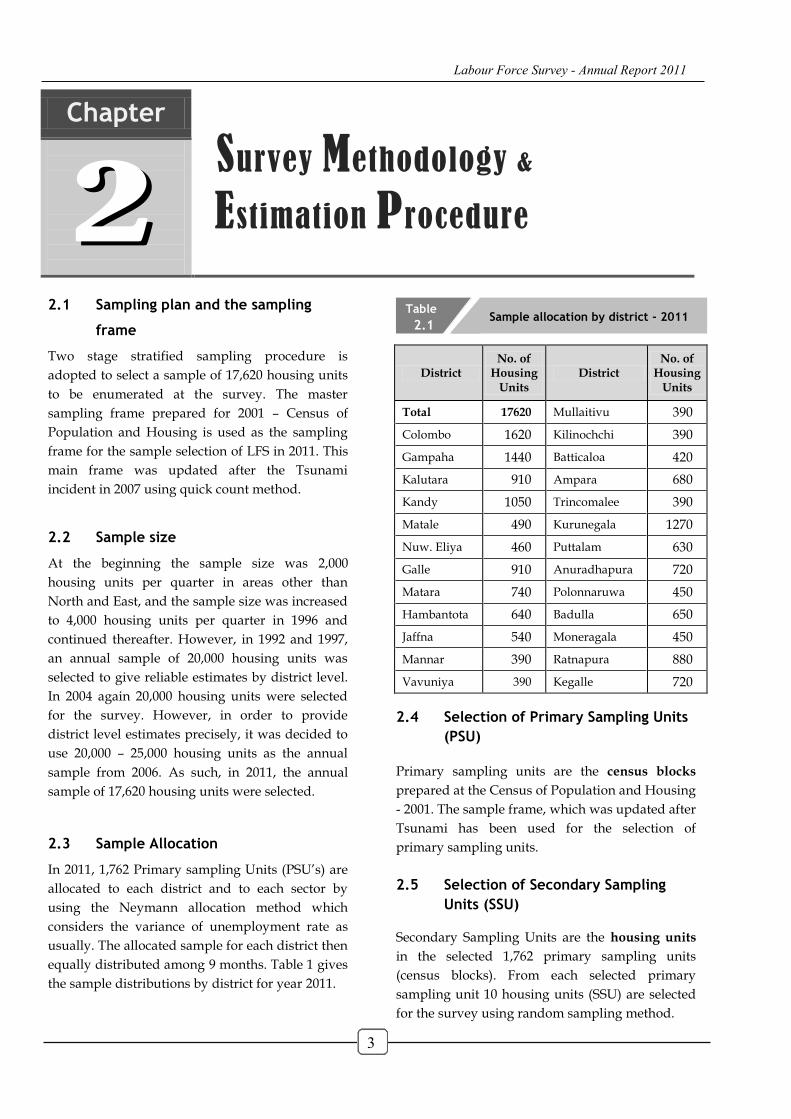
2.3 Sample Allocation
In 2011, 1,762 Primary sampling Units (PSU‟s) are
allocated to each district and to each sector by
using the Neymann allocation method which
considers the variance of unemployment rate as
usually. The allocated sample for each district then
equally distributed among 9 months. Table 1 gives
the sample distributions by district for year 2011.
District No. of
Housing Units
District No. of
Housing Units
Total 17620 Mullaitivu 390
Colombo 1620 Kilinochchi 390
Gampaha 1440 Batticaloa 420
Kalutara 910 Ampara 680
Kandy 1050 Trincomalee 390
Matale 490 Kurunegala 1270
Nuw. Eliya 460 Puttalam 630
Galle 910 Anuradhapura 720
Matara 740 Polonnaruwa 450
Hambantota 640 Badulla 650
Jaffna 540 Moneragala 450
Mannar 390 Ratnapura 880
Vavuniya 390 Kegalle 720
2.4 Selection of Primary Sampling Units
(PSU)
Primary sampling units are the census blocks
prepared at the Census of Population and Housing
- 2001. The sample frame, which was updated after
Tsunami has been used for the selection of
primary sampling units.
2.5 Selection of Secondary Sampling
Units (SSU)
Secondary Sampling Units are the housing units
in the selected 1,762 primary sampling units
(census blocks). From each selected primary
sampling unit 10 housing units (SSU) are selected
for the survey using random sampling method.
Sample allocation by district - 2011 Table
2.1
3
Labour Force Survey - Annual Report 2011
4
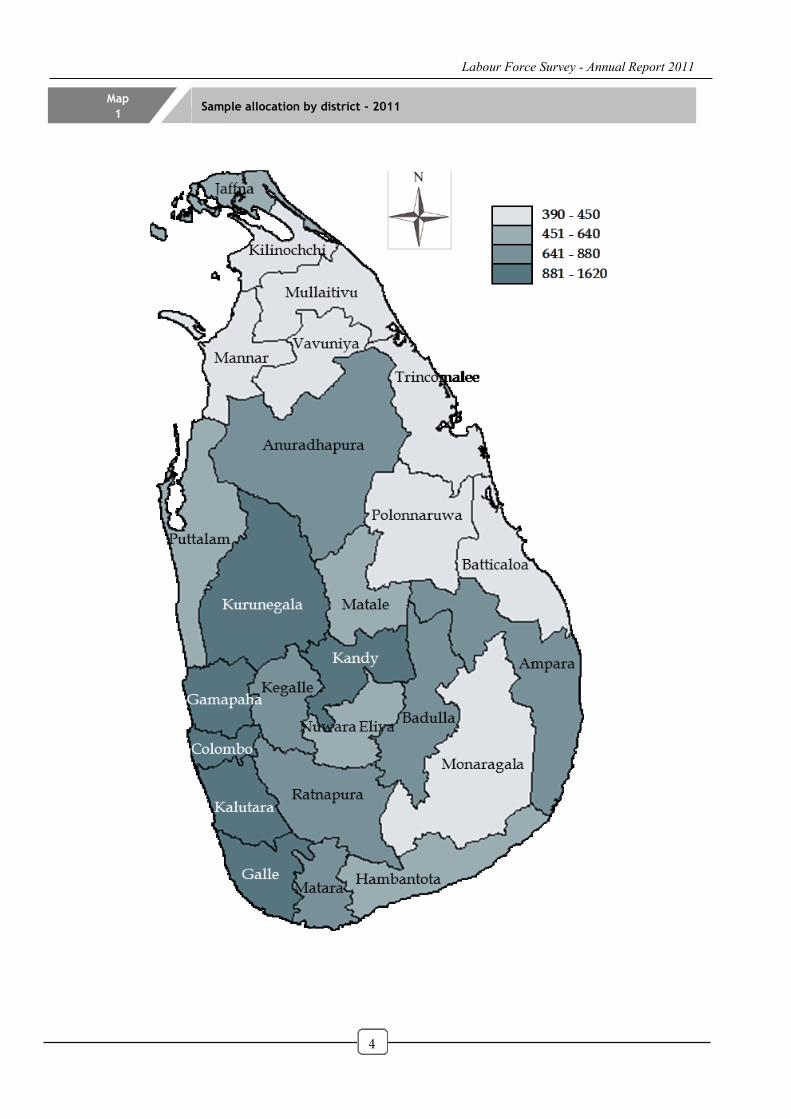
Map
1 Sample allocation by district - 2011
Labour Force Survey - Annual Report 2011
Labour Force Survey - Annual Report 2011
5
)(
1)(
)()(
)()(
1)( )(jk(u)
1
m
1 X
uh
ui
uhiuh
uhujk
uh uhjk
nX
n
Nm
P
)(
1)(
)(
)(
)()(
1)( )(jk(r)
1
m
1
rh
ri
rhi
rh
rhrjk
rh rh
nX
n
Nm
P
)(
1)(
)(
)(
)()(
1)( )(jk(e)
1
m
1
eh
ei
ehi
eh
ehejk
eh eh
nX
n
Nm
P
)(ujkm
)(uhP
)(
1
)(
)()(
ujh
h
ujh
ujhuh
MS
SP
)(ujhS
)(uhN
)(uhn
)(uhiX
)(ujhM
12
1
X12
1 X
k
jkj
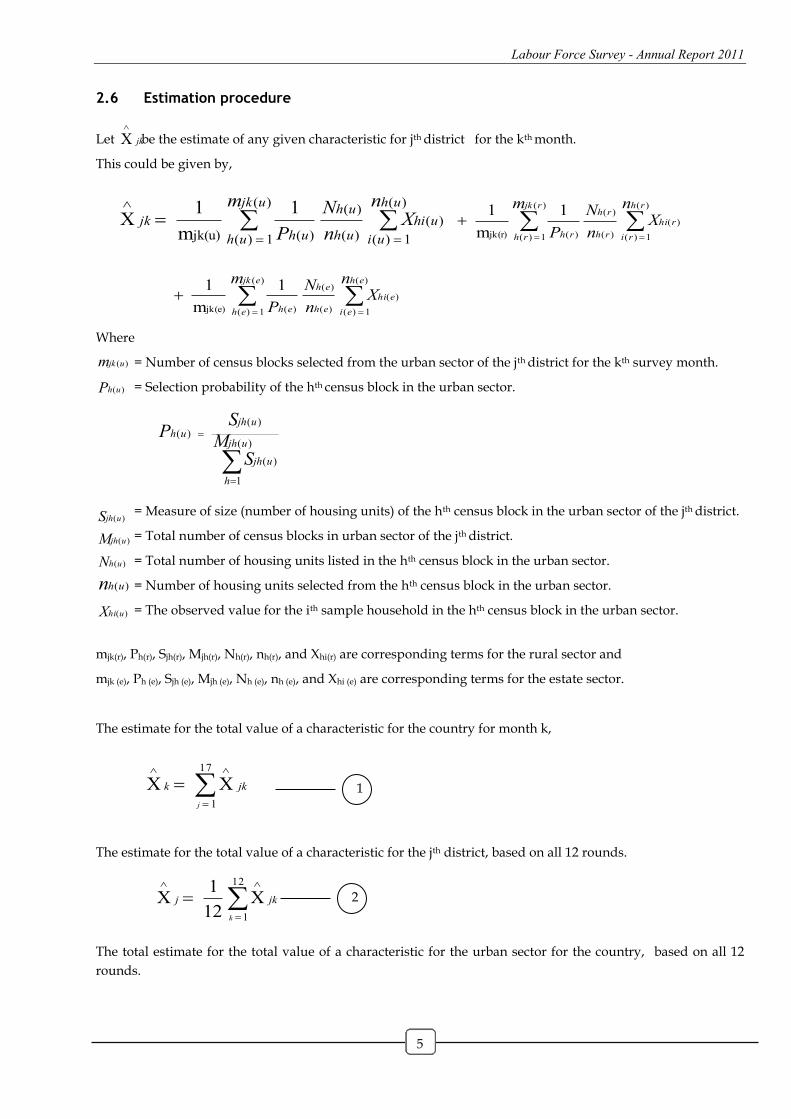
2.6 Estimation procedure
Let be the estimate of any given characteristic for jth district for the kth month.
This could be given by,
Where
= Number of census blocks selected from the urban sector of the jth district for the kth survey month.
= Selection probability of the hth census block in the urban sector.
= Measure of size (number of housing units) of the hth census block in the urban sector of the jth district.
= Total number of census blocks in urban sector of the jth district.
= Total number of housing units listed in the hth census block in the urban sector.
= Number of housing units selected from the hth census block in the urban sector.
= The observed value for the ith sample household in the hth census block in the urban sector.
mjk(r), Ph(r), Sjh(r), Mjh(r), Nh(r), nh(r), and Xhi(r) are corresponding terms for the rural sector and
mjk (e), Ph (e), Sjh (e), Mjh (e), Nh (e), nh (e), and Xhi (e) are corresponding terms for the estate sector.
The estimate for the total value of a characteristic for the country for month k,
The estimate for the total value of a characteristic for the jth district, based on all 12 rounds.
The total estimate for the total value of a characteristic for the urban sector for the country, based on all 12
rounds.
jk
X
17
1
X Xj
jkk 1
2
Labour Force Survey - Annual Report 2011
6
12
1
17
1
)(X12
1 X
k j
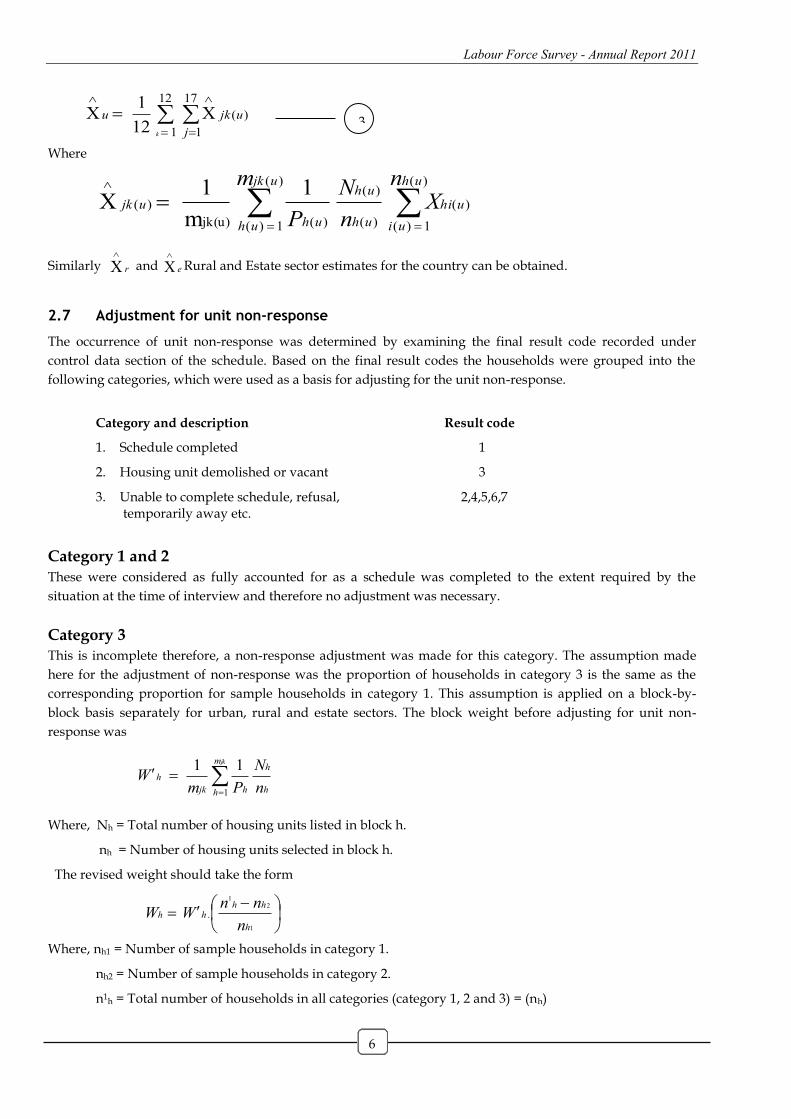
ujku
)(
1)(
)(
)(
)()(
1)( )(jk(u)
)(1
m
1 X
uh
ui
uhi
uh
uhujk
uh uh
ujk
nX
n
Nm
P
Where
Similarly and Rural and Estate sector estimates for the country can be obtained.
2.7 Adjustment for unit non-response
The occurrence of unit non-response was determined by examining the final result code recorded under
control data section of the schedule. Based on the final result codes the households were grouped into the
following categories, which were used as a basis for adjusting for the unit non-response.
Category and description Result code
1. Schedule completed 1
2. Housing unit demolished or vacant 3
3. Unable to complete schedule, refusal, 2,4,5,6,7 temporarily away etc.
Category 1 and 2
These were considered as fully accounted for as a schedule was completed to the extent required by the
situation at the time of interview and therefore no adjustment was necessary.
Category 3
This is incomplete therefore, a non-response adjustment was made for this category. The assumption made
here for the adjustment of non-response was the proportion of households in category 3 is the same as the
corresponding proportion for sample households in category 1. This assumption is applied on a block-by-
block basis separately for urban, rural and estate sectors. The block weight before adjusting for unit non-
response was
Where, Nh = Total number of housing units listed in block h.
nh = Number of housing units selected in block h.
The revised weight should take the form
Where, nh1 = Number of sample households in category 1.
nh2 = Number of sample households in category 2.
n1h = Total number of households in all categories (category 1, 2 and 3) = (nh)
r
X e
X
3
h
hm
h hjk
h
n
N
PmW
jk
1
11
1
21
.
h
hhhh
n
nnWW
Labour Force Survey - Annual Report 2011
7
Chapter
Economically Active/Inactive
Population
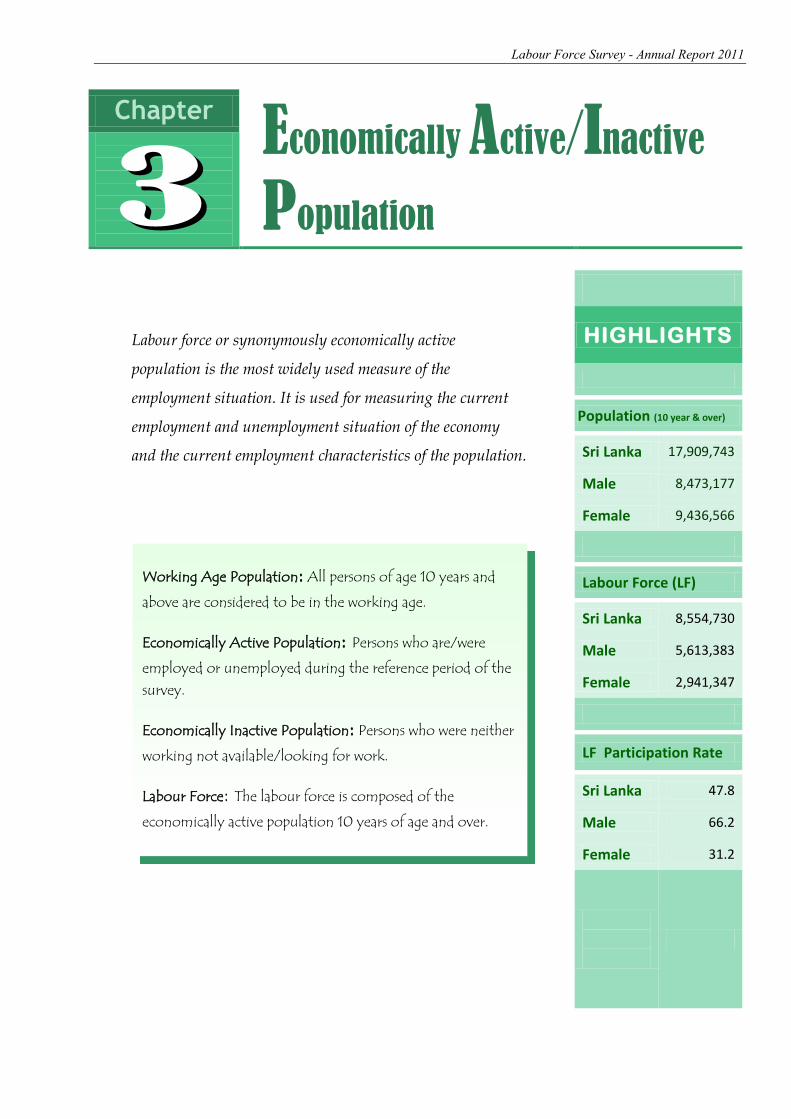
Labour force or synonymously economically active
population is the most widely used measure of the
employment situation. It is used for measuring the current
employment and unemployment situation of the economy
and the current employment characteristics of the population.
HIGHLIGHTS
Population (10 year & over)
Sri Lanka 17,909,743
Male 8,473,177
Female 9,436,566
Labour Force (LF)
Sri Lanka 8,554,730
Male 5,613,383
Female 2,941,347
LF Participation Rate
Sri Lanka 47.8
Male 66.2
Female 31.2
Working Age Population: All persons of age 10 years and
above are considered to be in the working age.
Economically Active Population: Persons who are/were
employed or unemployed during the reference period of the
survey.
Economically Inactive Population: Persons who were neither
working not available/looking for work.
Labour Force: The labour force is composed of the
economically active population 10 years of age and over.
Labour Force Survey - Annual Report 2011
8
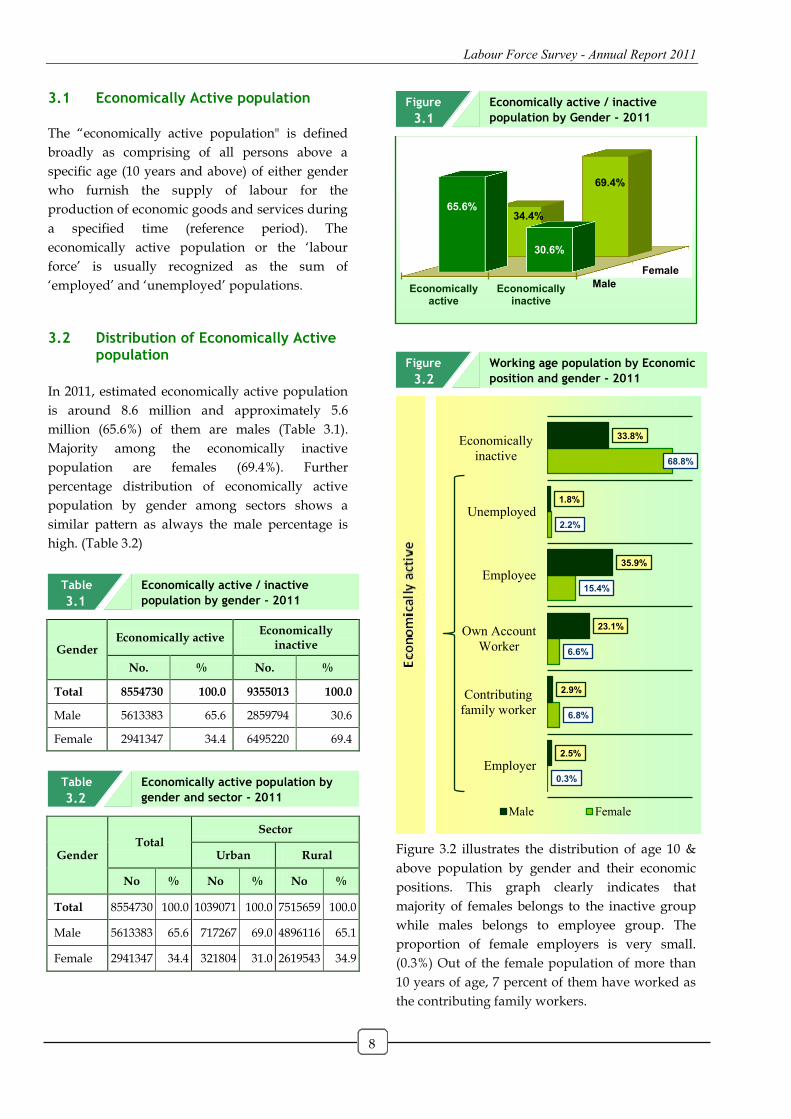
3.1 Economically Active population
The “economically active population" is defined
broadly as comprising of all persons above a
specific age (10 years and above) of either gender
who furnish the supply of labour for the
production of economic goods and services during
a specified time (reference period). The
economically active population or the „labour
force‟ is usually recognized as the sum of
„employed‟ and „unemployed‟ populations.
3.2 Distribution of Economically Active
population
In 2011, estimated economically active population
is around 8.6 million and approximately 5.6
million (65.6%) of them are males (Table 3.1).
Majority among the economically inactive
population are females (69.4%). Further
percentage distribution of economically active
population by gender among sectors shows a
similar pattern as always the male percentage is
high. (Table 3.2)
Gender Economically active
Economically inactive
No. % No. %
Total 8554730 100.0 9355013 100.0
Male 5613383 65.6 2859794 30.6
Female 2941347 34.4 6495220 69.4
Gender Total
Sector
Urban Rural
No % No % No %
Total 8554730 100.0 1039071 100.0 7515659 100.0
Male 5613383 65.6 717267 69.0 4896116 65.1
Female 2941347 34.4 321804 31.0 2619543 34.9
Figure 3.2 illustrates the distribution of age 10 &
above population by gender and their economic
positions. This graph clearly indicates that
majority of females belongs to the inactive group
while males belongs to employee group. The
proportion of female employers is very small.
(0.3%) Out of the female population of more than
10 years of age, 7 percent of them have worked as
the contributing family workers.
Male
Female
Economicallyactive
Economicallyinactive
65.6%
30.6%
34.4%
69.4%
0.3%
6.8%
6.6%
15.4%
2.2%
68.8%
2.5%
2.9%
23.1%
35.9%
1.8%
33.8%
Employer
Contributing
family worker
Own Account
Worker
Employee
Unemployed
Economically
inactive
Male Female
Economically active / inactive
population by gender - 2011
Economically active population by
gender and sector - 2011
Economically active / inactive
population by Gender - 2011
Working age population by Economic
position and gender - 2011
Table
3.1
Table
3.2
Figure
3.1
Figure
3.2
Labour Force Survey - Annual Report 2011
9
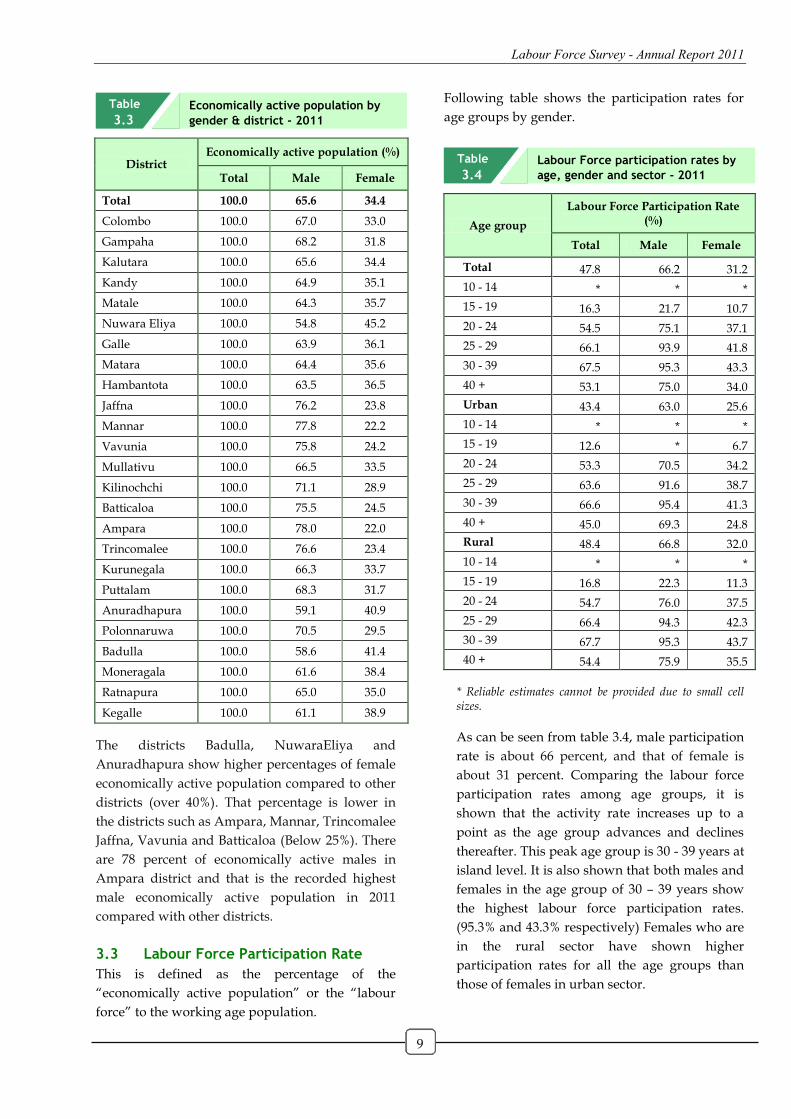
District Economically active population (%)
Total Male Female
Total 100.0 65.6 34.4
Colombo 100.0 67.0 33.0
Gampaha 100.0 68.2 31.8
Kalutara 100.0 65.6 34.4
Kandy 100.0 64.9 35.1
Matale 100.0 64.3 35.7
Nuwara Eliya 100.0 54.8 45.2
Galle 100.0 63.9 36.1
Matara 100.0 64.4 35.6
Hambantota 100.0 63.5 36.5
Jaffna 100.0 76.2 23.8
Mannar 100.0 77.8 22.2
Vavunia 100.0 75.8 24.2
Mullativu 100.0 66.5 33.5
Kilinochchi 100.0 71.1 28.9
Batticaloa 100.0 75.5 24.5
Ampara 100.0 78.0 22.0
Trincomalee 100.0 76.6 23.4
Kurunegala 100.0 66.3 33.7
Puttalam 100.0 68.3 31.7
Anuradhapura 100.0 59.1 40.9
Polonnaruwa 100.0 70.5 29.5
Badulla 100.0 58.6 41.4
Moneragala 100.0 61.6 38.4
Ratnapura 100.0 65.0 35.0
Kegalle 100.0 61.1 38.9
The districts Badulla, NuwaraEliya and
Anuradhapura show higher percentages of female
economically active population compared to other
districts (over 40%). That percentage is lower in
the districts such as Ampara, Mannar, Trincomalee
Jaffna, Vavunia and Batticaloa (Below 25%). There
are 78 percent of economically active males in
Ampara district and that is the recorded highest
male economically active population in 2011
compared with other districts.
3.3 Labour Force Participation Rate
This is defined as the percentage of the
“economically active population” or the “labour
force” to the working age population.
Following table shows the participation rates for
age groups by gender.
Age group
Labour Force Participation Rate (%)
Total Male Female
Total 47.8 66.2 31.2
10 - 14 * * *
15 - 19 16.3 21.7 10.7
20 - 24 54.5 75.1 37.1
25 - 29 66.1 93.9 41.8
30 - 39 67.5 95.3 43.3
40 + 53.1 75.0 34.0
Urban 43.4 63.0 25.6
10 - 14 * * *
15 - 19 12.6 * 6.7
20 - 24 53.3 70.5 34.2
25 - 29 63.6 91.6 38.7
30 - 39 66.6 95.4 41.3
40 + 45.0 69.3 24.8
Rural 48.4 66.8 32.0
10 - 14 * * *
15 - 19 16.8 22.3 11.3
20 - 24 54.7 76.0 37.5
25 - 29 66.4 94.3 42.3
30 - 39 67.7 95.3 43.7
40 + 54.4 75.9 35.5
* Reliable estimates cannot be provided due to small cell sizes.
As can be seen from table 3.4, male participation
rate is about 66 percent, and that of female is
about 31 percent. Comparing the labour force
participation rates among age groups, it is
shown that the activity rate increases up to a
point as the age group advances and declines
thereafter. This peak age group is 30 - 39 years at
island level. It is also shown that both males and
females in the age group of 30 – 39 years show
the highest labour force participation rates.
(95.3% and 43.3% respectively) Females who are
in the rural sector have shown higher
participation rates for all the age groups than
those of females in urban sector.
Economically active population by
gender & district - 2011
Labour Force participation rates by
age, gender and sector - 2011
Table
3.3
Table
3.4
Labour Force Survey - Annual Report 2011
10
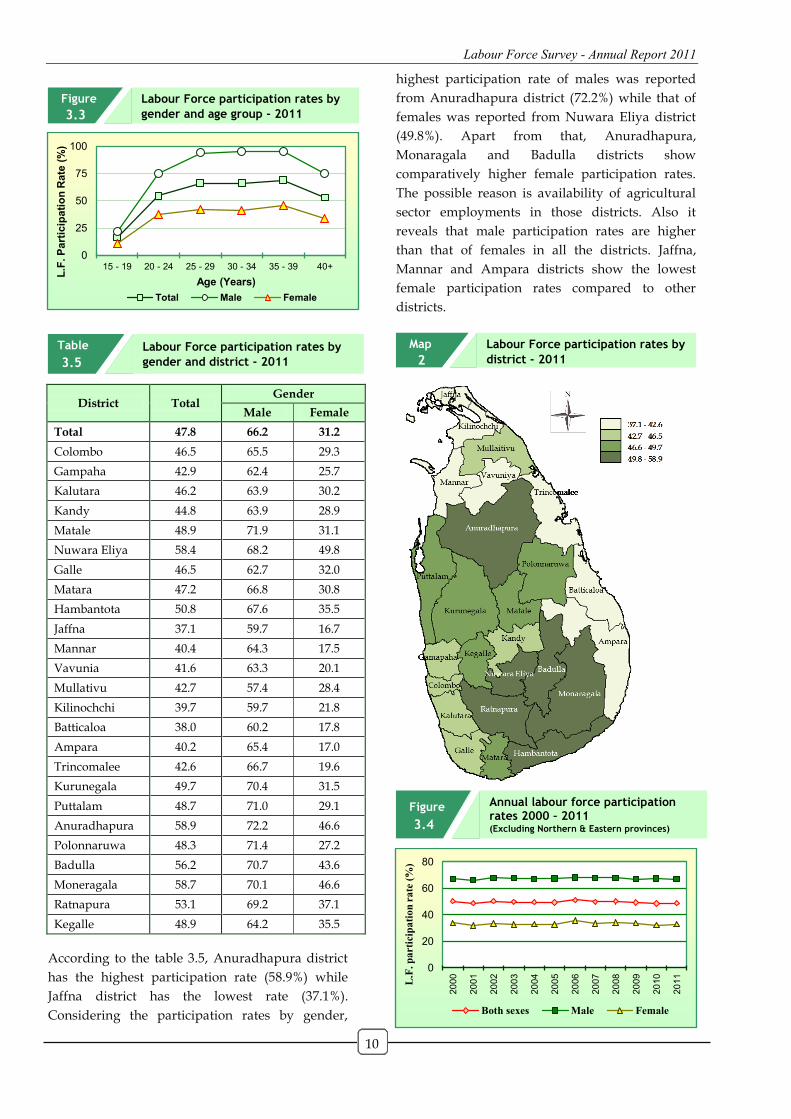
District Total Gender
Male Female
Total 47.8 66.2 31.2
Colombo 46.5 65.5 29.3
Gampaha 42.9 62.4 25.7
Kalutara 46.2 63.9 30.2
Kandy 44.8 63.9 28.9
Matale 48.9 71.9 31.1
Nuwara Eliya 58.4 68.2 49.8
Galle 46.5 62.7 32.0
Matara 47.2 66.8 30.8
Hambantota 50.8 67.6 35.5
Jaffna 37.1 59.7 16.7
Mannar 40.4 64.3 17.5
Vavunia 41.6 63.3 20.1
Mullativu 42.7 57.4 28.4
Kilinochchi 39.7 59.7 21.8
Batticaloa 38.0 60.2 17.8
Ampara 40.2 65.4 17.0
Trincomalee 42.6 66.7 19.6
Kurunegala 49.7 70.4 31.5
Puttalam 48.7 71.0 29.1
Anuradhapura 58.9 72.2 46.6
Polonnaruwa 48.3 71.4 27.2
Badulla 56.2 70.7 43.6
Moneragala 58.7 70.1 46.6
Ratnapura 53.1 69.2 37.1
Kegalle 48.9 64.2 35.5
According to the table 3.5, Anuradhapura district
has the highest participation rate (58.9%) while
Jaffna district has the lowest rate (37.1%).
Considering the participation rates by gender,
highest participation rate of males was reported
from Anuradhapura district (72.2%) while that of
females was reported from Nuwara Eliya district
(49.8%). Apart from that, Anuradhapura,
Monaragala and Badulla districts show
comparatively higher female participation rates.
The possible reason is availability of agricultural
sector employments in those districts. Also it
reveals that male participation rates are higher
than that of females in all the districts. Jaffna,
Mannar and Ampara districts show the lowest
female participation rates compared to other
districts.
0
25
50
75
100
15 - 19 20 - 24 25 - 29 30 - 34 35 - 39 40+
L.F
. P
art
icip
ati
on
Rate
(%
)
Age (Years)
Total Male Female
0
20
40
60
80
20
00
20
01
20
02
20
03
20
04
20
05
20
06
20
07
20
08
20
09
20
10
20
11
L.F
. p
arti
cip
ati
on
ra
te (
%)
Both sexes Male Female
Labour Force participation rates by
gender and age group - 2011
Labour Force participation rates by
gender and district - 2011
Labour Force participation rates by
district - 2011
Annual labour force participation rates 2000 – 2011 (Excluding Northern & Eastern provinces)
Figure
3.3
Table
3.5
Map
2
Figure
3.4
Labour Force Survey - Annual Report 2011
11
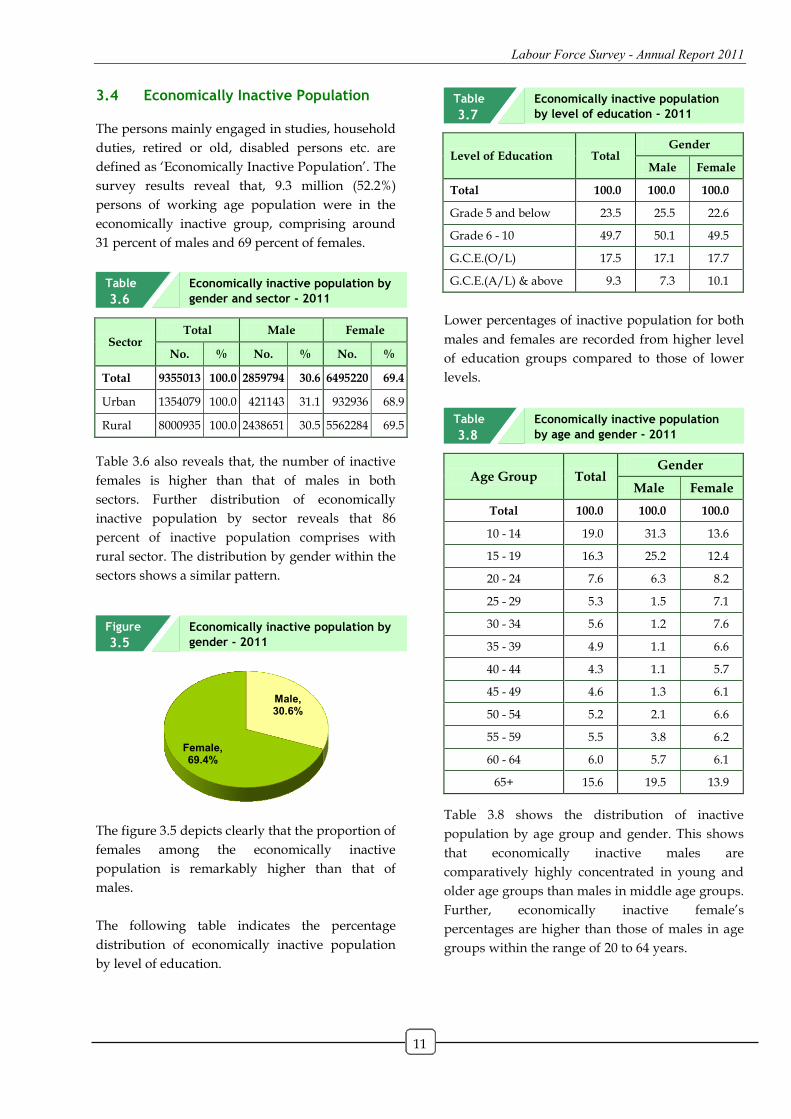
3.4 Economically Inactive Population
The persons mainly engaged in studies, household
duties, retired or old, disabled persons etc. are
defined as „Economically Inactive Population‟. The
survey results reveal that, 9.3 million (52.2%)
persons of working age population were in the
economically inactive group, comprising around
31 percent of males and 69 percent of females.
Sector Total Male Female
No. % No. % No. %
Total 9355013 100.0 2859794 30.6 6495220 69.4
Urban 1354079 100.0 421143 31.1 932936 68.9
Rural 8000935 100.0 2438651 30.5 5562284 69.5
Table 3.6 also reveals that, the number of inactive
females is higher than that of males in both
sectors. Further distribution of economically
inactive population by sector reveals that 86
percent of inactive population comprises with
rural sector. The distribution by gender within the
sectors shows a similar pattern.
The figure 3.5 depicts clearly that the proportion of
females among the economically inactive
population is remarkably higher than that of
males.
The following table indicates the percentage
distribution of economically inactive population
by level of education.
Level of Education Total Gender
Male Female
Total 100.0 100.0 100.0
Grade 5 and below 23.5 25.5 22.6
Grade 6 - 10 49.7 50.1 49.5
G.C.E.(O/L) 17.5 17.1 17.7
G.C.E.(A/L) & above 9.3 7.3 10.1
Lower percentages of inactive population for both
males and females are recorded from higher level
of education groups compared to those of lower
levels.
Age Group Total Gender
Male Female
Total 100.0 100.0 100.0
10 - 14 19.0 31.3 13.6
15 - 19 16.3 25.2 12.4
20 - 24 7.6 6.3 8.2
25 - 29 5.3 1.5 7.1
30 - 34 5.6 1.2 7.6
35 - 39 4.9 1.1 6.6
40 - 44 4.3 1.1 5.7
45 - 49 4.6 1.3 6.1
50 - 54 5.2 2.1 6.6
55 - 59 5.5 3.8 6.2
60 - 64 6.0 5.7 6.1
65+ 15.6 19.5 13.9
Table 3.8 shows the distribution of inactive
population by age group and gender. This shows
that economically inactive males are
comparatively highly concentrated in young and
older age groups than males in middle age groups.
Further, economically inactive female‟s
percentages are higher than those of males in age
groups within the range of 20 to 64 years.
Male, 30.6%
Female, 69.4%
Economically inactive population by
gender and sector - 2011
Economically inactive population by
gender - 2011
Economically inactive population
by level of education - 2011
Economically inactive population
by age and gender - 2011
Table
3.6
Figure
3.5
Table
3.7
Table
3.8
Labour Force Survey - Annual Report 2011
12
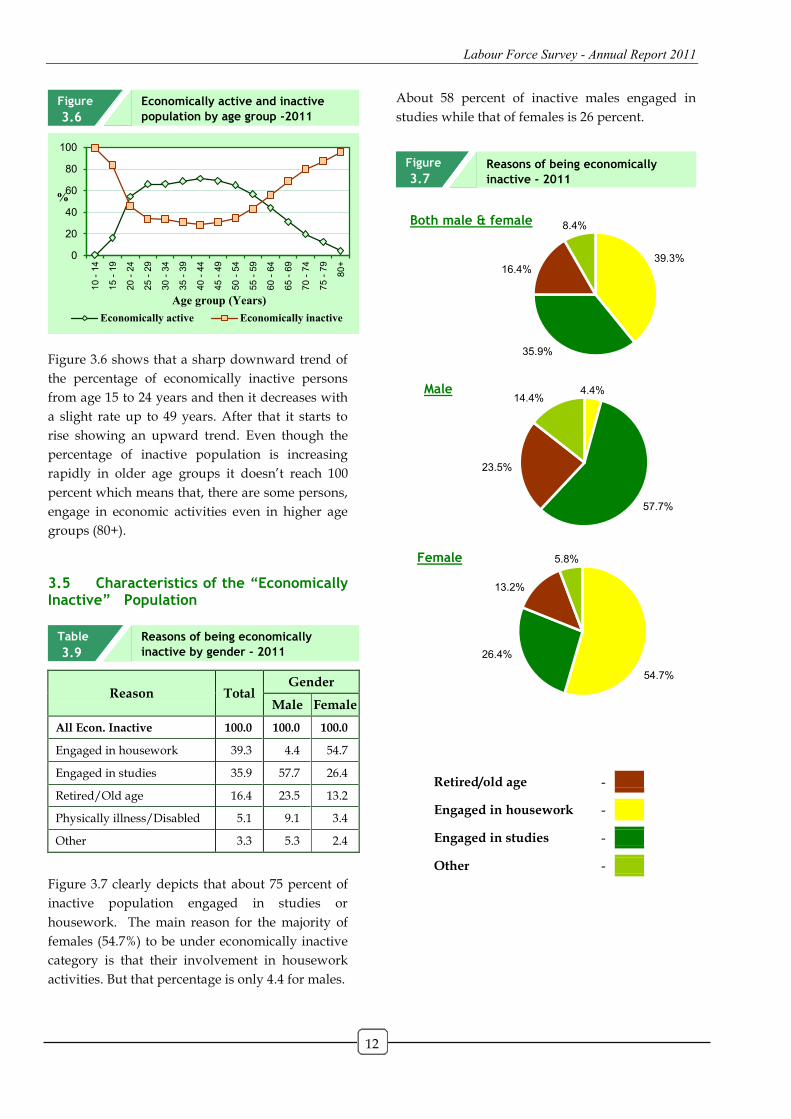
Figure 3.6 shows that a sharp downward trend of
the percentage of economically inactive persons
from age 15 to 24 years and then it decreases with
a slight rate up to 49 years. After that it starts to
rise showing an upward trend. Even though the
percentage of inactive population is increasing
rapidly in older age groups it doesn‟t reach 100
percent which means that, there are some persons,
engage in economic activities even in higher age
groups (80+).
3.5 Characteristics of the “Economically Inactive” Population
Reason Total Gender
Male Female
All Econ. Inactive 100.0 100.0 100.0
Engaged in housework 39.3 4.4 54.7
Engaged in studies 35.9 57.7 26.4
Retired/Old age 16.4 23.5 13.2
Physically illness/Disabled 5.1 9.1 3.4
Other 3.3 5.3 2.4
Figure 3.7 clearly depicts that about 75 percent of
inactive population engaged in studies or
housework. The main reason for the majority of
females (54.7%) to be under economically inactive
category is that their involvement in housework
activities. But that percentage is only 4.4 for males.
About 58 percent of inactive males engaged in
studies while that of females is 26 percent.
Retired/old age -
Engaged in housework -
Engaged in studies -
Other -
0
20
40
60
80
100
10 -
14
15
- 1
9
20
- 2
4
25
- 2
9
30
- 3
4
35
- 3
9
40
- 4
4
45
- 4
9
50
- 5
4
55
- 5
9
60
- 6
4
65
- 6
9
70
- 7
4
75
- 7
9
80
+
%
Age group (Years)
Economically active Economically inactive
39.3%
35.9%
16.4%
8.4% Both male & female
4.4%
57.7%
23.5%
14.4% Male
54.7%
26.4%
13.2%
5.8% Female
Economically active and inactive
population by age group -2011
Reasons of being economically
inactive by gender - 2011
Reasons of being economically
inactive - 2011
Figure
3.6
Table
3.9
Figure
3.7
Labour Force Survey - Annual Report 2011
13
Chapter
Employment
Employment data plays an important role as a viable social
indicator of understanding the economy of the country.
Furthermore, statistics on employment identify the number
of people, who are employed, the sorts of work they do, their
qualifications towards the job and their working patterns.
Availability of accurate employment statistics is vital for the
policy makers to implement job creation policies and
programmes properly.
HIGHLIGHTS
Labour Force
Sri Lanka 8,554,730
Male 5,613,383
Female 2,941,347
Employed Population
Sri Lanka 8,196,927
Male 5,460,328
Female 2,736,599
Employment Rate
Sri Lanka 95.8
Male 97.3
Female 93.0
Employed
During the reference period, persons, who worked as
paid employees, employers, own account workers (self
employed), or contributing family workers are said to be
employed. This includes persons with a job but not at
work during the reference period
Reference Period : Previous week of the survey week
Labour Force Survey - Annual Report 2011
14
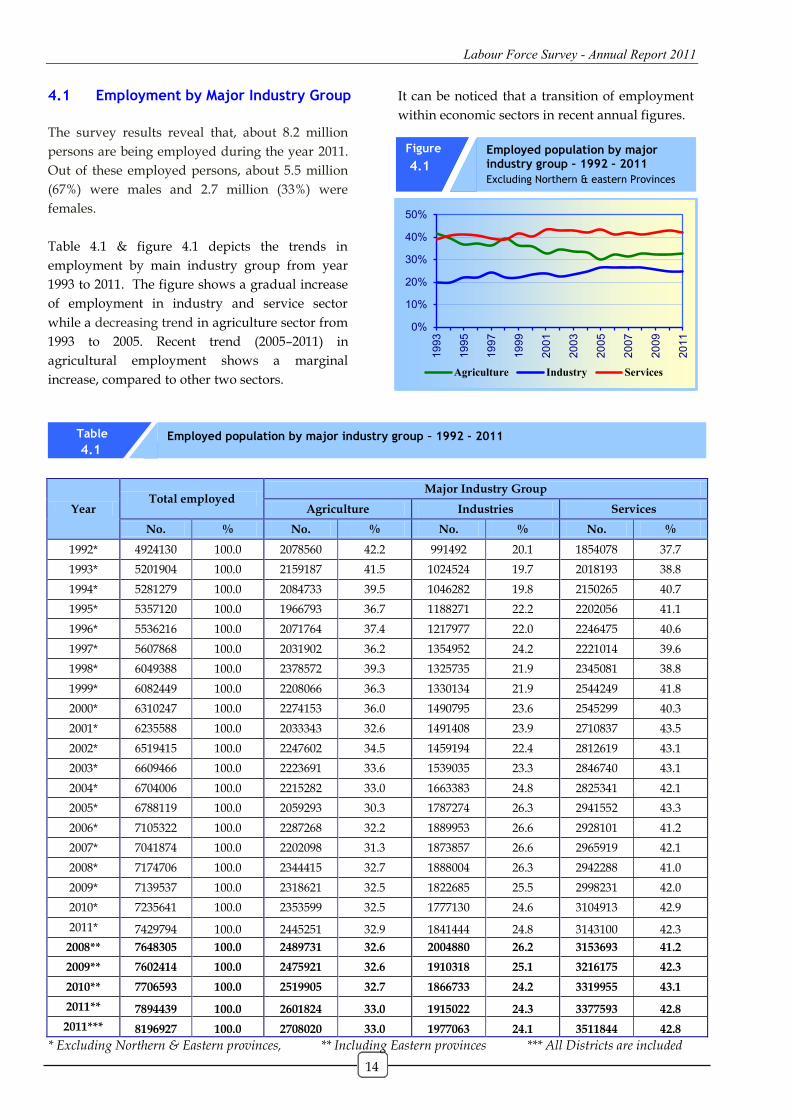
4.1 Employment by Major Industry Group
The survey results reveal that, about 8.2 million
persons are being employed during the year 2011.
Out of these employed persons, about 5.5 million
(67%) were males and 2.7 million (33%) were
females.
Table 4.1 & figure 4.1 depicts the trends in
employment by main industry group from year
1993 to 2011. The figure shows a gradual increase
of employment in industry and service sector
while a decreasing trend in agriculture sector from
1993 to 2005. Recent trend (2005–2011) in
agricultural employment shows a marginal
increase, compared to other two sectors.
Year Total employed
Major Industry Group
Agriculture Industries Services
No. % No. % No. % No. %
1992* 4924130 100.0 2078560 42.2 991492 20.1 1854078 37.7
1993* 5201904 100.0 2159187 41.5 1024524 19.7 2018193 38.8
1994* 5281279 100.0 2084733 39.5 1046282 19.8 2150265 40.7
1995* 5357120 100.0 1966793 36.7 1188271 22.2 2202056 41.1
1996* 5536216 100.0 2071764 37.4 1217977 22.0 2246475 40.6
1997* 5607868 100.0 2031902 36.2 1354952 24.2 2221014 39.6
1998* 6049388 100.0 2378572 39.3 1325735 21.9 2345081 38.8
1999* 6082449 100.0 2208066 36.3 1330134 21.9 2544249 41.8
2000* 6310247 100.0 2274153 36.0 1490795 23.6 2545299 40.3
2001* 6235588 100.0 2033343 32.6 1491408 23.9 2710837 43.5
2002* 6519415 100.0 2247602 34.5 1459194 22.4 2812619 43.1
2003* 6609466 100.0 2223691 33.6 1539035 23.3 2846740 43.1
2004* 6704006 100.0 2215282 33.0 1663383 24.8 2825341 42.1
2005* 6788119 100.0 2059293 30.3 1787274 26.3 2941552 43.3
2006* 7105322 100.0 2287268 32.2 1889953 26.6 2928101 41.2
2007* 7041874 100.0 2202098 31.3 1873857 26.6 2965919 42.1
2008* 7174706 100.0 2344415 32.7 1888004 26.3 2942288 41.0
2009* 7139537 100.0 2318621 32.5 1822685 25.5 2998231 42.0
2010* 7235641 100.0 2353599 32.5 1777130 24.6 3104913 42.9
2011* 7429794 100.0 2445251 32.9 1841444 24.8 3143100 42.3
2008** 7648305 100.0 2489731 32.6 2004880 26.2 3153693 41.2
2009** 7602414 100.0 2475921 32.6 1910318 25.1 3216175 42.3
2010** 7706593 100.0 2519905 32.7 1866733 24.2 3319955 43.1
2011** 7894439 100.0 2601824 33.0 1915022 24.3 3377593 42.8
2011*** 8196927 100.0 2708020 33.0 1977063 24.1 3511844 42.8
* Excluding Northern & Eastern provinces, ** Including Eastern provinces *** All Districts are included
0%
10%
20%
30%
40%
50%
19
93
19
95
19
97
19
99
20
01
20
03
20
05
20
07
20
09
20
11
Agriculture Industry Services
Employed population by major industry group – 1992 – 2011
Excluding Northern & eastern Provinces
Table
4.1
Figure
4.1
Employed population by major industry group – 1992 - 2011
It can be noticed that a transition of employment
within economic sectors in recent annual figures.
Labour Force Survey - Annual Report 2011
15
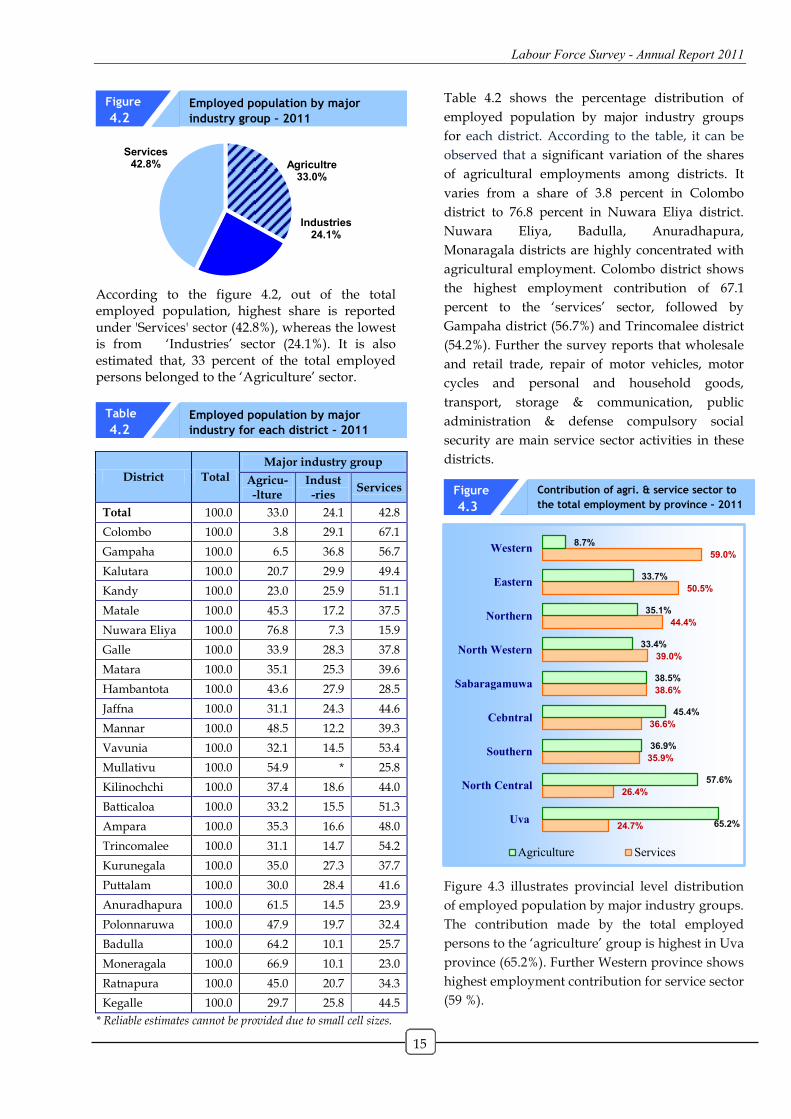
According to the figure 4.2, out of the total employed population, highest share is reported under 'Services' sector (42.8%), whereas the lowest is from „Industries‟ sector (24.1%). It is also estimated that, 33 percent of the total employed persons belonged to the „Agriculture‟ sector.
District Total
Major industry group
Agricu- -lture
Indust -ries
Services
Total 100.0 33.0 24.1 42.8
Colombo 100.0 3.8 29.1 67.1
Gampaha 100.0 6.5 36.8 56.7
Kalutara 100.0 20.7 29.9 49.4
Kandy 100.0 23.0 25.9 51.1
Matale 100.0 45.3 17.2 37.5
Nuwara Eliya 100.0 76.8 7.3 15.9
Galle 100.0 33.9 28.3 37.8
Matara 100.0 35.1 25.3 39.6
Hambantota 100.0 43.6 27.9 28.5
Jaffna 100.0 31.1 24.3 44.6
Mannar 100.0 48.5 12.2 39.3
Vavunia 100.0 32.1 14.5 53.4
Mullativu 100.0 54.9 * 25.8
Kilinochchi 100.0 37.4 18.6 44.0
Batticaloa 100.0 33.2 15.5 51.3
Ampara 100.0 35.3 16.6 48.0
Trincomalee 100.0 31.1 14.7 54.2
Kurunegala 100.0 35.0 27.3 37.7
Puttalam 100.0 30.0 28.4 41.6
Anuradhapura 100.0 61.5 14.5 23.9
Polonnaruwa 100.0 47.9 19.7 32.4
Badulla 100.0 64.2 10.1 25.7
Moneragala 100.0 66.9 10.1 23.0
Ratnapura 100.0 45.0 20.7 34.3
Kegalle 100.0 29.7 25.8 44.5
* Reliable estimates cannot be provided due to small cell sizes.
Table 4.2 shows the percentage distribution of
employed population by major industry groups
for each district. According to the table, it can be
observed that a significant variation of the shares
of agricultural employments among districts. It
varies from a share of 3.8 percent in Colombo
district to 76.8 percent in Nuwara Eliya district.
Nuwara Eliya, Badulla, Anuradhapura,
Monaragala districts are highly concentrated with
agricultural employment. Colombo district shows
the highest employment contribution of 67.1
percent to the „services‟ sector, followed by
Gampaha district (56.7%) and Trincomalee district
(54.2%). Further the survey reports that wholesale
and retail trade, repair of motor vehicles, motor
cycles and personal and household goods,
transport, storage & communication, public
administration & defense compulsory social
security are main service sector activities in these
districts.
Figure 4.3 illustrates provincial level distribution
of employed population by major industry groups.
The contribution made by the total employed
persons to the „agriculture‟ group is highest in Uva
province (65.2%). Further Western province shows
highest employment contribution for service sector
(59 %).
Agricultre 33.0%
Industries 24.1%
Services 42.8%
24.7%
26.4%
35.9%
36.6%
38.6%
39.0%
44.4%
50.5%
59.0%
65.2%
57.6%
36.9%
45.4%
38.5%
33.4%
35.1%
33.7%
8.7%
Uva
North Central
Southern
Cebntral
Sabaragamuwa
North Western
Northern
Eastern
Western
Agriculture Services
Employed population by major
industry group – 2011
Employed population by major
industry for each district – 2011
Contribution of agri. & service sector to
the total employment by province – 2011
Figure
4.2
Table
4.2
Figure
4.3
Labour Force Survey - Annual Report 2011
16
4.2 Employment by Status
District Own account
worker Contributing
family worker
Total 31.5 10.8
Colombo 22.3 4.5
Gampaha 22.9 3.7
Kalutara 28.9 7.3
Kandy 29.8 8.4
Matale 38.3 20.1
Nuwara Eliya 24.5 16.0
Galle 25.7 10.5
Matara 30.5 5.7
Hambantota 43.4 16.0
Jaffna 32.1 *
Mannar 38.8 *
Vavunia 29.6 *
Mullativu 41.7 *
Kilinochchi 42.4 *
Batticaloa 33.6 *
Ampara 28.6 *
Trincomalee 31.7 *
Kurunegala 40.6 11.6
Puttalam 33.7 9.8
Anuradhapura 38.4 30.7
Polonnaruwa 45.0 13.8
Badulla 33.1 22.4
Moneragala 47.4 29.0
Ratnapura 34.5 10.1
Kegalle 31.5 8.0 * Reliable estimates cannot be provided due to small cell sizes.
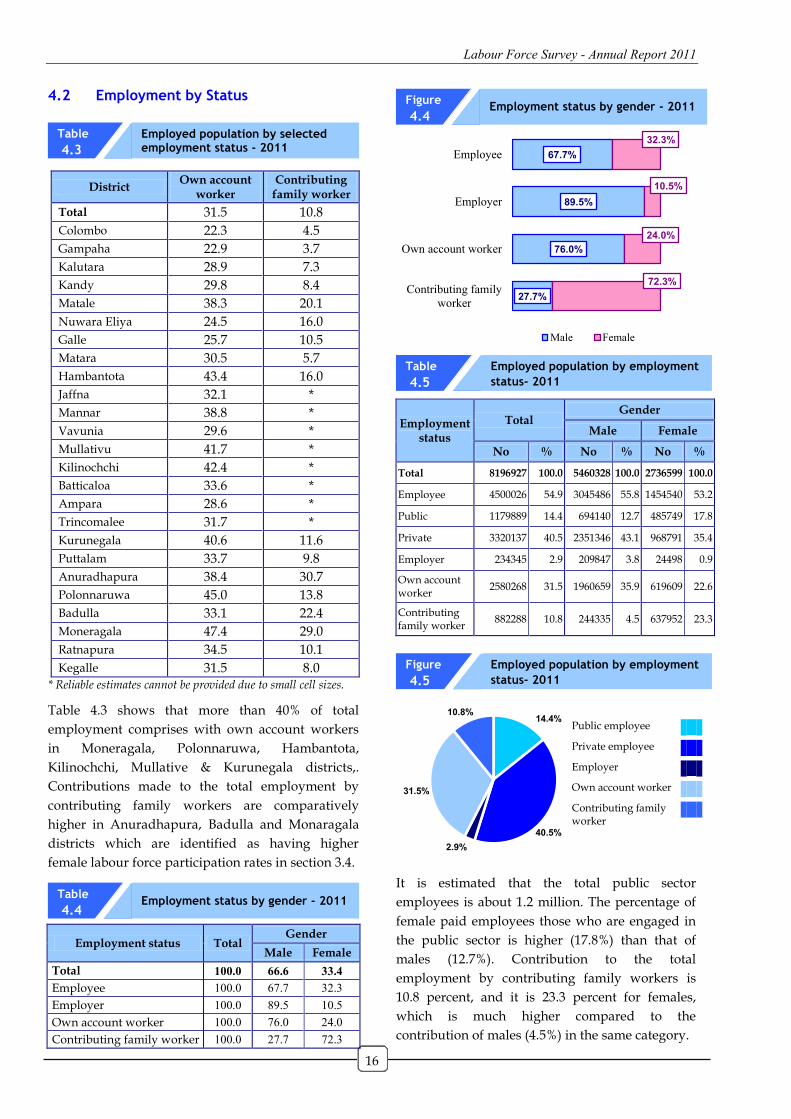
Table 4.3 shows that more than 40% of total
employment comprises with own account workers
in Moneragala, Polonnaruwa, Hambantota,
Kilinochchi, Mullative & Kurunegala districts,.
Contributions made to the total employment by
contributing family workers are comparatively
higher in Anuradhapura, Badulla and Monaragala
districts which are identified as having higher
female labour force participation rates in section 3.4.
Employment status Total Gender
Male Female
Total 100.0 66.6 33.4
Employee 100.0 67.7 32.3
Employer 100.0 89.5 10.5
Own account worker 100.0 76.0 24.0
Contributing family worker 100.0 27.7 72.3
Employment status
Total Gender
Male Female
No % No % No %
Total 8196927 100.0 5460328 100.0 2736599 100.0
Employee 4500026 54.9 3045486 55.8 1454540 53.2
Public 1179889 14.4 694140 12.7 485749 17.8
Private 3320137 40.5 2351346 43.1 968791 35.4
Employer 234345 2.9 209847 3.8 24498 0.9
Own account worker
2580268 31.5 1960659 35.9 619609 22.6
Contributing family worker
882288 10.8 244335 4.5 637952 23.3
It is estimated that the total public sector
employees is about 1.2 million. The percentage of
female paid employees those who are engaged in
the public sector is higher (17.8%) than that of
males (12.7%). Contribution to the total
employment by contributing family workers is
10.8 percent, and it is 23.3 percent for females,
which is much higher compared to the
contribution of males (4.5%) in the same category.
27.7%
76.0%
89.5%
67.7%
72.3%
24.0%
10.5%
32.3%
Contributing family
worker
Own account worker
Employer
Employee
Male Female
Public employee
Private employee
Employer
Own account worker
Contributing family worker
Employed population by selected employment status - 2011
Employment status by gender - 2011
Employment status by gender - 2011
Employed population by employment
status- 2011
Employed population by employment
status- 2011
Table
4.3
Table
4.4
Figure
4.4
Table
4.5
Figure
4.5
14.4%
40.5%
2.9%
31.5%
10.8%
Labour Force Survey - Annual Report 2011
17
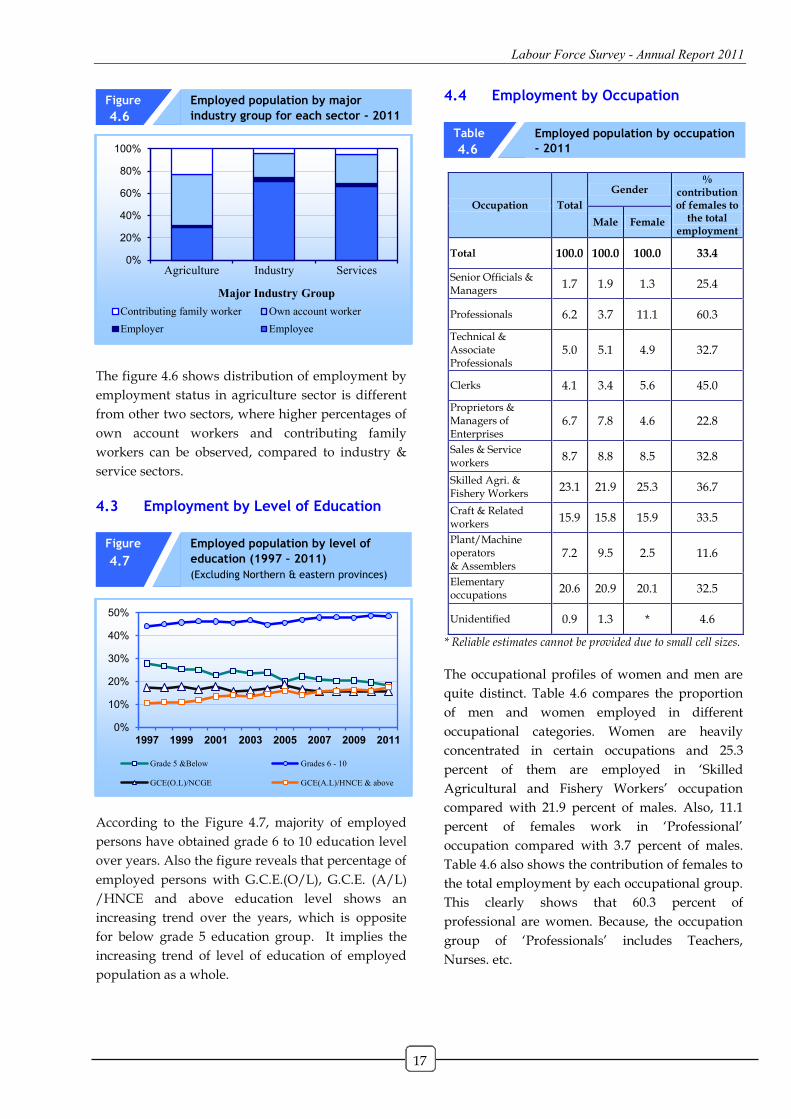
The figure 4.6 shows distribution of employment by
employment status in agriculture sector is different
from other two sectors, where higher percentages of
own account workers and contributing family
workers can be observed, compared to industry &
service sectors.
4.3 Employment by Level of Education
According to the Figure 4.7, majority of employed
persons have obtained grade 6 to 10 education level
over years. Also the figure reveals that percentage of
employed persons with G.C.E.(O/L), G.C.E. (A/L)
/HNCE and above education level shows an
increasing trend over the years, which is opposite
for below grade 5 education group. It implies the
increasing trend of level of education of employed
population as a whole.
4.4 Employment by Occupation
Occupation Total
Gender %
contribution of females to
the total employment
Male Female
Total 100.0 100.0 100.0 33.4
Senior Officials & Managers
1.7 1.9 1.3 25.4
Professionals 6.2 3.7 11.1 60.3
Technical & Associate Professionals
5.0 5.1 4.9 32.7
Clerks 4.1 3.4 5.6 45.0
Proprietors & Managers of Enterprises
6.7 7.8 4.6 22.8
Sales & Service workers
8.7 8.8 8.5 32.8
Skilled Agri. & Fishery Workers
23.1 21.9 25.3 36.7
Craft & Related workers
15.9 15.8 15.9 33.5
Plant/Machine operators & Assemblers
7.2 9.5 2.5 11.6
Elementary occupations
20.6 20.9 20.1 32.5
Unidentified 0.9 1.3 * 4.6
* Reliable estimates cannot be provided due to small cell sizes.
The occupational profiles of women and men are
quite distinct. Table 4.6 compares the proportion
of men and women employed in different
occupational categories. Women are heavily
concentrated in certain occupations and 25.3
percent of them are employed in „Skilled
Agricultural and Fishery Workers‟ occupation
compared with 21.9 percent of males. Also, 11.1
percent of females work in „Professional‟
occupation compared with 3.7 percent of males.
Table 4.6 also shows the contribution of females to
the total employment by each occupational group.
This clearly shows that 60.3 percent of
professional are women. Because, the occupation
group of „Professionals‟ includes Teachers,
Nurses. etc.
0%
20%
40%
60%
80%
100%
Agriculture Industry Services
Major Industry Group
Contributing family worker Own account worker
Employer Employee
0%
10%
20%
30%
40%
50%
1997 1999 2001 2003 2005 2007 2009 2011
Grade 5 &Below Grades 6 - 10
GCE(O.L)/NCGE GCE(A.L)/HNCE & above
Employed population by major
industry group for each sector - 2011
Employed population by level of
education (1997 – 2011)
(Excluding Northern & eastern provinces)
Employed population by occupation
- 2011
Figure
4.6
Figure
4.7
Table
4.6
Labour Force Survey - Annual Report 2011
18
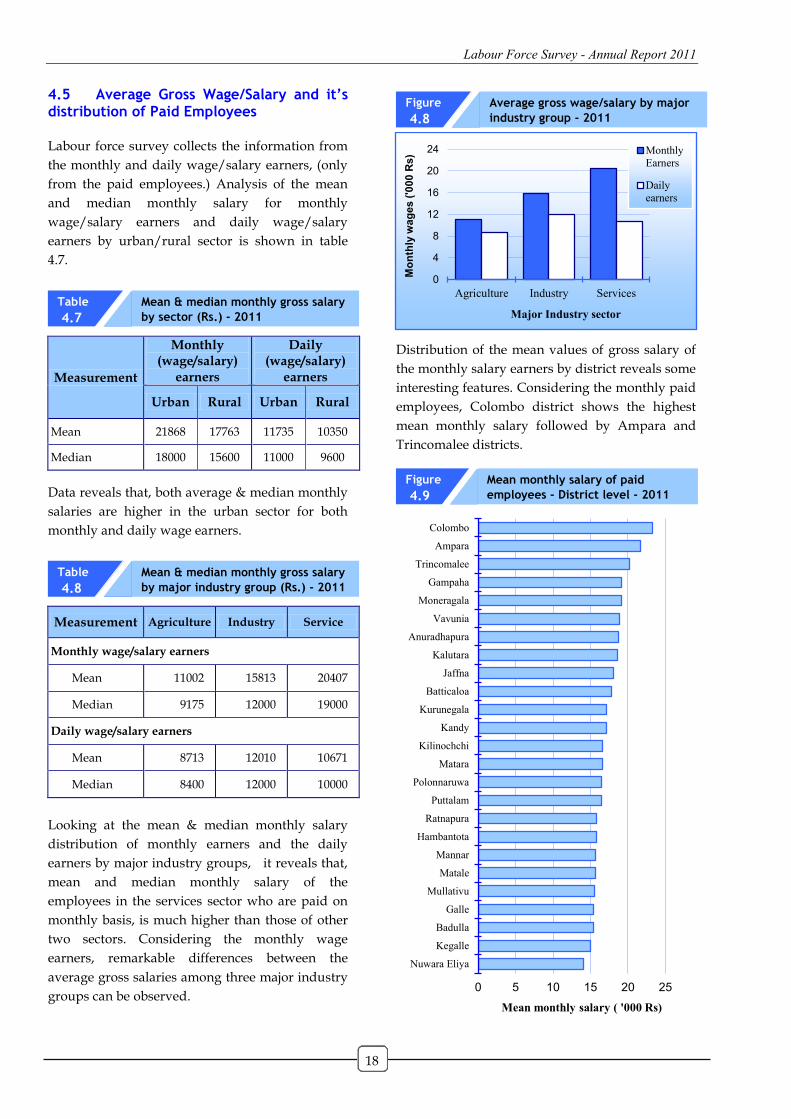
4.5 Average Gross Wage/Salary and it’s distribution of Paid Employees Labour force survey collects the information from
the monthly and daily wage/salary earners, (only
from the paid employees.) Analysis of the mean
and median monthly salary for monthly
wage/salary earners and daily wage/salary
earners by urban/rural sector is shown in table
4.7.
Measurement
Monthly (wage/salary)
earners
Daily (wage/salary)
earners
Urban Rural Urban Rural
Mean 21868 17763 11735 10350
Median 18000 15600 11000 9600
Data reveals that, both average & median monthly
salaries are higher in the urban sector for both
monthly and daily wage earners.
Measurement Agriculture Industry Service
Monthly wage/salary earners
Mean 11002 15813 20407
Median 9175 12000 19000
Daily wage/salary earners
Mean 8713 12010 10671
Median 8400 12000 10000
Looking at the mean & median monthly salary
distribution of monthly earners and the daily
earners by major industry groups, it reveals that,
mean and median monthly salary of the
employees in the services sector who are paid on
monthly basis, is much higher than those of other
two sectors. Considering the monthly wage
earners, remarkable differences between the
average gross salaries among three major industry
groups can be observed.
Distribution of the mean values of gross salary of
the monthly salary earners by district reveals some
interesting features. Considering the monthly paid
employees, Colombo district shows the highest
mean monthly salary followed by Ampara and
Trincomalee districts.
0
4
8
12
16
20
24
Agriculture Industry Services
Mo
nth
ly w
ag
es (
'000 R
s)
Major Industry sector
Monthly
Earners
Daily
earners
0 5 10 15 20 25
Nuwara Eliya
Kegalle
Badulla
Galle
Mullativu
Matale
Mannar
Hambantota
Ratnapura
Puttalam
Polonnaruwa
Matara
Kilinochchi
Kandy
Kurunegala
Batticaloa
Jaffna
Kalutara
Anuradhapura
Vavunia
Moneragala
Gampaha
Trincomalee
Ampara
Colombo
Mean monthly salary ( '000 Rs)
Mean & median monthly gross salary
by sector (Rs.) - 2011
Mean & median monthly gross salary
by major industry group (Rs.) - 2011
Average gross wage/salary by major
industry group - 2011
Mean monthly salary of paid
employees - District level - 2011
Table
4.7
Table
4.8
Figure
4.8
Figure
4.9
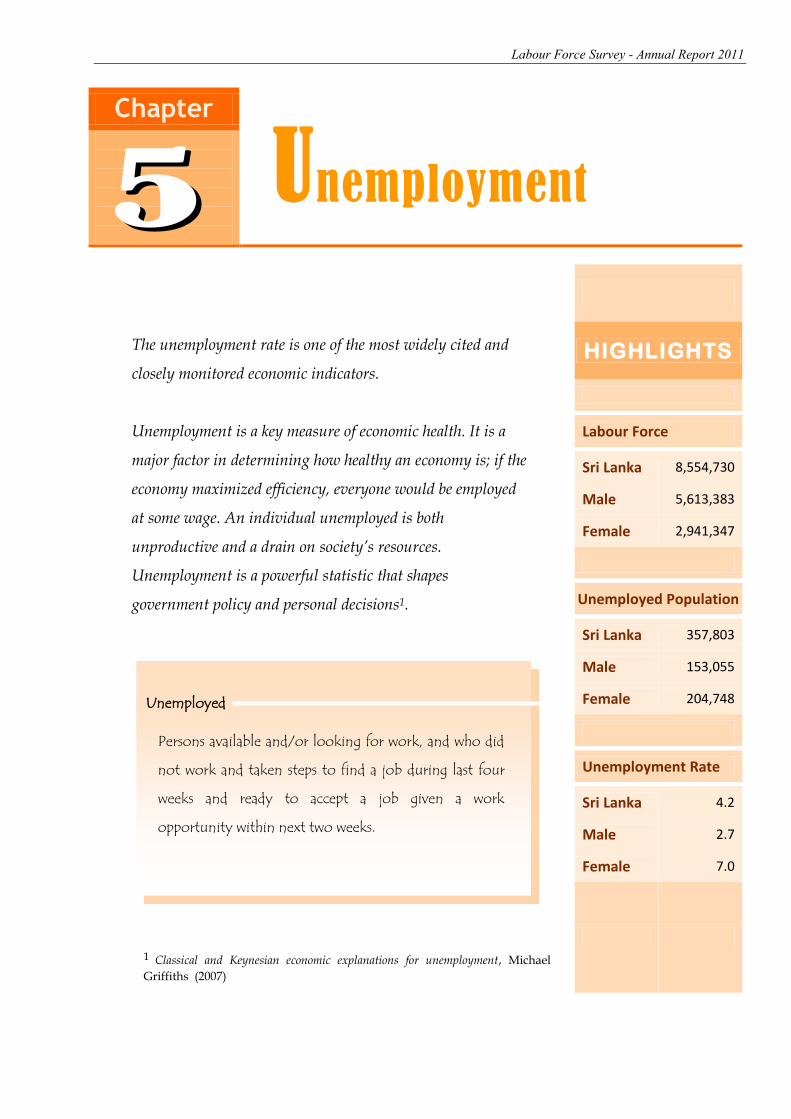
Labour Force Survey - Annual Report 2011
19
Chapter
Unemployment
The unemployment rate is one of the most widely cited and
closely monitored economic indicators.
Unemployment is a key measure of economic health. It is a
major factor in determining how healthy an economy is; if the
economy maximized efficiency, everyone would be employed
at some wage. An individual unemployed is both
unproductive and a drain on society’s resources.
Unemployment is a powerful statistic that shapes
government policy and personal decisions1.
1 Classical and Keynesian economic explanations for unemployment, Michael
Griffiths (2007)
HIGHLIGHTS
Labour Force
Sri Lanka 8,554,730
Male 5,613,383
Female 2,941,347
Unemployed Population
Sri Lanka 357,803
Male 153,055
Female 204,748
Unemployment Rate
Sri Lanka 4.2
Male 2.7
Female 7.0
Unemployed
Persons available and/or looking for work, and who did
not work and taken steps to find a job during last four
weeks and ready to accept a job given a work
opportunity within next two weeks.
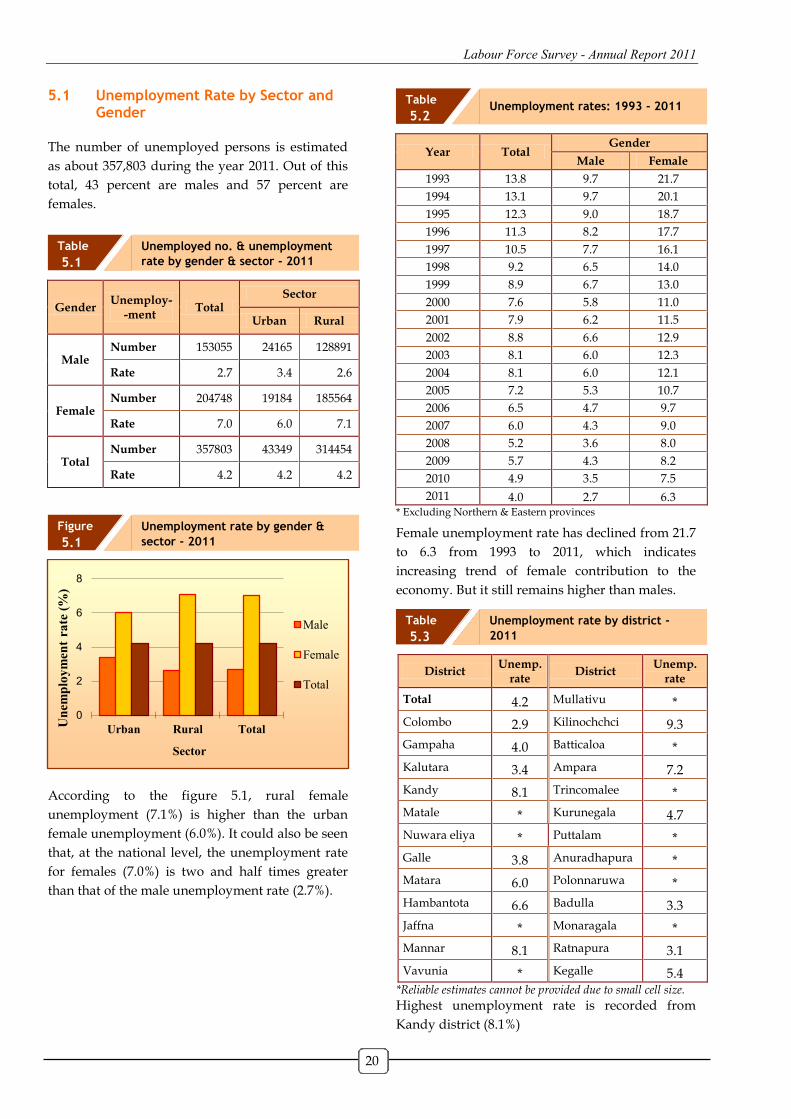
Labour Force Survey - Annual Report 2011
20
5.1 Unemployment Rate by Sector and
Gender The number of unemployed persons is estimated
as about 357,803 during the year 2011. Out of this
total, 43 percent are males and 57 percent are
females.
Gender Unemploy-
-ment Total
Sector
Urban Rural
Male Number 153055 24165 128891
Rate 2.7 3.4 2.6
Female Number 204748 19184 185564
Rate 7.0 6.0 7.1
Total Number 357803 43349 314454
Rate 4.2 4.2 4.2
According to the figure 5.1, rural female
unemployment (7.1%) is higher than the urban
female unemployment (6.0%). It could also be seen
that, at the national level, the unemployment rate
for females (7.0%) is two and half times greater
than that of the male unemployment rate (2.7%).
Year Total Gender
Male Female
1993 13.8 9.7 21.7
1994 13.1 9.7 20.1
1995 12.3 9.0 18.7
1996 11.3 8.2 17.7
1997 10.5 7.7 16.1
1998 9.2 6.5 14.0
1999 8.9 6.7 13.0
2000 7.6 5.8 11.0
2001 7.9 6.2 11.5
2002 8.8 6.6 12.9
2003 8.1 6.0 12.3
2004 8.1 6.0 12.1
2005 7.2 5.3 10.7
2006 6.5 4.7 9.7
2007 6.0 4.3 9.0
2008 5.2 3.6 8.0
2009 5.7 4.3 8.2
2010 4.9 3.5 7.5
2011 4.0 2.7 6.3 * Excluding Northern & Eastern provinces
Female unemployment rate has declined from 21.7
to 6.3 from 1993 to 2011, which indicates
increasing trend of female contribution to the
economy. But it still remains higher than males.
District Unemp.
rate District
Unemp. rate
Total 4.2 Mullativu *
Colombo 2.9 Kilinochchci 9.3
Gampaha 4.0 Batticaloa *
Kalutara 3.4 Ampara 7.2
Kandy 8.1 Trincomalee *
Matale * Kurunegala 4.7
Nuwara eliya * Puttalam *
Galle 3.8 Anuradhapura *
Matara 6.0 Polonnaruwa *
Hambantota 6.6 Badulla 3.3
Jaffna * Monaragala *
Mannar 8.1 Ratnapura 3.1
Vavunia * Kegalle 5.4 *Reliable estimates cannot be provided due to small cell size.
Highest unemployment rate is recorded from
Kandy district (8.1%)
0
2
4
6
8
Urban Rural Total
Un
emp
loy
men
t ra
te (
%)
Sector
Male
Female
Total
Unemployed no. & unemployment
rate by gender & sector - 2011
Unemployment rate by gender &
sector - 2011
Unemployment rates: 1993 - 2011
Unemployment rate by district -
2011
Table
5.1
Figure
5.1
Table
5.2
Table
5.3
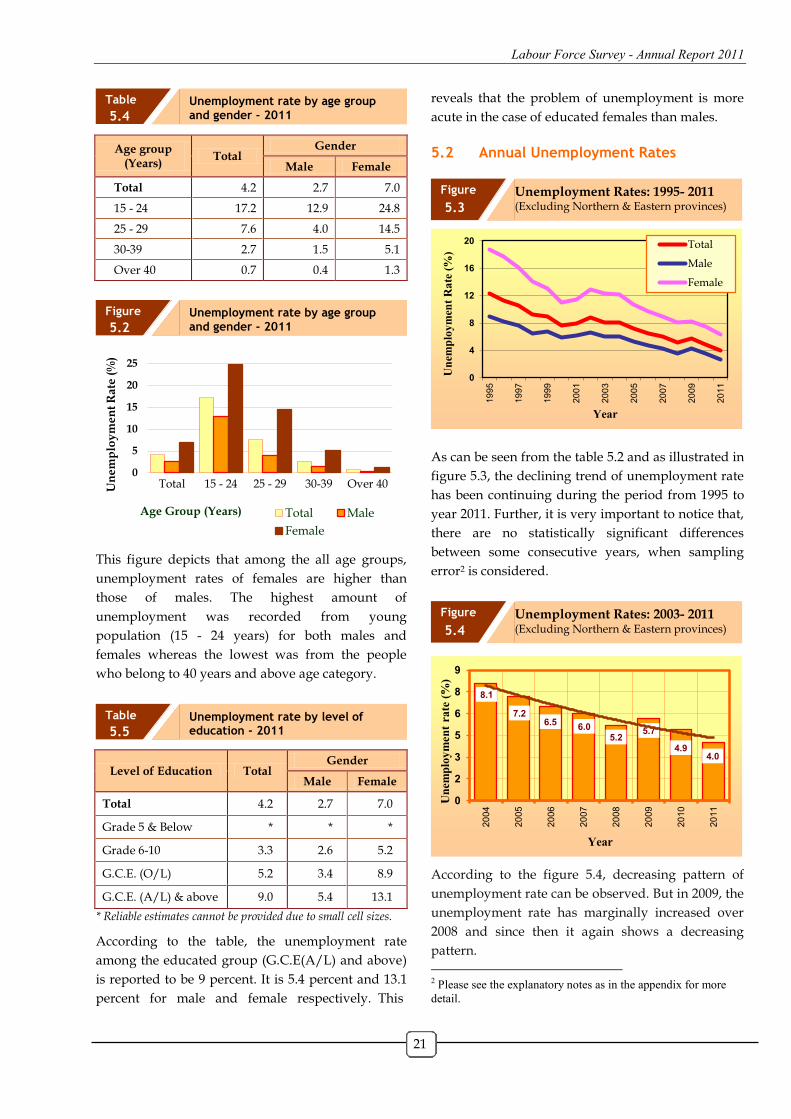
Labour Force Survey - Annual Report 2011
21
Age group (Years)
Total Gender
Male Female
Total 4.2 2.7 7.0
15 - 24 17.2 12.9 24.8
25 - 29 7.6 4.0 14.5
30-39 2.7 1.5 5.1
Over 40 0.7 0.4 1.3
This figure depicts that among the all age groups,
unemployment rates of females are higher than
those of males. The highest amount of
unemployment was recorded from young
population (15 - 24 years) for both males and
females whereas the lowest was from the people
who belong to 40 years and above age category.
Level of Education Total Gender
Male Female
Total 4.2 2.7 7.0
Grade 5 & Below * * *
Grade 6-10 3.3 2.6 5.2
G.C.E. (O/L) 5.2 3.4 8.9
G.C.E. (A/L) & above 9.0 5.4 13.1
* Reliable estimates cannot be provided due to small cell sizes.
According to the table, the unemployment rate
among the educated group (G.C.E(A/L) and above)
is reported to be 9 percent. It is 5.4 percent and 13.1
percent for male and female respectively. This
reveals that the problem of unemployment is more
acute in the case of educated females than males.
5.2 Annual Unemployment Rates
As can be seen from the table 5.2 and as illustrated in
figure 5.3, the declining trend of unemployment rate
has been continuing during the period from 1995 to
year 2011. Further, it is very important to notice that,
there are no statistically significant differences
between some consecutive years, when sampling
error2 is considered.
According to the figure 5.4, decreasing pattern of
unemployment rate can be observed. But in 2009, the
unemployment rate has marginally increased over
2008 and since then it again shows a decreasing
pattern.
2 Please see the explanatory notes as in the appendix for more
detail.
0
5
10
15
20
25
Total 15 - 24 25 - 29 30-39 Over 40Un
em
plo
ym
en
t R
ate
(%
)
Age Group (Years) Total Male
Female
0
4
8
12
16
20
19
95
19
97
19
99
20
01
20
03
20
05
20
07
20
09
20
11
Un
emp
loy
men
t R
ate
(%
)
Year
Total
Male
Female
8.1
7.2 6.5
6.0 5.2
5.7
4.9 4.0
0
2
3
5
6
8
9
20
04
20
05
20
06
20
07
20
08
20
09
20
10
20
11
Un
emp
loy
men
t ra
te (
%)
Year
Unemployment rate by age group and gender - 2011
Unemployment rate by age group and gender - 2011
Unemployment rate by level of education - 2011
Unemployment Rates: 1995- 2011 (Excluding Northern & Eastern provinces)
Unemployment Rates: 2003- 2011 (Excluding Northern & Eastern provinces)
Table
5.4
Figure
5.2
Table
5.5
Figure
5.3
Figure
5.4
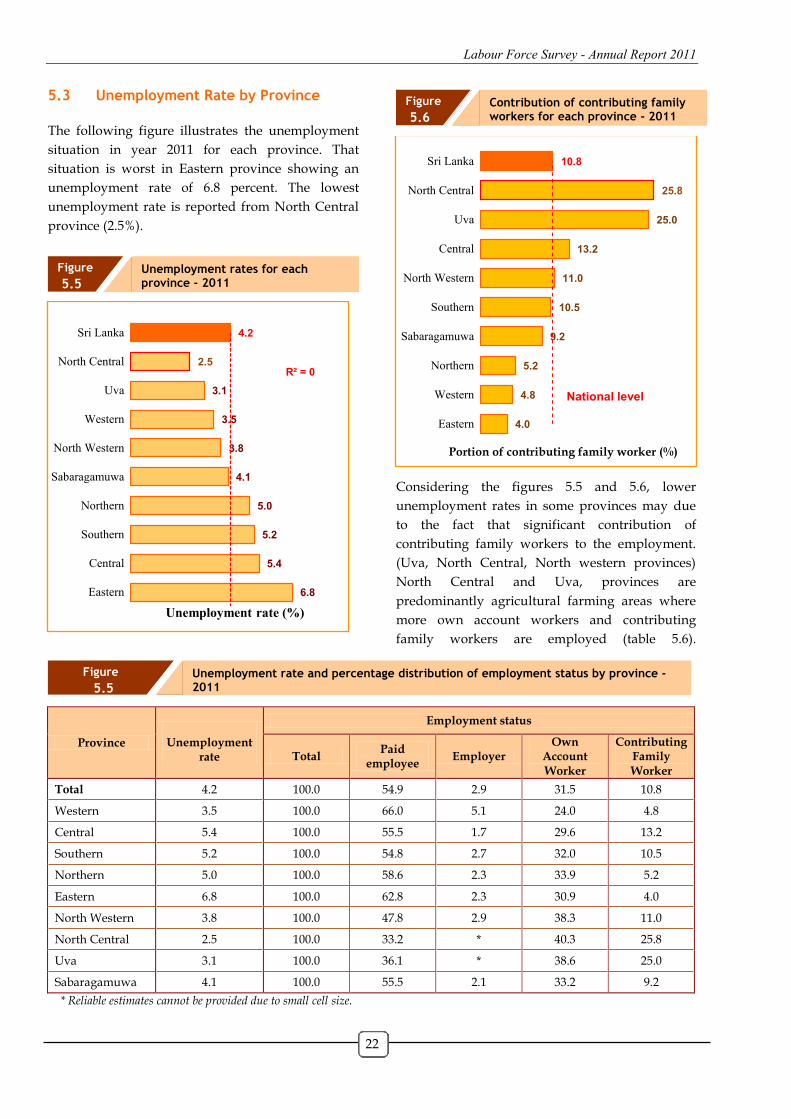
Labour Force Survey - Annual Report 2011
22
5.3 Unemployment Rate by Province
The following figure illustrates the unemployment
situation in year 2011 for each province. That
situation is worst in Eastern province showing an
unemployment rate of 6.8 percent. The lowest
unemployment rate is reported from North Central
province (2.5%).
Considering the figures 5.5 and 5.6, lower
unemployment rates in some provinces may due
to the fact that significant contribution of
contributing family workers to the employment.
(Uva, North Central, North western provinces)
North Central and Uva, provinces are
predominantly agricultural farming areas where
more own account workers and contributing
family workers are employed (table 5.6).
Province
Unemployment rate
Employment status
Total Paid
employee Employer
Own Account Worker
Contributing Family Worker
Total 4.2 100.0 54.9 2.9 31.5 10.8
Western 3.5 100.0 66.0 5.1 24.0 4.8
Central 5.4 100.0 55.5 1.7 29.6 13.2
Southern 5.2 100.0 54.8 2.7 32.0 10.5
Northern 5.0 100.0 58.6 2.3 33.9 5.2
Eastern 6.8 100.0 62.8 2.3 30.9 4.0
North Western 3.8 100.0 47.8 2.9 38.3 11.0
North Central 2.5 100.0 33.2 * 40.3 25.8
Uva 3.1 100.0 36.1 * 38.6 25.0
Sabaragamuwa 4.1 100.0 55.5 2.1 33.2 9.2
* Reliable estimates cannot be provided due to small cell size.
6.8
5.4
5.2
5.0
4.1
3.8
3.5
3.1
2.5
4.2
R² = 0
Eastern
Central
Southern
Northern
Sabaragamuwa
North Western
Western
Uva
North Central
Sri Lanka
Unemployment rate (%)
4.0
4.8
5.2
9.2
10.5
11.0
13.2
25.0
25.8
10.8
Eastern
Western
Northern
Sabaragamuwa
Southern
North Western
Central
Uva
North Central
Sri Lanka
Portion of contributing family worker (%)
National level
Unemployment rates for each province - 2011
Contribution of contributing family workers for each province - 2011
Unemployment rate and percentage distribution of employment status by province - 2011
Figure
5.5
Figure
5.6
Figure
5.5
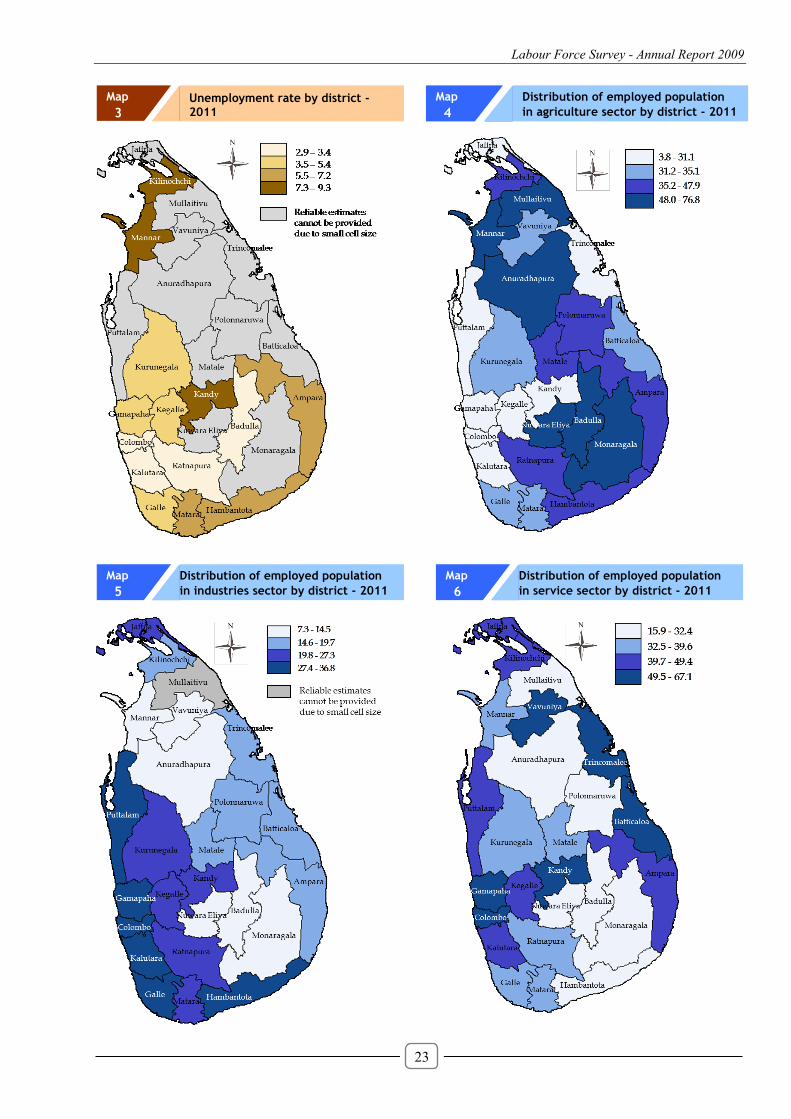
Labour Force Survey - Annual Report 2009
23
Distribution of employed population
in agriculture sector by district - 2011
Map
4
Distribution of employed population
in industries sector by district - 2011
Map
5
Distribution of employed population
in service sector by district - 2011
Map
6
Unemployment rate by district -
2011 Map 3
23
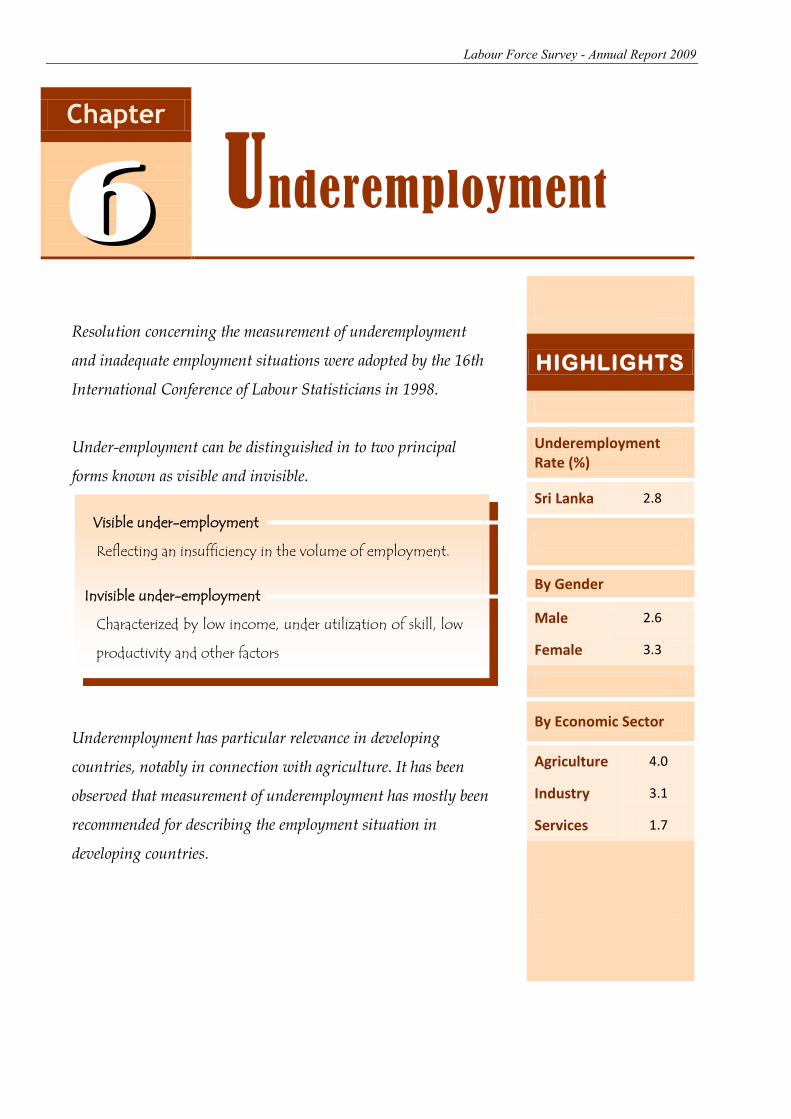
Labour Force Survey - Annual Report 2009
24
Chapter
Underemployment
Resolution concerning the measurement of underemployment
and inadequate employment situations were adopted by the 16th
International Conference of Labour Statisticians in 1998.
Under-employment can be distinguished in to two principal
forms known as visible and invisible.
Underemployment has particular relevance in developing
countries, notably in connection with agriculture. It has been
observed that measurement of underemployment has mostly been
recommended for describing the employment situation in
developing countries.
HIGHLIGHTS
Underemployment Rate (%)
Sri Lanka 2.8
By Gender
Male 2.6
Female 3.3
By Economic Sector
Agriculture 4.0
Industry 3.1
Services 1.7
Visible under-employment
Reflecting an insufficiency in the volume of employment.
Invisible under-employment
Characterized by low income, under utilization of skill, low
productivity and other factors
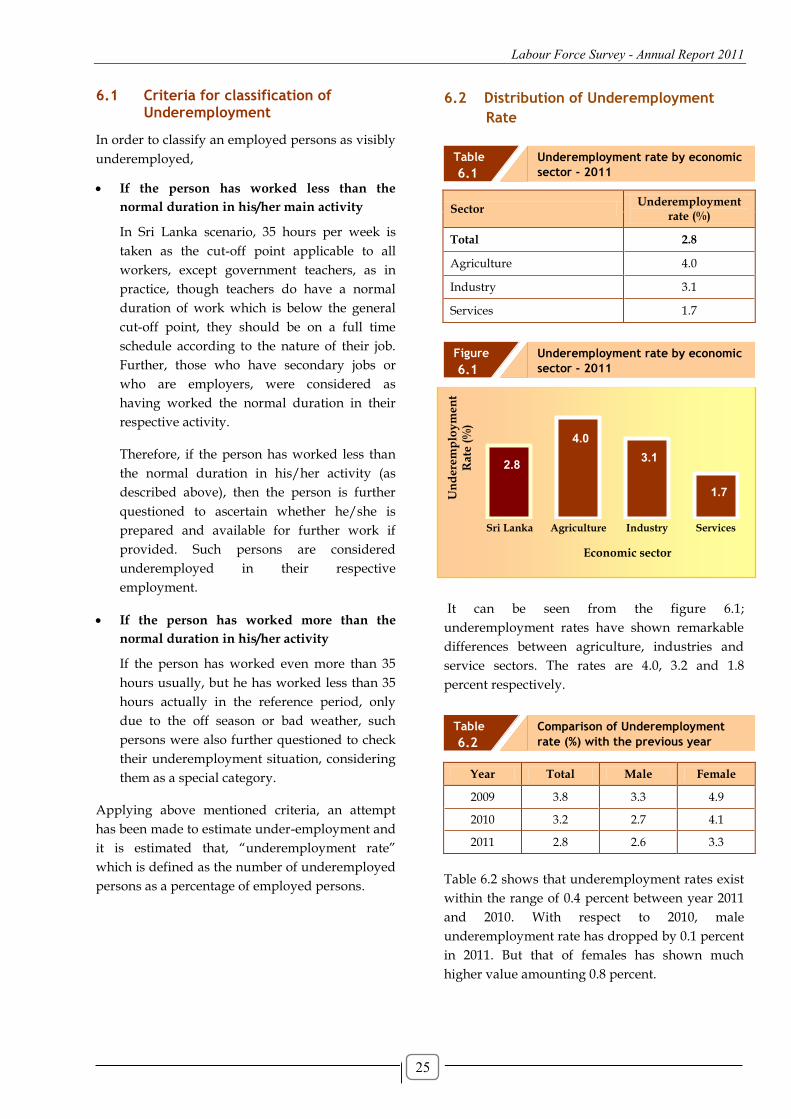
Labour Force Survey - Annual Report 2011
25
6.1 Criteria for classification of
Underemployment
In order to classify an employed persons as visibly
underemployed,
If the person has worked less than the
normal duration in his/her main activity
In Sri Lanka scenario, 35 hours per week is
taken as the cut-off point applicable to all
workers, except government teachers, as in
practice, though teachers do have a normal
duration of work which is below the general
cut-off point, they should be on a full time
schedule according to the nature of their job.
Further, those who have secondary jobs or
who are employers, were considered as
having worked the normal duration in their
respective activity.
Therefore, if the person has worked less than
the normal duration in his/her activity (as
described above), then the person is further
questioned to ascertain whether he/she is
prepared and available for further work if
provided. Such persons are considered
underemployed in their respective
employment.
If the person has worked more than the
normal duration in his/her activity
If the person has worked even more than 35
hours usually, but he has worked less than 35
hours actually in the reference period, only
due to the off season or bad weather, such
persons were also further questioned to check
their underemployment situation, considering
them as a special category.
Applying above mentioned criteria, an attempt
has been made to estimate under-employment and
it is estimated that, “underemployment rate”
which is defined as the number of underemployed
persons as a percentage of employed persons.
6.2 Distribution of Underemployment
Rate
Sector Underemployment
rate (%)
Total 2.8
Agriculture 4.0
Industry 3.1
Services 1.7
It can be seen from the figure 6.1;
underemployment rates have shown remarkable
differences between agriculture, industries and
service sectors. The rates are 4.0, 3.2 and 1.8
percent respectively.
Year Total Male Female
2009 3.8 3.3 4.9
2010 3.2 2.7 4.1
2011 2.8 2.6 3.3
Table 6.2 shows that underemployment rates exist
within the range of 0.4 percent between year 2011
and 2010. With respect to 2010, male
underemployment rate has dropped by 0.1 percent
in 2011. But that of females has shown much
higher value amounting 0.8 percent.
2.8
4.0
3.1
1.7
Sri Lanka Agriculture Industry Services
Un
de
rem
plo
ym
en
t
Ra
te (
%)
Economic sector
Underemployment rate by economic
sector - 2011
Underemployment rate by economic
sector - 2011
Comparison of Underemployment
rate (%) with the previous year
Table
6.1
Figure
6.1
Table
6.2
25
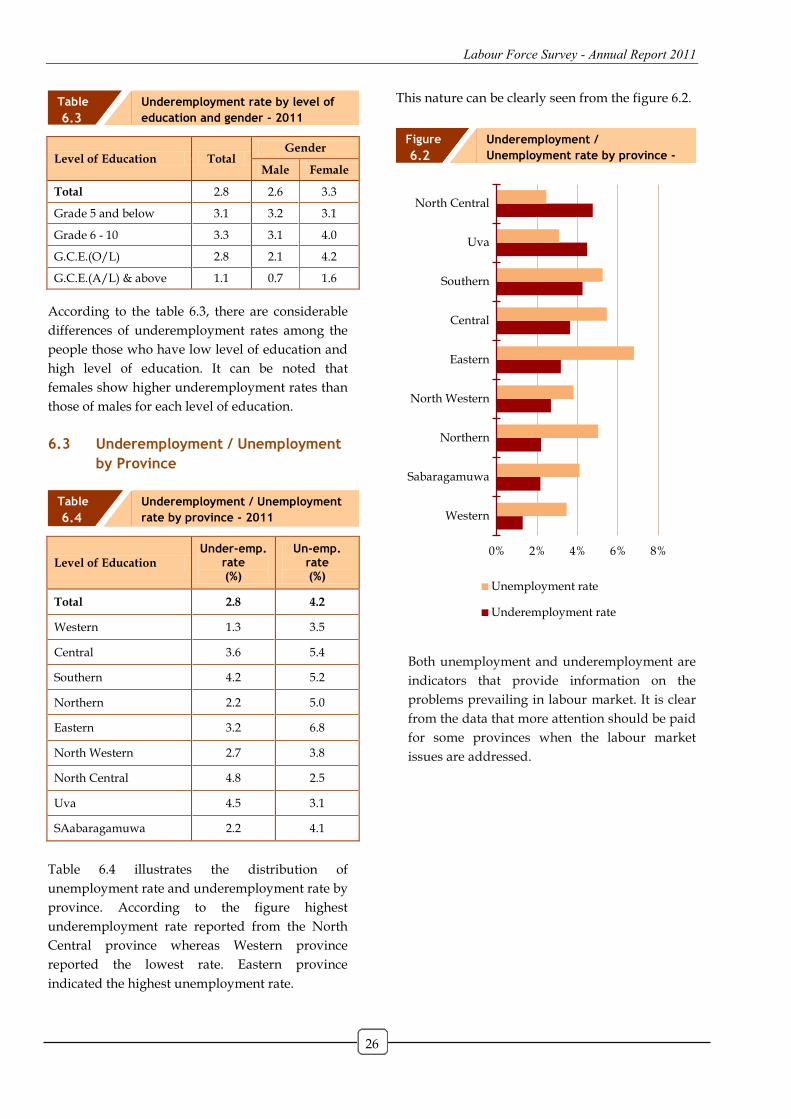
Labour Force Survey - Annual Report 2011
26
Level of Education Total Gender
Male Female
Total 2.8 2.6 3.3
Grade 5 and below 3.1 3.2 3.1
Grade 6 - 10 3.3 3.1 4.0
G.C.E.(O/L) 2.8 2.1 4.2
G.C.E.(A/L) & above 1.1 0.7 1.6
According to the table 6.3, there are considerable
differences of underemployment rates among the
people those who have low level of education and
high level of education. It can be noted that
females show higher underemployment rates than
those of males for each level of education.
6.3 Underemployment / Unemployment
by Province
Level of Education Under-emp.
rate (%)
Un-emp. rate (%)
Total 2.8 4.2
Western 1.3 3.5
Central 3.6 5.4
Southern 4.2 5.2
Northern 2.2 5.0
Eastern 3.2 6.8
North Western 2.7 3.8
North Central 4.8 2.5
Uva 4.5 3.1
SAabaragamuwa 2.2 4.1
Table 6.4 illustrates the distribution of
unemployment rate and underemployment rate by
province. According to the figure highest
underemployment rate reported from the North
Central province whereas Western province
reported the lowest rate. Eastern province
indicated the highest unemployment rate.
This nature can be clearly seen from the figure 6.2.
Both unemployment and underemployment are
indicators that provide information on the
problems prevailing in labour market. It is clear
from the data that more attention should be paid
for some provinces when the labour market
issues are addressed.
0% 2% 4% 6% 8%
Western
Sabaragamuwa
Northern
North Western
Eastern
Central
Southern
Uva
North Central
Unemployment rate
Underemployment rate
Underemployment rate by level of
education and gender - 2011
Underemployment / Unemployment
rate by province - 2011
Underemployment /
Unemployment rate by province -
2011
Table
6.3
Table
6.4
Figure
6.2
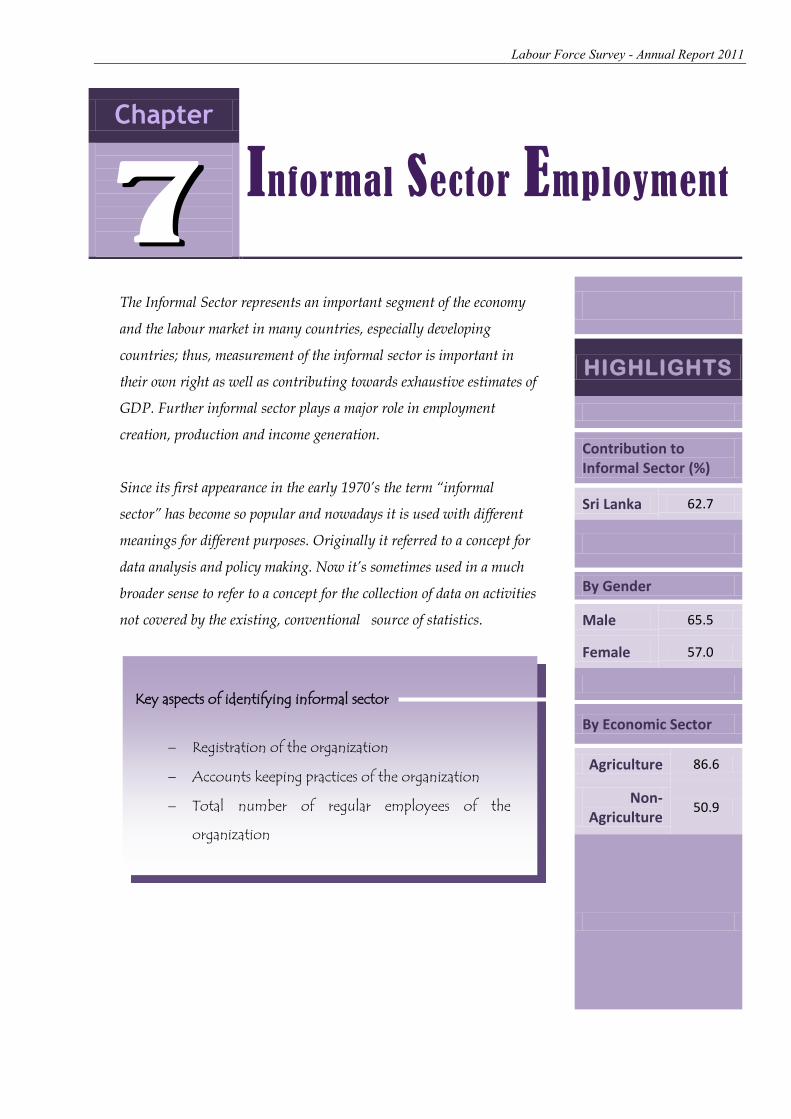
Labour Force Survey - Annual Report 2011
27
The Informal Sector represents an important segment of the economy
and the labour market in many countries, especially developing
countries; thus, measurement of the informal sector is important in
their own right as well as contributing towards exhaustive estimates of
GDP. Further informal sector plays a major role in employment
creation, production and income generation.
Since its first appearance in the early 1970’s the term “informal
sector” has become so popular and nowadays it is used with different
meanings for different purposes. Originally it referred to a concept for
data analysis and policy making. Now it’s sometimes used in a much
broader sense to refer to a concept for the collection of data on activities
not covered by the existing, conventional source of statistics.
HIGHLIGHTS
Contribution to Informal Sector (%)
Sri Lanka 62.7
By Gender
Male 65.5
Female 57.0
By Economic Sector
Agriculture 86.6
Non- Agriculture
50.9
Chapter
Informal sector Employment
Key aspects of identifying informal sector
Registration of the organization
Accounts keeping practices of the organization
Total number of regular employees of the
organization
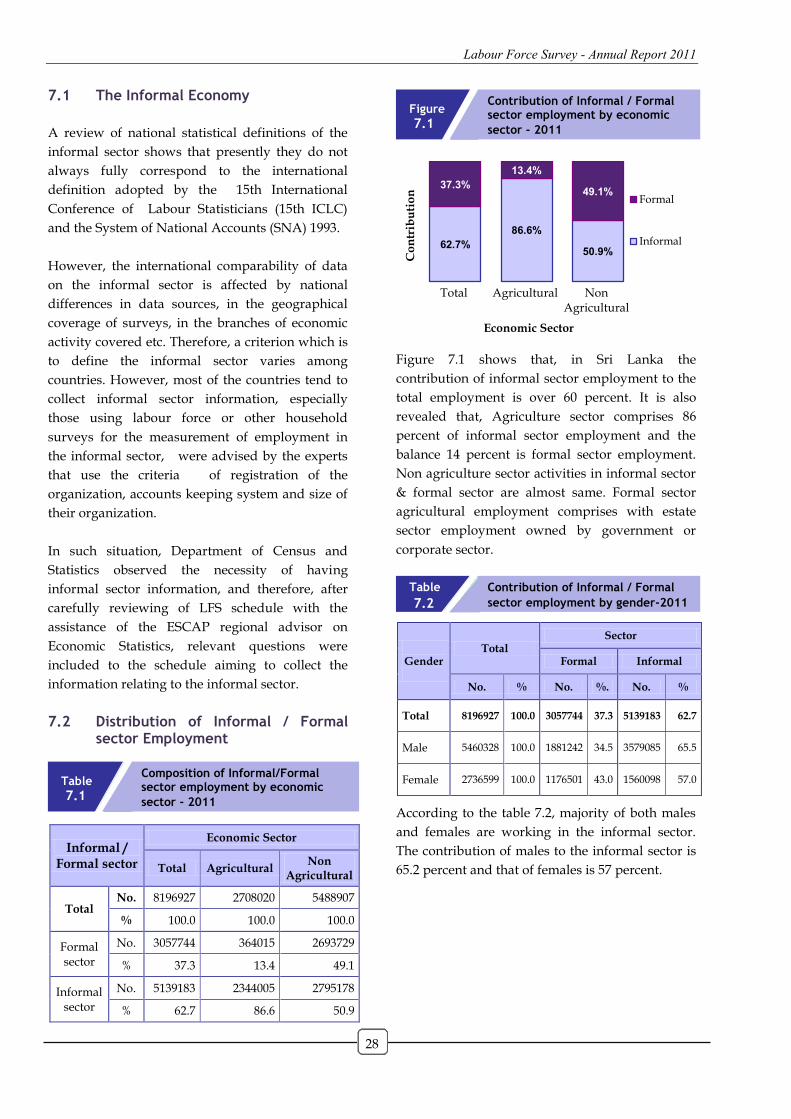
Labour Force Survey - Annual Report 2011
28
7.1 The Informal Economy
A review of national statistical definitions of the
informal sector shows that presently they do not
always fully correspond to the international
definition adopted by the 15th International
Conference of Labour Statisticians (15th ICLC)
and the System of National Accounts (SNA) 1993.
However, the international comparability of data
on the informal sector is affected by national
differences in data sources, in the geographical
coverage of surveys, in the branches of economic
activity covered etc. Therefore, a criterion which is
to define the informal sector varies among
countries. However, most of the countries tend to
collect informal sector information, especially
those using labour force or other household
surveys for the measurement of employment in
the informal sector, were advised by the experts
that use the criteria of registration of the
organization, accounts keeping system and size of
their organization.
In such situation, Department of Census and
Statistics observed the necessity of having
informal sector information, and therefore, after
carefully reviewing of LFS schedule with the
assistance of the ESCAP regional advisor on
Economic Statistics, relevant questions were
included to the schedule aiming to collect the
information relating to the informal sector.
7.2 Distribution of Informal / Formal sector Employment
Informal / Formal sector
Economic Sector
Total Agricultural Non
Agricultural
Total No. 8196927 2708020 5488907
% 100.0 100.0 100.0
Formal sector
No. 3057744 364015 2693729
% 37.3 13.4 49.1
Informal sector
No. 5139183 2344005 2795178
% 62.7 86.6 50.9
Figure 7.1 shows that, in Sri Lanka the
contribution of informal sector employment to the
total employment is over 60 percent. It is also
revealed that, Agriculture sector comprises 86
percent of informal sector employment and the
balance 14 percent is formal sector employment.
Non agriculture sector activities in informal sector
& formal sector are almost same. Formal sector
agricultural employment comprises with estate
sector employment owned by government or
corporate sector.
Gender
Total Sector
Formal Informal
No. % No. %. No. %
Total 8196927 100.0 3057744 37.3 5139183 62.7
Male 5460328 100.0 1881242 34.5 3579085 65.5
Female 2736599 100.0 1176501 43.0 1560098 57.0
According to the table 7.2, majority of both males
and females are working in the informal sector.
The contribution of males to the informal sector is
65.2 percent and that of females is 57 percent.
62.7%
86.6%
50.9%
37.3%
13.4%
49.1%
Total Agricultural NonAgricultural
Co
ntr
ibu
tio
n
Economic Sector
Formal
Informal
Composition of Informal/Formal sector employment by economic
sector - 2011
Contribution of Informal / Formal sector employment by economic
sector - 2011
Contribution of Informal / Formal
sector employment by gender-2011
Table
7.1
Figure
7.1
Table
7.2
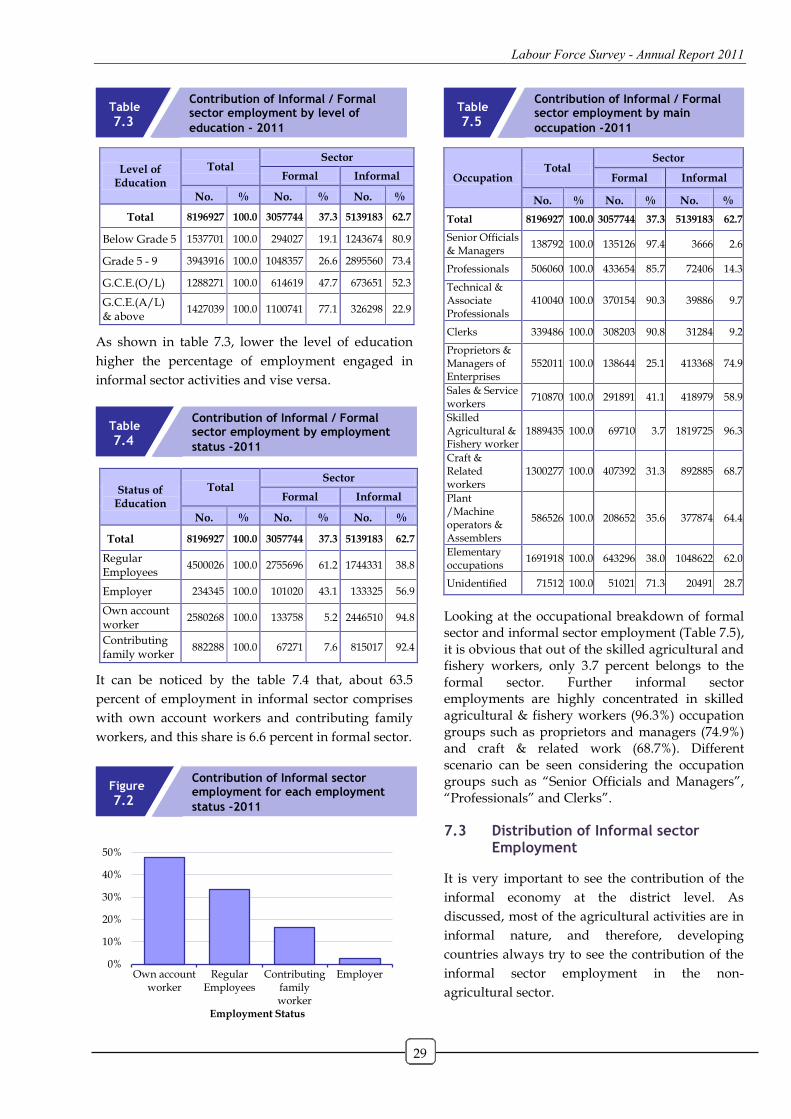
Labour Force Survey - Annual Report 2011
29
Level of Education
Total Sector
Formal Informal
No. % No. % No. %
Total 8196927 100.0 3057744 37.3 5139183 62.7
Below Grade 5 1537701 100.0 294027 19.1 1243674 80.9
Grade 5 - 9 3943916 100.0 1048357 26.6 2895560 73.4
G.C.E.(O/L) 1288271 100.0 614619 47.7 673651 52.3
G.C.E.(A/L) & above
1427039 100.0 1100741 77.1 326298 22.9
As shown in table 7.3, lower the level of education
higher the percentage of employment engaged in
informal sector activities and vise versa.
Status of Education
Total Sector
Formal Informal
No. % No. % No. %
Total 8196927 100.0 3057744 37.3 5139183 62.7
Regular Employees
4500026 100.0 2755696 61.2 1744331 38.8
Employer 234345 100.0 101020 43.1 133325 56.9
Own account worker
2580268 100.0 133758 5.2 2446510 94.8
Contributing family worker
882288 100.0 67271 7.6 815017 92.4
It can be noticed by the table 7.4 that, about 63.5
percent of employment in informal sector comprises
with own account workers and contributing family
workers, and this share is 6.6 percent in formal sector.
Occupation Total
Sector
Formal Informal
No. % No. % No. %
Total 8196927 100.0 3057744 37.3 5139183 62.7
Senior Officials & Managers
138792 100.0 135126 97.4 3666 2.6
Professionals 506060 100.0 433654 85.7 72406 14.3
Technical & Associate Professionals
410040 100.0 370154 90.3 39886 9.7
Clerks 339486 100.0 308203 90.8 31284 9.2
Proprietors & Managers of Enterprises
552011 100.0 138644 25.1 413368 74.9
Sales & Service workers
710870 100.0 291891 41.1 418979 58.9
Skilled Agricultural & Fishery worker
1889435 100.0 69710 3.7 1819725 96.3
Craft & Related workers
1300277 100.0 407392 31.3 892885 68.7
Plant /Machine operators & Assemblers
586526 100.0 208652 35.6 377874 64.4
Elementary occupations
1691918 100.0 643296 38.0 1048622 62.0
Unidentified 71512 100.0 51021 71.3 20491 28.7
Looking at the occupational breakdown of formal sector and informal sector employment (Table 7.5), it is obvious that out of the skilled agricultural and fishery workers, only 3.7 percent belongs to the formal sector. Further informal sector employments are highly concentrated in skilled agricultural & fishery workers (96.3%) occupation groups such as proprietors and managers (74.9%) and craft & related work (68.7%). Different scenario can be seen considering the occupation groups such as “Senior Officials and Managers”, “Professionals” and Clerks”.
7.3 Distribution of Informal sector Employment
It is very important to see the contribution of the
informal economy at the district level. As
discussed, most of the agricultural activities are in
informal nature, and therefore, developing
countries always try to see the contribution of the
informal sector employment in the non-
agricultural sector.
0%
10%
20%
30%
40%
50%
Own accountworker
RegularEmployees
Contributingfamilyworker
Employer
Employment Status
Contribution of Informal / Formal sector employment by level of
education - 2011
Contribution of Informal / Formal sector employment by employment
status -2011
Contribution of Informal sector employment for each employment
status -2011
Contribution of Informal / Formal sector employment by main
occupation -2011
Table
7.3
Table
7.4
Figure
7.2
Table
7.5
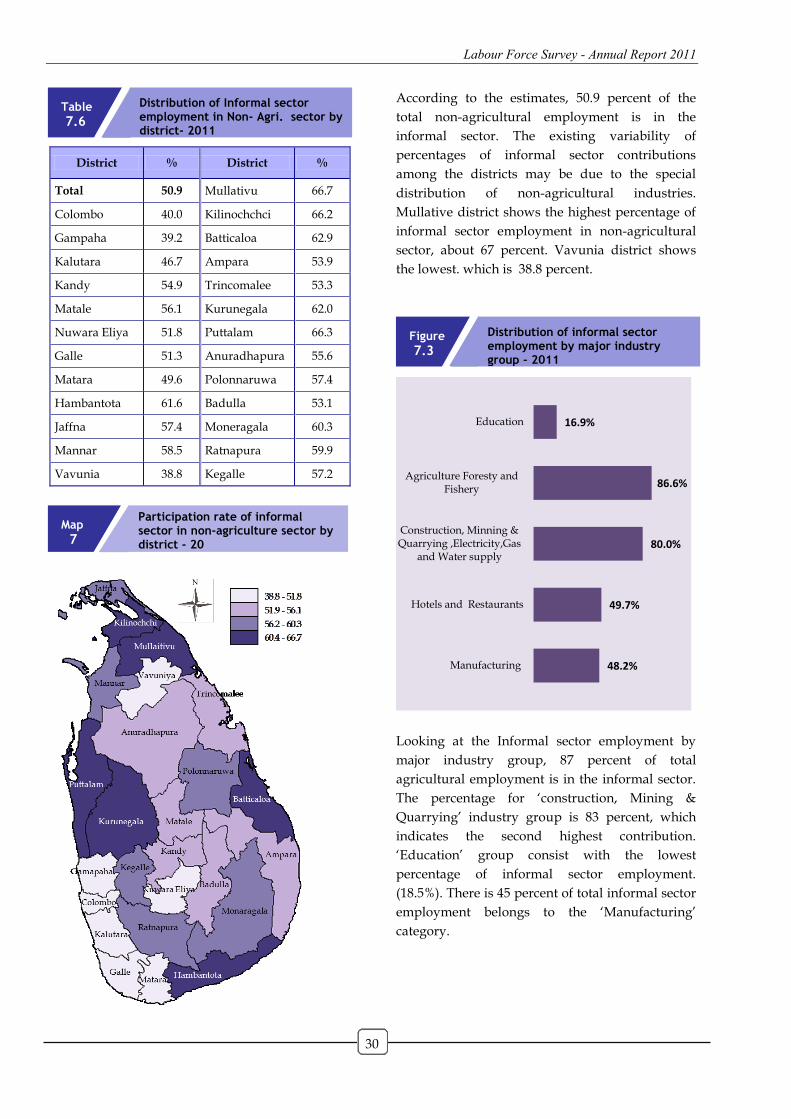
Labour Force Survey - Annual Report 2011
30
District % District %
Total 50.9 Mullativu 66.7
Colombo 40.0 Kilinochchci 66.2
Gampaha 39.2 Batticaloa 62.9
Kalutara 46.7 Ampara 53.9
Kandy 54.9 Trincomalee 53.3
Matale 56.1 Kurunegala 62.0
Nuwara Eliya 51.8 Puttalam 66.3
Galle 51.3 Anuradhapura 55.6
Matara 49.6 Polonnaruwa 57.4
Hambantota 61.6 Badulla 53.1
Jaffna 57.4 Moneragala 60.3
Mannar 58.5 Ratnapura 59.9
Vavunia 38.8 Kegalle 57.2
According to the estimates, 50.9 percent of the
total non-agricultural employment is in the
informal sector. The existing variability of
percentages of informal sector contributions
among the districts may be due to the special
distribution of non-agricultural industries.
Mullative district shows the highest percentage of
informal sector employment in non-agricultural
sector, about 67 percent. Vavunia district shows
the lowest. which is 38.8 percent.
Looking at the Informal sector employment by
major industry group, 87 percent of total
agricultural employment is in the informal sector.
The percentage for „construction, Mining &
Quarrying‟ industry group is 83 percent, which
indicates the second highest contribution.
„Education‟ group consist with the lowest
percentage of informal sector employment.
(18.5%). There is 45 percent of total informal sector
employment belongs to the „Manufacturing‟
category.
48.2%
49.7%
80.0%
86.6%
16.9%
Manufacturing
Hotels and Restaurants
Construction, Minning &Quarrying ,Electricity,Gas
and Water supply
Agriculture Foresty andFishery
Education
Distribution of Informal sector employment in Non- Agri. sector by district- 2011
Participation rate of informal sector in non-agriculture sector by district - 20
Distribution of informal sector employment by major industry group - 2011
Table
7.6
Map
7
Figure
7.3
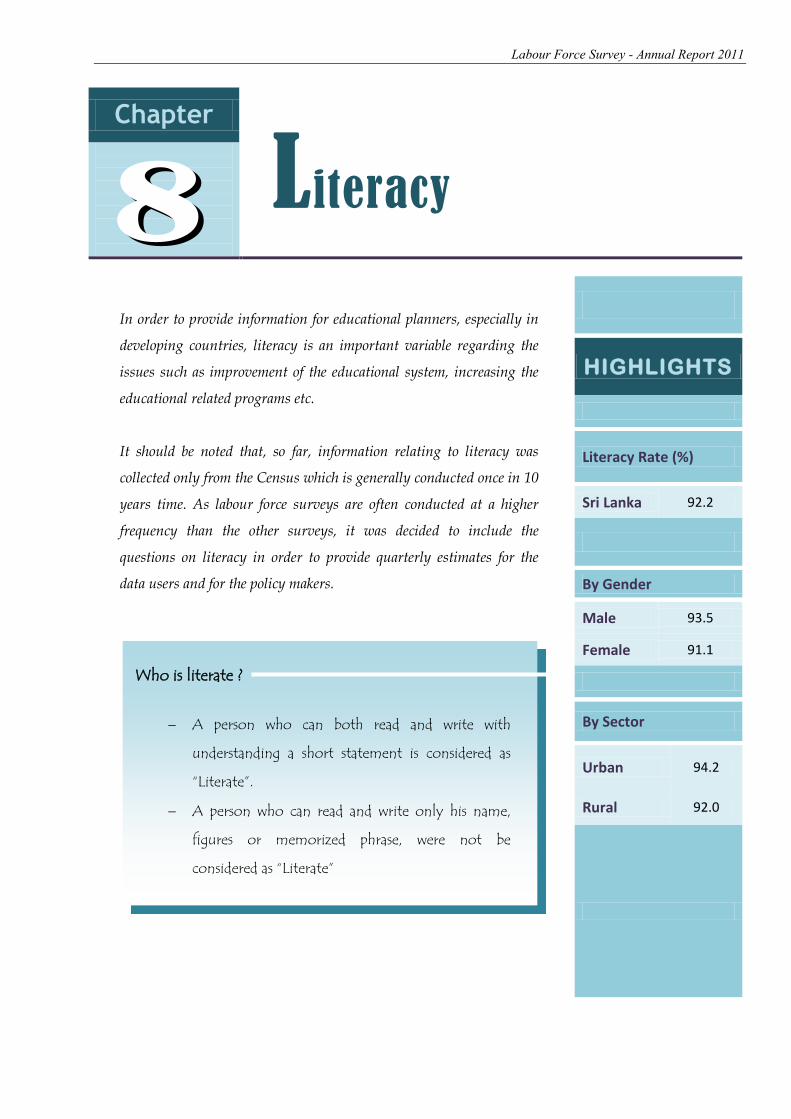
Labour Force Survey - Annual Report 2011
31
Chapter
Literacy
In order to provide information for educational planners, especially in
developing countries, literacy is an important variable regarding the
issues such as improvement of the educational system, increasing the
educational related programs etc.
It should be noted that, so far, information relating to literacy was
collected only from the Census which is generally conducted once in 10
years time. As labour force surveys are often conducted at a higher
frequency than the other surveys, it was decided to include the
questions on literacy in order to provide quarterly estimates for the
data users and for the policy makers.
HIGHLIGHTS
Literacy Rate (%)
Sri Lanka 92.2
By Gender
Male 93.5
Female 91.1
By Sector
Urban 94.2
Rural 92.0
Who is literate ?
A person who can both read and write with
understanding a short statement is considered as
“Literate”.
A person who can read and write only his name,
figures or memorized phrase, were not be
considered as “Literate”
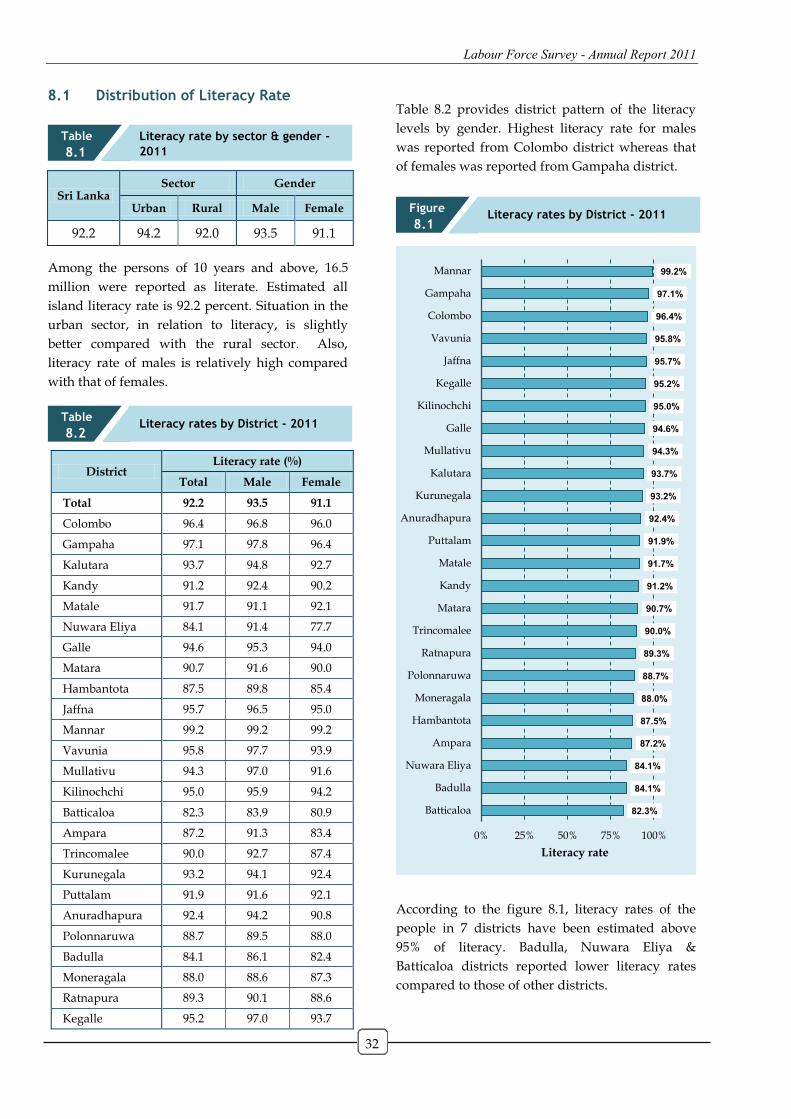
Labour Force Survey - Annual Report 2011
32
8.1 Distribution of Literacy Rate
Sri Lanka Sector Gender
Urban Rural Male Female
92.2 94.2 92.0 93.5 91.1
Among the persons of 10 years and above, 16.5
million were reported as literate. Estimated all
island literacy rate is 92.2 percent. Situation in the
urban sector, in relation to literacy, is slightly
better compared with the rural sector. Also,
literacy rate of males is relatively high compared
with that of females.
District Literacy rate (%)
Total Male Female
Total 92.2 93.5 91.1
Colombo 96.4 96.8 96.0
Gampaha 97.1 97.8 96.4
Kalutara 93.7 94.8 92.7
Kandy 91.2 92.4 90.2
Matale 91.7 91.1 92.1
Nuwara Eliya 84.1 91.4 77.7
Galle 94.6 95.3 94.0
Matara 90.7 91.6 90.0
Hambantota 87.5 89.8 85.4
Jaffna 95.7 96.5 95.0
Mannar 99.2 99.2 99.2
Vavunia 95.8 97.7 93.9
Mullativu 94.3 97.0 91.6
Kilinochchi 95.0 95.9 94.2
Batticaloa 82.3 83.9 80.9
Ampara 87.2 91.3 83.4
Trincomalee 90.0 92.7 87.4
Kurunegala 93.2 94.1 92.4
Puttalam 91.9 91.6 92.1
Anuradhapura 92.4 94.2 90.8
Polonnaruwa 88.7 89.5 88.0
Badulla 84.1 86.1 82.4
Moneragala 88.0 88.6 87.3
Ratnapura 89.3 90.1 88.6
Kegalle 95.2 97.0 93.7
Table 8.2 provides district pattern of the literacy
levels by gender. Highest literacy rate for males
was reported from Colombo district whereas that
of females was reported from Gampaha district.
According to the figure 8.1, literacy rates of the
people in 7 districts have been estimated above
95% of literacy. Badulla, Nuwara Eliya &
Batticaloa districts reported lower literacy rates
compared to those of other districts.
82.3%
84.1%
84.1%
87.2%
87.5%
88.0%
88.7%
89.3%
90.0%
90.7%
91.2%
91.7%
91.9%
92.4%
93.2%
93.7%
94.3%
94.6%
95.0%
95.2%
95.7%
95.8%
96.4%
97.1%
99.2%
0% 25% 50% 75% 100%
Batticaloa
Badulla
Nuwara Eliya
Ampara
Hambantota
Moneragala
Polonnaruwa
Ratnapura
Trincomalee
Matara
Kandy
Matale
Puttalam
Anuradhapura
Kurunegala
Kalutara
Mullativu
Galle
Kilinochchi
Kegalle
Jaffna
Vavunia
Colombo
Gampaha
Mannar
Literacy rate
Literacy rate by sector & gender -
2011
Literacy rates by District - 2011
Literacy rates by District - 2011
Table
8.1
Table
8.2
Figure
8.1
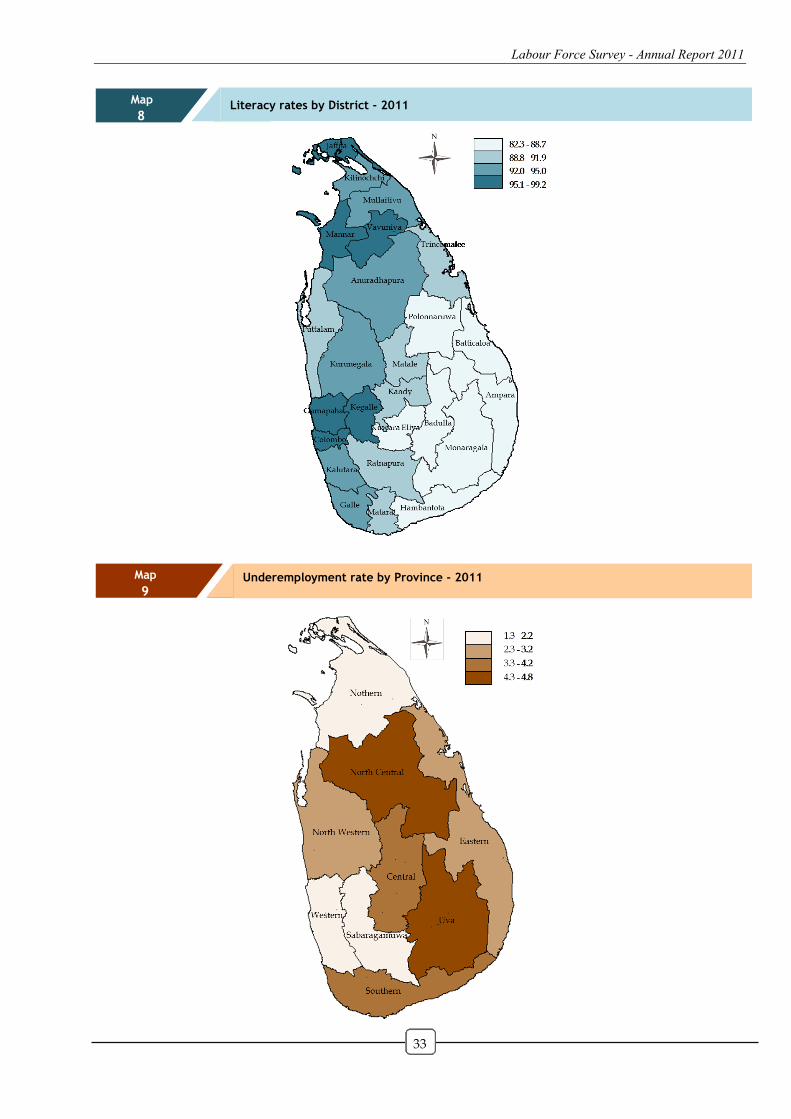
Labour Force Survey - Annual Report 2011
33
Underemployment rate by Province - 2011 Map
9
Map
8 Literacy rates by District - 2011

Labour Force Survey - Annual Report 2011
34
Statistical
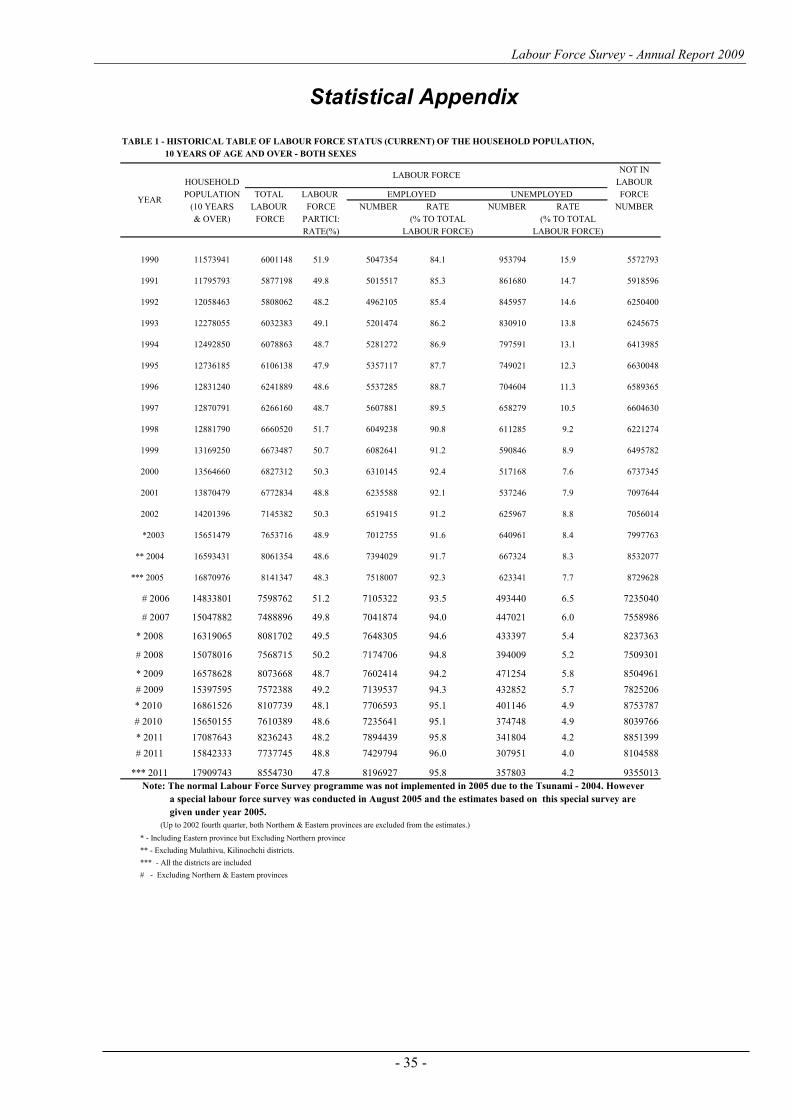
Labour Force Survey - Annual Report 2009
- 35 -
TABLE 1 - HISTORICAL TABLE OF LABOUR FORCE STATUS (CURRENT) OF THE HOUSEHOLD POPULATION,
10 YEARS OF AGE AND OVER - BOTH SEXES
NOT IN
HOUSEHOLD LABOUR
POPULATION TOTAL LABOUR FORCE
(10 YEARS LABOUR FORCE NUMBER RATE NUMBER RATE NUMBER
& OVER) FORCE PARTICI: (% TO TOTAL (% TO TOTAL
RATE(%) LABOUR FORCE) LABOUR FORCE)
1990 11573941 6001148 51.9 5047354 84.1 953794 15.9 5572793
1991 11795793 5877198 49.8 5015517 85.3 861680 14.7 5918596
1992 12058463 5808062 48.2 4962105 85.4 845957 14.6 6250400
1993 12278055 6032383 49.1 5201474 86.2 830910 13.8 6245675
1994 12492850 6078863 48.7 5281272 86.9 797591 13.1 6413985
1995 12736185 6106138 47.9 5357117 87.7 749021 12.3 6630048
1996 12831240 6241889 48.6 5537285 88.7 704604 11.3 6589365
1997 12870791 6266160 48.7 5607881 89.5 658279 10.5 6604630
1998 12881790 6660520 51.7 6049238 90.8 611285 9.2 6221274
1999 13169250 6673487 50.7 6082641 91.2 590846 8.9 6495782
2000 13564660 6827312 50.3 6310145 92.4 517168 7.6 6737345
2001 13870479 6772834 48.8 6235588 92.1 537246 7.9 7097644
2002 14201396 7145382 50.3 6519415 91.2 625967 8.8 7056014
*2003 15651479 7653716 48.9 7012755 91.6 640961 8.4 7997763
** 2004 16593431 8061354 48.6 7394029 91.7 667324 8.3 8532077
*** 2005 16870976 8141347 48.3 7518007 92.3 623341 7.7 8729628
# 2006 14833801 7598762 51.2 7105322 93.5 493440 6.5 7235040
# 2007 15047882 7488896 49.8 7041874 94.0 447021 6.0 7558986
* 2008 16319065 8081702 49.5 7648305 94.6 433397 5.4 8237363
# 2008 15078016 7568715 50.2 7174706 94.8 394009 5.2 7509301
* 2009 16578628 8073668 48.7 7602414 94.2 471254 5.8 8504961
# 2009 15397595 7572388 49.2 7139537 94.3 432852 5.7 7825206
* 2010 16861526 8107739 48.1 7706593 95.1 401146 4.9 8753787
# 2010 15650155 7610389 48.6 7235641 95.1 374748 4.9 8039766
* 2011 17087643 8236243 48.2 7894439 95.8 341804 4.2 8851399
# 2011 15842333 7737745 48.8 7429794 96.0 307951 4.0 8104588
*** 2011 17909743 8554730 47.8 8196927 95.8 357803 4.2 9355013
Note: The normal Labour Force Survey programme was not implemented in 2005 due to the Tsunami - 2004. However
a special labour force survey was conducted in August 2005 and the estimates based on this special survey are
given under year 2005.
(Up to 2002 fourth quarter, both Northern & Eastern provinces are excluded from the estimates.)
* - Including Eastern province but Excluding Northern province
** - Excluding Mulathivu, Kilinochchi districts.
*** - All the districts are included
# - Excluding Northern & Eastern provinces
YEAR
LABOUR FORCE
EMPLOYED UNEMPLOYED
Statistical Appendix
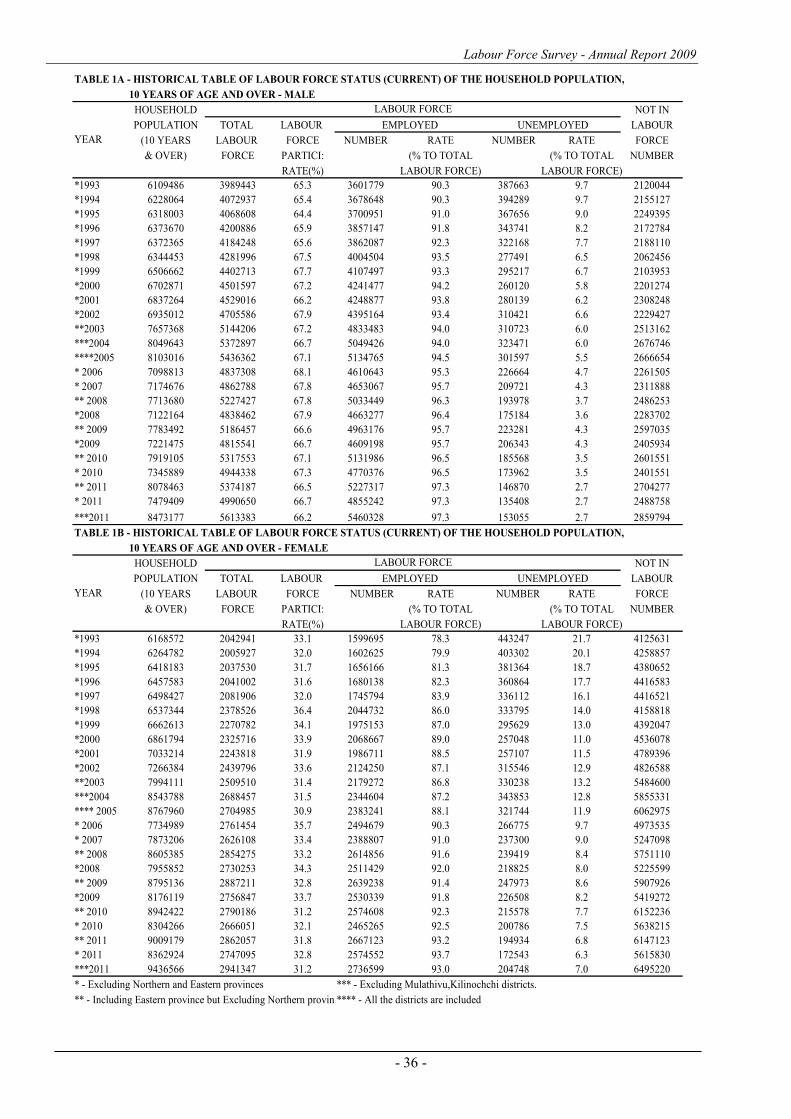
Labour Force Survey - Annual Report 2009
- 36 -
TABLE 1A - HISTORICAL TABLE OF LABOUR FORCE STATUS (CURRENT) OF THE HOUSEHOLD POPULATION,
10 YEARS OF AGE AND OVER - MALE
HOUSEHOLD NOT IN
POPULATION TOTAL LABOUR LABOUR
(10 YEARS LABOUR FORCE NUMBER RATE NUMBER RATE FORCE
& OVER) FORCE PARTICI: (% TO TOTAL (% TO TOTAL NUMBER
RATE(%) LABOUR FORCE) LABOUR FORCE)
*1993 6109486 3989443 65.3 3601779 90.3 387663 9.7 2120044
*1994 6228064 4072937 65.4 3678648 90.3 394289 9.7 2155127
*1995 6318003 4068608 64.4 3700951 91.0 367656 9.0 2249395
*1996 6373670 4200886 65.9 3857147 91.8 343741 8.2 2172784
*1997 6372365 4184248 65.6 3862087 92.3 322168 7.7 2188110
*1998 6344453 4281996 67.5 4004504 93.5 277491 6.5 2062456
*1999 6506662 4402713 67.7 4107497 93.3 295217 6.7 2103953
*2000 6702871 4501597 67.2 4241477 94.2 260120 5.8 2201274
*2001 6837264 4529016 66.2 4248877 93.8 280139 6.2 2308248
*2002 6935012 4705586 67.9 4395164 93.4 310421 6.6 2229427
**2003 7657368 5144206 67.2 4833483 94.0 310723 6.0 2513162
***2004 8049643 5372897 66.7 5049426 94.0 323471 6.0 2676746
****2005 8103016 5436362 67.1 5134765 94.5 301597 5.5 2666654
* 2006 7098813 4837308 68.1 4610643 95.3 226664 4.7 2261505
* 2007 7174676 4862788 67.8 4653067 95.7 209721 4.3 2311888
** 2008 7713680 5227427 67.8 5033449 96.3 193978 3.7 2486253
*2008 7122164 4838462 67.9 4663277 96.4 175184 3.6 2283702
** 2009 7783492 5186457 66.6 4963176 95.7 223281 4.3 2597035
*2009 7221475 4815541 66.7 4609198 95.7 206343 4.3 2405934
** 2010 7919105 5317553 67.1 5131986 96.5 185568 3.5 2601551
* 2010 7345889 4944338 67.3 4770376 96.5 173962 3.5 2401551
** 2011 8078463 5374187 66.5 5227317 97.3 146870 2.7 2704277
* 2011 7479409 4990650 66.7 4855242 97.3 135408 2.7 2488758
***2011 8473177 5613383 66.2 5460328 97.3 153055 2.7 2859794
TABLE 1B - HISTORICAL TABLE OF LABOUR FORCE STATUS (CURRENT) OF THE HOUSEHOLD POPULATION,
10 YEARS OF AGE AND OVER - FEMALE
HOUSEHOLD NOT IN
POPULATION TOTAL LABOUR LABOUR
(10 YEARS LABOUR FORCE NUMBER RATE NUMBER RATE FORCE
& OVER) FORCE PARTICI: (% TO TOTAL (% TO TOTAL NUMBER
RATE(%) LABOUR FORCE) LABOUR FORCE)
*1993 6168572 2042941 33.1 1599695 78.3 443247 21.7 4125631
*1994 6264782 2005927 32.0 1602625 79.9 403302 20.1 4258857
*1995 6418183 2037530 31.7 1656166 81.3 381364 18.7 4380652
*1996 6457583 2041002 31.6 1680138 82.3 360864 17.7 4416583
*1997 6498427 2081906 32.0 1745794 83.9 336112 16.1 4416521
*1998 6537344 2378526 36.4 2044732 86.0 333795 14.0 4158818
*1999 6662613 2270782 34.1 1975153 87.0 295629 13.0 4392047
*2000 6861794 2325716 33.9 2068667 89.0 257048 11.0 4536078
*2001 7033214 2243818 31.9 1986711 88.5 257107 11.5 4789396
*2002 7266384 2439796 33.6 2124250 87.1 315546 12.9 4826588
**2003 7994111 2509510 31.4 2179272 86.8 330238 13.2 5484600
***2004 8543788 2688457 31.5 2344604 87.2 343853 12.8 5855331
**** 2005 8767960 2704985 30.9 2383241 88.1 321744 11.9 6062975
* 2006 7734989 2761454 35.7 2494679 90.3 266775 9.7 4973535
* 2007 7873206 2626108 33.4 2388807 91.0 237300 9.0 5247098
** 2008 8605385 2854275 33.2 2614856 91.6 239419 8.4 5751110
*2008 7955852 2730253 34.3 2511429 92.0 218825 8.0 5225599
** 2009 8795136 2887211 32.8 2639238 91.4 247973 8.6 5907926
*2009 8176119 2756847 33.7 2530339 91.8 226508 8.2 5419272
** 2010 8942422 2790186 31.2 2574608 92.3 215578 7.7 6152236
* 2010 8304266 2666051 32.1 2465265 92.5 200786 7.5 5638215
** 2011 9009179 2862057 31.8 2667123 93.2 194934 6.8 6147123
* 2011 8362924 2747095 32.8 2574552 93.7 172543 6.3 5615830
***2011 9436566 2941347 31.2 2736599 93.0 204748 7.0 6495220
* - Excluding Northern and Eastern provinces *** - Excluding Mulathivu,Kilinochchi districts.
** - Including Eastern province but Excluding Northern province**** - All the districts are included
YEAR
LABOUR FORCE
EMPLOYED UNEMPLOYED
YEAR
LABOUR FORCE
EMPLOYED UNEMPLOYED
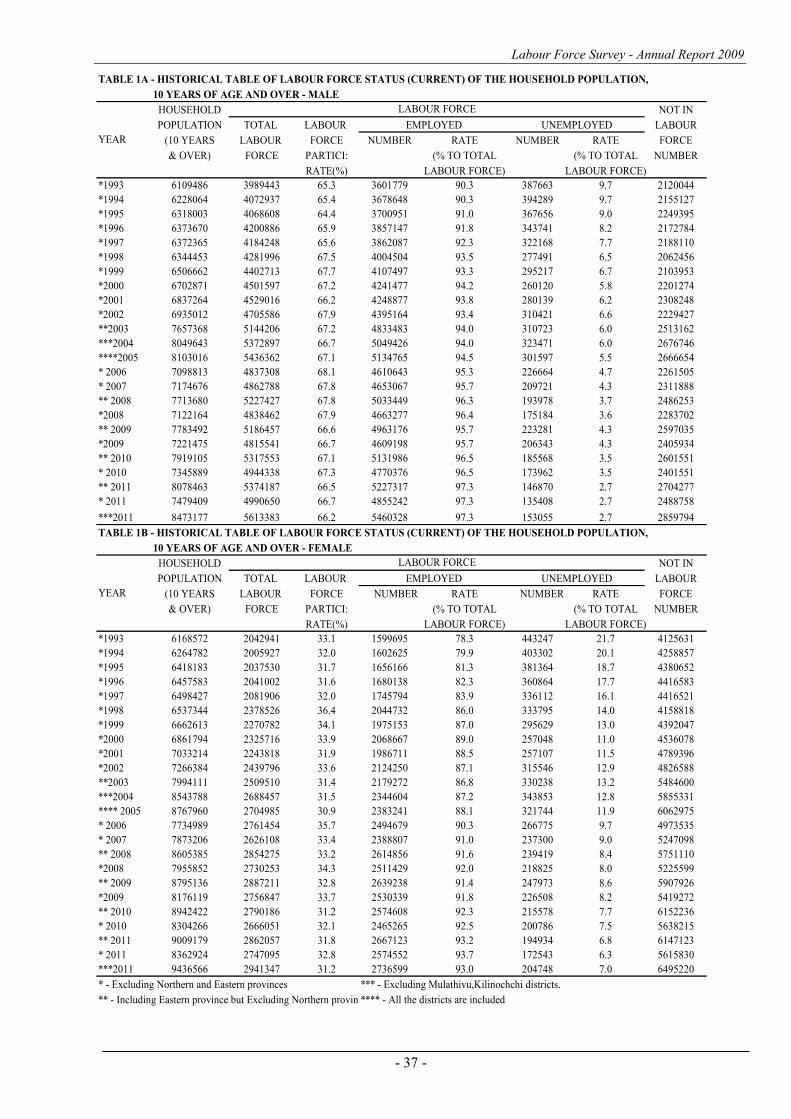
Labour Force Survey - Annual Report 2009
- 37 -
TABLE 1A - HISTORICAL TABLE OF LABOUR FORCE STATUS (CURRENT) OF THE HOUSEHOLD POPULATION,
10 YEARS OF AGE AND OVER - MALE
HOUSEHOLD NOT IN
POPULATION TOTAL LABOUR LABOUR
(10 YEARS LABOUR FORCE NUMBER RATE NUMBER RATE FORCE
& OVER) FORCE PARTICI: (% TO TOTAL (% TO TOTAL NUMBER
RATE(%) LABOUR FORCE) LABOUR FORCE)
*1993 6109486 3989443 65.3 3601779 90.3 387663 9.7 2120044
*1994 6228064 4072937 65.4 3678648 90.3 394289 9.7 2155127
*1995 6318003 4068608 64.4 3700951 91.0 367656 9.0 2249395
*1996 6373670 4200886 65.9 3857147 91.8 343741 8.2 2172784
*1997 6372365 4184248 65.6 3862087 92.3 322168 7.7 2188110
*1998 6344453 4281996 67.5 4004504 93.5 277491 6.5 2062456
*1999 6506662 4402713 67.7 4107497 93.3 295217 6.7 2103953
*2000 6702871 4501597 67.2 4241477 94.2 260120 5.8 2201274
*2001 6837264 4529016 66.2 4248877 93.8 280139 6.2 2308248
*2002 6935012 4705586 67.9 4395164 93.4 310421 6.6 2229427
**2003 7657368 5144206 67.2 4833483 94.0 310723 6.0 2513162
***2004 8049643 5372897 66.7 5049426 94.0 323471 6.0 2676746
****2005 8103016 5436362 67.1 5134765 94.5 301597 5.5 2666654
* 2006 7098813 4837308 68.1 4610643 95.3 226664 4.7 2261505
* 2007 7174676 4862788 67.8 4653067 95.7 209721 4.3 2311888
** 2008 7713680 5227427 67.8 5033449 96.3 193978 3.7 2486253
*2008 7122164 4838462 67.9 4663277 96.4 175184 3.6 2283702
** 2009 7783492 5186457 66.6 4963176 95.7 223281 4.3 2597035
*2009 7221475 4815541 66.7 4609198 95.7 206343 4.3 2405934
** 2010 7919105 5317553 67.1 5131986 96.5 185568 3.5 2601551
* 2010 7345889 4944338 67.3 4770376 96.5 173962 3.5 2401551
** 2011 8078463 5374187 66.5 5227317 97.3 146870 2.7 2704277
* 2011 7479409 4990650 66.7 4855242 97.3 135408 2.7 2488758
***2011 8473177 5613383 66.2 5460328 97.3 153055 2.7 2859794
TABLE 1B - HISTORICAL TABLE OF LABOUR FORCE STATUS (CURRENT) OF THE HOUSEHOLD POPULATION,
10 YEARS OF AGE AND OVER - FEMALE
HOUSEHOLD NOT IN
POPULATION TOTAL LABOUR LABOUR
(10 YEARS LABOUR FORCE NUMBER RATE NUMBER RATE FORCE
& OVER) FORCE PARTICI: (% TO TOTAL (% TO TOTAL NUMBER
RATE(%) LABOUR FORCE) LABOUR FORCE)
*1993 6168572 2042941 33.1 1599695 78.3 443247 21.7 4125631
*1994 6264782 2005927 32.0 1602625 79.9 403302 20.1 4258857
*1995 6418183 2037530 31.7 1656166 81.3 381364 18.7 4380652
*1996 6457583 2041002 31.6 1680138 82.3 360864 17.7 4416583
*1997 6498427 2081906 32.0 1745794 83.9 336112 16.1 4416521
*1998 6537344 2378526 36.4 2044732 86.0 333795 14.0 4158818
*1999 6662613 2270782 34.1 1975153 87.0 295629 13.0 4392047
*2000 6861794 2325716 33.9 2068667 89.0 257048 11.0 4536078
*2001 7033214 2243818 31.9 1986711 88.5 257107 11.5 4789396
*2002 7266384 2439796 33.6 2124250 87.1 315546 12.9 4826588
**2003 7994111 2509510 31.4 2179272 86.8 330238 13.2 5484600
***2004 8543788 2688457 31.5 2344604 87.2 343853 12.8 5855331
**** 2005 8767960 2704985 30.9 2383241 88.1 321744 11.9 6062975
* 2006 7734989 2761454 35.7 2494679 90.3 266775 9.7 4973535
* 2007 7873206 2626108 33.4 2388807 91.0 237300 9.0 5247098
** 2008 8605385 2854275 33.2 2614856 91.6 239419 8.4 5751110
*2008 7955852 2730253 34.3 2511429 92.0 218825 8.0 5225599
** 2009 8795136 2887211 32.8 2639238 91.4 247973 8.6 5907926
*2009 8176119 2756847 33.7 2530339 91.8 226508 8.2 5419272
** 2010 8942422 2790186 31.2 2574608 92.3 215578 7.7 6152236
* 2010 8304266 2666051 32.1 2465265 92.5 200786 7.5 5638215
** 2011 9009179 2862057 31.8 2667123 93.2 194934 6.8 6147123
* 2011 8362924 2747095 32.8 2574552 93.7 172543 6.3 5615830
***2011 9436566 2941347 31.2 2736599 93.0 204748 7.0 6495220
* - Excluding Northern and Eastern provinces *** - Excluding Mulathivu,Kilinochchi districts.
** - Including Eastern province but Excluding Northern province**** - All the districts are included
YEAR
LABOUR FORCE
EMPLOYED UNEMPLOYED
YEAR
LABOUR FORCE
EMPLOYED UNEMPLOYED
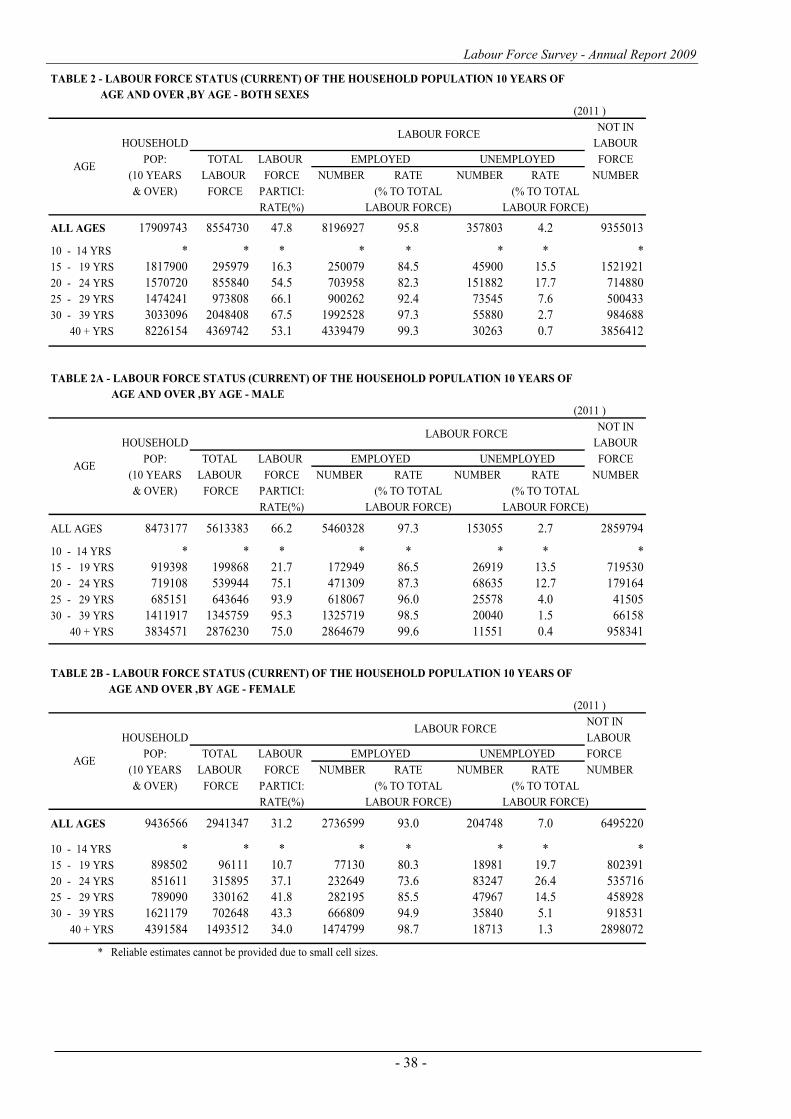
Labour Force Survey - Annual Report 2009
- 38 -
TABLE 2 - LABOUR FORCE STATUS (CURRENT) OF THE HOUSEHOLD POPULATION 10 YEARS OF
AGE AND OVER ,BY AGE - BOTH SEXES
(2011 )
NOT IN
HOUSEHOLD LABOUR
POP: TOTAL LABOUR FORCE
(10 YEARS LABOUR FORCE NUMBER RATE NUMBER RATE NUMBER
& OVER) FORCE PARTICI: (% TO TOTAL (% TO TOTAL
RATE(%) LABOUR FORCE) LABOUR FORCE)
ALL AGES 17909743 8554730 47.8 8196927 95.8 357803 4.2 9355013
10 - 14 YRS * * * * * * * *
15 - 19 YRS 1817900 295979 16.3 250079 84.5 45900 15.5 1521921
20 - 24 YRS 1570720 855840 54.5 703958 82.3 151882 17.7 714880
25 - 29 YRS 1474241 973808 66.1 900262 92.4 73545 7.6 500433
30 - 39 YRS 3033096 2048408 67.5 1992528 97.3 55880 2.7 984688
40 + YRS 8226154 4369742 53.1 4339479 99.3 30263 0.7 3856412
TABLE 2A - LABOUR FORCE STATUS (CURRENT) OF THE HOUSEHOLD POPULATION 10 YEARS OF
AGE AND OVER ,BY AGE - MALE
(2011 )
NOT IN
HOUSEHOLD LABOUR
POP: TOTAL LABOUR FORCE
(10 YEARS LABOUR FORCE NUMBER RATE NUMBER RATE NUMBER
& OVER) FORCE PARTICI: (% TO TOTAL (% TO TOTAL
RATE(%) LABOUR FORCE) LABOUR FORCE)
ALL AGES 8473177 5613383 66.2 5460328 97.3 153055 2.7 2859794
10 - 14 YRS * * * * * * * *
15 - 19 YRS 919398 199868 21.7 172949 86.5 26919 13.5 719530
20 - 24 YRS 719108 539944 75.1 471309 87.3 68635 12.7 179164
25 - 29 YRS 685151 643646 93.9 618067 96.0 25578 4.0 41505
30 - 39 YRS 1411917 1345759 95.3 1325719 98.5 20040 1.5 66158
40 + YRS 3834571 2876230 75.0 2864679 99.6 11551 0.4 958341
TABLE 2B - LABOUR FORCE STATUS (CURRENT) OF THE HOUSEHOLD POPULATION 10 YEARS OF
AGE AND OVER ,BY AGE - FEMALE
(2011 )
NOT IN
HOUSEHOLD LABOUR
POP: TOTAL LABOUR FORCE
(10 YEARS LABOUR FORCE NUMBER RATE NUMBER RATE NUMBER
& OVER) FORCE PARTICI: (% TO TOTAL (% TO TOTAL
RATE(%) LABOUR FORCE) LABOUR FORCE)
ALL AGES 9436566 2941347 31.2 2736599 93.0 204748 7.0 6495220
10 - 14 YRS * * * * * * * *
15 - 19 YRS 898502 96111 10.7 77130 80.3 18981 19.7 802391
20 - 24 YRS 851611 315895 37.1 232649 73.6 83247 26.4 535716
25 - 29 YRS 789090 330162 41.8 282195 85.5 47967 14.5 458928
30 - 39 YRS 1621179 702648 43.3 666809 94.9 35840 5.1 918531
40 + YRS 4391584 1493512 34.0 1474799 98.7 18713 1.3 2898072
* Reliable estimates cannot be provided due to small cell sizes.
AGE
LABOUR FORCE
EMPLOYED UNEMPLOYED
AGE
LABOUR FORCE
EMPLOYED UNEMPLOYED
LABOUR FORCE
AGEEMPLOYED UNEMPLOYED
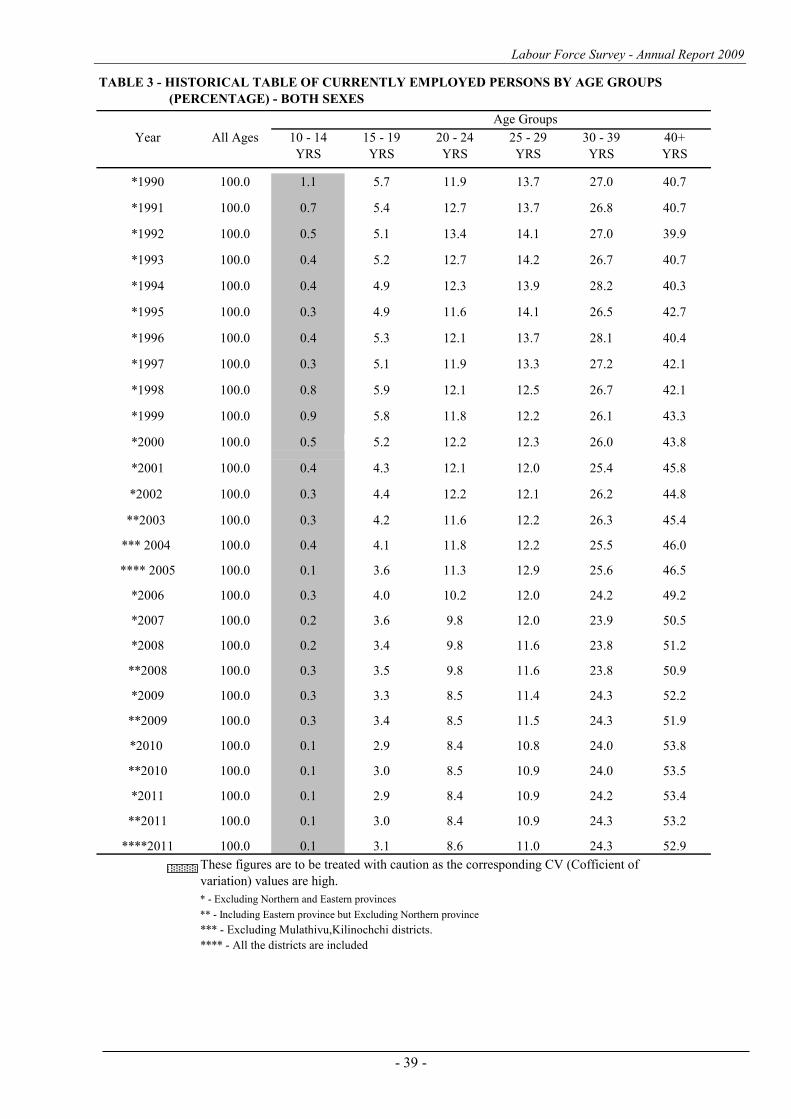
Labour Force Survey - Annual Report 2009
- 39 -
TABLE 3 - HISTORICAL TABLE OF CURRENTLY EMPLOYED PERSONS BY AGE GROUPS
(PERCENTAGE) - BOTH SEXES
Age Groups
Year All Ages 10 - 14 15 - 19 20 - 24 25 - 29 30 - 39 40+
YRS YRS YRS YRS YRS YRS
*1990 100.0 1.1 5.7 11.9 13.7 27.0 40.7
*1991 100.0 0.7 5.4 12.7 13.7 26.8 40.7
*1992 100.0 0.5 5.1 13.4 14.1 27.0 39.9
*1993 100.0 0.4 5.2 12.7 14.2 26.7 40.7
*1994 100.0 0.4 4.9 12.3 13.9 28.2 40.3
*1995 100.0 0.3 4.9 11.6 14.1 26.5 42.7
*1996 100.0 0.4 5.3 12.1 13.7 28.1 40.4
*1997 100.0 0.3 5.1 11.9 13.3 27.2 42.1
*1998 100.0 0.8 5.9 12.1 12.5 26.7 42.1
*1999 100.0 0.9 5.8 11.8 12.2 26.1 43.3
*2000 100.0 0.5 5.2 12.2 12.3 26.0 43.8
*2001 100.0 0.4 4.3 12.1 12.0 25.4 45.8
*2002 100.0 0.3 4.4 12.2 12.1 26.2 44.8
**2003 100.0 0.3 4.2 11.6 12.2 26.3 45.4
*** 2004 100.0 0.4 4.1 11.8 12.2 25.5 46.0
**** 2005 100.0 0.1 3.6 11.3 12.9 25.6 46.5
*2006 100.0 0.3 4.0 10.2 12.0 24.2 49.2
*2007 100.0 0.2 3.6 9.8 12.0 23.9 50.5
*2008 100.0 0.2 3.4 9.8 11.6 23.8 51.2
**2008 100.0 0.3 3.5 9.8 11.6 23.8 50.9
*2009 100.0 0.3 3.3 8.5 11.4 24.3 52.2
**2009 100.0 0.3 3.4 8.5 11.5 24.3 51.9
*2010 100.0 0.1 2.9 8.4 10.8 24.0 53.8
**2010 100.0 0.1 3.0 8.5 10.9 24.0 53.5
*2011 100.0 0.1 2.9 8.4 10.9 24.2 53.4
**2011 100.0 0.1 3.0 8.4 10.9 24.3 53.2
****2011 100.0 0.1 3.1 8.6 11.0 24.3 52.9
These figures are to be treated with caution as the corresponding CV (Cofficient of
variation) values are high.
* - Excluding Northern and Eastern provinces
** - Including Eastern province but Excluding Northern province
*** - Excluding Mulathivu,Kilinochchi districts.
**** - All the districts are included
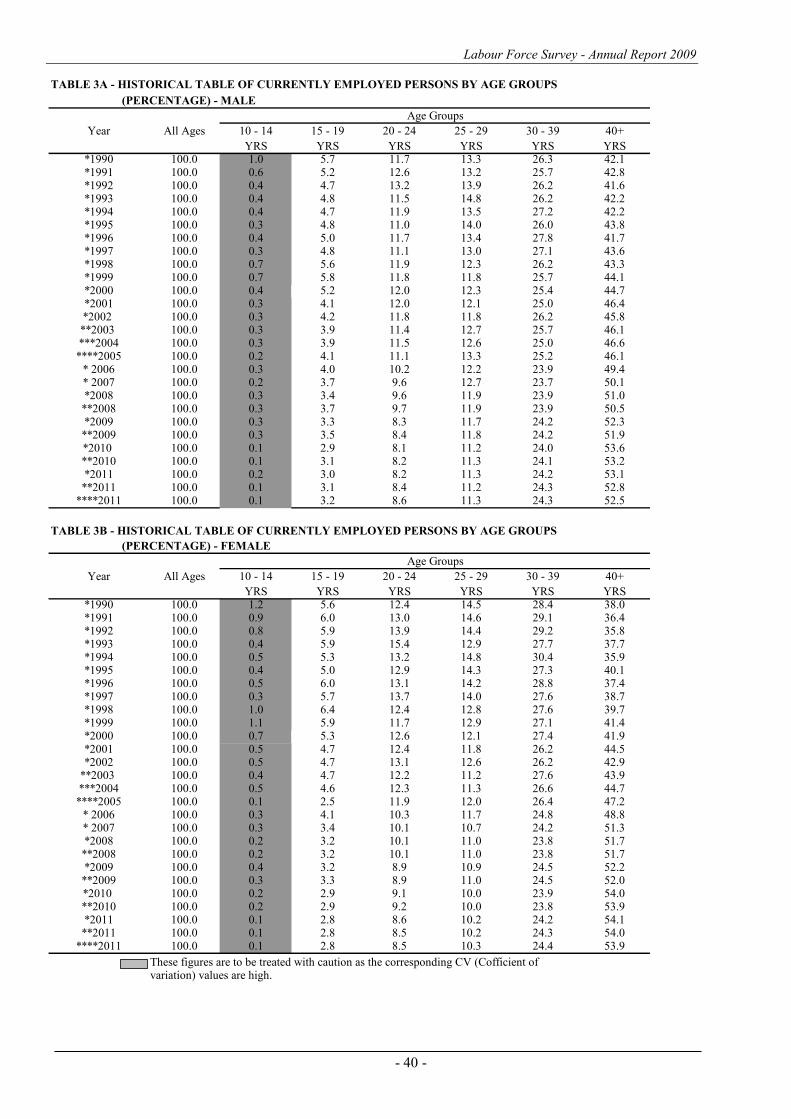
Labour Force Survey - Annual Report 2009
- 40 -
TABLE 3A - HISTORICAL TABLE OF CURRENTLY EMPLOYED PERSONS BY AGE GROUPS
(PERCENTAGE) - MALE
Year All Ages 10 - 14 15 - 19 20 - 24 25 - 29 30 - 39 40+
YRS YRS YRS YRS YRS YRS*1990 100.0 1.0 5.7 11.7 13.3 26.3 42.1*1991 100.0 0.6 5.2 12.6 13.2 25.7 42.8*1992 100.0 0.4 4.7 13.2 13.9 26.2 41.6*1993 100.0 0.4 4.8 11.5 14.8 26.2 42.2*1994 100.0 0.4 4.7 11.9 13.5 27.2 42.2*1995 100.0 0.3 4.8 11.0 14.0 26.0 43.8*1996 100.0 0.4 5.0 11.7 13.4 27.8 41.7*1997 100.0 0.3 4.8 11.1 13.0 27.1 43.6*1998 100.0 0.7 5.6 11.9 12.3 26.2 43.3*1999 100.0 0.7 5.8 11.8 11.8 25.7 44.1*2000 100.0 0.4 5.2 12.0 12.3 25.4 44.7*2001 100.0 0.3 4.1 12.0 12.1 25.0 46.4*2002 100.0 0.3 4.2 11.8 11.8 26.2 45.8**2003 100.0 0.3 3.9 11.4 12.7 25.7 46.1***2004 100.0 0.3 3.9 11.5 12.6 25.0 46.6****2005 100.0 0.2 4.1 11.1 13.3 25.2 46.1
* 2006 100.0 0.3 4.0 10.2 12.2 23.9 49.4* 2007 100.0 0.2 3.7 9.6 12.7 23.7 50.1*2008 100.0 0.3 3.4 9.6 11.9 23.9 51.0**2008 100.0 0.3 3.7 9.7 11.9 23.9 50.5*2009 100.0 0.3 3.3 8.3 11.7 24.2 52.3**2009 100.0 0.3 3.5 8.4 11.8 24.2 51.9*2010 100.0 0.1 2.9 8.1 11.2 24.0 53.6**2010 100.0 0.1 3.1 8.2 11.3 24.1 53.2*2011 100.0 0.2 3.0 8.2 11.3 24.2 53.1**2011 100.0 0.1 3.1 8.4 11.2 24.3 52.8
****2011 100.0 0.1 3.2 8.6 11.3 24.3 52.5
TABLE 3B - HISTORICAL TABLE OF CURRENTLY EMPLOYED PERSONS BY AGE GROUPS
(PERCENTAGE) - FEMALE
Year All Ages 10 - 14 15 - 19 20 - 24 25 - 29 30 - 39 40+
YRS YRS YRS YRS YRS YRS*1990 100.0 1.2 5.6 12.4 14.5 28.4 38.0*1991 100.0 0.9 6.0 13.0 14.6 29.1 36.4*1992 100.0 0.8 5.9 13.9 14.4 29.2 35.8*1993 100.0 0.4 5.9 15.4 12.9 27.7 37.7*1994 100.0 0.5 5.3 13.2 14.8 30.4 35.9*1995 100.0 0.4 5.0 12.9 14.3 27.3 40.1*1996 100.0 0.5 6.0 13.1 14.2 28.8 37.4*1997 100.0 0.3 5.7 13.7 14.0 27.6 38.7*1998 100.0 1.0 6.4 12.4 12.8 27.6 39.7*1999 100.0 1.1 5.9 11.7 12.9 27.1 41.4*2000 100.0 0.7 5.3 12.6 12.1 27.4 41.9*2001 100.0 0.5 4.7 12.4 11.8 26.2 44.5*2002 100.0 0.5 4.7 13.1 12.6 26.2 42.9
**2003 100.0 0.4 4.7 12.2 11.2 27.6 43.9***2004 100.0 0.5 4.6 12.3 11.3 26.6 44.7****2005 100.0 0.1 2.5 11.9 12.0 26.4 47.2
* 2006 100.0 0.3 4.1 10.3 11.7 24.8 48.8* 2007 100.0 0.3 3.4 10.1 10.7 24.2 51.3*2008 100.0 0.2 3.2 10.1 11.0 23.8 51.7**2008 100.0 0.2 3.2 10.1 11.0 23.8 51.7*2009 100.0 0.4 3.2 8.9 10.9 24.5 52.2**2009 100.0 0.3 3.3 8.9 11.0 24.5 52.0*2010 100.0 0.2 2.9 9.1 10.0 23.9 54.0**2010 100.0 0.2 2.9 9.2 10.0 23.8 53.9*2011 100.0 0.1 2.8 8.6 10.2 24.2 54.1**2011 100.0 0.1 2.8 8.5 10.2 24.3 54.0
****2011 100.0 0.1 2.8 8.5 10.3 24.4 53.9
These figures are to be treated with caution as the corresponding CV (Cofficient of variation) values are high.
Age Groups
Age Groups
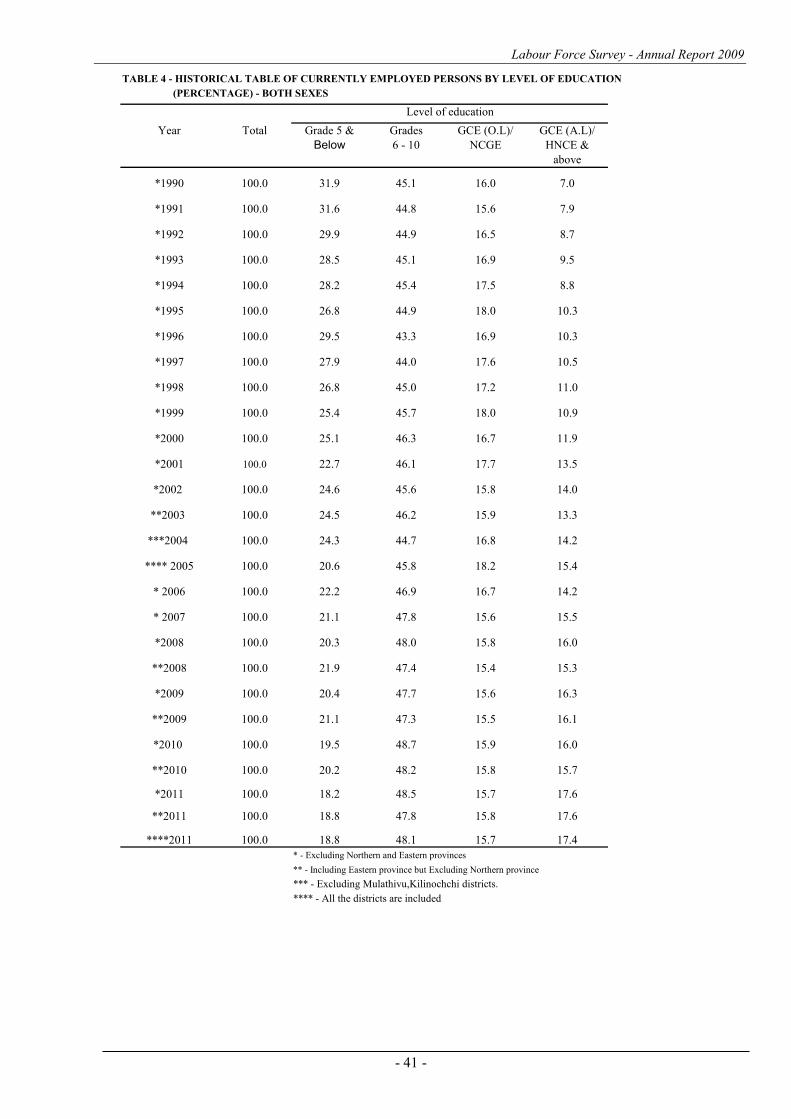
Labour Force Survey - Annual Report 2009
- 41 -
TABLE 4 - HISTORICAL TABLE OF CURRENTLY EMPLOYED PERSONS BY LEVEL OF EDUCATION
(PERCENTAGE) - BOTH SEXES
Year Total Grade 5 & Grades GCE (O.L)/ GCE (A.L)/
Below 6 - 10 NCGE HNCE &
above
*1990 100.0 31.9 45.1 16.0 7.0
*1991 100.0 31.6 44.8 15.6 7.9
*1992 100.0 29.9 44.9 16.5 8.7
*1993 100.0 28.5 45.1 16.9 9.5
*1994 100.0 28.2 45.4 17.5 8.8
*1995 100.0 26.8 44.9 18.0 10.3
*1996 100.0 29.5 43.3 16.9 10.3
*1997 100.0 27.9 44.0 17.6 10.5
*1998 100.0 26.8 45.0 17.2 11.0
*1999 100.0 25.4 45.7 18.0 10.9
*2000 100.0 25.1 46.3 16.7 11.9
*2001 100.0 22.7 46.1 17.7 13.5
*2002 100.0 24.6 45.6 15.8 14.0
**2003 100.0 24.5 46.2 15.9 13.3
***2004 100.0 24.3 44.7 16.8 14.2
**** 2005 100.0 20.6 45.8 18.2 15.4
* 2006 100.0 22.2 46.9 16.7 14.2
* 2007 100.0 21.1 47.8 15.6 15.5
*2008 100.0 20.3 48.0 15.8 16.0
**2008 100.0 21.9 47.4 15.4 15.3
*2009 100.0 20.4 47.7 15.6 16.3
**2009 100.0 21.1 47.3 15.5 16.1
*2010 100.0 19.5 48.7 15.9 16.0
**2010 100.0 20.2 48.2 15.8 15.7
*2011 100.0 18.2 48.5 15.7 17.6
**2011 100.0 18.8 47.8 15.8 17.6
****2011 100.0 18.8 48.1 15.7 17.4
* - Excluding Northern and Eastern provinces
** - Including Eastern province but Excluding Northern province
*** - Excluding Mulathivu,Kilinochchi districts.
**** - All the districts are included
Level of education
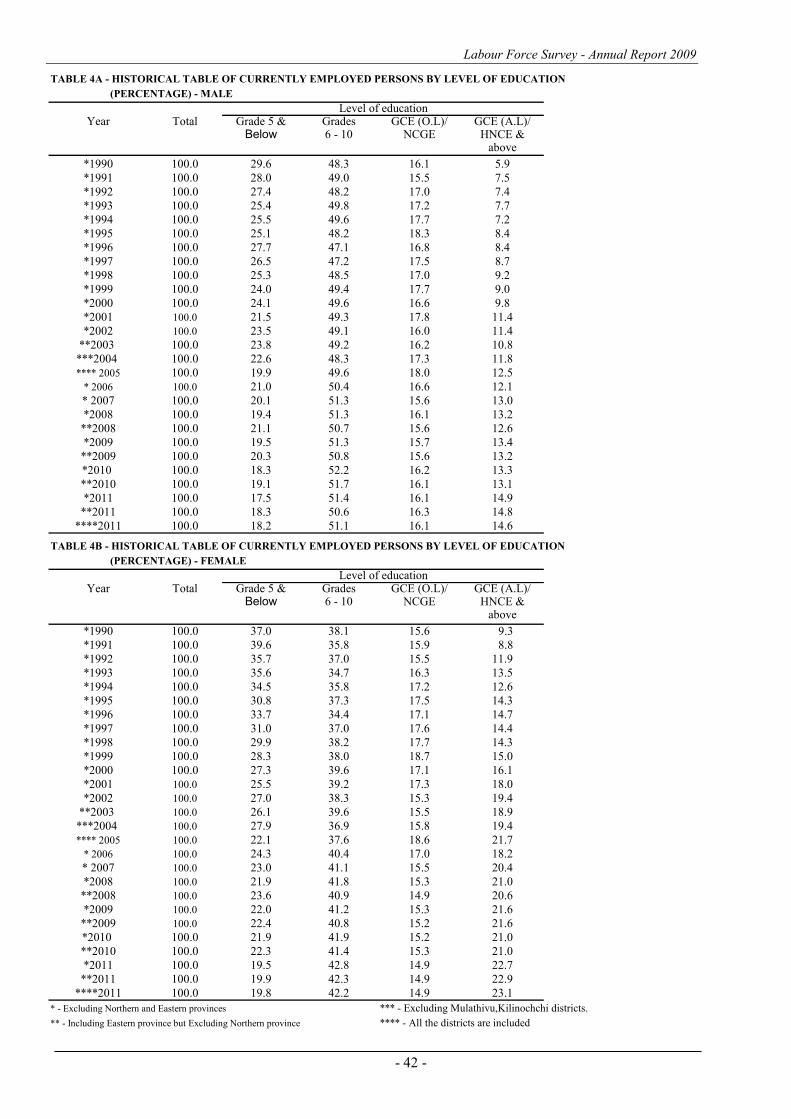
Labour Force Survey - Annual Report 2009
- 42 -
TABLE 4A - HISTORICAL TABLE OF CURRENTLY EMPLOYED PERSONS BY LEVEL OF EDUCATION
(PERCENTAGE) - MALE
Year Total Grade 5 & Grades GCE (O.L)/ GCE (A.L)/Below 6 - 10 NCGE HNCE &
above
*1990 100.0 29.6 48.3 16.1 5.9
*1991 100.0 28.0 49.0 15.5 7.5
*1992 100.0 27.4 48.2 17.0 7.4
*1993 100.0 25.4 49.8 17.2 7.7
*1994 100.0 25.5 49.6 17.7 7.2
*1995 100.0 25.1 48.2 18.3 8.4
*1996 100.0 27.7 47.1 16.8 8.4
*1997 100.0 26.5 47.2 17.5 8.7
*1998 100.0 25.3 48.5 17.0 9.2
*1999 100.0 24.0 49.4 17.7 9.0
*2000 100.0 24.1 49.6 16.6 9.8
*2001 100.0 21.5 49.3 17.8 11.4
*2002 100.0 23.5 49.1 16.0 11.4
**2003 100.0 23.8 49.2 16.2 10.8
***2004 100.0 22.6 48.3 17.3 11.8
**** 2005 100.0 19.9 49.6 18.0 12.5
* 2006 100.0 21.0 50.4 16.6 12.1
* 2007 100.0 20.1 51.3 15.6 13.0
*2008 100.0 19.4 51.3 16.1 13.2
**2008 100.0 21.1 50.7 15.6 12.6
*2009 100.0 19.5 51.3 15.7 13.4
**2009 100.0 20.3 50.8 15.6 13.2
*2010 100.0 18.3 52.2 16.2 13.3
**2010 100.0 19.1 51.7 16.1 13.1
*2011 100.0 17.5 51.4 16.1 14.9
**2011 100.0 18.3 50.6 16.3 14.8
****2011 100.0 18.2 51.1 16.1 14.6
TABLE 4B - HISTORICAL TABLE OF CURRENTLY EMPLOYED PERSONS BY LEVEL OF EDUCATION
(PERCENTAGE) - FEMALE
Year Total Grade 5 & Grades GCE (O.L)/ GCE (A.L)/Below 6 - 10 NCGE HNCE &
above
*1990 100.0 37.0 38.1 15.6 9.3
*1991 100.0 39.6 35.8 15.9 8.8
*1992 100.0 35.7 37.0 15.5 11.9
*1993 100.0 35.6 34.7 16.3 13.5
*1994 100.0 34.5 35.8 17.2 12.6
*1995 100.0 30.8 37.3 17.5 14.3
*1996 100.0 33.7 34.4 17.1 14.7
*1997 100.0 31.0 37.0 17.6 14.4
*1998 100.0 29.9 38.2 17.7 14.3
*1999 100.0 28.3 38.0 18.7 15.0
*2000 100.0 27.3 39.6 17.1 16.1
*2001 100.0 25.5 39.2 17.3 18.0
*2002 100.0 27.0 38.3 15.3 19.4
**2003 100.0 26.1 39.6 15.5 18.9
***2004 100.0 27.9 36.9 15.8 19.4
**** 2005 100.0 22.1 37.6 18.6 21.7
* 2006 100.0 24.3 40.4 17.0 18.2
* 2007 100.0 23.0 41.1 15.5 20.4
*2008 100.0 21.9 41.8 15.3 21.0
**2008 100.0 23.6 40.9 14.9 20.6
*2009 100.0 22.0 41.2 15.3 21.6
**2009 100.0 22.4 40.8 15.2 21.6
*2010 100.0 21.9 41.9 15.2 21.0
**2010 100.0 22.3 41.4 15.3 21.0
*2011 100.0 19.5 42.8 14.9 22.7
**2011 100.0 19.9 42.3 14.9 22.9
****2011 100.0 19.8 42.2 14.9 23.1
* - Excluding Northern and Eastern provinces *** - Excluding Mulathivu,Kilinochchi districts.
** - Including Eastern province but Excluding Northern province **** - All the districts are included
Level of education
Level of education
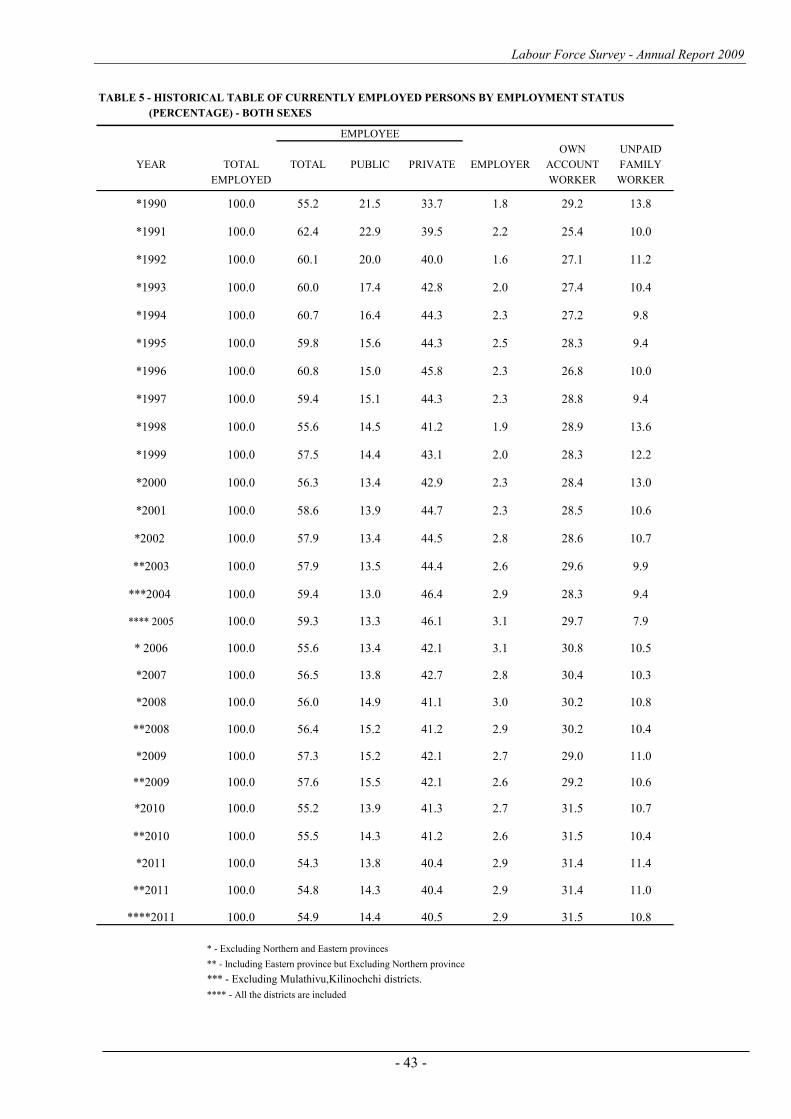
Labour Force Survey - Annual Report 2009
- 43 -
TABLE 5 - HISTORICAL TABLE OF CURRENTLY EMPLOYED PERSONS BY EMPLOYMENT STATUS
(PERCENTAGE) - BOTH SEXES
OWN UNPAID
YEAR TOTAL TOTAL PUBLIC PRIVATE EMPLOYER ACCOUNT FAMILY
EMPLOYED WORKER WORKER
*1990 100.0 55.2 21.5 33.7 1.8 29.2 13.8
*1991 100.0 62.4 22.9 39.5 2.2 25.4 10.0
*1992 100.0 60.1 20.0 40.0 1.6 27.1 11.2
*1993 100.0 60.0 17.4 42.8 2.0 27.4 10.4
*1994 100.0 60.7 16.4 44.3 2.3 27.2 9.8
*1995 100.0 59.8 15.6 44.3 2.5 28.3 9.4
*1996 100.0 60.8 15.0 45.8 2.3 26.8 10.0
*1997 100.0 59.4 15.1 44.3 2.3 28.8 9.4
*1998 100.0 55.6 14.5 41.2 1.9 28.9 13.6
*1999 100.0 57.5 14.4 43.1 2.0 28.3 12.2
*2000 100.0 56.3 13.4 42.9 2.3 28.4 13.0
*2001 100.0 58.6 13.9 44.7 2.3 28.5 10.6
*2002 100.0 57.9 13.4 44.5 2.8 28.6 10.7
**2003 100.0 57.9 13.5 44.4 2.6 29.6 9.9
***2004 100.0 59.4 13.0 46.4 2.9 28.3 9.4
**** 2005 100.0 59.3 13.3 46.1 3.1 29.7 7.9
* 2006 100.0 55.6 13.4 42.1 3.1 30.8 10.5
*2007 100.0 56.5 13.8 42.7 2.8 30.4 10.3
*2008 100.0 56.0 14.9 41.1 3.0 30.2 10.8
**2008 100.0 56.4 15.2 41.2 2.9 30.2 10.4
*2009 100.0 57.3 15.2 42.1 2.7 29.0 11.0
**2009 100.0 57.6 15.5 42.1 2.6 29.2 10.6
*2010 100.0 55.2 13.9 41.3 2.7 31.5 10.7
**2010 100.0 55.5 14.3 41.2 2.6 31.5 10.4
*2011 100.0 54.3 13.8 40.4 2.9 31.4 11.4
**2011 100.0 54.8 14.3 40.4 2.9 31.4 11.0
****2011 100.0 54.9 14.4 40.5 2.9 31.5 10.8
* - Excluding Northern and Eastern provinces
** - Including Eastern province but Excluding Northern province
*** - Excluding Mulathivu,Kilinochchi districts.
**** - All the districts are included
EMPLOYEE
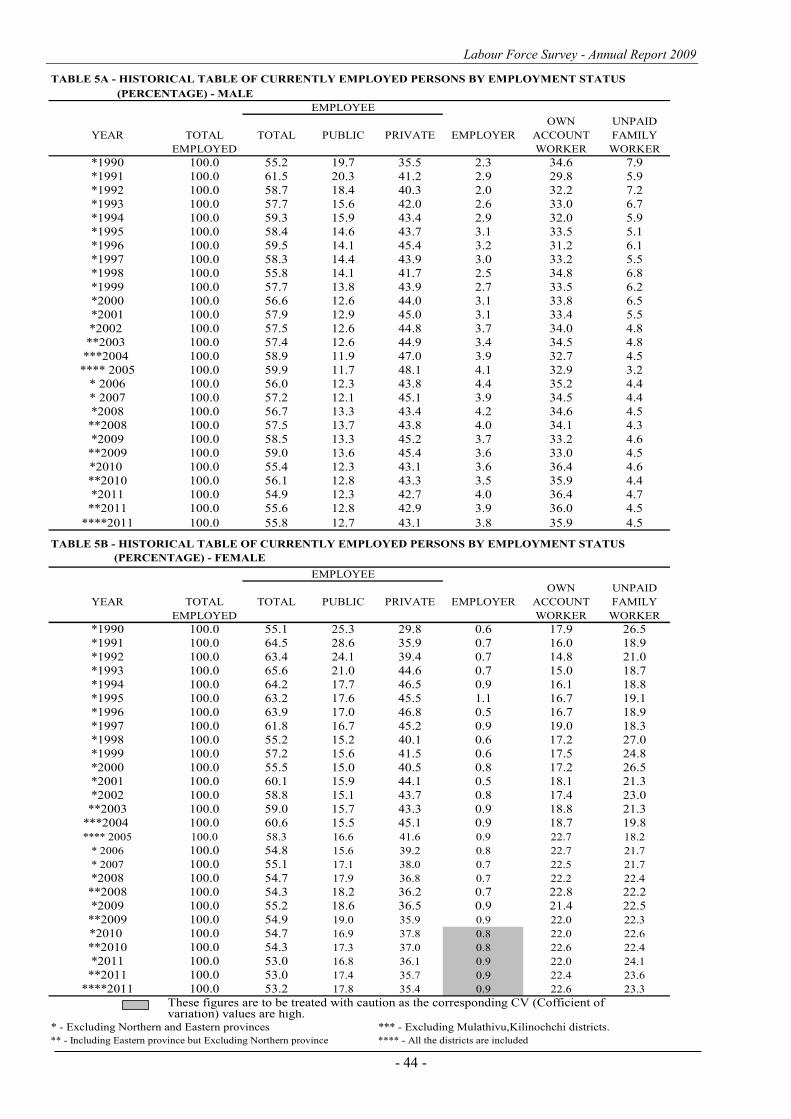
Labour Force Survey - Annual Report 2009
- 44 -
TABLE 5A - HISTORICAL TABLE OF CURRENTLY EMPLOYED PERSONS BY EMPLOYMENT STATUS
(PERCENTAGE) - MALE
OWN UNPAID
YEAR TOTAL TOTAL PUBLIC PRIVATE EMPLOYER ACCOUNT FAMILY
EMPLOYED WORKER WORKER
*1990 100.0 55.2 19.7 35.5 2.3 34.6 7.9
*1991 100.0 61.5 20.3 41.2 2.9 29.8 5.9
*1992 100.0 58.7 18.4 40.3 2.0 32.2 7.2
*1993 100.0 57.7 15.6 42.0 2.6 33.0 6.7
*1994 100.0 59.3 15.9 43.4 2.9 32.0 5.9
*1995 100.0 58.4 14.6 43.7 3.1 33.5 5.1
*1996 100.0 59.5 14.1 45.4 3.2 31.2 6.1
*1997 100.0 58.3 14.4 43.9 3.0 33.2 5.5
*1998 100.0 55.8 14.1 41.7 2.5 34.8 6.8
*1999 100.0 57.7 13.8 43.9 2.7 33.5 6.2
*2000 100.0 56.6 12.6 44.0 3.1 33.8 6.5
*2001 100.0 57.9 12.9 45.0 3.1 33.4 5.5
*2002 100.0 57.5 12.6 44.8 3.7 34.0 4.8
**2003 100.0 57.4 12.6 44.9 3.4 34.5 4.8
***2004 100.0 58.9 11.9 47.0 3.9 32.7 4.5
**** 2005 100.0 59.9 11.7 48.1 4.1 32.9 3.2
* 2006 100.0 56.0 12.3 43.8 4.4 35.2 4.4
* 2007 100.0 57.2 12.1 45.1 3.9 34.5 4.4
*2008 100.0 56.7 13.3 43.4 4.2 34.6 4.5
**2008 100.0 57.5 13.7 43.8 4.0 34.1 4.3
*2009 100.0 58.5 13.3 45.2 3.7 33.2 4.6
**2009 100.0 59.0 13.6 45.4 3.6 33.0 4.5
*2010 100.0 55.4 12.3 43.1 3.6 36.4 4.6
**2010 100.0 56.1 12.8 43.3 3.5 35.9 4.4
*2011 100.0 54.9 12.3 42.7 4.0 36.4 4.7
**2011 100.0 55.6 12.8 42.9 3.9 36.0 4.5
****2011 100.0 55.8 12.7 43.1 3.8 35.9 4.5
TABLE 5B - HISTORICAL TABLE OF CURRENTLY EMPLOYED PERSONS BY EMPLOYMENT STATUS
(PERCENTAGE) - FEMALE
OWN UNPAID
YEAR TOTAL TOTAL PUBLIC PRIVATE EMPLOYER ACCOUNT FAMILY
EMPLOYED WORKER WORKER
*1990 100.0 55.1 25.3 29.8 0.6 17.9 26.5
*1991 100.0 64.5 28.6 35.9 0.7 16.0 18.9
*1992 100.0 63.4 24.1 39.4 0.7 14.8 21.0
*1993 100.0 65.6 21.0 44.6 0.7 15.0 18.7
*1994 100.0 64.2 17.7 46.5 0.9 16.1 18.8
*1995 100.0 63.2 17.6 45.5 1.1 16.7 19.1
*1996 100.0 63.9 17.0 46.8 0.5 16.7 18.9
*1997 100.0 61.8 16.7 45.2 0.9 19.0 18.3
*1998 100.0 55.2 15.2 40.1 0.6 17.2 27.0
*1999 100.0 57.2 15.6 41.5 0.6 17.5 24.8
*2000 100.0 55.5 15.0 40.5 0.8 17.2 26.5
*2001 100.0 60.1 15.9 44.1 0.5 18.1 21.3
*2002 100.0 58.8 15.1 43.7 0.8 17.4 23.0
**2003 100.0 59.0 15.7 43.3 0.9 18.8 21.3
***2004 100.0 60.6 15.5 45.1 0.9 18.7 19.8
**** 2005 100.0 58.3 16.6 41.6 0.9 22.7 18.2
* 2006 100.0 54.8 15.6 39.2 0.8 22.7 21.7
* 2007 100.0 55.1 17.1 38.0 0.7 22.5 21.7
*2008 100.0 54.7 17.9 36.8 0.7 22.2 22.4
**2008 100.0 54.3 18.2 36.2 0.7 22.8 22.2
*2009 100.0 55.2 18.6 36.5 0.9 21.4 22.5
**2009 100.0 54.9 19.0 35.9 0.9 22.0 22.3
*2010 100.0 54.7 16.9 37.8 0.8 22.0 22.6
**2010 100.0 54.3 17.3 37.0 0.8 22.6 22.4
*2011 100.0 53.0 16.8 36.1 0.9 22.0 24.1
**2011 100.0 53.0 17.4 35.7 0.9 22.4 23.6
****2011 100.0 53.2 17.8 35.4 0.9 22.6 23.3
These figures are to be treated with caution as the corresponding CV (Cofficient of variation) values are high.
* - Excluding Northern and Eastern provinces *** - Excluding Mulathivu,Kilinochchi districts.
** - Including Eastern province but Excluding Northern province **** - All the districts are included
EMPLOYEE
EMPLOYEE
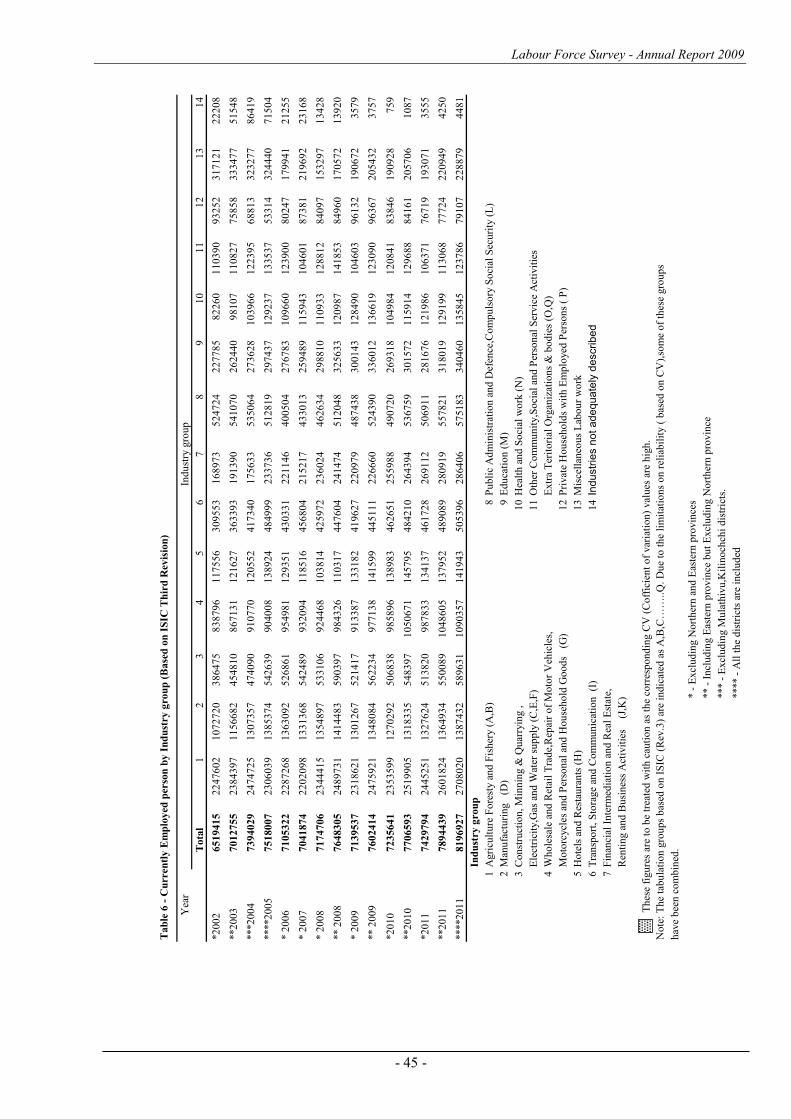
Labour Force Survey - Annual Report 2009
- 45 -
Tab
le 6
- C
urr
entl
y E
mp
loy
ed p
erso
n b
y I
nd
ust
ry g
rou
p (
Base
d o
n I
SIC
Th
ird
Rev
isio
n)
Yea
r
Tota
l1
23
45
67
89
10
11
12
13
14
*2
00
2
65
19
41
52
24
76
02
10
72
72
03
86
47
58
38
79
61
17
55
63
09
55
31
68
97
35
24
72
42
27
78
58
22
60
11
03
90
93
25
23
17
12
12
22
08
**2
00
3
70
12
75
52
38
43
97
11
56
68
24
54
81
08
67
13
11
21
62
73
63
39
31
91
39
05
41
07
02
62
44
09
81
07
11
08
27
75
85
83
33
47
75
15
48
***2
00
4
73
94
02
92
47
47
25
13
07
35
74
74
09
09
10
77
01
20
55
24
17
34
01
75
63
35
35
06
42
73
62
81
03
96
61
22
39
56
88
13
32
32
77
86
41
9
****2
00
57
51
80
07
23
06
03
91
38
53
74
54
26
39
90
40
08
13
89
24
48
49
99
23
37
36
51
28
19
29
74
37
12
92
37
13
35
37
53
31
43
24
44
07
15
04
* 2
00
67
10
53
22
22
87
26
81
36
30
92
52
68
61
95
49
81
12
93
51
43
03
31
22
11
46
40
05
04
27
67
83
10
96
60
12
39
00
80
24
71
79
94
12
12
55
* 2
00
77
04
18
74
22
02
09
81
33
13
68
54
24
89
93
20
94
11
85
16
45
68
04
21
52
17
43
30
13
25
94
89
11
59
43
10
46
01
87
38
12
19
69
22
31
68
* 2
00
87
17
47
06
23
44
41
51
35
48
97
53
31
06
92
44
68
10
38
14
42
59
72
23
60
24
46
26
34
29
88
10
11
09
33
12
88
12
84
09
71
53
29
71
34
28
** 2
00
87
64
83
05
24
89
73
11
41
44
83
59
03
97
98
43
26
11
03
17
44
76
04
24
14
74
51
20
48
32
56
33
12
09
87
14
18
53
84
96
01
70
57
21
39
20
* 2
00
97
13
95
37
23
18
62
11
30
12
67
52
14
17
91
33
87
13
31
82
41
96
27
22
09
79
48
74
38
30
01
43
12
84
90
10
46
03
96
13
21
90
67
23
57
9
** 2
00
97
60
24
14
24
75
92
11
34
80
84
56
22
34
97
71
38
14
15
99
44
51
11
22
66
60
52
43
90
33
60
12
13
66
19
12
30
90
96
36
72
05
43
23
75
7
*2
01
07
23
56
41
23
53
59
91
27
02
92
50
68
38
98
58
96
13
89
83
46
26
51
25
59
88
49
07
20
26
93
18
10
49
84
12
08
41
83
84
61
90
92
87
59
**2
01
07
70
65
93
25
19
90
51
31
83
35
54
83
97
10
50
67
11
45
79
54
84
21
02
64
39
45
36
75
93
01
57
21
15
91
41
29
68
88
41
61
20
57
06
10
87
*2
01
17
42
97
94
24
45
25
11
32
76
24
51
38
20
98
78
33
13
41
37
46
17
28
26
91
12
50
69
11
28
16
76
12
19
86
10
63
71
76
71
91
93
07
13
55
5
**2
01
17
89
44
39
26
01
82
41
36
49
34
55
00
89
10
48
60
51
37
95
24
89
08
92
80
91
95
57
82
13
18
01
91
29
19
91
13
06
87
77
24
22
09
49
42
50
****2
01
18
19
69
27
27
08
02
01
38
74
32
58
96
31
10
90
35
71
41
94
35
05
39
62
86
40
65
75
18
33
40
46
01
35
84
51
23
78
67
91
07
22
88
79
44
81
Ind
ust
ry g
rou
p
1A
gri
cult
ure
Fo
rest
y a
nd
Fis
her
y (
A,B
)8
Pu
bli
c A
dm
inis
trat
ion
an
d D
efen
ce,C
om
pu
lso
ry S
oci
al S
ecu
rity
(L
)
2M
anu
fact
uri
ng
(D
)9
Ed
uca
tio
n (
M)
3C
on
stru
ctio
n,
Min
nin
g &
Qu
arry
ing ,
1
0H
ealt
h a
nd
So
cial
wo
rk (
N)
Ele
ctri
city
,Gas
an
d W
ater
su
pp
ly (
C,E
,F)
11
Oth
er C
om
mu
nit
y,S
oci
al a
nd
Per
son
al S
ervic
e A
ctiv
itie
s
4W
ho
lesa
le a
nd
Ret
ail
Tra
de,
Rep
air
of
Mo
tor
Veh
icle
s,E
xtr
a T
erit
ori
al O
rgan
izat
ion
s &
bo
die
s (O
,Q)
Mo
torc
ycl
es a
nd
Per
son
al a
nd
Ho
use
ho
ld G
oo
ds
(G
)1
2P
rivat
e H
ou
seh
old
s w
ith
Em
plo
yed
Per
son
s (
P)
5H
ote
ls a
nd
Res
tau
ran
ts (
H)
13
Mis
cell
aneo
us
Lab
ou
r w
ork
6T
ran
spo
rt,
Sto
rage
and
Co
mm
un
icat
ion
(I
)1
4In
du
str
ies n
ot
ad
eq
ua
tely
de
scri
be
d
7F
inan
cial
In
term
edia
tio
n a
nd
Rea
l E
stat
e,
Ren
tin
g a
nd
Bu
sin
ess
Act
ivit
ies
(
J,K
)
T
hes
e fi
gu
res
are
to b
e tr
eate
d w
ith
cau
tio
n a
s th
e co
rres
po
nd
ing C
V (
Co
ffic
ien
t o
f var
iati
on
) val
ues
are
hig
h.
No
te:
Th
e ta
bu
lati
on
gro
up
s b
ased
on
IS
IC (
Rev
.3)
are
ind
icat
ed a
s A
,B,C
……
..Q
. D
ue
to t
he
lim
itat
ion
s o
n r
elia
bil
ity (
bas
ed o
n C
V),
som
e o
f th
ese
gro
up
s
hav
e b
een
co
mb
ined
.
* -
Excl
ud
ing N
ort
her
n a
nd
Eas
tern
pro
vin
ces
** -
In
clu
din
g E
aste
rn p
rovin
ce b
ut
Excl
ud
ing N
ort
her
n p
rovin
ce
*** -
Excl
ud
ing M
ula
thiv
u,K
ilin
och
chi
dis
tric
ts.
**** -
All
th
e d
istr
icts
are
in
clu
ded
Ind
ust
ry g
rou
p
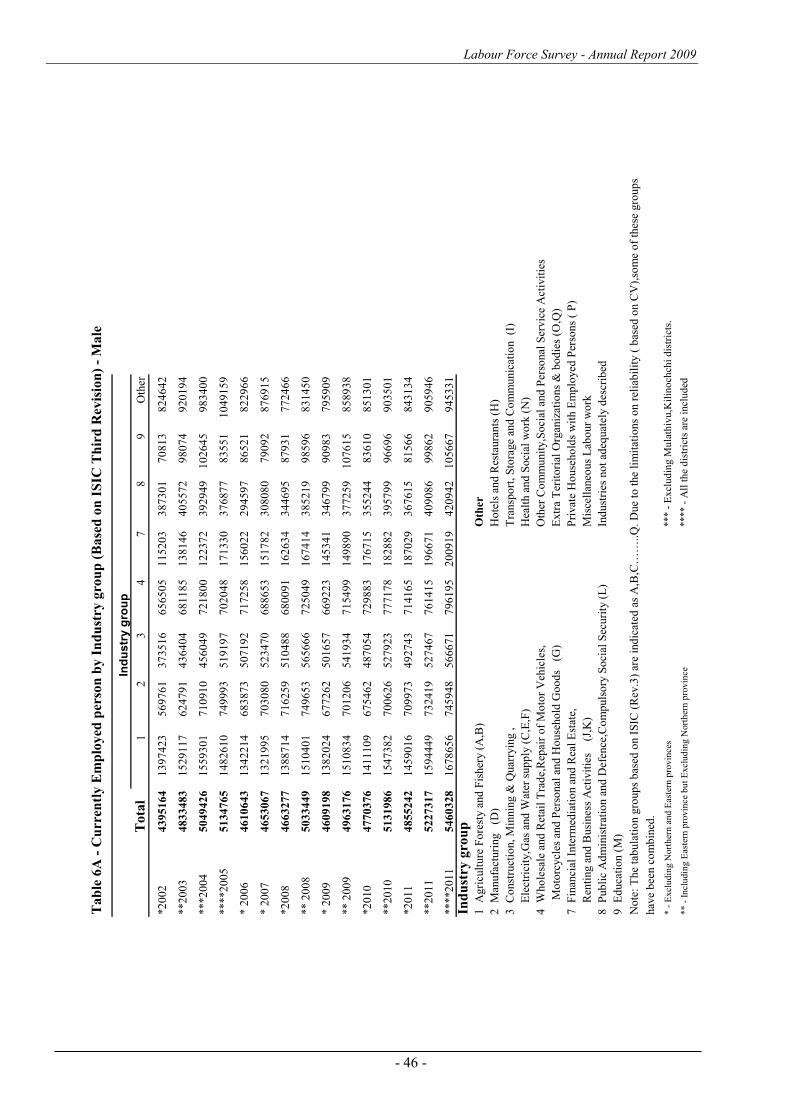
Labour Force Survey - Annual Report 2009
- 46 -
Tab
le 6
A -
Cu
rren
tly E
mp
loyed
per
son
by I
nd
ust
ry g
rou
p (
Base
d o
n I
SIC
Th
ird
Rev
isio
n)
- M
ale
Ind
us
try g
rou
p
Tota
l1
23
47
89
Oth
er
*2
00
2
43
95
16
41
39
74
23
56
97
61
37
35
16
65
65
05
11
52
03
38
73
01
70
81
38
24
64
2
**2
00
3
48
33
48
31
52
91
17
62
47
91
43
64
04
68
11
85
13
81
46
40
55
72
98
07
49
20
19
4
***2
00
4
50
49
42
61
55
93
01
71
09
10
45
60
49
72
18
00
12
23
72
39
29
49
10
26
45
98
34
00
****2
00
55
13
47
65
14
82
61
07
49
99
35
19
19
77
02
04
81
71
33
03
76
87
78
35
51
10
49
15
9
* 2
00
64
61
06
43
13
42
21
46
83
87
35
07
19
27
17
25
81
56
02
22
94
59
78
65
21
82
29
66
* 2
00
74
65
30
67
13
21
99
57
03
08
05
23
47
06
88
65
31
51
78
23
08
08
07
90
92
87
69
15
*2
00
84
66
32
77
13
88
71
47
16
25
95
10
48
86
80
09
11
62
63
43
44
69
58
79
31
77
24
66
** 2
00
85
03
34
49
15
10
40
17
49
65
35
65
66
67
25
04
91
67
41
43
85
21
99
85
96
83
14
50
* 2
00
94
60
91
98
13
82
02
46
77
26
25
01
65
76
69
22
31
45
34
13
46
79
99
09
83
79
59
09
** 2
00
94
96
31
76
15
10
83
47
01
20
65
41
93
47
15
49
91
49
89
03
77
25
91
07
61
58
58
93
8
*2
01
04
77
03
76
14
11
10
96
75
46
24
87
05
47
29
88
31
76
71
53
55
24
48
36
10
85
13
01
**2
01
05
13
19
86
15
47
38
27
00
62
65
27
92
37
77
17
81
82
88
23
95
79
99
66
96
90
35
01
*2
01
14
85
52
42
14
59
01
67
09
97
34
92
74
37
14
16
51
87
02
93
67
61
58
15
66
84
31
34
**2
01
15
22
73
17
15
94
44
97
32
41
95
27
46
77
61
41
51
96
67
14
09
08
69
98
62
90
59
46
****2
01
15
46
03
28
16
78
65
67
45
94
85
66
67
17
96
19
52
00
91
94
20
94
21
05
66
79
45
33
1
Ind
ust
ry g
rou
p
1
Agri
cult
ure
Fo
rest
y a
nd
Fis
her
y (
A,B
)O
ther
2
Man
ufa
cturi
ng
(D
)H
ote
ls a
nd
Res
taura
nts
(H
)
3
Co
nst
ruct
ion,
Min
nin
g &
Quar
ryin
g ,
T
ransp
ort
, S
tora
ge
and
Co
mm
unic
atio
n
(I)
Ele
ctri
city
,Gas
and
Wat
er s
up
ply
(C
,E,F
)H
ealt
h a
nd
So
cial
wo
rk (
N)
4
Who
lesa
le a
nd
Ret
ail
Tra
de,
Rep
air
of
Mo
tor
Veh
icle
s,O
ther
Co
mm
unit
y,S
oci
al a
nd
Per
sonal
Ser
vic
e A
ctiv
itie
s
Mo
torc
ycl
es a
nd
Per
sonal
and
Ho
use
ho
ld G
oo
ds
(G
)E
xtr
a T
erit
ori
al O
rgan
izat
ions
& b
od
ies
(O,Q
)
7
Fin
anci
al I
nte
rmed
iati
on a
nd
Rea
l E
stat
e,P
rivat
e H
ouse
ho
lds
wit
h E
mp
loyed
Per
sons
( P
)
Ren
ting a
nd
Busi
nes
s A
ctiv
itie
s
(J,
K)
Mis
cell
aneo
us
Lab
our
wo
rk
8
Pub
lic
Ad
min
istr
atio
n a
nd
Def
ence
,Co
mp
uls
ory
So
cial
Sec
uri
ty (
L)
Ind
ust
ries
no
t ad
equat
ely d
escr
ibed
9
Ed
uca
tio
n (
M)
No
te:
The
tab
ula
tio
n g
roup
s b
ased
on I
SIC
(R
ev.3
) ar
e in
dic
ated
as
A,B
,C…
…..
Q.
Due
to t
he
lim
itat
ions
on r
elia
bil
ity (
bas
ed o
n C
V),
som
e o
f th
ese
gro
up
s
hav
e b
een c
om
bin
ed.
* -
Excl
ud
ing N
ort
her
n a
nd
Eas
tern
pro
vin
ces
*** -
Excl
ud
ing M
ula
thiv
u,K
ilin
och
chi
dis
tric
ts.
** -
In
clu
din
g E
aste
rn p
rovin
ce b
ut
Excl
ud
ing N
ort
her
n p
rovin
ce**** -
All
th
e d
istr
icts
are
in
clu
ded
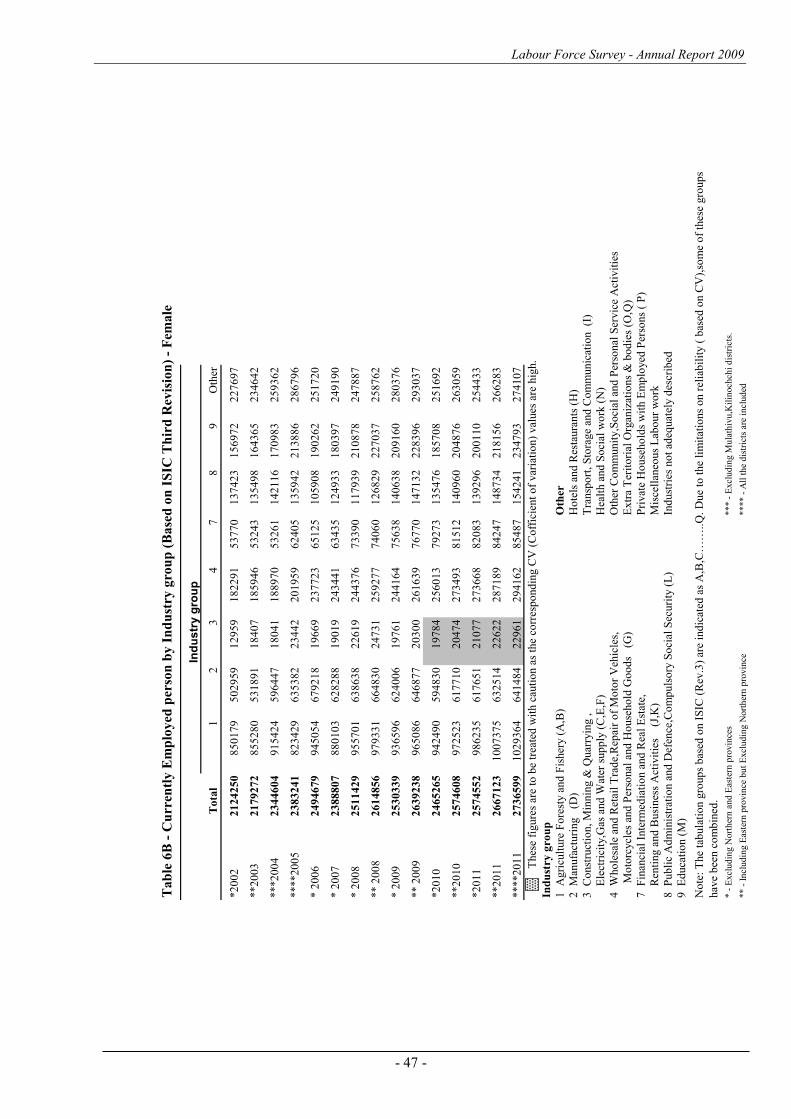
Labour Force Survey - Annual Report 2009
- 47 -
Tab
le 6
B -
Cu
rren
tly E
mp
loyed
per
son
by I
nd
ust
ry g
rou
p (
Base
d o
n I
SIC
Th
ird
Rev
isio
n)
- F
emale
Ind
ustr
y g
rou
p
To
tal
12
34
78
9O
ther
*2
00
2
21
24
25
08
50
17
95
02
95
91
29
59
18
22
91
53
77
01
37
42
31
56
97
22
27
69
7
**2
00
3
21
79
27
28
55
28
05
31
89
11
84
07
18
59
46
53
24
31
35
49
81
64
36
52
34
64
2
***2
00
4
23
44
60
49
15
42
45
96
44
71
80
41
18
89
70
53
26
11
42
11
61
70
98
32
59
36
2
****2
00
52
38
32
41
82
34
29
63
53
82
23
44
22
01
95
96
24
05
13
59
42
21
38
86
28
67
96
* 2
00
62
49
46
79
94
50
54
67
92
18
19
66
92
37
72
36
51
25
10
59
08
19
02
62
25
17
20
* 2
00
72
38
88
07
88
01
03
62
82
88
19
01
92
43
44
16
34
35
12
49
33
18
03
97
24
91
90
* 2
00
82
51
14
29
95
57
01
63
86
38
22
61
92
44
37
67
33
90
11
79
39
21
08
78
24
78
87
** 2
00
82
61
48
56
97
93
31
66
48
30
24
73
12
59
27
77
40
60
12
68
29
22
70
37
25
87
62
* 2
00
92
53
03
39
93
65
96
62
40
06
19
76
12
44
16
47
56
38
14
06
38
20
91
60
28
03
76
** 2
00
92
63
92
38
96
50
86
64
68
77
20
30
02
61
63
97
67
70
14
71
32
22
83
96
29
30
37
*2
01
02
46
52
65
94
24
90
59
48
30
19
78
42
56
01
37
92
73
13
54
76
18
57
08
25
16
92
**2
01
02
57
46
08
97
25
23
61
77
10
20
47
42
73
49
38
15
12
14
09
60
20
48
76
26
30
59
*2
01
12
57
45
52
98
62
35
61
76
51
21
07
72
73
66
88
20
83
13
92
96
20
01
10
25
44
33
**2
01
12
66
71
23
10
07
37
56
32
51
42
26
22
28
71
89
84
24
71
48
73
42
18
15
62
66
28
3
****2
01
12
73
65
99
10
29
36
46
41
48
42
29
61
29
41
62
85
48
71
54
24
12
34
79
32
74
10
7
T
hes
e fi
gure
s ar
e to
be
trea
ted
wit
h c
auti
on a
s th
e co
rres
po
nd
ing C
V (
Co
ffic
ient
of
var
iati
on)
val
ues
are
hig
h.
Ind
ust
ry g
rou
p
1
Agri
cult
ure
Fo
rest
y a
nd
Fis
her
y (
A,B
)O
ther
2
Man
ufa
cturi
ng
(D
)H
ote
ls a
nd
Res
taura
nts
(H
)
3
Co
nst
ruct
ion,
Min
nin
g &
Quar
ryin
g ,
T
ransp
ort
, S
tora
ge
and
Co
mm
unic
atio
n
(I)
Ele
ctri
city
,Gas
and
Wat
er s
up
ply
(C
,E,F
)H
ealt
h a
nd
So
cial
wo
rk (
N)
4
Who
lesa
le a
nd
Ret
ail
Tra
de,
Rep
air
of
Mo
tor
Veh
icle
s,O
ther
Co
mm
unit
y,S
oci
al a
nd
Per
sonal
Ser
vic
e A
ctiv
itie
s
Mo
torc
ycl
es a
nd
Per
sonal
and
Ho
use
ho
ld G
oo
ds
(G
)E
xtr
a T
erit
ori
al O
rgan
izat
ions
& b
od
ies
(O,Q
)
7
Fin
anci
al I
nte
rmed
iati
on a
nd
Rea
l E
stat
e,P
rivat
e H
ouse
ho
lds
wit
h E
mp
loyed
Per
sons
( P
)
Ren
ting a
nd
Busi
nes
s A
ctiv
itie
s
(J,
K)
Mis
cell
aneo
us
Lab
our
wo
rk
8
Pub
lic
Ad
min
istr
atio
n a
nd
Def
ence
,Co
mp
uls
ory
So
cial
Sec
uri
ty (
L)
Ind
ust
ries
no
t ad
equat
ely d
escr
ibed
9
Ed
uca
tio
n (
M)
No
te:
The
tab
ula
tio
n g
roup
s b
ased
on I
SIC
(R
ev.3
) ar
e in
dic
ated
as
A,B
,C…
…..
Q.
Due
to t
he
lim
itat
ions
on r
elia
bil
ity (
bas
ed o
n C
V),
som
e o
f th
ese
gro
up
s
hav
e b
een c
om
bin
ed.
* -
Excl
ud
ing N
ort
her
n a
nd
Eas
tern
pro
vin
ces
*** -
Excl
ud
ing M
ula
thiv
u,K
ilin
och
chi
dis
tric
ts.
** -
In
clu
din
g E
aste
rn p
rovin
ce b
ut
Excl
ud
ing N
ort
her
n p
rovin
ce**** -
All
th
e d
istr
icts
are
in
clu
ded
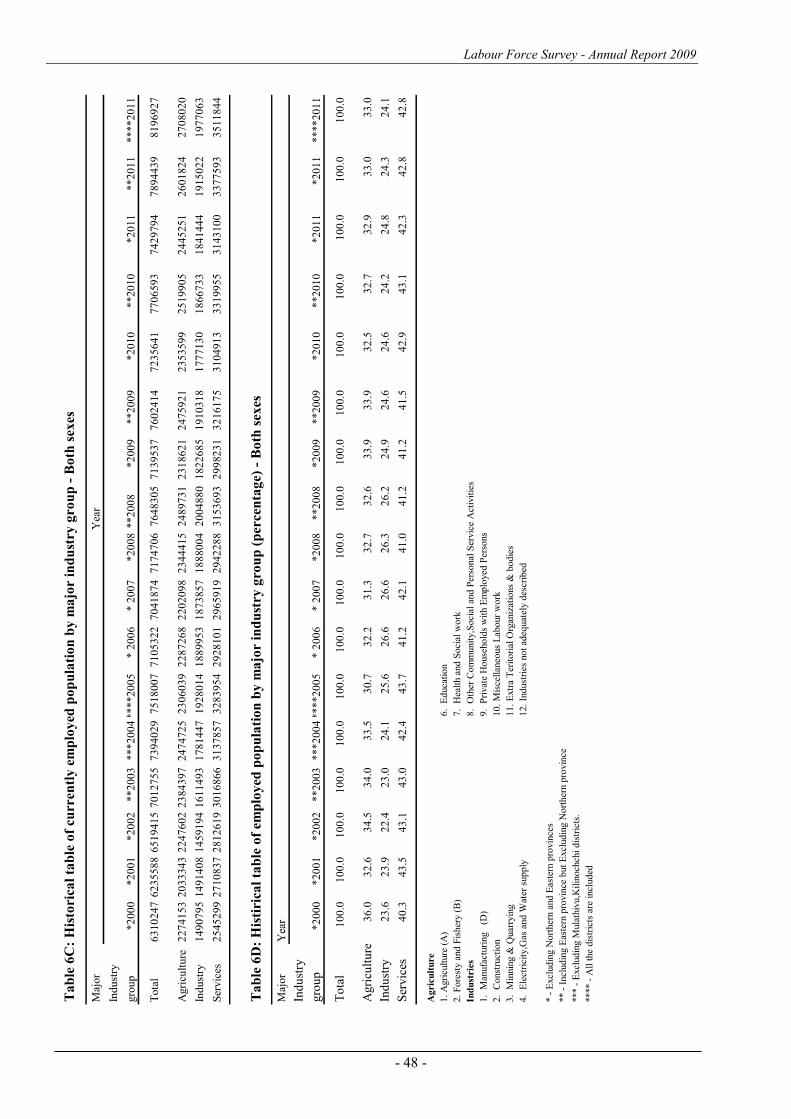
Labour Force Survey - Annual Report 2009
- 48 -
Ta
ble
6C
: H
isto
rica
l ta
ble
of
curr
entl
y e
mp
loy
ed p
op
ula
tio
n b
y m
ajo
r in
du
stry
gro
up
- B
oth
sex
es
Maj
or
Ind
ust
ry
gro
up
*2
00
0*2
00
1*2
00
2**2
00
3***2
00
4****2
00
5* 2
00
6* 2
00
7*2
00
8**2
00
8*2
00
9**2
00
9*2
01
0**2
01
0*2
01
1**2
01
1****2
01
1
Tota
l6
31
02
47
62
35
58
86
51
94
15
70
12
75
57
39
40
29
75
18
00
77
10
53
22
70
41
87
47
17
47
06
76
48
30
57
13
95
37
76
02
41
47
23
56
41
77
06
59
37
42
97
94
78
94
43
98
19
69
27
Agri
cult
ure
22
74
15
32
03
33
43
22
47
60
22
38
43
97
24
74
72
52
30
60
39
22
87
26
82
20
20
98
23
44
41
52
48
97
31
23
18
62
12
47
59
21
23
53
59
92
51
99
05
24
45
25
12
60
18
24
27
08
02
0
Ind
ust
ry1
49
07
95
14
91
40
81
45
91
94
16
11
49
31
78
14
47
19
28
01
41
88
99
53
18
73
85
71
88
80
04
20
04
88
01
82
26
85
19
10
31
81
77
71
30
18
66
73
31
84
14
44
19
15
02
21
97
70
63
Ser
vic
es2
54
52
99
27
10
83
72
81
26
19
30
16
86
63
13
78
57
32
83
95
42
92
81
01
29
65
91
92
94
22
88
31
53
69
32
99
82
31
32
16
17
53
10
49
13
33
19
95
53
14
31
00
33
77
59
33
51
18
44
Ta
ble
6D
: H
isti
rica
l ta
ble
of
emp
loy
ed p
op
ula
tio
n b
y m
ajo
r in
du
stry
gro
up
(p
ercen
tag
e) -
Bo
th s
exes
Maj
or
Yea
r
Ind
ust
ry
gro
up
*2
00
0*2
00
1*2
00
2**2
00
3***2
00
4****2
00
5* 2
00
6* 2
00
7*2
00
8**2
00
8*2
00
9**2
00
9*2
01
0**2
01
0*2
01
1*2
01
1****2
01
1
To
tal
10
0.0
10
0.0
10
0.0
10
0.0
10
0.0
10
0.0
10
0.0
10
0.0
10
0.0
10
0.0
10
0.0
10
0.0
10
0.0
10
0.0
10
0.0
10
0.0
10
0.0
Agri
cult
ure
36
.03
2.6
34
.53
4.0
33
.53
0.7
32
.23
1.3
32
.73
2.6
33
.93
3.9
32
.53
2.7
32
.93
3.0
33
.0
Ind
ust
ry2
3.6
23
.92
2.4
23
.02
4.1
25
.62
6.6
26
.62
6.3
26
.22
4.9
24
.62
4.6
24
.22
4.8
24
.32
4.1
Ser
vic
es4
0.3
43
.54
3.1
43
.04
2.4
43
.74
1.2
42
.14
1.0
41
.24
1.2
41
.54
2.9
43
.14
2.3
42
.84
2.8
Ag
ric
ult
ure
1.
Agri
cult
ure
(A
)6
. E
duca
tio
n
2.
Fo
rest
y a
nd
Fis
her
y (
B)
7.
Hea
lth a
nd
So
cial
wo
rk
Ind
ust
rie
s8
. O
ther
Co
mm
unit
y,S
oci
al a
nd
Per
sonal
Ser
vic
e A
ctiv
itie
s
1.
Man
ufa
cturi
ng
(D
)9
. P
rivat
e H
ouse
ho
lds
wit
h E
mp
loyed
Per
sons
2.
Co
nst
ruct
ion
1
0.
Mis
cell
aneo
us
Lab
our
wo
rk
3.
Min
nin
g &
Quar
ryin
g
1
1.
Extr
a T
erit
ori
al O
rgan
izat
ions
& b
od
ies
4.
Ele
ctri
city
,Gas
and
Wat
er s
up
ply
1
2.
Ind
ust
ries
no
t ad
equat
ely d
escr
ibed
* -
Excl
ud
ing N
ort
her
n a
nd
Eas
tern
pro
vin
ces
** -
Incl
ud
ing E
aste
rn p
rovin
ce b
ut
Excl
ud
ing N
ort
her
n p
rovin
ce
*** -
Excl
ud
ing M
ula
thiv
u,K
ilin
och
chi
dis
tric
ts.
**** -
All
the
dis
tric
ts a
re i
ncl
ud
ed
Yea
r
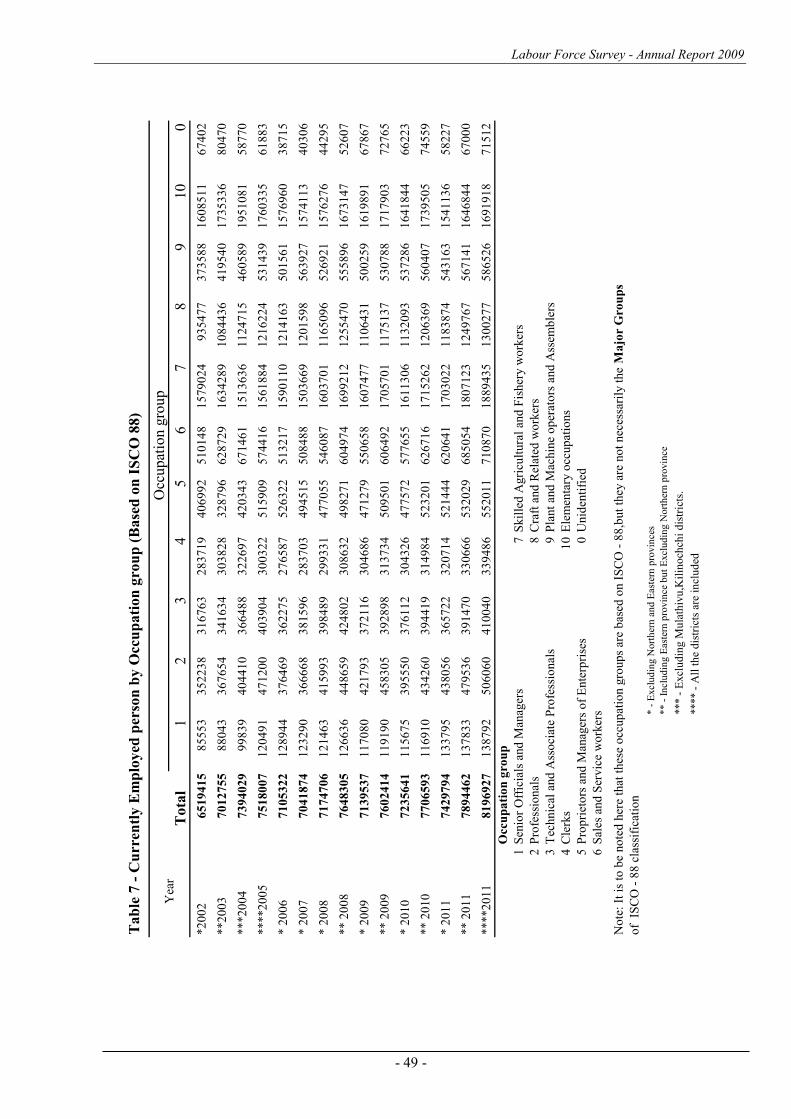
Labour Force Survey - Annual Report 2009
- 49 -
Ta
ble
7 -
Cu
rren
tly
Em
plo
yed
per
son
by
Occ
up
ati
on
gro
up
(B
ase
d o
n I
SC
O 8
8)
To
tal
12
34
56
78
910
0
*2
00
26
51
94
15
85
55
33
52
23
83
16
76
32
83
71
94
06
99
25
10
14
81
57
90
24
93
54
77
37
35
88
16
08
51
16
74
02
**2
00
37
01
27
55
88
04
33
67
65
43
41
63
43
03
82
83
28
79
66
28
72
91
63
42
89
10
84
43
64
19
54
01
73
53
36
80
47
0
***2
00
4
73
94
02
99
98
39
40
44
10
36
64
88
32
26
97
42
03
43
67
14
61
15
13
63
61
12
47
15
46
05
89
19
51
08
15
87
70
****2
00
57
51
80
07
12
04
91
47
12
00
40
39
04
30
03
22
51
59
09
57
44
16
15
61
88
41
21
62
24
53
14
39
17
60
33
56
18
83
* 2
00
67
10
53
22
12
89
44
37
64
69
36
22
75
27
65
87
52
63
22
51
32
17
15
90
11
01
21
41
63
50
15
61
15
76
96
03
87
15
* 2
00
77
04
18
74
12
32
90
36
66
68
38
15
96
28
37
03
49
45
15
50
84
88
15
03
66
91
20
15
98
56
39
27
15
74
11
34
03
06
* 2
00
87
17
47
06
12
14
63
41
59
93
39
84
89
29
93
31
47
70
55
54
60
87
16
03
70
11
16
50
96
52
69
21
15
76
27
64
42
95
** 2
00
87
64
83
05
12
66
36
44
86
59
42
48
02
30
86
32
49
82
71
60
49
74
16
99
21
21
25
54
70
55
58
96
16
73
14
75
26
07
* 2
00
97
13
95
37
11
70
80
42
17
93
37
21
16
30
46
86
47
12
79
55
06
58
16
07
47
71
10
64
31
50
02
59
16
19
89
16
78
67
** 2
00
97
60
24
14
11
91
90
45
83
05
39
28
98
31
37
34
50
95
01
60
64
92
17
05
70
11
17
51
37
53
07
88
17
17
90
37
27
65
* 2
01
07
23
56
41
11
56
75
39
55
50
37
61
12
30
43
26
47
75
72
57
76
55
16
11
30
61
13
20
93
53
72
86
16
41
84
46
62
23
** 2
01
07
70
65
93
11
69
10
43
42
60
39
44
19
31
49
84
52
32
01
62
67
16
17
15
26
21
20
63
69
56
04
07
17
39
50
57
45
59
* 2
01
17
42
97
94
13
37
95
43
80
56
36
57
22
32
07
14
52
14
44
62
06
41
17
03
02
21
18
38
74
54
31
63
15
41
13
65
82
27
** 2
01
17
89
44
62
13
78
33
47
95
36
39
14
70
33
06
66
53
20
29
68
50
54
18
07
12
31
24
97
67
56
71
41
16
46
84
46
70
00
****2
01
18
19
69
27
13
87
92
50
60
60
41
00
40
33
94
86
55
20
11
71
08
70
18
89
43
51
30
02
77
58
65
26
16
91
91
87
15
12
Occ
up
ati
on
gro
up
1S
enio
r O
ffic
ials
and
Man
ager
s7
Skil
led
Agri
cult
ura
l an
d F
isher
y w
ork
ers
2P
rofe
ssio
nal
s8
Cra
ft a
nd
Rel
ated
wo
rker
s
3T
echnic
al a
nd
Ass
oci
ate
Pro
fess
ional
s9
Pla
nt
and
Mac
hin
e o
per
ato
rs a
nd
Ass
emb
lers
4C
lerk
s1
0E
lem
enta
ry o
ccup
atio
ns
5P
rop
riet
ors
and
Man
ager
s o
f E
nte
rpri
ses
0U
nid
enti
fied
6S
ales
and
Ser
vic
e w
ork
ers
No
te:
It i
s to
be
no
ted
her
e th
at t
hes
e o
ccup
atio
n g
roup
s ar
e b
ased
on I
SC
O -
88
,but
they
are
no
t nec
essa
rily
the
Ma
jor
Gro
up
s
of
IS
CO
- 8
8 c
lass
ific
atio
n
* -
Excl
ud
ing N
ort
her
n a
nd
Eas
tern
pro
vin
ces
** -
In
clu
din
g E
aste
rn p
rovin
ce b
ut
Excl
ud
ing N
ort
her
n p
rovin
ce
*** -
Excl
ud
ing M
ula
thiv
u,K
ilin
och
chi
dis
tric
ts.
**** -
All
th
e d
istr
icts
are
in
clu
ded
Occ
up
atio
n g
roup
Yea
r
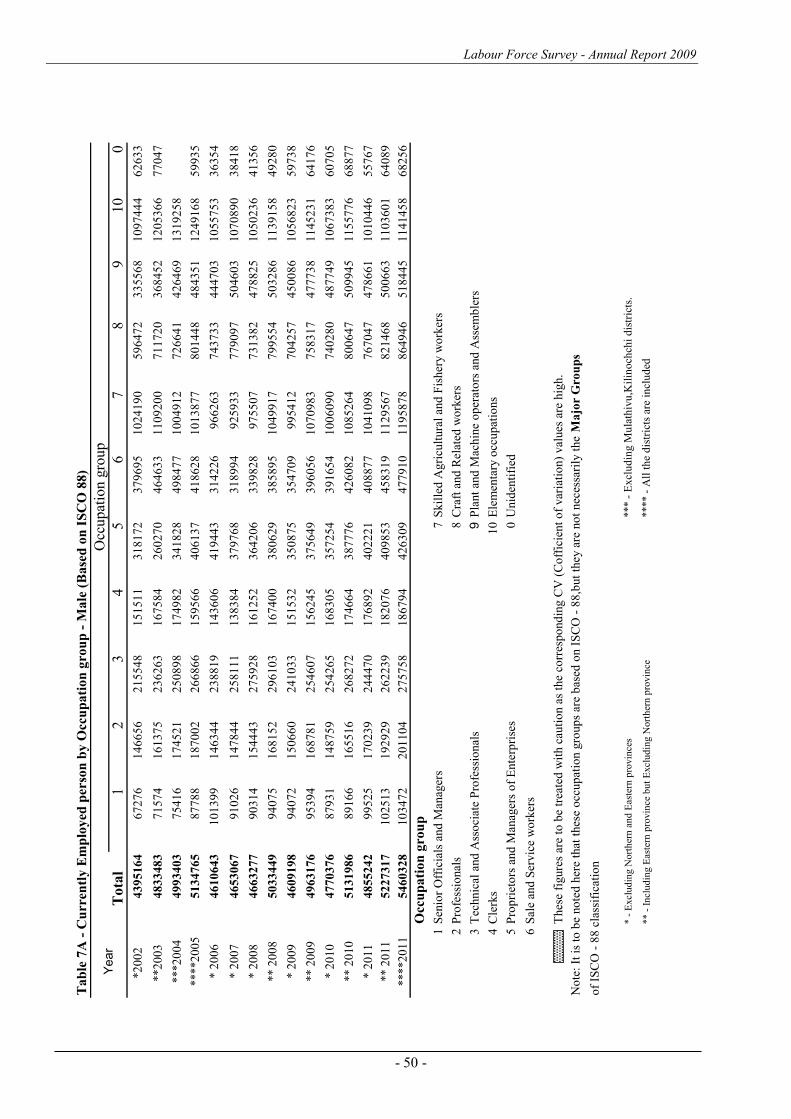
Labour Force Survey - Annual Report 2009
- 50 -
Ta
ble
7A
- C
urr
en
tly
Em
plo
yed
per
son
by
Occ
up
ati
on
gro
up
- M
ale
(B
ase
d o
n I
SC
O 8
8)
To
tal
12
34
56
78
91
00
*2
00
2
43
95
16
46
72
76
14
66
56
21
55
48
15
15
11
31
81
72
37
96
95
10
24
19
05
96
47
23
35
56
81
09
74
44
62
63
3
**2
00
3
48
33
48
37
15
74
16
13
75
23
62
63
16
75
84
26
02
70
46
46
33
11
09
20
07
11
72
03
68
45
21
20
53
66
77
04
7
***2
00
44
99
34
03
75
41
61
74
52
12
50
89
81
74
98
23
41
82
84
98
47
71
00
49
12
72
66
41
42
64
69
13
19
25
8
****2
00
55
13
47
65
87
78
81
87
00
22
66
86
61
59
56
64
06
13
74
18
62
81
01
38
77
80
14
48
48
43
51
12
49
16
85
99
35
* 2
00
64
61
06
43
10
13
99
14
63
44
23
88
19
14
36
06
41
94
43
31
42
26
96
62
63
74
37
33
44
47
03
10
55
75
33
63
54
* 2
00
74
65
30
67
91
02
61
47
84
42
58
11
11
38
38
43
79
76
83
18
99
49
25
93
37
79
09
75
04
60
31
07
08
90
38
41
8
* 2
00
84
66
32
77
90
31
41
54
44
32
75
92
81
61
25
23
64
20
63
39
82
89
75
50
77
31
38
24
78
82
51
05
02
36
41
35
6
** 2
00
85
03
34
49
94
07
51
68
15
22
96
10
31
67
40
03
80
62
93
85
89
51
04
99
17
79
95
54
50
32
86
11
39
15
84
92
80
* 2
00
94
60
91
98
94
07
21
50
66
02
41
03
31
51
53
23
50
87
53
54
70
99
95
41
27
04
25
74
50
08
61
05
68
23
59
73
8
** 2
00
94
96
31
76
95
39
41
68
78
12
54
60
71
56
24
53
75
64
93
96
05
61
07
09
83
75
83
17
47
77
38
11
45
23
16
41
76
* 2
01
04
77
03
76
87
93
11
48
75
92
54
26
51
68
30
53
57
25
43
91
65
41
00
60
90
74
02
80
48
77
49
10
67
38
36
07
05
** 2
01
05
13
19
86
89
16
61
65
51
62
68
27
21
74
66
43
87
77
64
26
08
21
08
52
64
80
06
47
50
99
45
11
55
77
66
88
77
* 2
01
14
85
52
42
99
52
51
70
23
92
44
47
01
76
89
24
02
22
14
08
87
71
04
10
98
76
70
47
47
86
61
10
10
44
65
57
67
** 2
01
15
22
73
17
10
25
13
19
29
29
26
22
39
18
20
76
40
98
53
45
83
19
11
29
56
78
21
46
85
00
66
31
10
36
01
64
08
9
****2
01
15
46
03
28
10
34
72
20
11
04
27
57
58
18
67
94
42
63
09
47
79
10
11
95
87
88
64
94
65
18
44
51
14
14
58
68
25
6
Occ
up
ati
on
gro
up
1S
enio
r O
ffic
ials
and
Man
ager
s7
Skil
led
Agri
cult
ura
l an
d F
isher
y w
ork
ers
2P
rofe
ssio
nal
s8
Cra
ft a
nd
Rel
ated
wo
rker
s
3T
echnic
al a
nd
Ass
oci
ate
Pro
fess
ional
s9
Pla
nt
and
Mac
hin
e o
per
ato
rs a
nd
Ass
emb
lers
4C
lerk
s1
0E
lem
enta
ry o
ccup
atio
ns
5P
rop
riet
ors
and
Man
ager
s o
f E
nte
rpri
ses
0U
nid
enti
fied
6S
ale
and
Ser
vic
e w
ork
ers
Thes
e fi
gure
s ar
e to
be
trea
ted
wit
h c
auti
on a
s th
e co
rres
po
nd
ing C
V (
Co
ffic
ient
of
var
iati
on)
val
ues
are
hig
h.
No
te:
It i
s to
be
no
ted
her
e th
at t
hes
e o
ccup
atio
n g
roup
s ar
e b
ased
on I
SC
O -
88
,but
they
are
no
t nec
essa
rily
the
Ma
jor
Gro
up
s
of
ISC
O -
88
cla
ssif
icat
ion
* -
Excl
ud
ing N
ort
her
n a
nd
Eas
tern
pro
vin
ces
*** -
Excl
ud
ing M
ula
thiv
u,K
ilin
och
chi
dis
tric
ts.
** -
In
clu
din
g E
aste
rn p
rovin
ce b
ut
Excl
ud
ing N
ort
her
n p
rovin
ce**** -
All
th
e d
istr
icts
are
in
clu
ded
Occ
up
atio
n g
rou
pY
ear
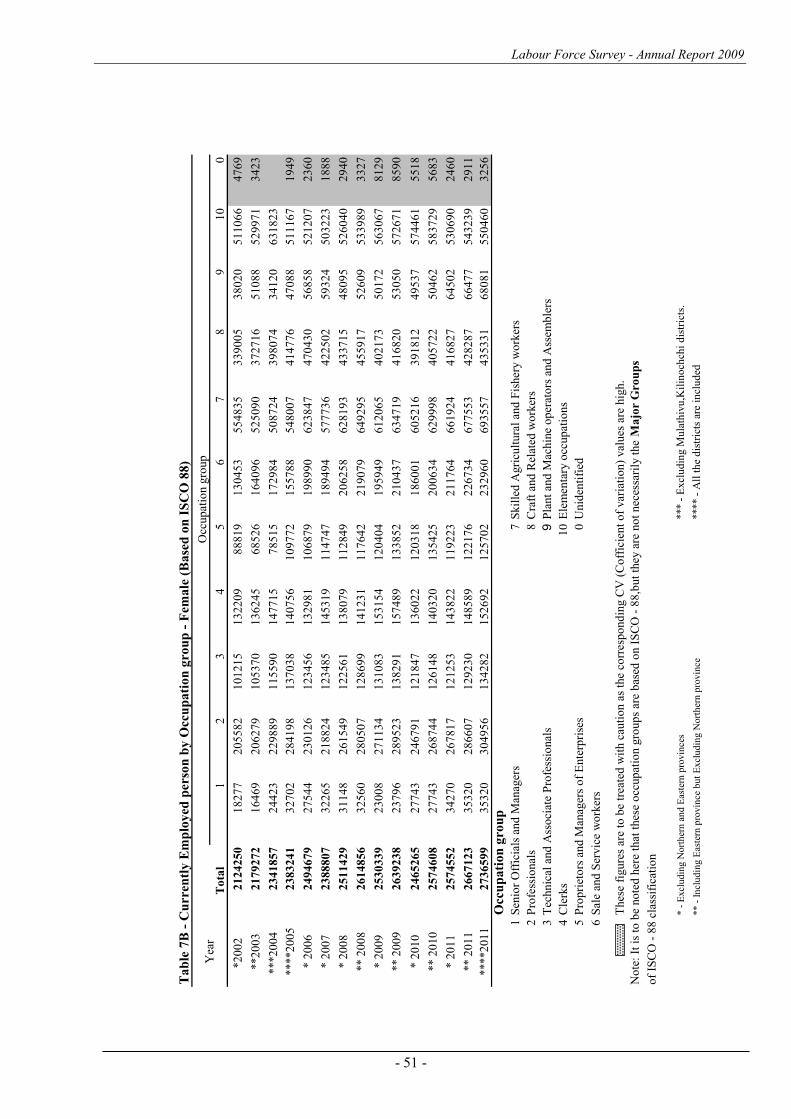
Labour Force Survey - Annual Report 2009
- 51 -
Tab
le 7
B -
Cu
rren
tly E
mp
loyed
per
son
by O
ccu
pati
on
gro
up
- F
emale
(B
ase
d o
n I
SC
O 8
8)
To
tal
12
34
56
78
91
00
*2
00
2
21
24
25
01
82
77
20
55
82
10
12
15
13
22
09
88
81
91
30
45
35
54
83
53
39
00
53
80
20
51
10
66
47
69
**2
00
32
17
92
72
16
46
92
06
27
91
05
37
01
36
24
56
85
26
16
40
96
52
50
90
37
27
16
51
08
85
29
97
13
42
3
***2
00
4
23
41
85
72
44
23
22
98
89
11
55
90
14
77
15
78
51
51
72
98
45
08
72
43
98
07
43
41
20
63
18
23
****2
00
52
38
32
41
32
70
22
84
19
81
37
03
81
40
75
61
09
77
21
55
78
85
48
00
74
14
77
64
70
88
51
11
67
19
49
* 2
00
62
49
46
79
27
54
42
30
12
61
23
45
61
32
98
11
06
87
91
98
99
06
23
84
74
70
43
05
68
58
52
12
07
23
60
* 2
00
72
38
88
07
32
26
52
18
82
41
23
48
51
45
31
91
14
74
71
89
49
45
77
73
64
22
50
25
93
24
50
32
23
18
88
* 2
00
82
51
14
29
31
14
82
61
54
91
22
56
11
38
07
91
12
84
92
06
25
86
28
19
34
33
71
54
80
95
52
60
40
29
40
** 2
00
82
61
48
56
32
56
02
80
50
71
28
69
91
41
23
11
17
64
22
19
07
96
49
29
54
55
91
75
26
09
53
39
89
33
27
* 2
00
92
53
03
39
23
00
82
71
13
41
31
08
31
53
15
41
20
40
41
95
94
96
12
06
54
02
17
35
01
72
56
30
67
81
29
** 2
00
92
63
92
38
23
79
62
89
52
31
38
29
11
57
48
91
33
85
22
10
43
76
34
71
94
16
82
05
30
50
57
26
71
85
90
* 2
01
02
46
52
65
27
74
32
46
79
11
21
84
71
36
02
21
20
31
81
86
00
16
05
21
63
91
81
24
95
37
57
44
61
55
18
** 2
01
02
57
46
08
27
74
32
68
74
41
26
14
81
40
32
01
35
42
52
00
63
46
29
99
84
05
72
25
04
62
58
37
29
56
83
* 2
01
12
57
45
52
34
27
02
67
81
71
21
25
31
43
82
21
19
22
32
11
76
46
61
92
44
16
82
76
45
02
53
06
90
24
60
** 2
01
12
66
71
23
35
32
02
86
60
71
29
23
01
48
58
91
22
17
62
26
73
46
77
55
34
28
28
76
64
77
54
32
39
29
11
****2
01
12
73
65
99
35
32
03
04
95
61
34
28
21
52
69
21
25
70
22
32
96
06
93
55
74
35
33
16
80
81
55
04
60
32
56
Occ
up
ati
on
gro
up
1S
enio
r O
ffic
ials
and
Man
ager
s7
Skil
led
Agri
cult
ura
l an
d F
isher
y w
ork
ers
2P
rofe
ssio
nal
s8
Cra
ft a
nd
Rel
ated
wo
rker
s
3T
echnic
al a
nd
Ass
oci
ate
Pro
fess
ional
s9
Pla
nt
and
Mac
hin
e o
per
ato
rs a
nd
Ass
emb
lers
4C
lerk
s1
0E
lem
enta
ry o
ccup
atio
ns
5P
rop
riet
ors
and
Man
ager
s o
f E
nte
rpri
ses
0U
nid
enti
fied
6S
ale
and
Ser
vic
e w
ork
ers
Thes
e fi
gure
s ar
e to
be
trea
ted
wit
h c
auti
on a
s th
e co
rres
po
nd
ing C
V (
Co
ffic
ient
of
var
iati
on)
val
ues
are
hig
h.
No
te:
It i
s to
be
no
ted
her
e th
at t
hes
e o
ccup
atio
n g
roup
s ar
e b
ased
on I
SC
O -
88
,but
they
are
no
t nec
essa
rily
the
Ma
jor
Gro
up
s
of
ISC
O -
88
cla
ssif
icat
ion
* -
Excl
ud
ing N
ort
her
n a
nd
Eas
tern
pro
vin
ces
*** -
Excl
ud
ing M
ula
thiv
u,K
ilin
och
chi
dis
tric
ts.
** -
In
clu
din
g E
aste
rn p
rovin
ce b
ut
Excl
ud
ing N
ort
her
n p
rovin
ce**** -
All
th
e d
istr
icts
are
in
clu
ded
Yea
rO
ccup
atio
n g
roup
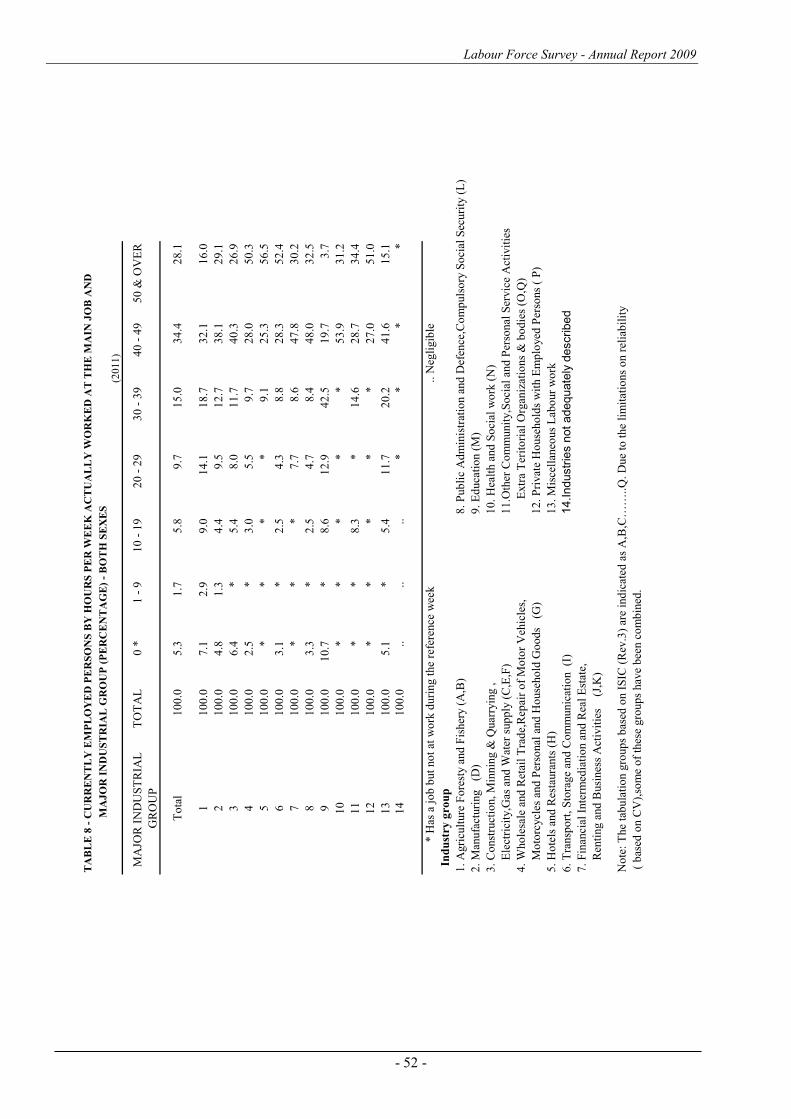
Labour Force Survey - Annual Report 2009
- 52 -
TA
BL
E 8
- C
UR
RE
NT
LY
EM
PL
OY
ED
PE
RS
ON
S B
Y H
OU
RS
PE
R W
EE
K A
CT
UA
LL
Y W
OR
KE
D A
T T
HE
MA
IN J
OB
AN
D
MA
JO
R I
ND
US
TR
IAL
GR
OU
P (
PE
RC
EN
TA
GE
) -
BO
TH
SE
XE
S
(20
11
)
MA
JOR
IN
DU
ST
RIA
L
TO
TA
L0
*1
- 9
10
- 1
92
0 -
29
30
- 3
9 4
0 -
49
50
& O
VE
R
GR
OU
P
To
tal
10
0.0
5.3
1.7
5.8
9.7
15
.03
4.4
28
.1
11
00
.07
.12
.99
.01
4.1
18
.73
2.1
16
.0
21
00
.04
.81
.34
.49
.51
2.7
38
.12
9.1
31
00
.06
.4*
5.4
8.0
11
.74
0.3
26
.9
41
00
.02
.5*
3.0
5.5
9.7
28
.05
0.3
51
00
.0*
**
*9
.12
5.3
56
.5
61
00
.03
.1*
2.5
4.3
8.8
28
.35
2.4
71
00
.0*
**
7.7
8.6
47
.83
0.2
81
00
.03
.3*
2.5
4.7
8.4
48
.03
2.5
91
00
.01
0.7
*8
.61
2.9
42
.51
9.7
3.7
10
10
0.0
**
**
*5
3.9
31
.2
11
10
0.0
**
8.3
*1
4.6
28
.73
4.4
12
10
0.0
**
**
*2
7.0
51
.0
13
10
0.0
5.1
*5
.41
1.7
20
.24
1.6
15
.1
14
10
0.0
....
..*
**
*
* H
as a
jo
b b
ut
no
t at
wo
rk d
uri
ng t
he
refe
rence
wee
k..
Neg
ligib
le
In
du
stry
gro
up
1.
Agri
cult
ure
Fo
rest
y a
nd
Fis
her
y (
A,B
)8
. P
ub
lic
Ad
min
istr
atio
n a
nd
Def
ence
,Co
mp
uls
ory
So
cial
Sec
uri
ty (
L)
2.
Man
ufa
cturi
ng
(D
)9
. E
duca
tio
n (
M)
3.
Co
nst
ruct
ion,
Min
nin
g &
Quar
ryin
g ,
1
0.
Hea
lth a
nd
So
cial
wo
rk (
N)
Ele
ctri
city
,Gas
and
Wat
er s
up
ply
(C
,E,F
)1
1.O
ther
Co
mm
unit
y,S
oci
al a
nd
Per
sonal
Ser
vic
e A
ctiv
itie
s
4.
Who
lesa
le a
nd
Ret
ail
Tra
de,
Rep
air
of
Mo
tor
Veh
icle
s,
E
xtr
a T
erit
ori
al O
rgan
izat
ions
& b
od
ies
(O,Q
)
Mo
torc
ycl
es a
nd
Per
sonal
and
Ho
use
ho
ld G
oo
ds
(G
)1
2.
Pri
vat
e H
ouse
ho
lds
wit
h E
mp
loyed
Per
sons
( P
)
5.
Ho
tels
and
Res
taura
nts
(H
)1
3.
Mis
cell
aneo
us
Lab
our
wo
rk
6.
Tra
nsp
ort
, S
tora
ge
and
Co
mm
unic
atio
n
(I)
14.Industr
ies n
ot adequate
ly d
escribed
7.
Fin
anci
al I
nte
rmed
iati
on a
nd
Rea
l E
stat
e,
Ren
ting a
nd
Busi
nes
s A
ctiv
itie
s
(J,
K)
No
te:
The
tab
ula
tio
n g
roup
s b
ased
on I
SIC
(R
ev.3
) ar
e in
dic
ated
as
A,B
,C…
…..
Q.
Due
to t
he
lim
itat
ions
on r
elia
bil
ity
( b
ased
on C
V),
som
e o
f th
ese
gro
up
s hav
e b
een c
om
bin
ed.
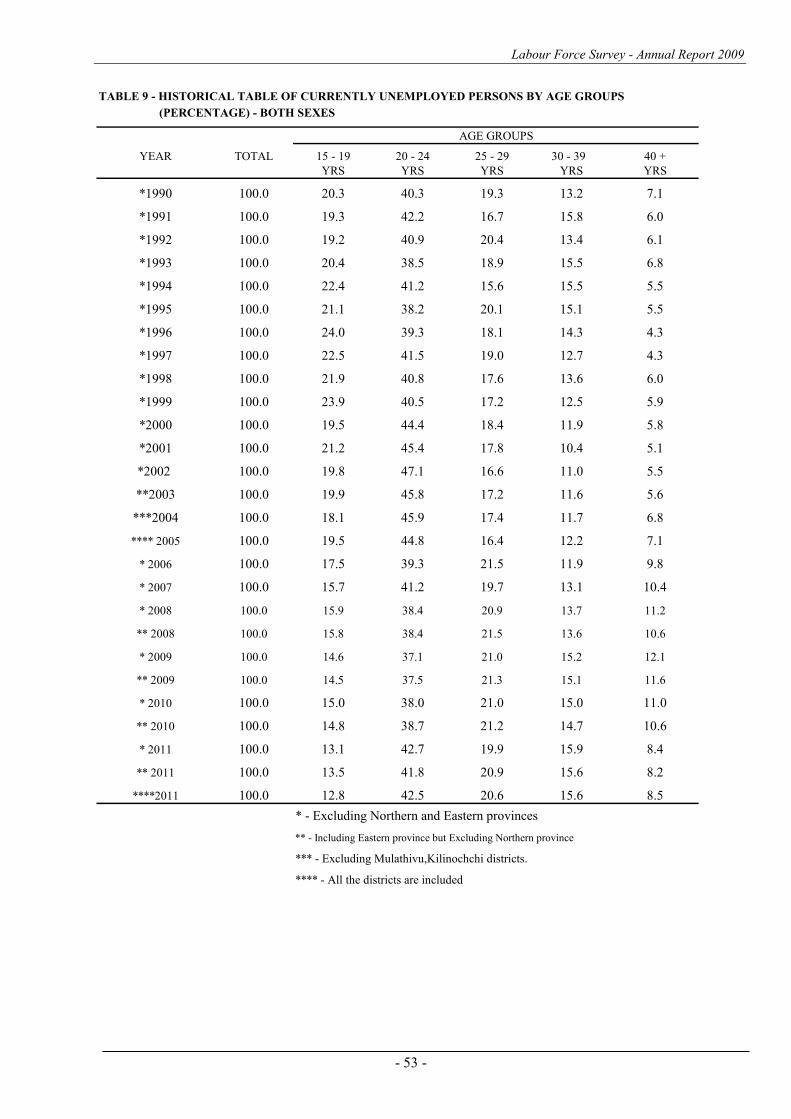
Labour Force Survey - Annual Report 2009
- 53 -
TABLE 9 - HISTORICAL TABLE OF CURRENTLY UNEMPLOYED PERSONS BY AGE GROUPS
(PERCENTAGE) - BOTH SEXES
YEAR TOTAL 15 - 19 20 - 24 25 - 29 30 - 39 40 +
YRS YRS YRS YRS YRS
*1990 100.0 20.3 40.3 19.3 13.2 7.1
*1991 100.0 19.3 42.2 16.7 15.8 6.0
*1992 100.0 19.2 40.9 20.4 13.4 6.1
*1993 100.0 20.4 38.5 18.9 15.5 6.8
*1994 100.0 22.4 41.2 15.6 15.5 5.5
*1995 100.0 21.1 38.2 20.1 15.1 5.5
*1996 100.0 24.0 39.3 18.1 14.3 4.3
*1997 100.0 22.5 41.5 19.0 12.7 4.3
*1998 100.0 21.9 40.8 17.6 13.6 6.0
*1999 100.0 23.9 40.5 17.2 12.5 5.9
*2000 100.0 19.5 44.4 18.4 11.9 5.8
*2001 100.0 21.2 45.4 17.8 10.4 5.1
*2002 100.0 19.8 47.1 16.6 11.0 5.5
**2003 100.0 19.9 45.8 17.2 11.6 5.6
***2004 100.0 18.1 45.9 17.4 11.7 6.8
**** 2005 100.0 19.5 44.8 16.4 12.2 7.1
* 2006 100.0 17.5 39.3 21.5 11.9 9.8
* 2007 100.0 15.7 41.2 19.7 13.1 10.4
* 2008 100.0 15.9 38.4 20.9 13.7 11.2
** 2008 100.0 15.8 38.4 21.5 13.6 10.6
* 2009 100.0 14.6 37.1 21.0 15.2 12.1
** 2009 100.0 14.5 37.5 21.3 15.1 11.6
* 2010 100.0 15.0 38.0 21.0 15.0 11.0
** 2010 100.0 14.8 38.7 21.2 14.7 10.6
* 2011 100.0 13.1 42.7 19.9 15.9 8.4
** 2011 100.0 13.5 41.8 20.9 15.6 8.2
****2011 100.0 12.8 42.5 20.6 15.6 8.5
* - Excluding Northern and Eastern provinces
** - Including Eastern province but Excluding Northern province
*** - Excluding Mulathivu,Kilinochchi districts.
**** - All the districts are included
AGE GROUPS
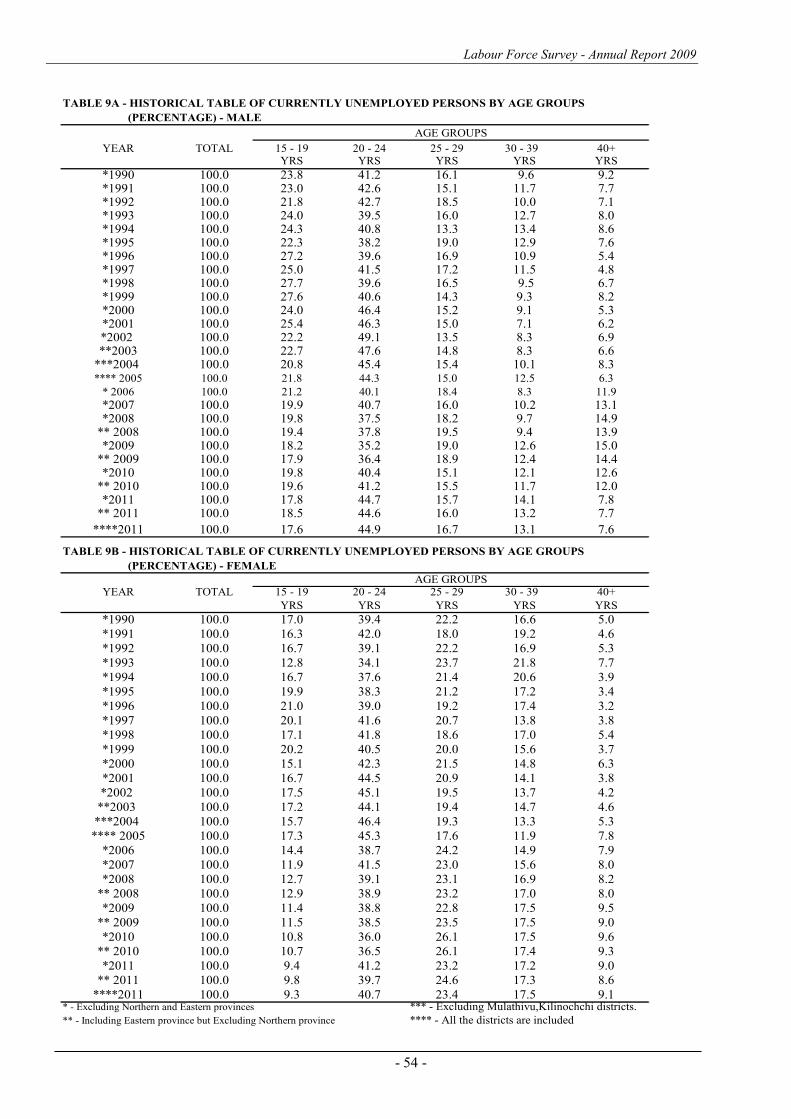
Labour Force Survey - Annual Report 2009
- 54 -
TABLE 9A - HISTORICAL TABLE OF CURRENTLY UNEMPLOYED PERSONS BY AGE GROUPS
(PERCENTAGE) - MALE
YEAR TOTAL 15 - 19 20 - 24 25 - 29 30 - 39 40+YRS YRS YRS YRS YRS
*1990 100.0 23.8 41.2 16.1 9.6 9.2*1991 100.0 23.0 42.6 15.1 11.7 7.7*1992 100.0 21.8 42.7 18.5 10.0 7.1*1993 100.0 24.0 39.5 16.0 12.7 8.0*1994 100.0 24.3 40.8 13.3 13.4 8.6*1995 100.0 22.3 38.2 19.0 12.9 7.6*1996 100.0 27.2 39.6 16.9 10.9 5.4*1997 100.0 25.0 41.5 17.2 11.5 4.8*1998 100.0 27.7 39.6 16.5 9.5 6.7*1999 100.0 27.6 40.6 14.3 9.3 8.2*2000 100.0 24.0 46.4 15.2 9.1 5.3*2001 100.0 25.4 46.3 15.0 7.1 6.2*2002 100.0 22.2 49.1 13.5 8.3 6.9**2003 100.0 22.7 47.6 14.8 8.3 6.6
***2004 100.0 20.8 45.4 15.4 10.1 8.3**** 2005 100.0 21.8 44.3 15.0 12.5 6.3
* 2006 100.0 21.2 40.1 18.4 8.3 11.9
*2007 100.0 19.9 40.7 16.0 10.2 13.1*2008 100.0 19.8 37.5 18.2 9.7 14.9
** 2008 100.0 19.4 37.8 19.5 9.4 13.9*2009 100.0 18.2 35.2 19.0 12.6 15.0
** 2009 100.0 17.9 36.4 18.9 12.4 14.4*2010 100.0 19.8 40.4 15.1 12.1 12.6
** 2010 100.0 19.6 41.2 15.5 11.7 12.0*2011 100.0 17.8 44.7 15.7 14.1 7.8
** 2011 100.0 18.5 44.6 16.0 13.2 7.7
****2011 100.0 17.6 44.9 16.7 13.1 7.6
TABLE 9B - HISTORICAL TABLE OF CURRENTLY UNEMPLOYED PERSONS BY AGE GROUPS
(PERCENTAGE) - FEMALE
YEAR TOTAL 15 - 19 20 - 24 25 - 29 30 - 39 40+
YRS YRS YRS YRS YRS
*1990 100.0 17.0 39.4 22.2 16.6 5.0
*1991 100.0 16.3 42.0 18.0 19.2 4.6
*1992 100.0 16.7 39.1 22.2 16.9 5.3
*1993 100.0 12.8 34.1 23.7 21.8 7.7
*1994 100.0 16.7 37.6 21.4 20.6 3.9
*1995 100.0 19.9 38.3 21.2 17.2 3.4
*1996 100.0 21.0 39.0 19.2 17.4 3.2
*1997 100.0 20.1 41.6 20.7 13.8 3.8
*1998 100.0 17.1 41.8 18.6 17.0 5.4
*1999 100.0 20.2 40.5 20.0 15.6 3.7
*2000 100.0 15.1 42.3 21.5 14.8 6.3
*2001 100.0 16.7 44.5 20.9 14.1 3.8
*2002 100.0 17.5 45.1 19.5 13.7 4.2
**2003 100.0 17.2 44.1 19.4 14.7 4.6
***2004 100.0 15.7 46.4 19.3 13.3 5.3
**** 2005 100.0 17.3 45.3 17.6 11.9 7.8
*2006 100.0 14.4 38.7 24.2 14.9 7.9
*2007 100.0 11.9 41.5 23.0 15.6 8.0
*2008 100.0 12.7 39.1 23.1 16.9 8.2
** 2008 100.0 12.9 38.9 23.2 17.0 8.0
*2009 100.0 11.4 38.8 22.8 17.5 9.5
** 2009 100.0 11.5 38.5 23.5 17.5 9.0
*2010 100.0 10.8 36.0 26.1 17.5 9.6
** 2010 100.0 10.7 36.5 26.1 17.4 9.3
*2011 100.0 9.4 41.2 23.2 17.2 9.0
** 2011 100.0 9.8 39.7 24.6 17.3 8.6
****2011 100.0 9.3 40.7 23.4 17.5 9.1* - Excluding Northern and Eastern provinces *** - Excluding Mulathivu,Kilinochchi districts.
** - Including Eastern province but Excluding Northern province **** - All the districts are included
AGE GROUPS
AGE GROUPS
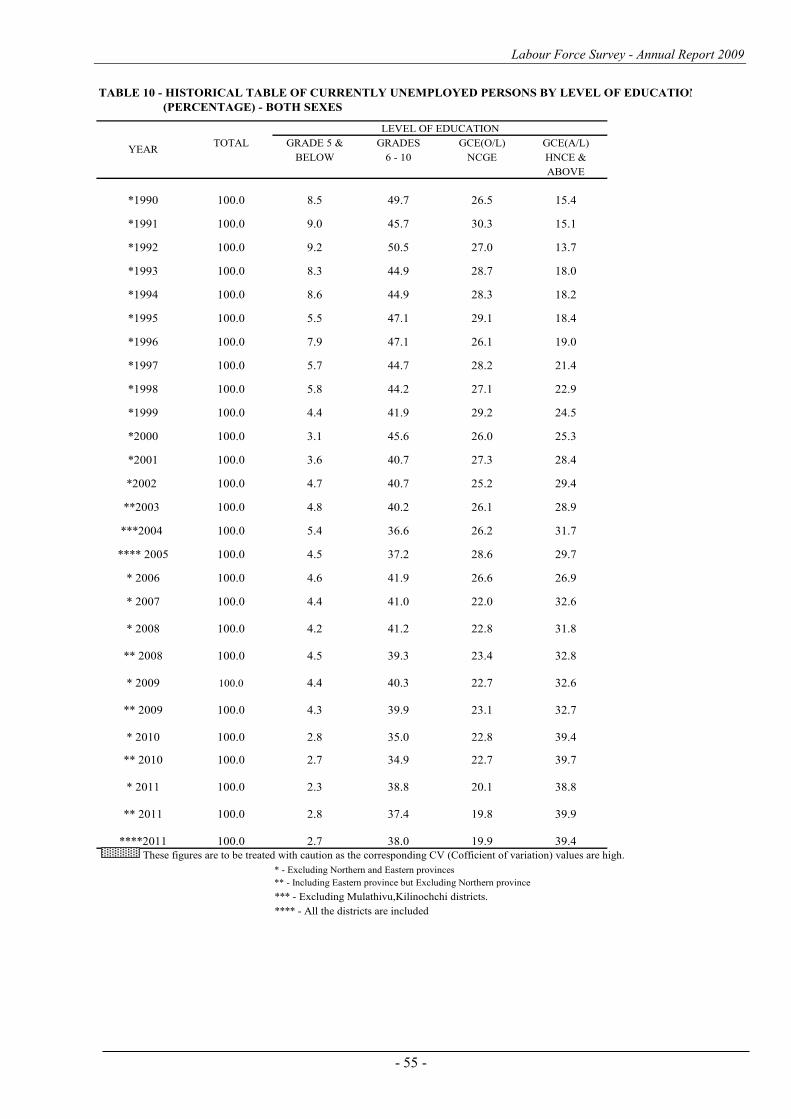
Labour Force Survey - Annual Report 2009
- 55 -
TABLE 10 - HISTORICAL TABLE OF CURRENTLY UNEMPLOYED PERSONS BY LEVEL OF EDUCATION
(PERCENTAGE) - BOTH SEXES
TOTAL GRADE 5 & GRADES GCE(O/L) GCE(A/L)
BELOW 6 - 10 NCGE HNCE &
ABOVE
*1990 100.0 8.5 49.7 26.5 15.4
*1991 100.0 9.0 45.7 30.3 15.1
*1992 100.0 9.2 50.5 27.0 13.7
*1993 100.0 8.3 44.9 28.7 18.0
*1994 100.0 8.6 44.9 28.3 18.2
*1995 100.0 5.5 47.1 29.1 18.4
*1996 100.0 7.9 47.1 26.1 19.0
*1997 100.0 5.7 44.7 28.2 21.4
*1998 100.0 5.8 44.2 27.1 22.9
*1999 100.0 4.4 41.9 29.2 24.5
*2000 100.0 3.1 45.6 26.0 25.3
*2001 100.0 3.6 40.7 27.3 28.4
*2002 100.0 4.7 40.7 25.2 29.4
**2003 100.0 4.8 40.2 26.1 28.9
***2004 100.0 5.4 36.6 26.2 31.7
**** 2005 100.0 4.5 37.2 28.6 29.7
* 2006 100.0 4.6 41.9 26.6 26.9
* 2007 100.0 4.4 41.0 22.0 32.6
* 2008 100.0 4.2 41.2 22.8 31.8
** 2008 100.0 4.5 39.3 23.4 32.8
* 2009 100.0 4.4 40.3 22.7 32.6
** 2009 100.0 4.3 39.9 23.1 32.7
* 2010 100.0 2.8 35.0 22.8 39.4
** 2010 100.0 2.7 34.9 22.7 39.7
* 2011 100.0 2.3 38.8 20.1 38.8
** 2011 100.0 2.8 37.4 19.8 39.9
****2011 100.0 2.7 38.0 19.9 39.4
These figures are to be treated with caution as the corresponding CV (Cofficient of variation) values are high.
* - Excluding Northern and Eastern provinces
** - Including Eastern province but Excluding Northern province
*** - Excluding Mulathivu,Kilinochchi districts.
**** - All the districts are included
YEAR
LEVEL OF EDUCATION
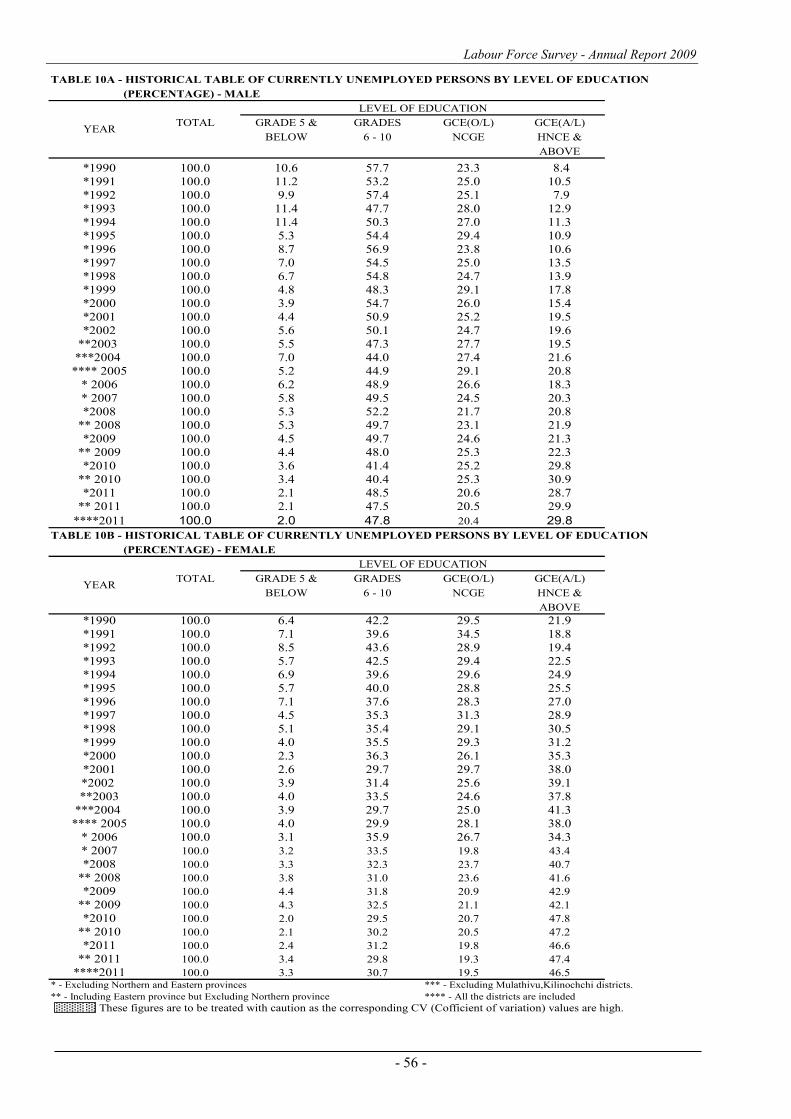
Labour Force Survey - Annual Report 2009
- 56 -
TABLE 10A - HISTORICAL TABLE OF CURRENTLY UNEMPLOYED PERSONS BY LEVEL OF EDUCATION
(PERCENTAGE) - MALE
TOTAL GRADE 5 & GRADES GCE(O/L) GCE(A/L)
BELOW 6 - 10 NCGE HNCE &
ABOVE
*1990 100.0 10.6 57.7 23.3 8.4
*1991 100.0 11.2 53.2 25.0 10.5
*1992 100.0 9.9 57.4 25.1 7.9
*1993 100.0 11.4 47.7 28.0 12.9
*1994 100.0 11.4 50.3 27.0 11.3
*1995 100.0 5.3 54.4 29.4 10.9
*1996 100.0 8.7 56.9 23.8 10.6
*1997 100.0 7.0 54.5 25.0 13.5
*1998 100.0 6.7 54.8 24.7 13.9
*1999 100.0 4.8 48.3 29.1 17.8
*2000 100.0 3.9 54.7 26.0 15.4
*2001 100.0 4.4 50.9 25.2 19.5
*2002 100.0 5.6 50.1 24.7 19.6
**2003 100.0 5.5 47.3 27.7 19.5
***2004 100.0 7.0 44.0 27.4 21.6
**** 2005 100.0 5.2 44.9 29.1 20.8
* 2006 100.0 6.2 48.9 26.6 18.3
* 2007 100.0 5.8 49.5 24.5 20.3
*2008 100.0 5.3 52.2 21.7 20.8
** 2008 100.0 5.3 49.7 23.1 21.9
*2009 100.0 4.5 49.7 24.6 21.3
** 2009 100.0 4.4 48.0 25.3 22.3
*2010 100.0 3.6 41.4 25.2 29.8
** 2010 100.0 3.4 40.4 25.3 30.9
*2011 100.0 2.1 48.5 20.6 28.7
** 2011 100.0 2.1 47.5 20.5 29.9
****2011 100.0 2.0 47.8 20.4 29.8
TABLE 10B - HISTORICAL TABLE OF CURRENTLY UNEMPLOYED PERSONS BY LEVEL OF EDUCATION
(PERCENTAGE) - FEMALE
TOTAL GRADE 5 & GRADES GCE(O/L) GCE(A/L)
BELOW 6 - 10 NCGE HNCE &
ABOVE
*1990 100.0 6.4 42.2 29.5 21.9
*1991 100.0 7.1 39.6 34.5 18.8
*1992 100.0 8.5 43.6 28.9 19.4
*1993 100.0 5.7 42.5 29.4 22.5
*1994 100.0 6.9 39.6 29.6 24.9
*1995 100.0 5.7 40.0 28.8 25.5
*1996 100.0 7.1 37.6 28.3 27.0
*1997 100.0 4.5 35.3 31.3 28.9
*1998 100.0 5.1 35.4 29.1 30.5
*1999 100.0 4.0 35.5 29.3 31.2
*2000 100.0 2.3 36.3 26.1 35.3
*2001 100.0 2.6 29.7 29.7 38.0
*2002 100.0 3.9 31.4 25.6 39.1
**2003 100.0 4.0 33.5 24.6 37.8
***2004 100.0 3.9 29.7 25.0 41.3
**** 2005 100.0 4.0 29.9 28.1 38.0
* 2006 100.0 3.1 35.9 26.7 34.3
* 2007 100.0 3.2 33.5 19.8 43.4
*2008 100.0 3.3 32.3 23.7 40.7
** 2008 100.0 3.8 31.0 23.6 41.6
*2009 100.0 4.4 31.8 20.9 42.9
** 2009 100.0 4.3 32.5 21.1 42.1
*2010 100.0 2.0 29.5 20.7 47.8
** 2010 100.0 2.1 30.2 20.5 47.2
*2011 100.0 2.4 31.2 19.8 46.6
** 2011 100.0 3.4 29.8 19.3 47.4
****2011 100.0 3.3 30.7 19.5 46.5* - Excluding Northern and Eastern provinces *** - Excluding Mulathivu,Kilinochchi districts.
** - Including Eastern province but Excluding Northern province **** - All the districts are included
These figures are to be treated with caution as the corresponding CV (Cofficient of variation) values are high.
YEAR
YEAR
LEVEL OF EDUCATION
LEVEL OF EDUCATION
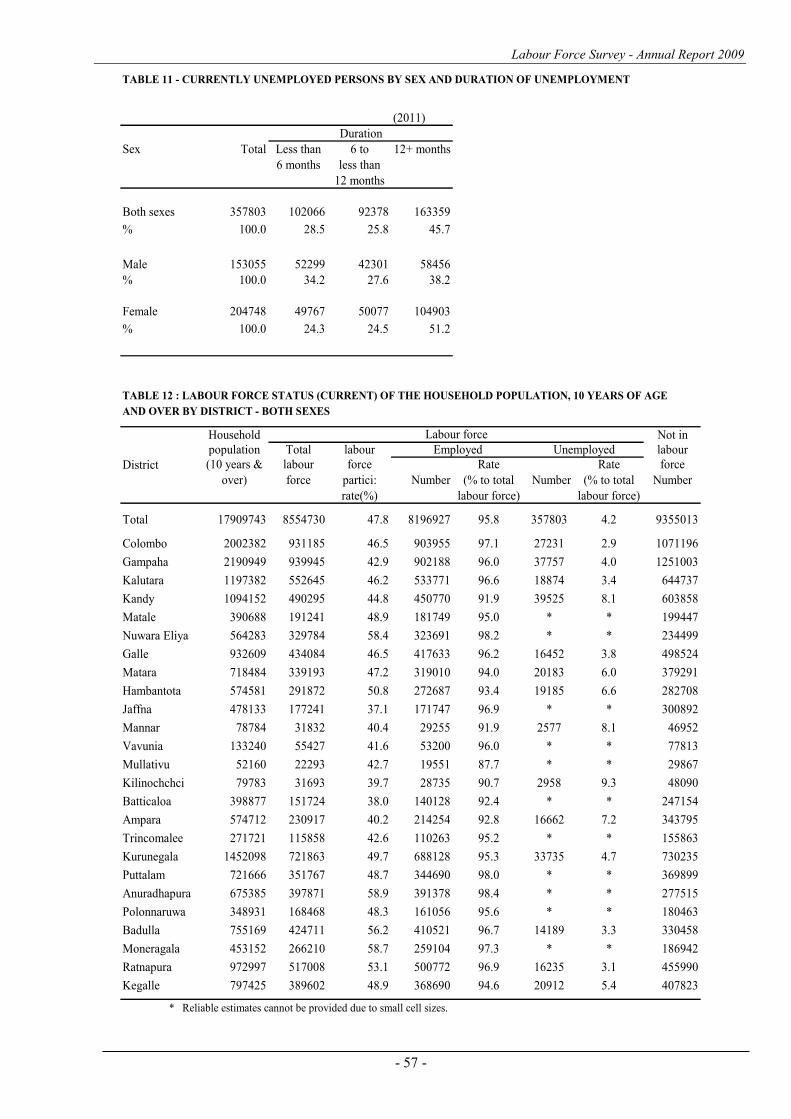
Labour Force Survey - Annual Report 2009
- 57 -
TABLE 11 - CURRENTLY UNEMPLOYED PERSONS BY SEX AND DURATION OF UNEMPLOYMENT
(2011)
Sex Total Less than 6 to 12+ months
6 months less than
12 months
Both sexes 357803 102066 92378 163359
% 100.0 28.5 25.8 45.7
Male 153055 52299 42301 58456
% 100.0 34.2 27.6 38.2
Female 204748 49767 50077 104903
% 100.0 24.3 24.5 51.2
TABLE 12 : LABOUR FORCE STATUS (CURRENT) OF THE HOUSEHOLD POPULATION, 10 YEARS OF AGE
AND OVER BY DISTRICT - BOTH SEXES
Household Not in
population Total labour labour
(10 years & labour force Rate Rate force
over) force partici: Number (% to total Number (% to total Number
rate(%) labour force) labour force)
Total 17909743 8554730 47.8 8196927 95.8 357803 4.2 9355013
Colombo 2002382 931185 46.5 903955 97.1 27231 2.9 1071196
Gampaha 2190949 939945 42.9 902188 96.0 37757 4.0 1251003
Kalutara 1197382 552645 46.2 533771 96.6 18874 3.4 644737
Kandy 1094152 490295 44.8 450770 91.9 39525 8.1 603858
Matale 390688 191241 48.9 181749 95.0 * * 199447
Nuwara Eliya 564283 329784 58.4 323691 98.2 * * 234499
Galle 932609 434084 46.5 417633 96.2 16452 3.8 498524
Matara 718484 339193 47.2 319010 94.0 20183 6.0 379291
Hambantota 574581 291872 50.8 272687 93.4 19185 6.6 282708
Jaffna 478133 177241 37.1 171747 96.9 * * 300892
Mannar 78784 31832 40.4 29255 91.9 2577 8.1 46952
Vavunia 133240 55427 41.6 53200 96.0 * * 77813
Mullativu 52160 22293 42.7 19551 87.7 * * 29867
Kilinochchci 79783 31693 39.7 28735 90.7 2958 9.3 48090
Batticaloa 398877 151724 38.0 140128 92.4 * * 247154
Ampara 574712 230917 40.2 214254 92.8 16662 7.2 343795
Trincomalee 271721 115858 42.6 110263 95.2 * * 155863
Kurunegala 1452098 721863 49.7 688128 95.3 33735 4.7 730235
Puttalam 721666 351767 48.7 344690 98.0 * * 369899
Anuradhapura 675385 397871 58.9 391378 98.4 * * 277515
Polonnaruwa 348931 168468 48.3 161056 95.6 * * 180463
Badulla 755169 424711 56.2 410521 96.7 14189 3.3 330458
Moneragala 453152 266210 58.7 259104 97.3 * * 186942
Ratnapura 972997 517008 53.1 500772 96.9 16235 3.1 455990
Kegalle 797425 389602 48.9 368690 94.6 20912 5.4 407823
* Reliable estimates cannot be provided due to small cell sizes.
Duration
District
Labour force
Employed Unemployed
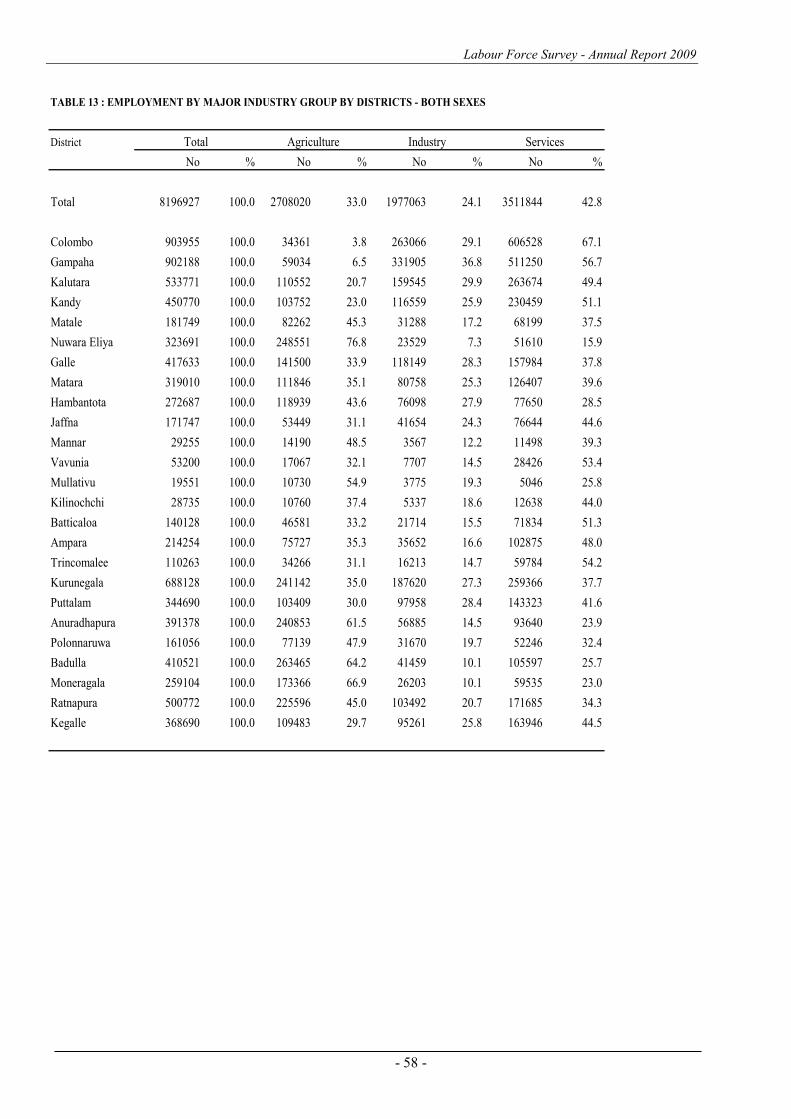
Labour Force Survey - Annual Report 2009
- 58 -
TABLE 13 : EMPLOYMENT BY MAJOR INDUSTRY GROUP BY DISTRICTS - BOTH SEXES
District
No % No % No % No %
Total 8196927 100.0 2708020 33.0 1977063 24.1 3511844 42.8
Colombo 903955 100.0 34361 3.8 263066 29.1 606528 67.1
Gampaha 902188 100.0 59034 6.5 331905 36.8 511250 56.7
Kalutara 533771 100.0 110552 20.7 159545 29.9 263674 49.4
Kandy 450770 100.0 103752 23.0 116559 25.9 230459 51.1
Matale 181749 100.0 82262 45.3 31288 17.2 68199 37.5
Nuwara Eliya 323691 100.0 248551 76.8 23529 7.3 51610 15.9
Galle 417633 100.0 141500 33.9 118149 28.3 157984 37.8
Matara 319010 100.0 111846 35.1 80758 25.3 126407 39.6
Hambantota 272687 100.0 118939 43.6 76098 27.9 77650 28.5
Jaffna 171747 100.0 53449 31.1 41654 24.3 76644 44.6
Mannar 29255 100.0 14190 48.5 3567 12.2 11498 39.3
Vavunia 53200 100.0 17067 32.1 7707 14.5 28426 53.4
Mullativu 19551 100.0 10730 54.9 3775 19.3 5046 25.8
Kilinochchi 28735 100.0 10760 37.4 5337 18.6 12638 44.0
Batticaloa 140128 100.0 46581 33.2 21714 15.5 71834 51.3
Ampara 214254 100.0 75727 35.3 35652 16.6 102875 48.0
Trincomalee 110263 100.0 34266 31.1 16213 14.7 59784 54.2
Kurunegala 688128 100.0 241142 35.0 187620 27.3 259366 37.7
Puttalam 344690 100.0 103409 30.0 97958 28.4 143323 41.6
Anuradhapura 391378 100.0 240853 61.5 56885 14.5 93640 23.9
Polonnaruwa 161056 100.0 77139 47.9 31670 19.7 52246 32.4
Badulla 410521 100.0 263465 64.2 41459 10.1 105597 25.7
Moneragala 259104 100.0 173366 66.9 26203 10.1 59535 23.0
Ratnapura 500772 100.0 225596 45.0 103492 20.7 171685 34.3
Kegalle 368690 100.0 109483 29.7 95261 25.8 163946 44.5
Total Agriculture Industry Services
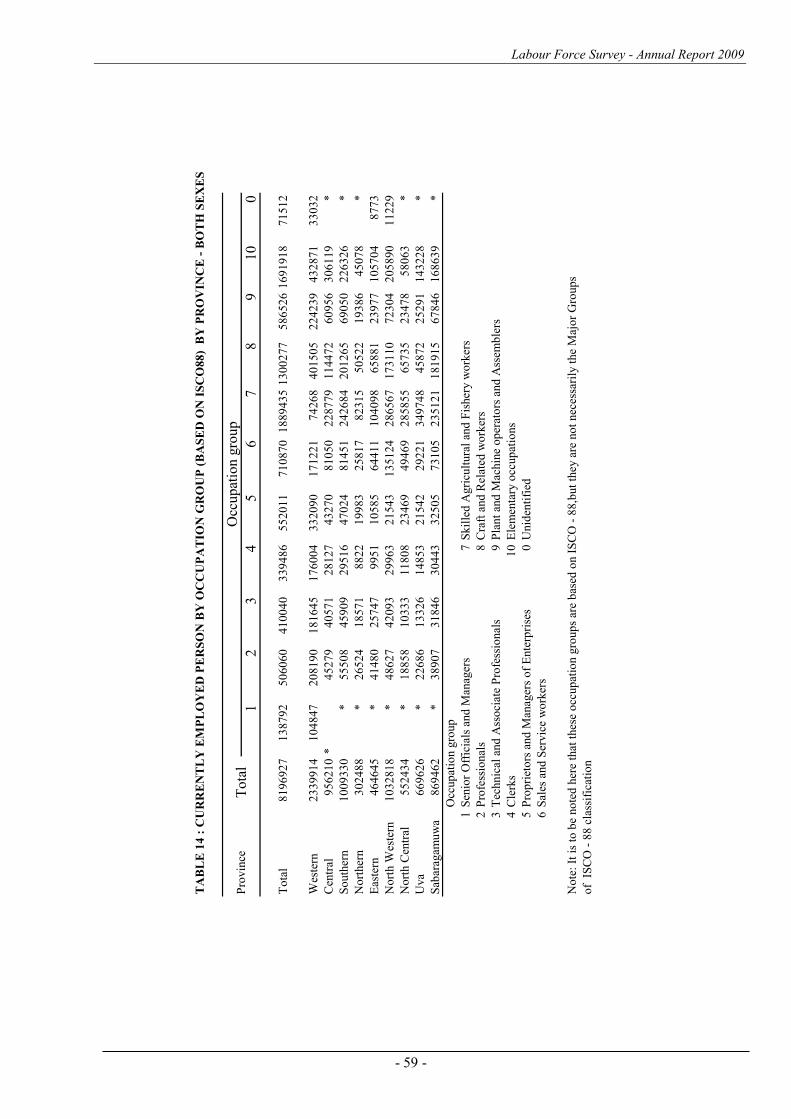
Labour Force Survey - Annual Report 2009
- 59 -
TA
BL
E 1
4 :
CU
RR
EN
TL
Y E
MP
LO
YE
D P
ER
SO
N B
Y O
CC
UP
AT
ION
GR
OU
P (
BA
SE
D O
N I
SC
O8
8)
BY
PR
OV
INC
E -
BO
TH
SE
XE
S
12
34
56
78
910
0
To
tal
81
96
92
71
38
79
25
06
06
04
10
04
03
39
48
65
52
01
17
10
87
01
88
94
35
13
00
27
75
86
52
61
69
19
18
71
51
2
Wes
tern
23
39
91
41
04
84
72
08
19
01
81
64
51
76
00
43
32
09
01
71
22
17
42
68
40
15
05
22
42
39
43
28
71
33
03
2
Cen
tral
95
62
10
*4
52
79
40
57
12
81
27
43
27
08
10
50
22
87
79
11
44
72
60
95
63
06
11
9*
So
uth
ern
10
09
33
0*
55
50
84
59
09
29
51
64
70
24
81
45
12
42
68
42
01
26
56
90
50
22
63
26
*
No
rther
n3
02
48
8*
26
52
41
85
71
88
22
19
98
32
58
17
82
31
55
05
22
19
38
64
50
78
*
Eas
tern
46
46
45
*4
14
80
25
74
79
95
11
05
85
64
41
11
04
09
86
58
81
23
97
71
05
70
48
77
3
No
rth W
este
rn1
03
28
18
*4
86
27
42
09
32
99
63
21
54
31
35
12
42
86
56
71
73
11
07
23
04
20
58
90
11
22
9
No
rth C
entr
al5
52
43
4*
18
85
81
03
33
11
80
82
34
69
49
46
92
85
85
56
57
35
23
47
85
80
63
*
Uva
66
96
26
*2
26
86
13
32
61
48
53
21
54
22
92
21
34
97
48
45
87
22
52
91
14
32
28
*
Sab
arag
amuw
a8
69
46
2*
38
90
73
18
46
30
44
33
25
05
73
10
52
35
12
11
81
91
56
78
46
16
86
39
*
Occ
up
atio
n g
roup
1S
enio
r O
ffic
ials
and
Man
ager
s7
Skil
led
Agri
cult
ura
l an
d F
isher
y w
ork
ers
2P
rofe
ssio
nal
s8
Cra
ft a
nd
Rel
ated
wo
rker
s
3T
echnic
al a
nd
Ass
oci
ate
Pro
fess
ional
s9
Pla
nt
and
Mac
hin
e o
per
ato
rs a
nd
Ass
emb
lers
4C
lerk
s1
0E
lem
enta
ry o
ccup
atio
ns
5P
rop
riet
ors
and
Man
ager
s o
f E
nte
rpri
ses
0U
nid
enti
fied
6S
ales
and
Ser
vic
e w
ork
ers
No
te:
It i
s to
be
no
ted
her
e th
at t
hes
e o
ccup
atio
n g
roup
s ar
e b
ased
on I
SC
O -
88
,but
they
are
no
t nec
essa
rily
the
Maj
or
Gro
up
s
of
IS
CO
- 8
8 c
lass
ific
atio
n
Pro
vin
ceO
ccupat
ion g
roup
Tota
l
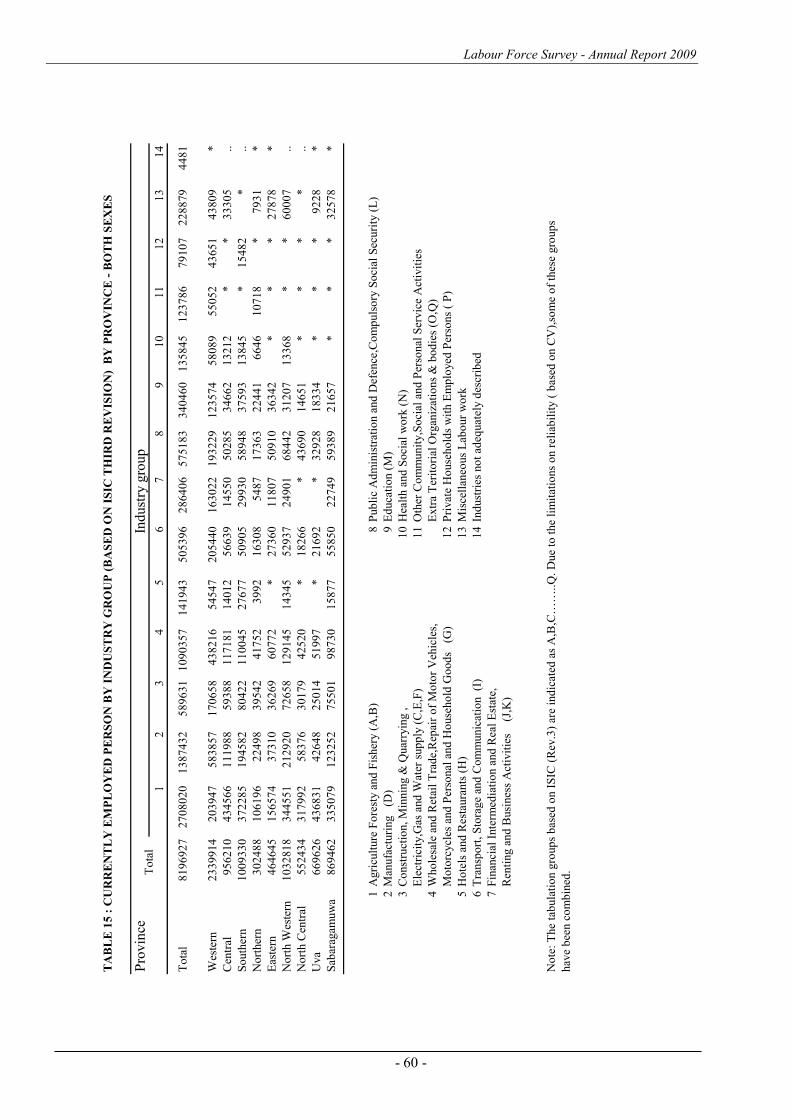
Labour Force Survey - Annual Report 2009
- 60 -
TA
BL
E 1
5 :
CU
RR
EN
TL
Y E
MP
LO
YE
D P
ER
SO
N B
Y I
ND
US
TR
Y G
RO
UP
(B
AS
ED
ON
IS
IC T
HIR
D R
EV
ISIO
N)
BY
PR
OV
INC
E -
BO
TH
SE
XE
S
Pro
vin
ce
12
34
56
78
91
01
11
21
31
4
To
tal
81
96
92
72
70
80
20
13
87
43
25
89
63
11
09
03
57
14
19
43
50
53
96
28
64
06
57
51
83
34
04
60
13
58
45
12
37
86
79
10
72
28
87
94
48
1
Wes
tern
23
39
91
42
03
94
75
83
85
71
70
65
84
38
21
65
45
47
20
54
40
16
30
22
19
32
29
12
35
74
58
08
95
50
52
43
65
14
38
09
*
Cen
tral
95
62
10
43
45
66
11
19
88
59
38
81
17
18
11
40
12
56
63
91
45
50
50
28
53
46
62
13
21
2*
*3
33
05
..
So
uth
ern
10
09
33
03
72
28
51
94
58
28
04
22
11
00
45
27
67
75
09
05
29
93
05
89
48
37
59
31
38
45
*1
54
82
*..
No
rther
n3
02
48
81
06
19
62
24
98
39
54
24
17
52
39
92
16
30
85
48
71
73
63
22
44
16
64
61
07
18
*7
93
1*
Eas
tern
46
46
45
15
65
74
37
31
03
62
69
60
77
2*
27
36
01
18
07
50
91
03
63
42
**
*2
78
78
*
No
rth W
este
rn1
03
28
18
34
45
51
21
29
20
72
65
81
29
14
51
43
45
52
93
72
49
01
68
44
23
12
07
13
36
8*
*6
00
07
..
No
rth C
entr
al5
52
43
43
17
99
25
83
76
30
17
94
25
20
*1
82
66
*4
36
90
14
65
1*
**
*..
Uva
66
96
26
43
68
31
42
64
82
50
14
51
99
7*
21
69
2*
32
92
81
83
34
**
*9
22
8*
Sab
arag
amuw
a8
69
46
23
35
07
91
23
25
27
55
01
98
73
01
58
77
55
85
02
27
49
59
38
92
16
57
**
*3
25
78
*
1A
gri
cult
ure
Fo
rest
y a
nd
Fis
her
y (
A,B
)8
Pub
lic
Ad
min
istr
atio
n a
nd
Def
ence
,Co
mp
uls
ory
So
cial
Sec
uri
ty (
L)
2M
anufa
cturi
ng
(D
)9
Ed
uca
tio
n (
M)
3C
onst
ruct
ion,
Min
nin
g &
Quar
ryin
g ,
1
0H
ealt
h a
nd
So
cial
wo
rk (
N)
Ele
ctri
city
,Gas
and
Wat
er s
up
ply
(C
,E,F
)1
1O
ther
Co
mm
unit
y,S
oci
al a
nd
Per
sonal
Ser
vic
e A
ctiv
itie
s
4W
ho
lesa
le a
nd
Ret
ail
Tra
de,
Rep
air
of
Mo
tor
Veh
icle
s,E
xtr
a T
erit
ori
al O
rgan
izat
ions
& b
od
ies
(O,Q
)
Mo
torc
ycl
es a
nd
Per
sonal
and
Ho
use
ho
ld G
oo
ds
(G
)1
2P
rivat
e H
ouse
ho
lds
wit
h E
mp
loyed
Per
sons
( P
)
5H
ote
ls a
nd
Res
taura
nts
(H
)1
3M
isce
llan
eous
Lab
our
wo
rk
6T
ransp
ort
, S
tora
ge
and
Co
mm
unic
atio
n
(I)
14
Ind
ust
ries
no
t ad
equat
ely d
escr
ibed
7F
inan
cial
Inte
rmed
iati
on a
nd
Rea
l E
stat
e,
Ren
ting a
nd
Busi
nes
s A
ctiv
itie
s
(J,
K)
No
te:
The
tab
ula
tio
n g
roup
s b
ased
on I
SIC
(R
ev.3
) ar
e in
dic
ated
as
A,B
,C…
…..
Q.
Due
to t
he
lim
itat
ions
on r
elia
bil
ity (
bas
ed o
n C
V),
som
e o
f th
ese
gro
up
s
hav
e b
een c
om
bin
ed.
Indust
ry g
roup
To
tal
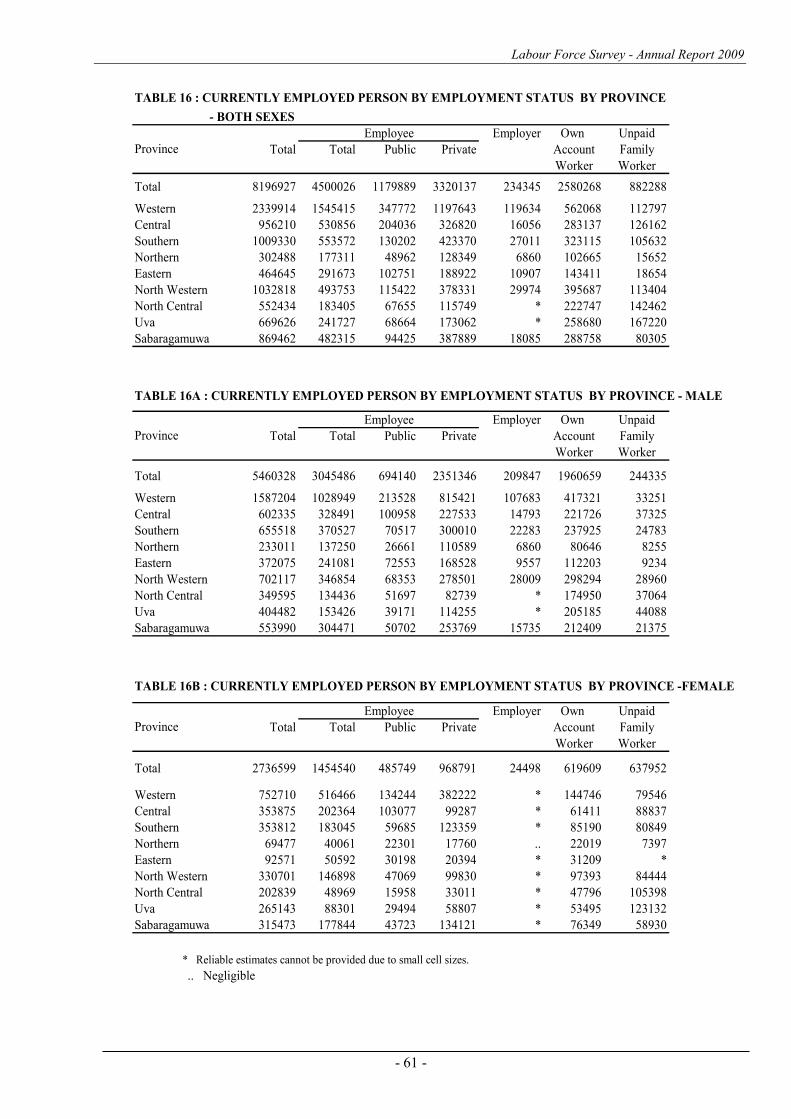
Labour Force Survey - Annual Report 2009
- 61 -
TABLE 16 : CURRENTLY EMPLOYED PERSON BY EMPLOYMENT STATUS BY PROVINCE
- BOTH SEXES
Employer Own Unpaid
Total Total Public Private Account Family
Worker Worker
Total 8196927 4500026 1179889 3320137 234345 2580268 882288
Western 2339914 1545415 347772 1197643 119634 562068 112797
Central 956210 530856 204036 326820 16056 283137 126162
Southern 1009330 553572 130202 423370 27011 323115 105632
Northern 302488 177311 48962 128349 6860 102665 15652
Eastern 464645 291673 102751 188922 10907 143411 18654
North Western 1032818 493753 115422 378331 29974 395687 113404
North Central 552434 183405 67655 115749 * 222747 142462
Uva 669626 241727 68664 173062 * 258680 167220
Sabaragamuwa 869462 482315 94425 387889 18085 288758 80305
TABLE 16A : CURRENTLY EMPLOYED PERSON BY EMPLOYMENT STATUS BY PROVINCE - MALE
Employer Own Unpaid
Total Total Public Private Account Family
Worker Worker
Total 5460328 3045486 694140 2351346 209847 1960659 244335
Western 1587204 1028949 213528 815421 107683 417321 33251
Central 602335 328491 100958 227533 14793 221726 37325
Southern 655518 370527 70517 300010 22283 237925 24783
Northern 233011 137250 26661 110589 6860 80646 8255
Eastern 372075 241081 72553 168528 9557 112203 9234
North Western 702117 346854 68353 278501 28009 298294 28960
North Central 349595 134436 51697 82739 * 174950 37064
Uva 404482 153426 39171 114255 * 205185 44088
Sabaragamuwa 553990 304471 50702 253769 15735 212409 21375
TABLE 16B : CURRENTLY EMPLOYED PERSON BY EMPLOYMENT STATUS BY PROVINCE -FEMALE
Employer Own Unpaid
Total Total Public Private Account Family
Worker Worker
Total 2736599 1454540 485749 968791 24498 619609 637952
Western 752710 516466 134244 382222 * 144746 79546
Central 353875 202364 103077 99287 * 61411 88837
Southern 353812 183045 59685 123359 * 85190 80849
Northern 69477 40061 22301 17760 .. 22019 7397
Eastern 92571 50592 30198 20394 * 31209 *
North Western 330701 146898 47069 99830 * 97393 84444
North Central 202839 48969 15958 33011 * 47796 105398
Uva 265143 88301 29494 58807 * 53495 123132
Sabaragamuwa 315473 177844 43723 134121 * 76349 58930
* Reliable estimates cannot be provided due to small cell sizes.
.. Negligible
Province
Employee
Province
Employee
Province
Employee
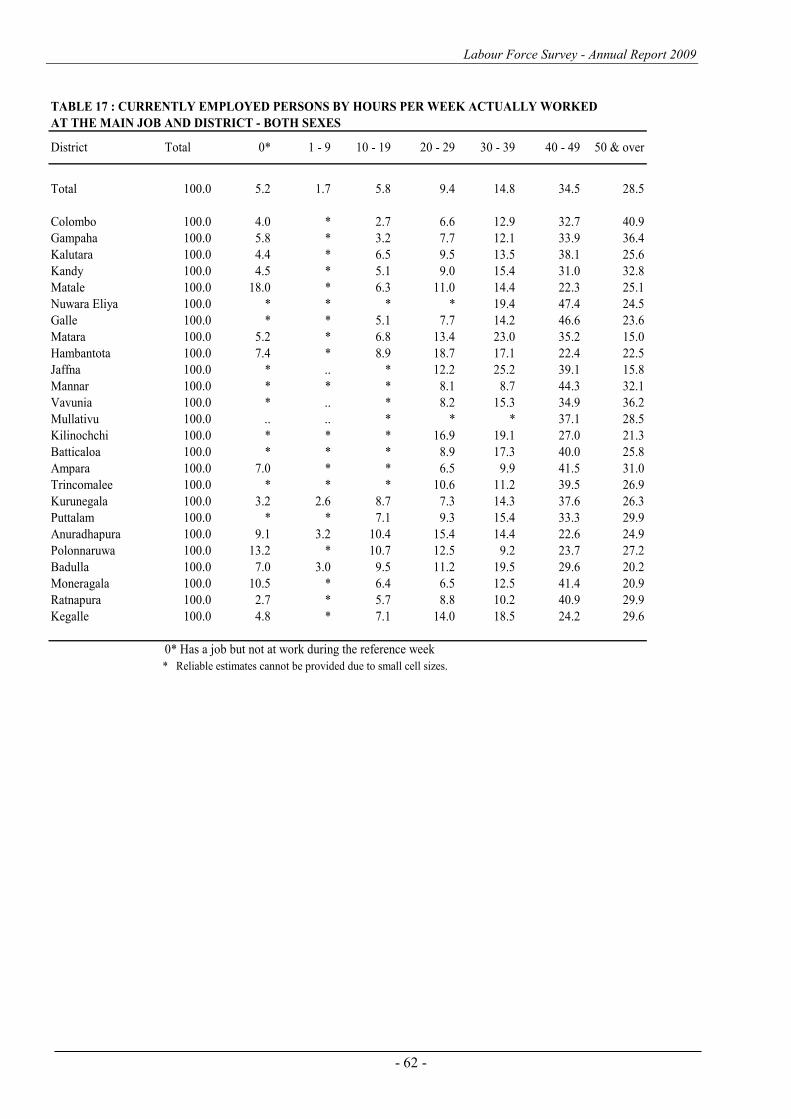
Labour Force Survey - Annual Report 2009
- 62 -
TABLE 17 : CURRENTLY EMPLOYED PERSONS BY HOURS PER WEEK ACTUALLY WORKED
AT THE MAIN JOB AND DISTRICT - BOTH SEXES
Total 100.0 5.2 1.7 5.8 9.4 14.8 34.5 28.5
Colombo 100.0 4.0 * 2.7 6.6 12.9 32.7 40.9
Gampaha 100.0 5.8 * 3.2 7.7 12.1 33.9 36.4
Kalutara 100.0 4.4 * 6.5 9.5 13.5 38.1 25.6
Kandy 100.0 4.5 * 5.1 9.0 15.4 31.0 32.8
Matale 100.0 18.0 * 6.3 11.0 14.4 22.3 25.1
Nuwara Eliya 100.0 * * * * 19.4 47.4 24.5
Galle 100.0 * * 5.1 7.7 14.2 46.6 23.6
Matara 100.0 5.2 * 6.8 13.4 23.0 35.2 15.0
Hambantota 100.0 7.4 * 8.9 18.7 17.1 22.4 22.5
Jaffna 100.0 * .. * 12.2 25.2 39.1 15.8
Mannar 100.0 * * * 8.1 8.7 44.3 32.1
Vavunia 100.0 * .. * 8.2 15.3 34.9 36.2
Mullativu 100.0 .. .. * * * 37.1 28.5
Kilinochchi 100.0 * * * 16.9 19.1 27.0 21.3
Batticaloa 100.0 * * * 8.9 17.3 40.0 25.8
Ampara 100.0 7.0 * * 6.5 9.9 41.5 31.0
Trincomalee 100.0 * * * 10.6 11.2 39.5 26.9
Kurunegala 100.0 3.2 2.6 8.7 7.3 14.3 37.6 26.3
Puttalam 100.0 * * 7.1 9.3 15.4 33.3 29.9
Anuradhapura 100.0 9.1 3.2 10.4 15.4 14.4 22.6 24.9
Polonnaruwa 100.0 13.2 * 10.7 12.5 9.2 23.7 27.2
Badulla 100.0 7.0 3.0 9.5 11.2 19.5 29.6 20.2
Moneragala 100.0 10.5 * 6.4 6.5 12.5 41.4 20.9
Ratnapura 100.0 2.7 * 5.7 8.8 10.2 40.9 29.9
Kegalle 100.0 4.8 * 7.1 14.0 18.5 24.2 29.6
0* Has a job but not at work during the reference week
* Reliable estimates cannot be provided due to small cell sizes.
District Total 0* 1 - 9 10 - 19 20 - 29 30 - 39 40 - 49 50 & over
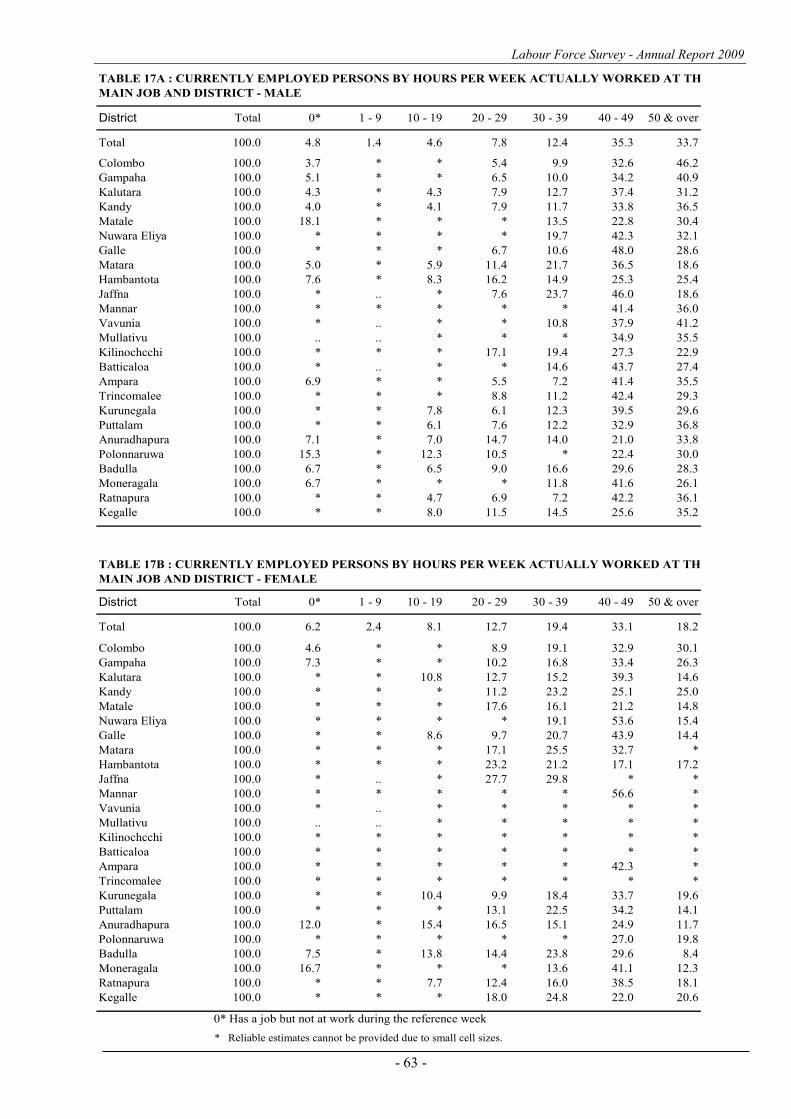
Labour Force Survey - Annual Report 2009
- 63 -
TABLE 17A : CURRENTLY EMPLOYED PERSONS BY HOURS PER WEEK ACTUALLY WORKED AT THE
MAIN JOB AND DISTRICT - MALE
Total 100.0 4.8 1.4 4.6 7.8 12.4 35.3 33.7
Colombo 100.0 3.7 * * 5.4 9.9 32.6 46.2
Gampaha 100.0 5.1 * * 6.5 10.0 34.2 40.9
Kalutara 100.0 4.3 * 4.3 7.9 12.7 37.4 31.2
Kandy 100.0 4.0 * 4.1 7.9 11.7 33.8 36.5
Matale 100.0 18.1 * * * 13.5 22.8 30.4
Nuwara Eliya 100.0 * * * * 19.7 42.3 32.1
Galle 100.0 * * * 6.7 10.6 48.0 28.6
Matara 100.0 5.0 * 5.9 11.4 21.7 36.5 18.6
Hambantota 100.0 7.6 * 8.3 16.2 14.9 25.3 25.4
Jaffna 100.0 * .. * 7.6 23.7 46.0 18.6
Mannar 100.0 * * * * * 41.4 36.0
Vavunia 100.0 * .. * * 10.8 37.9 41.2
Mullativu 100.0 .. .. * * * 34.9 35.5
Kilinochcchi 100.0 * * * 17.1 19.4 27.3 22.9
Batticaloa 100.0 * .. * * 14.6 43.7 27.4
Ampara 100.0 6.9 * * 5.5 7.2 41.4 35.5
Trincomalee 100.0 * * * 8.8 11.2 42.4 29.3
Kurunegala 100.0 * * 7.8 6.1 12.3 39.5 29.6
Puttalam 100.0 * * 6.1 7.6 12.2 32.9 36.8
Anuradhapura 100.0 7.1 * 7.0 14.7 14.0 21.0 33.8
Polonnaruwa 100.0 15.3 * 12.3 10.5 * 22.4 30.0
Badulla 100.0 6.7 * 6.5 9.0 16.6 29.6 28.3
Moneragala 100.0 6.7 * * * 11.8 41.6 26.1
Ratnapura 100.0 * * 4.7 6.9 7.2 42.2 36.1
Kegalle 100.0 * * 8.0 11.5 14.5 25.6 35.2
TABLE 17B : CURRENTLY EMPLOYED PERSONS BY HOURS PER WEEK ACTUALLY WORKED AT THE
MAIN JOB AND DISTRICT - FEMALE
Total 100.0 6.2 2.4 8.1 12.7 19.4 33.1 18.2
Colombo 100.0 4.6 * * 8.9 19.1 32.9 30.1
Gampaha 100.0 7.3 * * 10.2 16.8 33.4 26.3
Kalutara 100.0 * * 10.8 12.7 15.2 39.3 14.6
Kandy 100.0 * * * 11.2 23.2 25.1 25.0
Matale 100.0 * * * 17.6 16.1 21.2 14.8
Nuwara Eliya 100.0 * * * * 19.1 53.6 15.4
Galle 100.0 * * 8.6 9.7 20.7 43.9 14.4
Matara 100.0 * * * 17.1 25.5 32.7 *
Hambantota 100.0 * * * 23.2 21.2 17.1 17.2
Jaffna 100.0 * .. * 27.7 29.8 * *
Mannar 100.0 * * * * * 56.6 *
Vavunia 100.0 * .. * * * * *
Mullativu 100.0 .. .. * * * * *
Kilinochcchi 100.0 * * * * * * *
Batticaloa 100.0 * * * * * * *
Ampara 100.0 * * * * * 42.3 *
Trincomalee 100.0 * * * * * * *
Kurunegala 100.0 * * 10.4 9.9 18.4 33.7 19.6
Puttalam 100.0 * * * 13.1 22.5 34.2 14.1
Anuradhapura 100.0 12.0 * 15.4 16.5 15.1 24.9 11.7
Polonnaruwa 100.0 * * * * * 27.0 19.8
Badulla 100.0 7.5 * 13.8 14.4 23.8 29.6 8.4
Moneragala 100.0 16.7 * * * 13.6 41.1 12.3
Ratnapura 100.0 * * 7.7 12.4 16.0 38.5 18.1
Kegalle 100.0 * * * 18.0 24.8 22.0 20.6
0* Has a job but not at work during the reference week
* Reliable estimates cannot be provided due to small cell sizes.
1 - 9 50 & over30 - 39 40 - 4910 - 19 20 - 29District Total 0*
30 - 39 40 - 49 50 & overDistrict Total 0* 1 - 9 10 - 19 20 - 29
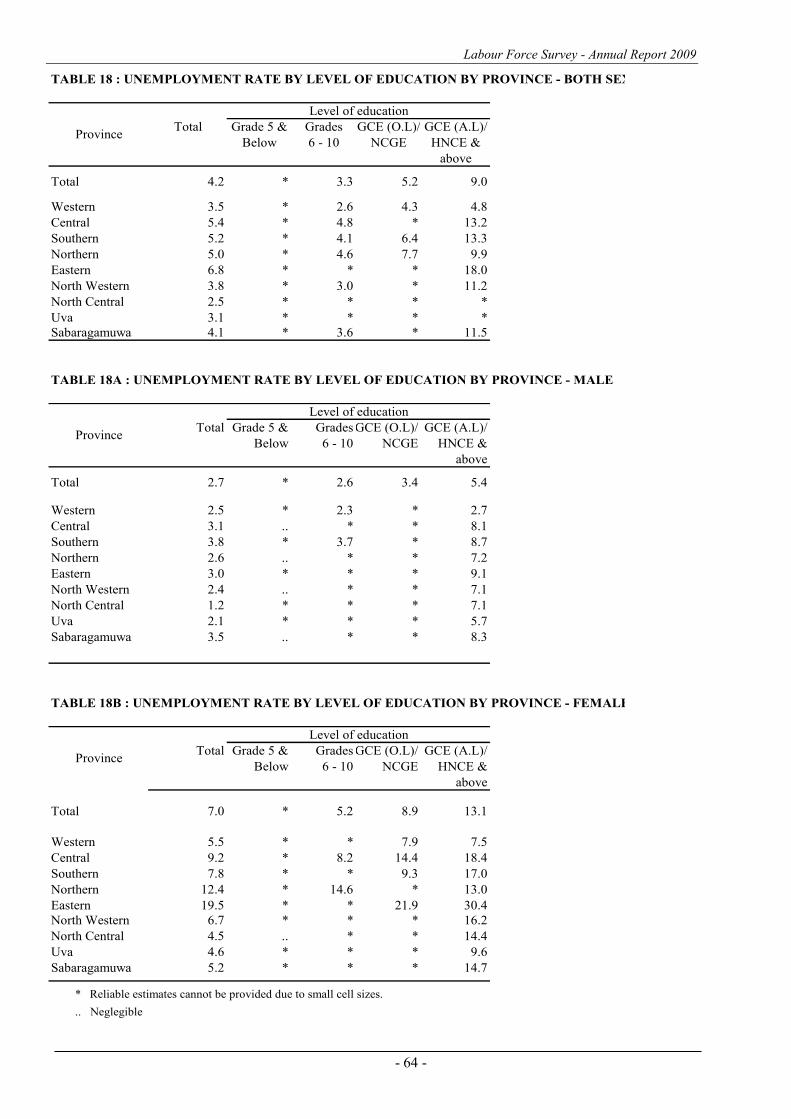
Labour Force Survey - Annual Report 2009
- 64 -
TABLE 18 : UNEMPLOYMENT RATE BY LEVEL OF EDUCATION BY PROVINCE - BOTH SEXES
Total Grade 5 & Grades GCE (O.L)/ GCE (A.L)/
Below 6 - 10 NCGE HNCE &
above
Total 4.2 * 3.3 5.2 9.0
Western 3.5 * 2.6 4.3 4.8
Central 5.4 * 4.8 * 13.2
Southern 5.2 * 4.1 6.4 13.3
Northern 5.0 * 4.6 7.7 9.9
Eastern 6.8 * * * 18.0
North Western 3.8 * 3.0 * 11.2
North Central 2.5 * * * *
Uva 3.1 * * * *
Sabaragamuwa 4.1 * 3.6 * 11.5
TABLE 18A : UNEMPLOYMENT RATE BY LEVEL OF EDUCATION BY PROVINCE - MALE
Total Grade 5 & GradesGCE (O.L)/ GCE (A.L)/
Below 6 - 10 NCGE HNCE &
above
Total 2.7 * 2.6 3.4 5.4
Western 2.5 * 2.3 * 2.7
Central 3.1 .. * * 8.1
Southern 3.8 * 3.7 * 8.7
Northern 2.6 .. * * 7.2
Eastern 3.0 * * * 9.1
North Western 2.4 .. * * 7.1
North Central 1.2 * * * 7.1
Uva 2.1 * * * 5.7
Sabaragamuwa 3.5 .. * * 8.3
TABLE 18B : UNEMPLOYMENT RATE BY LEVEL OF EDUCATION BY PROVINCE - FEMALE
Total Grade 5 & GradesGCE (O.L)/ GCE (A.L)/
Below 6 - 10 NCGE HNCE &
above
Total 7.0 * 5.2 8.9 13.1
Western 5.5 * * 7.9 7.5
Central 9.2 * 8.2 14.4 18.4
Southern 7.8 * * 9.3 17.0
Northern 12.4 * 14.6 * 13.0
Eastern 19.5 * * 21.9 30.4
North Western 6.7 * * * 16.2
North Central 4.5 .. * * 14.4
Uva 4.6 * * * 9.6
Sabaragamuwa 5.2 * * * 14.7
* Reliable estimates cannot be provided due to small cell sizes.
Level of education
Province
Province
Level of education
Province
Level of education
.. Neglegible
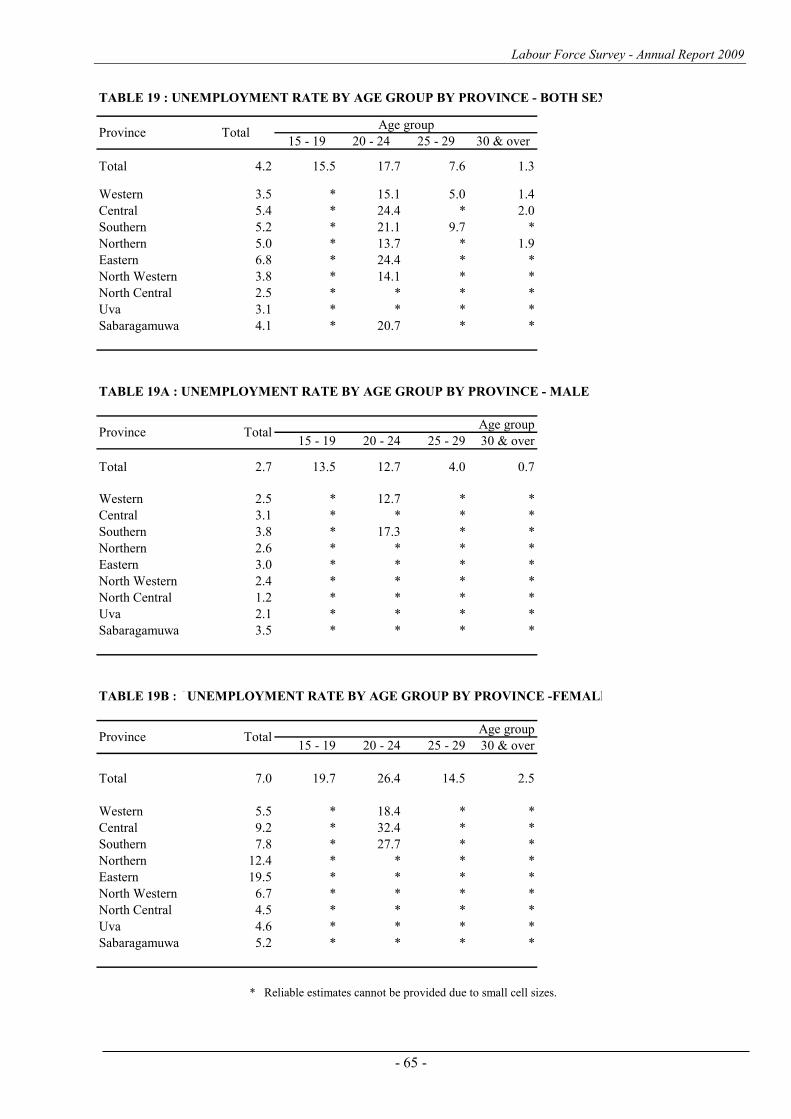
Labour Force Survey - Annual Report 2009
- 65 -
TABLE 19 : UNEMPLOYMENT RATE BY AGE GROUP BY PROVINCE - BOTH SEXES
15 - 19 20 - 24 25 - 29 30 & over
Total 4.2 15.5 17.7 7.6 1.3
Western 3.5 * 15.1 5.0 1.4
Central 5.4 * 24.4 * 2.0
Southern 5.2 * 21.1 9.7 *
Northern 5.0 * 13.7 * 1.9
Eastern 6.8 * 24.4 * *
North Western 3.8 * 14.1 * *
North Central 2.5 * * * *
Uva 3.1 * * * *
Sabaragamuwa 4.1 * 20.7 * *
TABLE 19A : UNEMPLOYMENT RATE BY AGE GROUP BY PROVINCE - MALE
15 - 19 20 - 24 25 - 29 30 & over
Total 2.7 13.5 12.7 4.0 0.7
Western 2.5 * 12.7 * *
Central 3.1 * * * *
Southern 3.8 * 17.3 * *
Northern 2.6 * * * *
Eastern 3.0 * * * *
North Western 2.4 * * * *
North Central 1.2 * * * *
Uva 2.1 * * * *
Sabaragamuwa 3.5 * * * *
TABLE 19B : 3UNEMPLOYMENT RATE BY AGE GROUP BY PROVINCE -FEMALE
15 - 19 20 - 24 25 - 29 30 & over
Total 7.0 19.7 26.4 14.5 2.5
Western 5.5 * 18.4 * *
Central 9.2 * 32.4 * *
Southern 7.8 * 27.7 * *
Northern 12.4 * * * *
Eastern 19.5 * * * *
North Western 6.7 * * * *
North Central 4.5 * * * *
Uva 4.6 * * * *
Sabaragamuwa 5.2 * * * *
* Reliable estimates cannot be provided due to small cell sizes.
Age groupTotalProvince
Province TotalAge group
Province TotalAge group
Labour Force Survey - Annual Report 2009
- 66 -
Special Statistical Appendix EXPLANATORY NOTES
Sri Lanka Labour Force Survey was designed to measure the levels and trends of employment,
unemployment and labour force in Sri Lanka. This survey is being conducted quarterly, since the first
quarter of 1990.
This quarterly survey of households is conducted through a scientifically selected sample designed to
represent the civilian non-institutional population. Respondents are interviewed to obtain information
about the employment status etc. of each member of the household 10 years of age and older.
The field work of the survey is done during the third week of the each month, Monday through Sunday.
This is known as the "survey week". The inquiry relates to activity or status are referred in the preceding
week of the survey week; referred to as the "reference week".
The concepts and definitions underlying labour force data are as follows.
1. Labour force: The labour force is composed of the economically active population 10 years of age
and over.
2. The Economically Active Population: Those persons who are/were employed or unemployed
during the reference period of the survey.
3. Employed: Persons, who during the reference period, worked as paid employees, employers, own
account workers (self employed), or contributing family workers are said to be employed. This
includes persons with a job but not at work during the reference period.
4. Unemployed: Persons who are seeking and available for work, but had no employment during the
reference period.
5. Currently Economically Active: A person who was employed or unemployed during the current
reference period is considered to be currently economically active.
6. Not in the Labour Force (not economically active): Persons who were neither working not
available/looking for work are classified as ”not in the labour force”. Persons are not in the labour
force for such reasons as: full time care of the household, full – time students, retired or old age,
infirmed or disabled, or are not interested in working for one reason or another. Current and Usual
definitions apply.
Coverage
Concepts & Definitions
Labour Force Survey - Annual Report 2009
- 67 -
7. Criteria for classification of underemployment
In order to classify an employed persons as visibly underemployed,
(i) If the person has worked less than the normal duration in his/her main activity
In Sri Lanka scenario, 35 hours per week is taken as the cut-off point applicable to all workers,
except government teachers. As in practice, though teachers do have a normal duration of work
which is below the general cut-off point, they should be on a full time schedule according to the
nature of their job. Further, those who do have a secondary job, or those who are employers,
were considered as having worked the normal duration in their respective activity.
Therefore, if the person has worked less than the normal duration in his/her activity (as
described above), then the person is further questioned to ascertain whether he/She is prepared
and available for further work if provided. Such persons are considered underemployed in their
respective employment.
(ii) If the person has worked more than the normal duration in his/her activity
If the person has worked even more than 35 hours as usually, but he has worked less than 35
hours actually in the reference period, only due to the off season or bad weather, such persons
were also further questioned to check their underemployment situation, considering them as a
special category.
8. Informal Sector Employment
In order to classify a person to be employed in informal sector employment, following information
were used.
(i) Registration of the organization
(ii) Accounts keeping practices of the organization
(iii) Total number of regular employees of the organization.
Statistics based on the quarterly labour force data are subject to sampling and non - sampling errors. When a
sample rather than the entire population is surveyed, there is a chance that the sample estimates may differ from
the "true" population values they represent.
The exact differences, or sampling error, vary depending on the particular sample selected, and this variability is
measured by the standard error of the estimate. There is about a 95 percent chance, or level of confidence, that an
estimate based on a sample will differ by no more than 1.96 standard errors from the " true" population value,
because of sampling error. Analyses relating to the Labour Force Survey are generally conducted at the 95
percent level of confidence.
Reliability of the Estimates
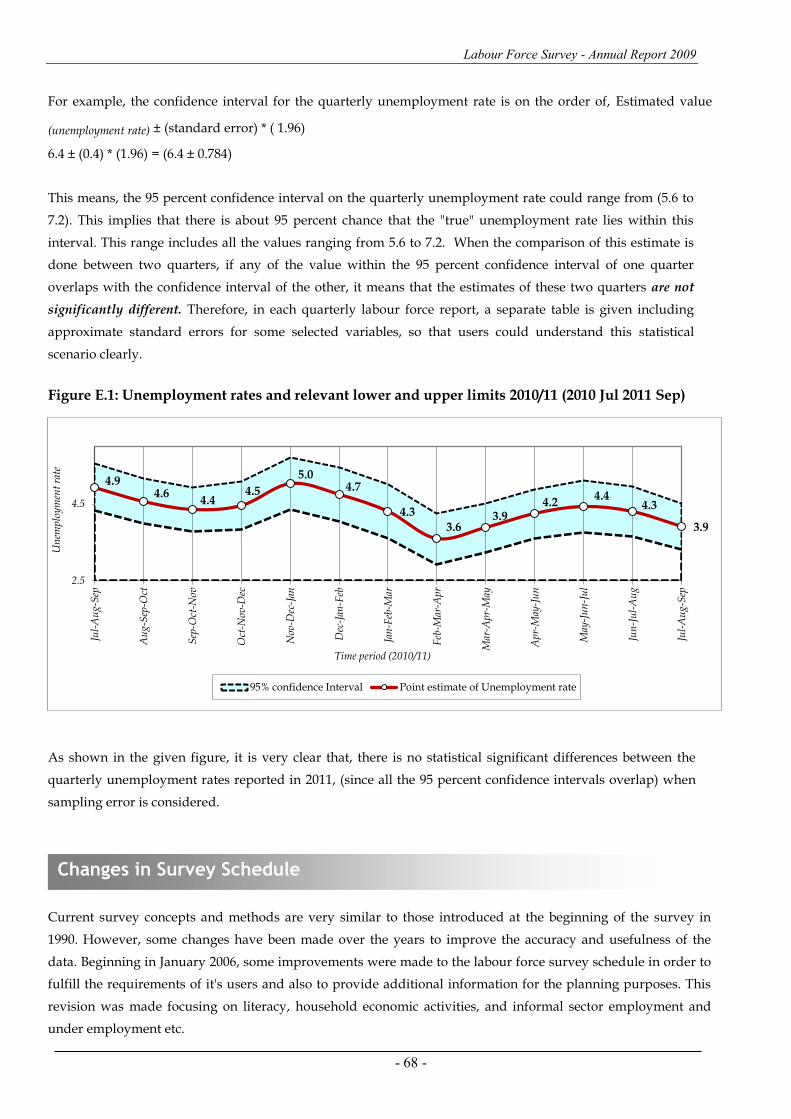
Labour Force Survey - Annual Report 2009
- 68 -
For example, the confidence interval for the quarterly unemployment rate is on the order of, Estimated value
(unemployment rate) ± (standard error) * ( 1.96)
6.4 ± (0.4) * (1.96) = (6.4 ± 0.784)
This means, the 95 percent confidence interval on the quarterly unemployment rate could range from (5.6 to
7.2). This implies that there is about 95 percent chance that the "true" unemployment rate lies within this
interval. This range includes all the values ranging from 5.6 to 7.2. When the comparison of this estimate is
done between two quarters, if any of the value within the 95 percent confidence interval of one quarter
overlaps with the confidence interval of the other, it means that the estimates of these two quarters are not
significantly different. Therefore, in each quarterly labour force report, a separate table is given including
approximate standard errors for some selected variables, so that users could understand this statistical
scenario clearly.
Figure E.1: Unemployment rates and relevant lower and upper limits 2010/11 (2010 Jul 2011 Sep)
As shown in the given figure, it is very clear that, there is no statistical significant differences between the
quarterly unemployment rates reported in 2011, (since all the 95 percent confidence intervals overlap) when
sampling error is considered.
Current survey concepts and methods are very similar to those introduced at the beginning of the survey in
1990. However, some changes have been made over the years to improve the accuracy and usefulness of the
data. Beginning in January 2006, some improvements were made to the labour force survey schedule in order to
fulfill the requirements of it's users and also to provide additional information for the planning purposes. This
revision was made focusing on literacy, household economic activities, and informal sector employment and
under employment etc.
Changes in Survey Schedule
4.9 4.6
4.4 4.5
5.0 4.7
4.3
3.6 3.9
4.2 4.4
4.3
3.9
2.5
4.5
Jul-
Au
g-S
ep
Au
g-S
ep-O
ct
Sep
-Oct
-Nov
Oct
-Nov
-Dec
Nov
-Dec
-Jan
Dec
-Jan
-Feb
Jan
-Feb
-Mar
Feb
-Mar
-Apr
Mar
-Apr
-May
Apr
-May
-Ju
n
May
-Ju
n-J
ul
Jun
-Ju
l-A
ug
Jul-
Au
g-S
ep
Un
emp
loy
men
t ra
te
Time period (2010/11)
95% confidence Interval Point estimate of Unemployment rate
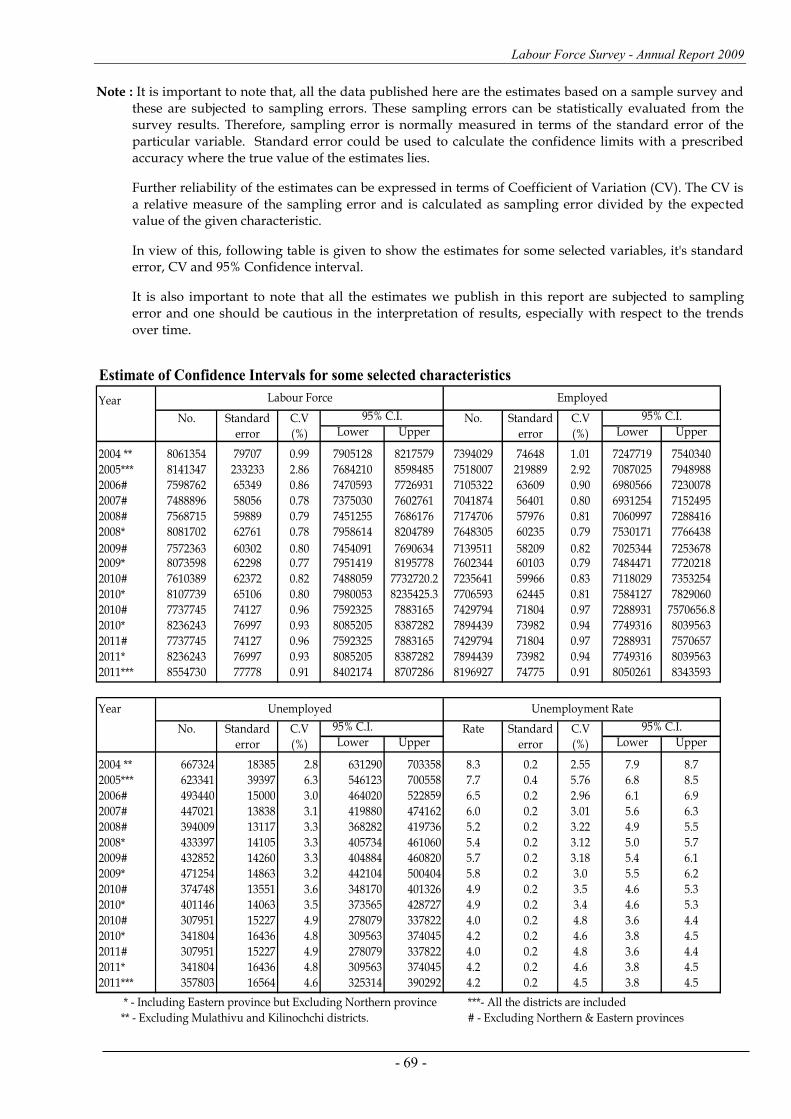
Labour Force Survey - Annual Report 2009
- 69 -
Note : It is important to note that, all the data published here are the estimates based on a sample survey and these are subjected to sampling errors. These sampling errors can be statistically evaluated from the survey results. Therefore, sampling error is normally measured in terms of the standard error of the particular variable. Standard error could be used to calculate the confidence limits with a prescribed accuracy where the true value of the estimates lies.
Further reliability of the estimates can be expressed in terms of Coefficient of Variation (CV). The CV is a relative measure of the sampling error and is calculated as sampling error divided by the expected value of the given characteristic.
In view of this, following table is given to show the estimates for some selected variables, it's standard error, CV and 95% Confidence interval.
It is also important to note that all the estimates we publish in this report are subjected to sampling error and one should be cautious in the interpretation of results, especially with respect to the trends over time.
Estimate of Confidence Intervals for some selected characteristics
No. Standard C.V No. Standard C.V
error (%) Lower Upper error (%) Lower Upper
2004 ** 8061354 79707 0.99 7905128 8217579 7394029 74648 1.01 7247719 7540340
2005*** 8141347 233233 2.86 7684210 8598485 7518007 219889 2.92 7087025 7948988
2006# 7598762 65349 0.86 7470593 7726931 7105322 63609 0.90 6980566 7230078
2007# 7488896 58056 0.78 7375030 7602761 7041874 56401 0.80 6931254 7152495
2008# 7568715 59889 0.79 7451255 7686176 7174706 57976 0.81 7060997 7288416
2008* 8081702 62761 0.78 7958614 8204789 7648305 60235 0.79 7530171 7766438
2009# 7572363 60302 0.80 7454091 7690634 7139511 58209 0.82 7025344 72536782009* 8073598 62298 0.77 7951419 8195778 7602344 60103 0.79 7484471 7720218
2010# 7610389 62372 0.82 7488059 7732720.2 7235641 59966 0.83 7118029 7353254
2010* 8107739 65106 0.80 7980053 8235425.3 7706593 62445 0.81 7584127 7829060
2010# 7737745 74127 0.96 7592325 7883165 7429794 71804 0.97 7288931 7570656.8
2010* 8236243 76997 0.93 8085205 8387282 7894439 73982 0.94 7749316 8039563
2011# 7737745 74127 0.96 7592325 7883165 7429794 71804 0.97 7288931 7570657
2011* 8236243 76997 0.93 8085205 8387282 7894439 73982 0.94 7749316 8039563
2011*** 8554730 77778 0.91 8402174 8707286 8196927 74775 0.91 8050261 8343593
No. Standard C.V 95% C.I. Rate Standard C.V
error (%) Lower Upper error (%) Lower Upper
2004 ** 667324 18385 2.8 631290 703358 8.3 0.2 2.55 7.9 8.7
2005*** 623341 39397 6.3 546123 700558 7.7 0.4 5.76 6.8 8.5
2006# 493440 15000 3.0 464020 522859 6.5 0.2 2.96 6.1 6.9
2007# 447021 13838 3.1 419880 474162 6.0 0.2 3.01 5.6 6.3
2008# 394009 13117 3.3 368282 419736 5.2 0.2 3.22 4.9 5.5
2008* 433397 14105 3.3 405734 461060 5.4 0.2 3.12 5.0 5.7
2009# 432852 14260 3.3 404884 460820 5.7 0.2 3.18 5.4 6.1
2009* 471254 14863 3.2 442104 500404 5.8 0.2 3.0 5.5 6.2
2010# 374748 13551 3.6 348170 401326 4.9 0.2 3.5 4.6 5.3
2010* 401146 14063 3.5 373565 428727 4.9 0.2 3.4 4.6 5.3
2010# 307951 15227 4.9 278079 337822 4.0 0.2 4.8 3.6 4.4
2010* 341804 16436 4.8 309563 374045 4.2 0.2 4.6 3.8 4.5
2011# 307951 15227 4.9 278079 337822 4.0 0.2 4.8 3.6 4.4
2011* 341804 16436 4.8 309563 374045 4.2 0.2 4.6 3.8 4.5
2011*** 357803 16564 4.6 325314 390292 4.2 0.2 4.5 3.8 4.5
* - Including Eastern province but Excluding Northern province ***- All the districts are included
** - Excluding Mulathivu and Kilinochchi districts. # - Excluding Northern & Eastern provinces
95% C.I.
Year
EmployedYear
Unemployment RateUnemployed
95% C.I.
Labour Force
95% C.I.
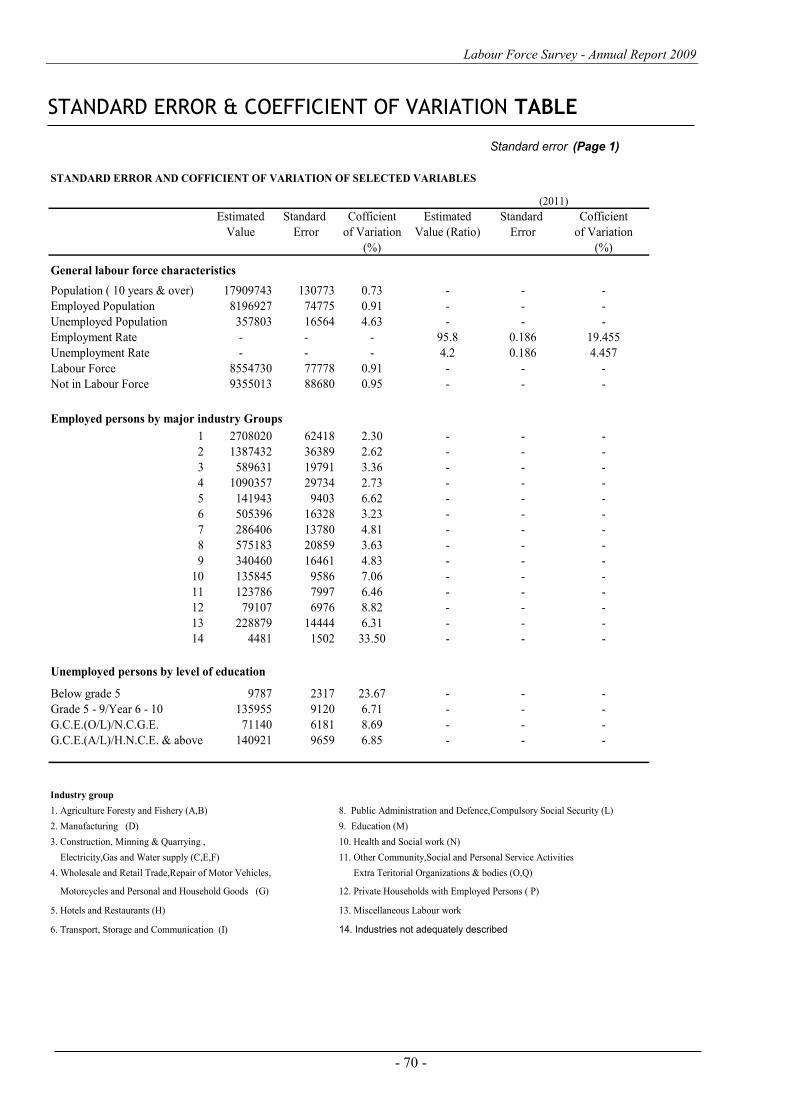
Labour Force Survey - Annual Report 2009
- 70 -
STANDARD ERROR & COEFFICIENT OF VARIATION TABLE
Standard error (Page 1)
(2011)
Estimated Standard Cofficient Estimated Standard Cofficient
Value Error of Variation Value (Ratio) Error of Variation
(%) (%)
General labour force characteristics
Population ( 10 years & over) 17909743 130773 0.73 - - -
Employed Population 8196927 74775 0.91 - - -
Unemployed Population 357803 16564 4.63 - - -
Employment Rate - - - 95.8 0.186 19.455
Unemployment Rate - - - 4.2 0.186 4.457
Labour Force 8554730 77778 0.91 - - -
Not in Labour Force 9355013 88680 0.95 - - -
Employed persons by major industry Groups
1 2708020 62418 2.30 - - -
2 1387432 36389 2.62 - - -
3 589631 19791 3.36 - - -
4 1090357 29734 2.73 - - -
5 141943 9403 6.62 - - -
6 505396 16328 3.23 - - -
7 286406 13780 4.81 - - -
8 575183 20859 3.63 - - -
9 340460 16461 4.83 - - -
10 135845 9586 7.06 - - -
11 123786 7997 6.46 - - -
12 79107 6976 8.82 - - -
13 228879 14444 6.31 - - -
14 4481 1502 33.50 - - -
Unemployed persons by level of education
Below grade 5 9787 2317 23.67 - - -
Grade 5 - 9/Year 6 - 10 135955 9120 6.71 - - -
G.C.E.(O/L)/N.C.G.E. 71140 6181 8.69 - - -
G.C.E.(A/L)/H.N.C.E. & above 140921 9659 6.85 - - -
Industry group
1. Agriculture Foresty and Fishery (A,B) 8. Public Administration and Defence,Compulsory Social Security (L)
2. Manufacturing (D) 9. Education (M)
3. Construction, Minning & Quarrying , 10. Health and Social work (N)
Electricity,Gas and Water supply (C,E,F) 11. Other Community,Social and Personal Service Activities
4. Wholesale and Retail Trade,Repair of Motor Vehicles, Extra Teritorial Organizations & bodies (O,Q)
Motorcycles and Personal and Household Goods (G) 12. Private Households with Employed Persons ( P)
5. Hotels and Restaurants (H) 13. Miscellaneous Labour work
6. Transport, Storage and Communication (I) 14. Industries not adequately described
STANDARD ERROR AND COFFICIENT OF VARIATION OF SELECTED VARIABLES
Labour Force Survey - Annual Report 2009
- 71 -
ALTERNATIVE ESTIMATES
Alternative Estimates of Employment, Unemployment and Labour Force Characteristics Official employment, unemployment and labour force characteristics are estimated at the Sri Lanka Labour
Force Survey, based on the internationally comparable concepts and definitions recommended by the ILO.
However the validity of the concepts and definitions used at the survey is questioned very often in some
forums, for the appropriateness of these concepts and definitions in the Sri Lankan context.
The concepts and definitions, which were found to be controversial, are as below.
1. Number of Hours of Work: A person who work at least one hour during the reference week, is
considered employed, under these definitions.
2. Working Age Population: All persons of age 10 years and over are considered to be in the category
of working age.
3. Employment Status:
Paid employees (those who work for wages/salaries).
Employers (who have at least one paid employee under them).
Own account workers (who carry out the economic activity without having any paid employees).
Contributing family workers (who make their contribution to the economic activities carried out
by their own household, without wages/salaries).
The validity of the above concepts and definitions is raised due to the following reasons.
1. Number of Hours of Work: Some point out that one hour per week is too low, to consider a person
to be employed.
2. Working Age Population: Some point out those persons in the age group 10-14 years. are too young
to consider to be in the working age.
3. Employment Status: Some point out that „contributing family workers‟ may work in the family
enterprise without payment because they have no other work, and so it is not appropriate to consider
them as employed.
An attempt has been made to produce 'Alternative estimates of Employment, Unemployment and Labour
Force Characteristics,' by revising the original concepts and definitions so that the above issues are addressed
as explained below.
1. Number of Hours of Work: Persons who work 20 hours or more per week only are considered to be
employed.
2. Working Age Population: Persons who are over 15 years of age only are considered to be in the
working age.
3. Employment Status: Contributing family workers are not considered as employed. Those
contributing family workers who were reported to be seeking some other work are considered as
unemployed and the rest of the contributing family workers are considered as economically inactive
(not in the labour force) so only paid employees, employers and own account workers are considered
to be employed.
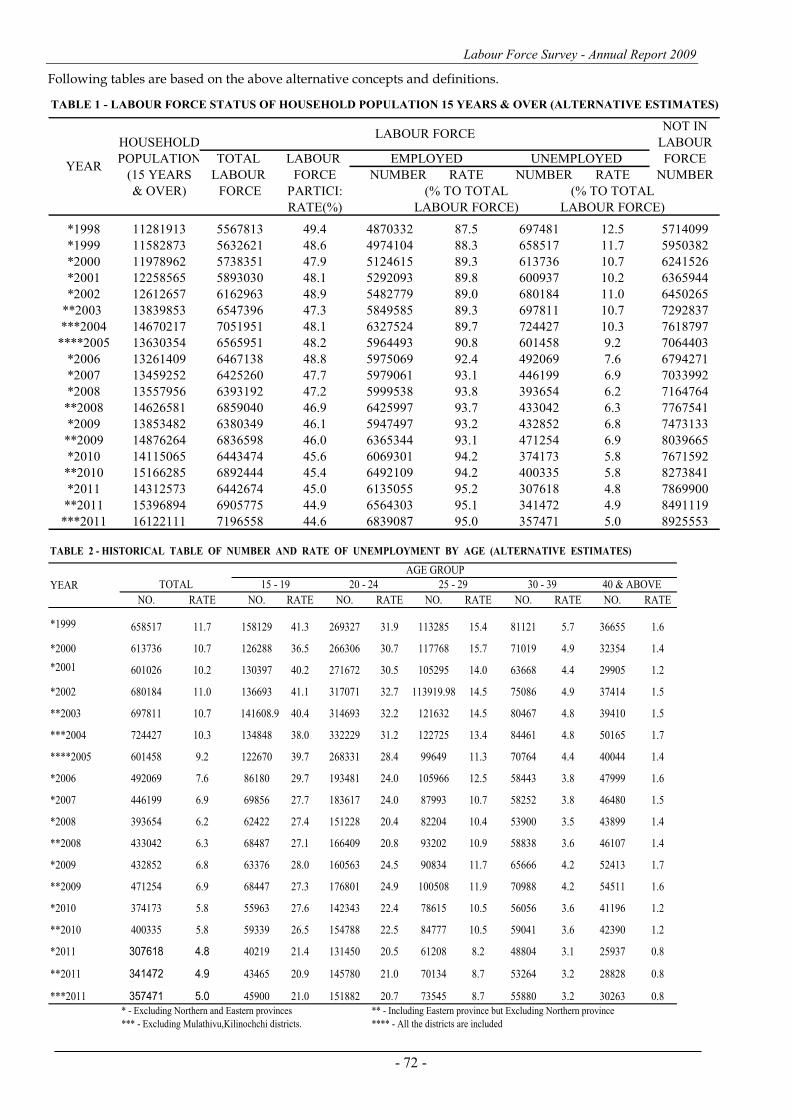
Labour Force Survey - Annual Report 2009
- 72 -
Following tables are based on the above alternative concepts and definitions.
TABLE 1 - LABOUR FORCE STATUS OF HOUSEHOLD POPULATION 15 YEARS & OVER (ALTERNATIVE ESTIMATES)
NOT IN
HOUSEHOLD LABOUR
POPULATION TOTAL LABOUR FORCE
(15 YEARS LABOUR FORCE NUMBER RATE NUMBER RATE NUMBER
& OVER) FORCE PARTICI: (% TO TOTAL (% TO TOTAL
RATE(%) LABOUR FORCE) LABOUR FORCE)
*1998 11281913 5567813 49.4 4870332 87.5 697481 12.5 5714099
*1999 11582873 5632621 48.6 4974104 88.3 658517 11.7 5950382
*2000 11978962 5738351 47.9 5124615 89.3 613736 10.7 6241526
*2001 12258565 5893030 48.1 5292093 89.8 600937 10.2 6365944
*2002 12612657 6162963 48.9 5482779 89.0 680184 11.0 6450265
**2003 13839853 6547396 47.3 5849585 89.3 697811 10.7 7292837
***2004 14670217 7051951 48.1 6327524 89.7 724427 10.3 7618797
****2005 13630354 6565951 48.2 5964493 90.8 601458 9.2 7064403
*2006 13261409 6467138 48.8 5975069 92.4 492069 7.6 6794271
*2007 13459252 6425260 47.7 5979061 93.1 446199 6.9 7033992
*2008 13557956 6393192 47.2 5999538 93.8 393654 6.2 7164764
**2008 14626581 6859040 46.9 6425997 93.7 433042 6.3 7767541
*2009 13853482 6380349 46.1 5947497 93.2 432852 6.8 7473133
**2009 14876264 6836598 46.0 6365344 93.1 471254 6.9 8039665
*2010 14115065 6443474 45.6 6069301 94.2 374173 5.8 7671592
**2010 15166285 6892444 45.4 6492109 94.2 400335 5.8 8273841
*2011 14312573 6442674 45.0 6135055 95.2 307618 4.8 7869900
**2011 15396894 6905775 44.9 6564303 95.1 341472 4.9 8491119
***2011 16122111 7196558 44.6 6839087 95.0 357471 5.0 8925553
YEAR
LABOUR FORCE
EMPLOYED UNEMPLOYED
TABLE 2 - HISTORICAL TABLE OF NUMBER AND RATE OF UNEMPLOYMENT BY AGE (ALTERNATIVE ESTIMATES)
NO. RATE NO. RATE NO. RATE NO. RATE NO. RATE NO. RATE
*1999 658517 11.7 158129 41.3 269327 31.9 113285 15.4 81121 5.7 36655 1.6
*2000 613736 10.7 126288 36.5 266306 30.7 117768 15.7 71019 4.9 32354 1.4
*2001 601026 10.2 130397 40.2 271672 30.5 105295 14.0 63668 4.4 29905 1.2
*2002 680184 11.0 136693 41.1 317071 32.7 113919.98 14.5 75086 4.9 37414 1.5
**2003 697811 10.7 141608.9 40.4 314693 32.2 121632 14.5 80467 4.8 39410 1.5
***2004 724427 10.3 134848 38.0 332229 31.2 122725 13.4 84461 4.8 50165 1.7
****2005 601458 9.2 122670 39.7 268331 28.4 99649 11.3 70764 4.4 40044 1.4
*2006 492069 7.6 86180 29.7 193481 24.0 105966 12.5 58443 3.8 47999 1.6
*2007 446199 6.9 69856 27.7 183617 24.0 87993 10.7 58252 3.8 46480 1.5
*2008 393654 6.2 62422 27.4 151228 20.4 82204 10.4 53900 3.5 43899 1.4
**2008 433042 6.3 68487 27.1 166409 20.8 93202 10.9 58838 3.6 46107 1.4
*2009 432852 6.8 63376 28.0 160563 24.5 90834 11.7 65666 4.2 52413 1.7
**2009 471254 6.9 68447 27.3 176801 24.9 100508 11.9 70988 4.2 54511 1.6
*2010 374173 5.8 55963 27.6 142343 22.4 78615 10.5 56056 3.6 41196 1.2
**2010 400335 5.8 59339 26.5 154788 22.5 84777 10.5 59041 3.6 42390 1.2
*2011 307618 4.8 40219 21.4 131450 20.5 61208 8.2 48804 3.1 25937 0.8
**2011 341472 4.9 43465 20.9 145780 21.0 70134 8.7 53264 3.2 28828 0.8
***2011 357471 5.0 45900 21.0 151882 20.7 73545 8.7 55880 3.2 30263 0.8
* - Excluding Northern and Eastern provinces ** - Including Eastern province but Excluding Northern province
*** - Excluding Mulathivu,Kilinochchi districts. **** - All the districts are included
YEAR
AGE GROUP
TOTAL 15 - 19 20 - 24 25 - 29 30 - 39 40 & ABOVE
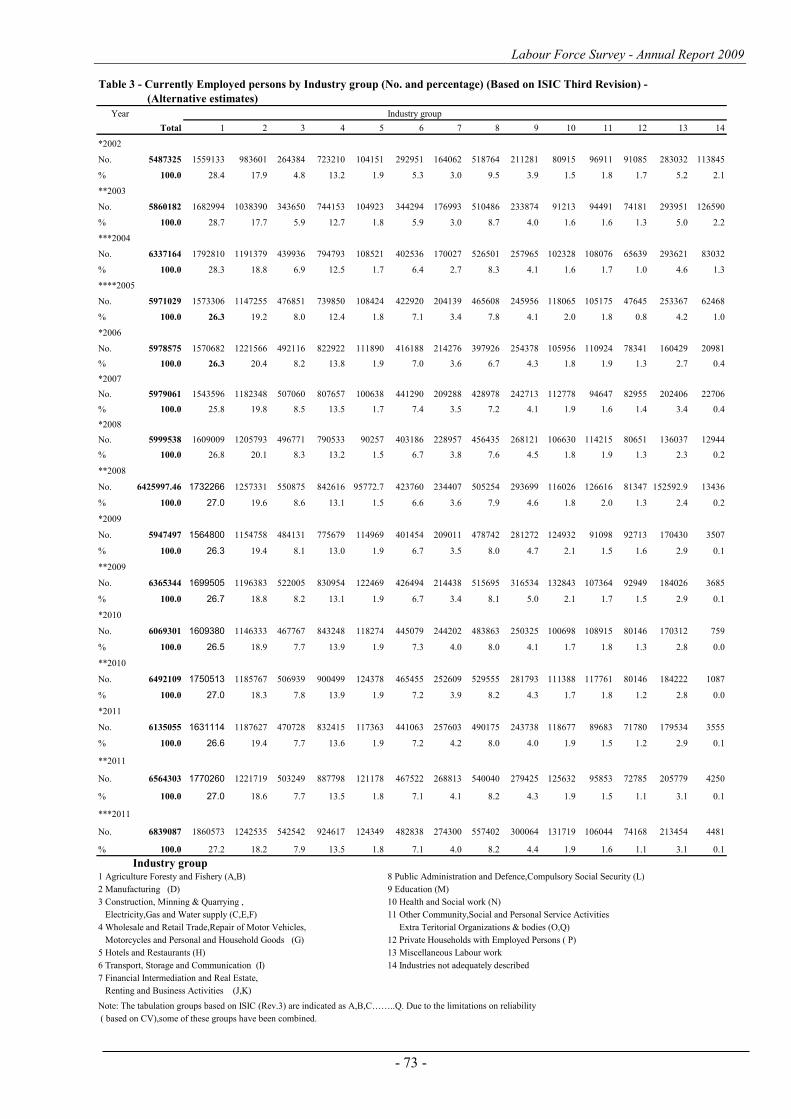
Labour Force Survey - Annual Report 2009
- 73 -
Table 3 - Currently Employed persons by Industry group (No. and percentage) (Based on ISIC Third Revision) -
(Alternative estimates)
Year Industry group
Total 1 2 3 4 5 6 7 8 9 10 11 12 13 14
*2002
No. 5487325 1559133 983601 264384 723210 104151 292951 164062 518764 211281 80915 96911 91085 283032 113845
% 100.0 28.4 17.9 4.8 13.2 1.9 5.3 3.0 9.5 3.9 1.5 1.8 1.7 5.2 2.1
**2003
No. 5860182 1682994 1038390 343650 744153 104923 344294 176993 510486 233874 91213 94491 74181 293951 126590
% 100.0 28.7 17.7 5.9 12.7 1.8 5.9 3.0 8.7 4.0 1.6 1.6 1.3 5.0 2.2
***2004
No. 6337164 1792810 1191379 439936 794793 108521 402536 170027 526501 257965 102328 108076 65639 293621 83032
% 100.0 28.3 18.8 6.9 12.5 1.7 6.4 2.7 8.3 4.1 1.6 1.7 1.0 4.6 1.3
****2005
No. 5971029 1573306 1147255 476851 739850 108424 422920 204139 465608 245956 118065 105175 47645 253367 62468
% 100.0 26.3 19.2 8.0 12.4 1.8 7.1 3.4 7.8 4.1 2.0 1.8 0.8 4.2 1.0
*2006
No. 5978575 1570682 1221566 492116 822922 111890 416188 214276 397926 254378 105956 110924 78341 160429 20981
% 100.0 26.3 20.4 8.2 13.8 1.9 7.0 3.6 6.7 4.3 1.8 1.9 1.3 2.7 0.4
*2007
No. 5979061 1543596 1182348 507060 807657 100638 441290 209288 428978 242713 112778 94647 82955 202406 22706
% 100.0 25.8 19.8 8.5 13.5 1.7 7.4 3.5 7.2 4.1 1.9 1.6 1.4 3.4 0.4
*2008
No. 5999538 1609009 1205793 496771 790533 90257 403186 228957 456435 268121 106630 114215 80651 136037 12944
% 100.0 26.8 20.1 8.3 13.2 1.5 6.7 3.8 7.6 4.5 1.8 1.9 1.3 2.3 0.2
**2008
No. 6425997.46 1732266 1257331 550875 842616 95772.7 423760 234407 505254 293699 116026 126616 81347 152592.9 13436
% 100.0 27.0 19.6 8.6 13.1 1.5 6.6 3.6 7.9 4.6 1.8 2.0 1.3 2.4 0.2
*2009
No. 5947497 1564800 1154758 484131 775679 114969 401454 209011 478742 281272 124932 91098 92713 170430 3507
% 100.0 26.3 19.4 8.1 13.0 1.9 6.7 3.5 8.0 4.7 2.1 1.5 1.6 2.9 0.1
**2009
No. 6365344 1699505 1196383 522005 830954 122469 426494 214438 515695 316534 132843 107364 92949 184026 3685
% 100.0 26.7 18.8 8.2 13.1 1.9 6.7 3.4 8.1 5.0 2.1 1.7 1.5 2.9 0.1
*2010
No. 6069301 1609380 1146333 467767 843248 118274 445079 244202 483863 250325 100698 108915 80146 170312 759
% 100.0 26.5 18.9 7.7 13.9 1.9 7.3 4.0 8.0 4.1 1.7 1.8 1.3 2.8 0.0
**2010
No. 6492109 1750513 1185767 506939 900499 124378 465455 252609 529555 281793 111388 117761 80146 184222 1087
% 100.0 27.0 18.3 7.8 13.9 1.9 7.2 3.9 8.2 4.3 1.7 1.8 1.2 2.8 0.0
*2011
No. 6135055 1631114 1187627 470728 832415 117363 441063 257603 490175 243738 118677 89683 71780 179534 3555
% 100.0 26.6 19.4 7.7 13.6 1.9 7.2 4.2 8.0 4.0 1.9 1.5 1.2 2.9 0.1
**2011
No. 6564303 1770260 1221719 503249 887798 121178 467522 268813 540040 279425 125632 95853 72785 205779 4250
% 100.0 27.0 18.6 7.7 13.5 1.8 7.1 4.1 8.2 4.3 1.9 1.5 1.1 3.1 0.1
***2011
No. 6839087 1860573 1242535 542542 924617 124349 482838 274300 557402 300064 131719 106044 74168 213454 4481
% 100.0 27.2 18.2 7.9 13.5 1.8 7.1 4.0 8.2 4.4 1.9 1.6 1.1 3.1 0.1
Industry group 1 Agriculture Foresty and Fishery (A,B) 8 Public Administration and Defence,Compulsory Social Security (L)
2 Manufacturing (D) 9 Education (M)
3 Construction, Minning & Quarrying , 10 Health and Social work (N)
Electricity,Gas and Water supply (C,E,F) 11 Other Community,Social and Personal Service Activities
4 Wholesale and Retail Trade,Repair of Motor Vehicles, Extra Teritorial Organizations & bodies (O,Q)
Motorcycles and Personal and Household Goods (G) 12 Private Households with Employed Persons ( P)
5 Hotels and Restaurants (H) 13 Miscellaneous Labour work
6 Transport, Storage and Communication (I) 14 Industries not adequately described
7 Financial Intermediation and Real Estate,
Renting and Business Activities (J,K)
Note: The tabulation groups based on ISIC (Rev.3) are indicated as A,B,C……..Q. Due to the limitations on reliability
( based on CV),some of these groups have been combined.
Labour Force Survey - Annual Report 2009
- 74 -