spring global outlook ms 13th march 2016
TRANSCRIPT

March 13, 2016
Morgan Stanley does and seeks to do business with companies covered in Morgan Stanley Research. As a result, investors should be aware that the firm may have a conflict of interest that could affect the objectivity of Morgan Stanley Research. Investors should consider Morgan Stanley Research as only a single factor in making their investment decision. For analyst certification and other important disclosures, refer to the Disclosure Section, located at the end of this report. += Analysts employed by non-U.S. affiliates are not registered with FINRA, may not be associated persons of the member and may not be subject to NASD/NYSE restrictions on communications with a subject company, public appearances and trading securities held by a research analyst account.*
M O R G A N S T A N L E Y R E S E A R C H
Spring Global Strategy Outlook Playing Good Defense
More Concerned: Weaker growth forecasts and rising political risk lead us to close our positive tactical stance and lower exposure in global equities, and to moderate our EU credit weight after the sharp ECB driven rally. We add to cash, US Treasuries and JGBs given significant changes to our policy and rate forecasts. We remain JPY and USD bulls, and bearish on AxJ FX.
The Burden of Proof: Growth is weak. We think this is widely known. The more relevant question is whether the burden of proof lies with the bulls to prove that this is already in the price, or with the bears to prove that it isn’t. We think the answer favors Credit, but also discuss how the ‘burden of proof’ affects the best ways to play offense and defense.
Global Equities – More Cautious: We lower our 12-month price targets and see a negative bull/bear return skew across markets. We like US equities most, Europe and EM equities least, and focus on reasonably priced ways to find ‘quality’ across regions.
Global FX – USD Run Not Over: The USD bull run is not over, while we are increasingly concerned that the EUR will be pulled lower by European political risk over the summer. We avoid AxJ FX, see further downside in commodity FX, and remain bullish on the JPY.
Global Rates – Summer Bulls: Lower growth and fewer expected Fed hikes lead us to materially lower our yield forecasts. The best risk/reward lies in Treasuries, the worst is in EU Sovereigns.
EM Fixed Income – Hunt for Alpha: The sell-off has created a better landscape for relative value. We continue to prefer Credit over Local Rates over FX, and forecast 6.6% total return for EM Sovereigns.
Global Credit – Preferred Beta: Credit is best positioned to deliver reasonable risk-adjusted returns in a slow growth backdrop. Carry drives returns even as higher defaults eat into HY returns. US IG is our preferred form of beta.
Global Securitized Credit – Mixed Prospects: Tighter financial conditions and fundamental challenges impact performance. CLO AAAs offer defensive carry but CMBS faces headwinds without the valuation cushion of IG corporates.
Global Volatility – Finding Value: We like buying equity and rates volatility after recent drop to hedge our cautious macro forecast. EUR and JPY vols are best to buy, but EM FX vols will be hard to monetize.
M O R G A N S T A N L E Y R E S E A R C H G L O B A L S T R A T E G Y T E A M
Morgan Stanley & Co. LLC Matthew Hornbach Gordian Kemen Adam S. Parker Vishwanath Tirupattur Adam Richmond
Morgan Stanley & Co. International plc+ Hans Redeker Graham Secker Andrew Sheets
Morgan Stanley Asia Limited+ Jonathan Garner
MS Cross Asset Allocations
Note: For a 6-12m view. See Page 27 for Details. Note: Adam Parker, Graham Secker and Jonathan Garner are Equity Analysts and they are not opining on fixed income securities. Their views are clearly delineated. Due to the nature of the fixed income market, the issuers or bonds of the issuers recommended or discussed in this report may not be continuously followed. Accordingly, investors must regard this report as providing stand-alone analysis and should not expect continuing analysis or additional reports relating to such issuers or bonds of the issuers.
Global Asset Allocation – +EquitiesCreditGovernment BondsCash
Within these asset classes, our relative allocations:
Equities – +USEuropeJapanEM
Credit – +USEuropeEMSecuritized
Government Bonds – +TreasuriesBundsJGBsEM Local
FX – +USDEURJPYEM
CurrentPrevious

M O R G A N S T A N L E Y R E S E A R C H
2
March 13, 2016 Spring Global Strategy Outlook
Table of Contents Cross-Asset Strategy: Burden of Proof .................................................................................................................................................3 Global Equities: Sell the Recent Rally ...................................................................................................................................................8 Global Government Bonds: Year of the Bull ....................................................................................................................................... 12 Global FX: The Bullish JPY, USD and CHF Trio ................................................................................................................................. 14 Global EM Fixed Income: The Case For Alpha ................................................................................................................................... 16 Global Credit: Springing Back to Life................................................................................................................................................... 18 Global Securitized Products: Tighter, Lower and Wider ...................................................................................................................... 20 Crude Oil: Low and Range-bound Through Mid-17 ............................................................................................................................. 22 Global Volatility: Value in Vol .............................................................................................................................................................. 24 What We Debated ............................................................................................................................................................................... 25 Asset Allocation for 2015 ..................................................................................................................................................................... 26 Morgan Stanley Key Economic Forecasts ........................................................................................................................................... 29 Morgan Stanley Global Currency Forecasts ........................................................................................................................................ 30 Morgan Stanley Government Bond Yield / Spread Forecasts ............................................................................................................. 31
What’s Changed?
What's Changed - Economics
2016e 2017e 2016e 2017e 2016e 2017eGDPG10 1.8 1.8 1.5 1.6 -0.3 -0.2 US 1.9 1.8 1.7 1.6 -0.2 -0.2 Euro Area 1.8 1.8 1.5 1.8 -0.3 0.0 Japan 1.2 0.8 0.6 0.5 -0.6 -0.3 UK 2.0 2.3 1.7 2.3 -0.3 0.0EM (%Y) 4.4 5.0 4.0 4.7 -0.4 -0.3 China 6.7 6.6 6.5 6.4 -0.2 -0.2 India 7.9 8.0 7.5 7.7 -0.4 -0.3 Brazil -3.0 1.2 -4.3 0.6 -1.3 -0.6 Russia -0.8 1.7 -2.1 0.9 -1.3 -0.8
CPI (%Y)G10 1.5 2.1 0.8 1.9 -0.7 -0.2 US 1.7 2.3 1.2 1.9 -0.5 -0.4 Euro Area 1.3 1.8 0.2 1.7 -1.1 -0.1 Japan 1.0 2.5 -0.2 2.0 -1.2 -0.5 UK 1.3 1.5 0.8 1.7 -0.5 0.2EM 3.7 3.2 3.8 3.4 0.1 0.2 China 1.1 1.1 1.1 1.1 0.0 0.0 India 4.9 4.5 5.0 4.5 0.1 0.0 Brazil 8.2 6.0 9.2 7.2 1.0 1.2 Russia 7.8 6.4 8.9 7.3 1.1 0.9
Monetary Policy Rate (% p.a.)G10 0.6 1.1 0.2 0.4 -0.4 -0.7 US 1.1 2.1 0.6 1.1 -0.5 -1.0 Euro Area 0.1 0.1 -0.5 -0.5 -0.6 -0.6 Japan 0.1 0.1 -0.3 -0.3 -0.4 -0.4 UK 1.0 1.5 0.5 1.0 -0.5 -0.5EM 5.4 5.3 5.4 5.2 0.0 -0.1 China 3.9 3.9 4.1 3.9 0.3 0.0 India 6.5 6.8 6.5 6.8 0.0 0.0 Brazil 15.3 13.3 14.3 13.3 -1.0 0.0 Russia 8.0 6.5 10.0 7.5 2.0 1.0
OLD FORECASTS NEW FORECASTS Change from Last ForecastWhat's Changed - AssetsBase Case Forecasts OLD NEW Δ
Q4 2016 Q1 2017EquitiesS&P 500 2,175 2,050 -6%MSCI Europe 1,500 1,300 -13%Topix 1,640 1,400 -15%MSCI EM 850 735 -14%FXUSD/JPY 115.0 108.0 -6%EUR/USD 1.00 0.98 -2%GBP/USD 1.40 1.30 -7%AUD/USD 0.62 0.62 0%USD/INR 70.0 73.0 4%USD/ZAR 18.8 18.0 -4%USD/BRL 4.45 4.20 -6%Rates (% percent) (bp Δ)
UST 10yr 2.70 1.85 -85DBR 10yr 1.20 0.60 -60UKT 10yr 2.60 1.70 -90JGB 10yr 0.85 -0.18 -103Credit (bps) (bp Δ)
US IG 175 168 -7US HY 582 668 86EUR IG 115 130 15EUR HY 510 475 -35Italy 10yr 100 125 25EM Sovs 400 480 80US CMBS 135 160 25Agency MBS 27 17 -10CommoditiesBrent 29 30 3%

M O R G A N S T A N L E Y R E S E A R C H
3
March 13, 2016 Spring Global Strategy Outlook
Cross-Asset Strategy: Burden of Proof Andrew Sheets
Key Investment Ideas • Growth remains weak and the probability of a global
recession has risen. The challenge is that these concerns are not entirely unexpected by the markets. In many cases, the more defensive an asset is today, the richer it tends to be.
• US and EM Credit are pricing in a worse environment than what we forecast. We are less confident this is the case for stocks. We see the JPY and UST-DBR spread as two of the few reasonably-priced defensive strategies available.
• Relative to current market pricing, we see worsening risk-reward in Europe. We lower European Equities, moderate allocation to European Credit post the ECB rally, and see poor risk-reward in peripheral sovereigns, GBP and EUR.
Our global growth outlook is weak and skewed to the downside. The challenge is that this outcome does not feel entirely unexpected. Global equity markets are down -12% since the summer. G3 interest rates and inflation expectations are near historical lows. Investor cash balances remain high. Across many different investments, the more defensive something is, the richer it trades relative to history.
The question, therefore, shifts to where the burden of proof lies. Is the onus on the bears to prove that, after a correction, this isn’t just another post-crisis growth scare? Or has it shifted to the bulls to show that after the recent bounce, further upside is possible even under a restrained macro backdrop?
We think the answer depends on where you look. In areas like US Corporate and EM Sovereign Credit, we think valuations discount a growth environment worse than our below-consensus forecasts. In areas like Global Equities, AxJ FX, and US Equity and Rates volatility, we are less sure. On balance, this leads us to reduce risk. We close our positive tactical stance (see Oversold, February 15, 2015) and reduce weights in Global Equities (-3%), moderate EU Credit (-1%), and add to US Treasuries (+2%), JGBs (+1%) and cash (+1%).
If we went solely by our new price targets (see page 2), we should reduce exposure even more, moving underweight equities and overweight bonds. We are not making this shift because the two other elements of our framework, long-run risk premiums and our cycle models, tell us not to. But we are on watch. In such a backdrop, it is imperative to ask both “where
can I still find reasonably-priced defense?” and “where is the most optionality to the upside?” We address both.
The Macro Challenges
Let’s start with the macroeconomic challenges, before moving to the question of whether they are in the price. There are a multitude of issues confronting the market. More detailed discussions can be found in the accompanying Spring Economic Outlook, but here is a quick summary.
Effectiveness of central bank policy – Central banks hold a declining number of less effective policy tools. Their latest foray, negative rates, may do more harm than good. How bad is it if central banks are powerless to boost the economy?
Well, it clearly isn’t good. But it also isn’t as “unprecedented” (and therefore bad) as often portrayed. Prior to 2010, central bank easing was usually unable to stop market declines (2002, 2008). And this makes sense; policy can’t change the course of the underlying economy, it can only nudge it one way or the other.
The lack of additional policy tools is one reason there is more downside to our equity bear cases than in ’13 or ’14. The good news is that (a) we think this keeps conventional G3 policy extremely accommodative, with just one Fed hike in ’16, and (b) this lack of additional policy tools won’t matter if data continues to stabilize. Good (data) is good.
Exhibit 1 We Forecast Growth to Fall Short of Expectations
Source: Morgan Stanley Research forecasts, Bloomberg
Growth – Given the lack of policy tools, we think growth will matter more for markets than central banks. And our growth forecasts are not inspiring. Our economists are below consensus on global, EM and DM growth and have raised their probability of a global recession within the next 12 months to 30%. This is a major reason many of our price targets have come down, although as we will discuss shortly, some appear to discount weaker growth than others.
Real GDP (%Q SAAR)2015 2016e 2017e
MS Forecast 2.4 1.7 1.6Consensus 2.4 2.1 2.3
MS Forecast 1.5 1.5 1.8Consensus 1.5 1.6 1.6
MS Forecast 0.5 0.6 0.5Consensus 0.6 0.7 0.6
MS Forecast 2.2 1.7 2.3Consensus 2.2 2.1 2.2
US
Euro Area
Japan
UK
– +EquitiesCreditGovernment BondsCash
M O R G A N S T A N L E Y R E S E A R C H
4
March 13, 2016 Spring Global Strategy Outlook
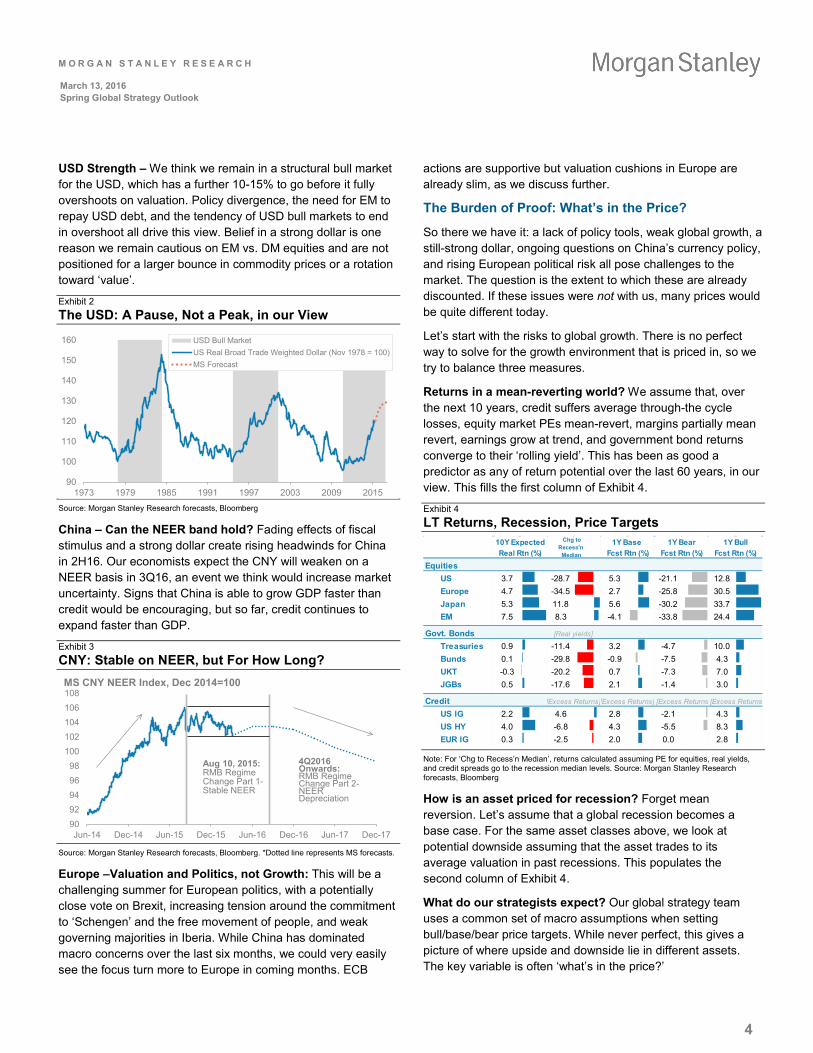
USD Strength – We think we remain in a structural bull market for the USD, which has a further 10-15% to go before it fully overshoots on valuation. Policy divergence, the need for EM to repay USD debt, and the tendency of USD bull markets to end in overshoot all drive this view. Belief in a strong dollar is one reason we remain cautious on EM vs. DM equities and are not positioned for a larger bounce in commodity prices or a rotation toward ‘value’.
Exhibit 2 The USD: A Pause, Not a Peak, in our View
Source: Morgan Stanley Research forecasts, Bloomberg
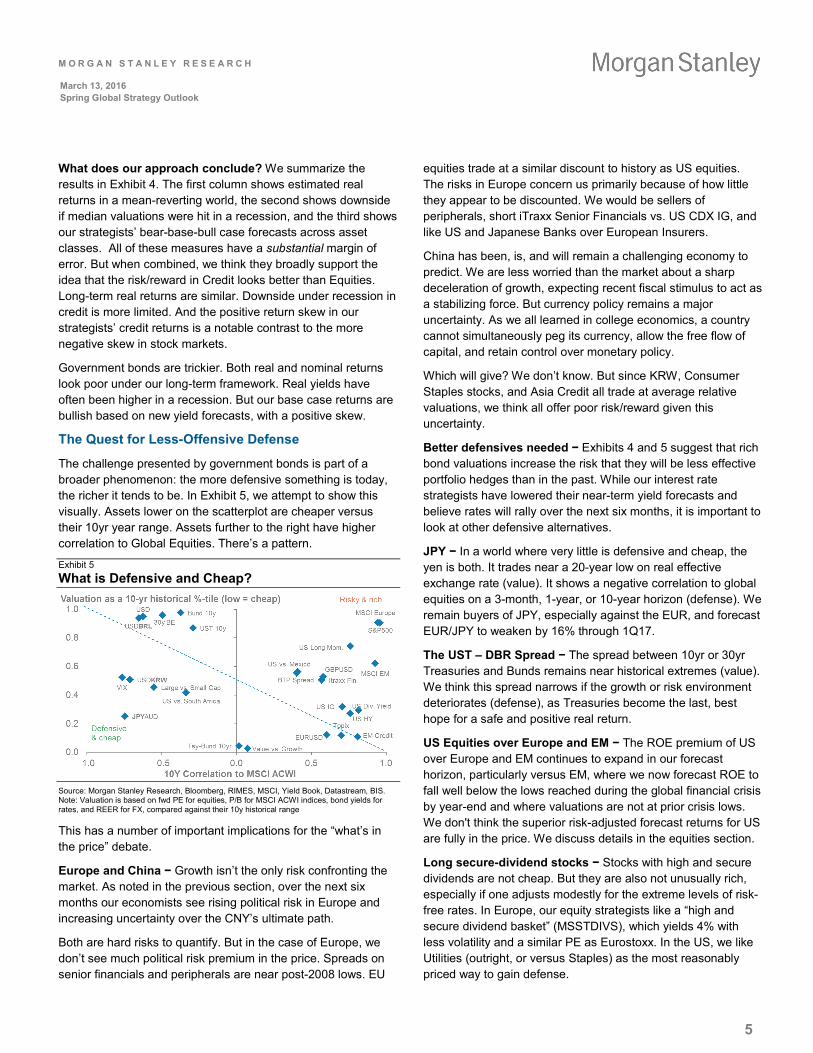
China – Can the NEER band hold? Fading effects of fiscal stimulus and a strong dollar create rising headwinds for China in 2H16. Our economists expect the CNY will weaken on a NEER basis in 3Q16, an event we think would increase market uncertainty. Signs that China is able to grow GDP faster than credit would be encouraging, but so far, credit continues to expand faster than GDP.
Exhibit 3 CNY: Stable on NEER, but For How Long?
Source: Morgan Stanley Research forecasts, Bloomberg. *Dotted line represents MS forecasts.
Europe –Valuation and Politics, not Growth: This will be a challenging summer for European politics, with a potentially close vote on Brexit, increasing tension around the commitment to ‘Schengen’ and the free movement of people, and weak governing majorities in Iberia. While China has dominated macro concerns over the last six months, we could very easily see the focus turn more to Europe in coming months. ECB
actions are supportive but valuation cushions in Europe are already slim, as we discuss further.
The Burden of Proof: What’s in the Price?
So there we have it: a lack of policy tools, weak global growth, a still-strong dollar, ongoing questions on China’s currency policy, and rising European political risk all pose challenges to the market. The question is the extent to which these are already discounted. If these issues were not with us, many prices would be quite different today.
Let’s start with the risks to global growth. There is no perfect way to solve for the growth environment that is priced in, so we try to balance three measures.
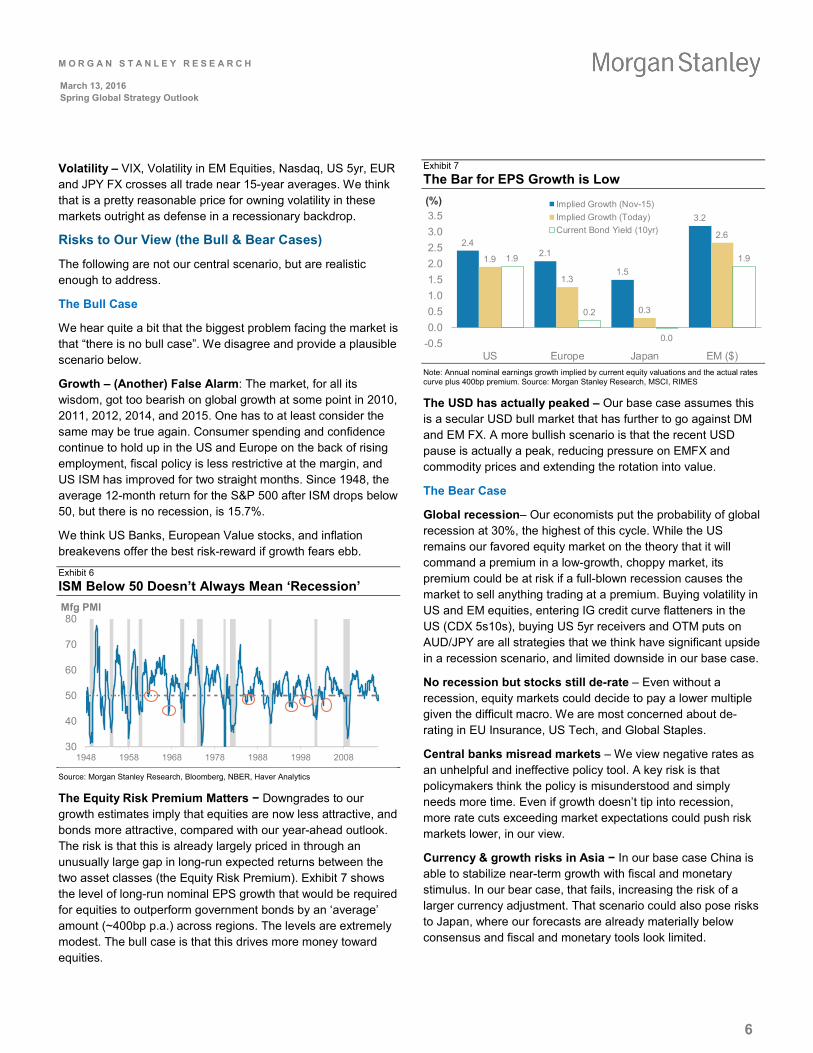
Returns in a mean-reverting world? We assume that, over the next 10 years, credit suffers average through-the cycle losses, equity market PEs mean-revert, margins partially mean revert, earnings grow at trend, and government bond returns converge to their ‘rolling yield’. This has been as good a predictor as any of return potential over the last 60 years, in our view. This fills the first column of Exhibit 4.
Exhibit 4 LT Returns, Recession, Price Targets
Note: For ‘Chg to Recess’n Median’, returns calculated assuming PE for equities, real yields, and credit spreads go to the recession median levels. Source: Morgan Stanley Research forecasts, Bloomberg
How is an asset priced for recession? Forget mean reversion. Let’s assume that a global recession becomes a base case. For the same asset classes above, we look at potential downside assuming that the asset trades to its average valuation in past recessions. This populates the second column of Exhibit 4.
What do our strategists expect? Our global strategy team uses a common set of macro assumptions when setting bull/base/bear price targets. While never perfect, this gives a picture of where upside and downside lie in different assets. The key variable is often ‘what’s in the price?’
90
100
110
120
130
140
150
160
1973 1979 1985 1991 1997 2003 2009 2015
USD Bull MarketUS Real Broad Trade Weighted Dollar (Nov 1978 = 100)MS Forecast
9092949698
100102104106108
Jun-14 Dec-14 Jun-15 Dec-15 Jun-16 Dec-16 Jun-17 Dec-17
MS CNY NEER Index, Dec 2014=100
Aug 10, 2015: RMB RegimeChange Part 1-Stable NEER
4Q2016Onwards: RMB RegimeChange Part 2-NEER Depreciation
EquitiesUS 3.7 -28.7 5.3 -21.1 12.8Europe 4.7 -34.5 2.7 -25.8 30.5Japan 5.3 11.8 5.6 -30.2 33.7EM 7.5 8.3 -4.1 -33.8 24.4
Govt. BondsTreasuries 0.9 -11.4 3.2 -4.7 10.0Bunds 0.1 -29.8 -0.9 -7.5 4.3UKT -0.3 -20.2 0.7 -7.3 7.0JGBs 0.5 -17.6 2.1 -1.4 3.0
Credit [Excess Returns][Excess Returns]
US IG 2.2 4.6 2.8 -2.1 4.3US HY 4.0 -6.8 4.3 -5.5 8.3EUR IG 0.3 -2.5 2.0 0.0 2.8
1Y BullFcst Rtn (%)
1Y BearFcst Rtn (%)
[Excess Returns]
[Real yields]
[Excess Returns]
10Y ExpectedReal Rtn (%)
1Y Base Fcst Rtn (%)
Chg to Recess'n Median
M O R G A N S T A N L E Y R E S E A R C H
5
March 13, 2016 Spring Global Strategy Outlook
What does our approach conclude? We summarize the results in Exhibit 4. The first column shows estimated real returns in a mean-reverting world, the second shows downside if median valuations were hit in a recession, and the third shows our strategists’ bear-base-bull case forecasts across asset classes. All of these measures have a substantial margin of error. But when combined, we think they broadly support the idea that the risk/reward in Credit looks better than Equities. Long-term real returns are similar. Downside under recession in credit is more limited. And the positive return skew in our strategists’ credit returns is a notable contrast to the more negative skew in stock markets.
Government bonds are trickier. Both real and nominal returns look poor under our long-term framework. Real yields have often been higher in a recession. But our base case returns are bullish based on new yield forecasts, with a positive skew.
The Quest for Less-Offensive Defense
The challenge presented by government bonds is part of a broader phenomenon: the more defensive something is today, the richer it tends to be. In Exhibit 5, we attempt to show this visually. Assets lower on the scatterplot are cheaper versus their 10yr year range. Assets further to the right have higher correlation to Global Equities. There’s a pattern.
Exhibit 5 What is Defensive and Cheap?
Source: Morgan Stanley Research, Bloomberg, RIMES, MSCI, Yield Book, Datastream, BIS. Note: Valuation is based on fwd PE for equities, P/B for MSCI ACWI indices, bond yields for rates, and REER for FX, compared against their 10y historical range
This has a number of important implications for the “what’s in the price” debate.
Europe and China − Growth isn’t the only risk confronting the market. As noted in the previous section, over the next six months our economists see rising political risk in Europe and increasing uncertainty over the CNY’s ultimate path.
Both are hard risks to quantify. But in the case of Europe, we don’t see much political risk premium in the price. Spreads on senior financials and peripherals are near post-2008 lows. EU
equities trade at a similar discount to history as US equities. The risks in Europe concern us primarily because of how little they appear to be discounted. We would be sellers of peripherals, short iTraxx Senior Financials vs. US CDX IG, and like US and Japanese Banks over European Insurers.
China has been, is, and will remain a challenging economy to predict. We are less worried than the market about a sharp deceleration of growth, expecting recent fiscal stimulus to act as a stabilizing force. But currency policy remains a major uncertainty. As we all learned in college economics, a country cannot simultaneously peg its currency, allow the free flow of capital, and retain control over monetary policy.
Which will give? We don’t know. But since KRW, Consumer Staples stocks, and Asia Credit all trade at average relative valuations, we think all offer poor risk/reward given this uncertainty.
Better defensives needed − Exhibits 4 and 5 suggest that rich bond valuations increase the risk that they will be less effective portfolio hedges than in the past. While our interest rate strategists have lowered their near-term yield forecasts and believe rates will rally over the next six months, it is important to look at other defensive alternatives.
JPY − In a world where very little is defensive and cheap, the yen is both. It trades near a 20-year low on real effective exchange rate (value). It shows a negative correlation to global equities on a 3-month, 1-year, or 10-year horizon (defense). We remain buyers of JPY, especially against the EUR, and forecast EUR/JPY to weaken by 16% through 1Q17.
The UST – DBR Spread − The spread between 10yr or 30yr Treasuries and Bunds remains near historical extremes (value). We think this spread narrows if the growth or risk environment deteriorates (defense), as Treasuries become the last, best hope for a safe and positive real return.
US Equities over Europe and EM − The ROE premium of US over Europe and EM continues to expand in our forecast horizon, particularly versus EM, where we now forecast ROE to fall well below the lows reached during the global financial crisis by year-end and where valuations are not at prior crisis lows. We don't think the superior risk-adjusted forecast returns for US are fully in the price. We discuss details in the equities section.
Long secure-dividend stocks − Stocks with high and secure dividends are not cheap. But they are also not unusually rich, especially if one adjusts modestly for the extreme levels of risk-free rates. In Europe, our equity strategists like a “high and secure dividend basket” (MSSTDIVS), which yields 4% with less volatility and a similar PE as Eurostoxx. In the US, we like Utilities (outright, or versus Staples) as the most reasonably priced way to gain defense.
M O R G A N S T A N L E Y R E S E A R C H
6
March 13, 2016 Spring Global Strategy Outlook
Volatility – VIX, Volatility in EM Equities, Nasdaq, US 5yr, EUR and JPY FX crosses all trade near 15-year averages. We think that is a pretty reasonable price for owning volatility in these markets outright as defense in a recessionary backdrop.
Risks to Our View (the Bull & Bear Cases)
The following are not our central scenario, but are realistic enough to address.
The Bull Case
We hear quite a bit that the biggest problem facing the market is that “there is no bull case”. We disagree and provide a plausible scenario below.
Growth – (Another) False Alarm: The market, for all its wisdom, got too bearish on global growth at some point in 2010, 2011, 2012, 2014, and 2015. One has to at least consider the same may be true again. Consumer spending and confidence continue to hold up in the US and Europe on the back of rising employment, fiscal policy is less restrictive at the margin, and US ISM has improved for two straight months. Since 1948, the average 12-month return for the S&P 500 after ISM drops below 50, but there is no recession, is 15.7%.
We think US Banks, European Value stocks, and inflation breakevens offer the best risk-reward if growth fears ebb.
Exhibit 6 ISM Below 50 Doesn’t Always Mean ‘Recession’
Source: Morgan Stanley Research, Bloomberg, NBER, Haver Analytics
The Equity Risk Premium Matters − Downgrades to our growth estimates imply that equities are now less attractive, and bonds more attractive, compared with our year-ahead outlook. The risk is that this is already largely priced in through an unusually large gap in long-run expected returns between the two asset classes (the Equity Risk Premium). Exhibit 7 shows the level of long-run nominal EPS growth that would be required for equities to outperform government bonds by an ‘average’ amount (~400bp p.a.) across regions. The levels are extremely modest. The bull case is that this drives more money toward equities.
Exhibit 7 The Bar for EPS Growth is Low
Note: Annual nominal earnings growth implied by current equity valuations and the actual rates curve plus 400bp premium. Source: Morgan Stanley Research, MSCI, RIMES
The USD has actually peaked – Our base case assumes this is a secular USD bull market that has further to go against DM and EM FX. A more bullish scenario is that the recent USD pause is actually a peak, reducing pressure on EMFX and commodity prices and extending the rotation into value.
The Bear Case
Global recession– Our economists put the probability of global recession at 30%, the highest of this cycle. While the US remains our favored equity market on the theory that it will command a premium in a low-growth, choppy market, its premium could be at risk if a full-blown recession causes the market to sell anything trading at a premium. Buying volatility in US and EM equities, entering IG credit curve flatteners in the US (CDX 5s10s), buying US 5yr receivers and OTM puts on AUD/JPY are all strategies that we think have significant upside in a recession scenario, and limited downside in our base case.
No recession but stocks still de-rate – Even without a recession, equity markets could decide to pay a lower multiple given the difficult macro. We are most concerned about de-rating in EU Insurance, US Tech, and Global Staples.
Central banks misread markets – We view negative rates as an unhelpful and ineffective policy tool. A key risk is that policymakers think the policy is misunderstood and simply needs more time. Even if growth doesn’t tip into recession, more rate cuts exceeding market expectations could push risk markets lower, in our view.
Currency & growth risks in Asia − In our base case China is able to stabilize near-term growth with fiscal and monetary stimulus. In our bear case, that fails, increasing the risk of a larger currency adjustment. That scenario could also pose risks to Japan, where our forecasts are already materially below consensus and fiscal and monetary tools look limited.
0.2
0.3
0.4
0.5
0.6
0.7
0.8
0.9
30
40
50
60
70
80
1948 1958 1968 1978 1988 1998 2008
Mfg PMI
2.42.1
1.5
3.2
1.9
1.3
0.3
2.6
1.9
0.2
0.0
1.9
-0.50.00.51.01.52.02.53.03.5
US Europe Japan EM ($)
(%) Implied Growth (Nov-15)Implied Growth (Today)Current Bond Yield (10yr)
M O R G A N S T A N L E Y R E S E A R C H
7
March 13, 2016 Spring Global Strategy Outlook
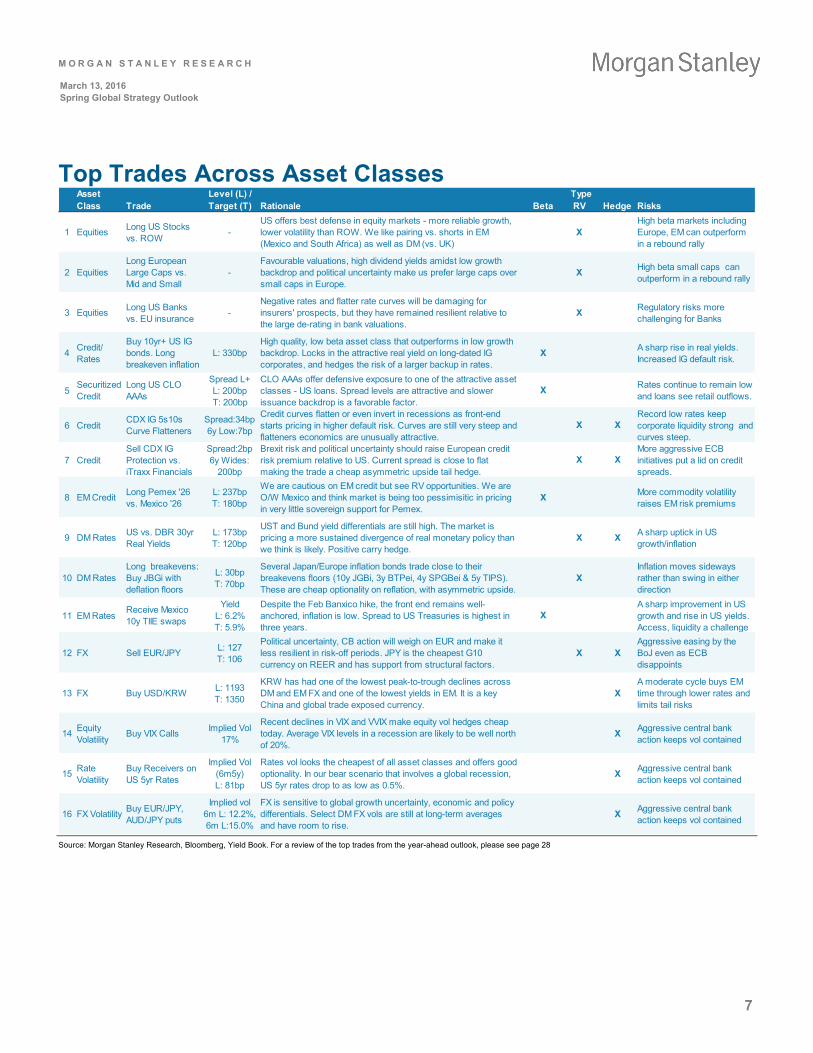
Top Trades Across Asset Classes
Source: Morgan Stanley Research, Bloomberg, Yield Book. For a review of the top trades from the year-ahead outlook, please see page 28
Level (L) /Trade Target (T) Rationale Beta RV Hedge Risks
1 Equities Long US Stocks vs. ROW
-US offers best defense in equity markets - more reliable growth, lower volatility than ROW. We like pairing vs. shorts in EM (Mexico and South Africa) as well as DM (vs. UK)
XHigh beta markets including Europe, EM can outperform in a rebound rally
2 EquitiesLong European Large Caps vs. Mid and Small
-Favourable valuations, high dividend yields amidst low growth backdrop and political uncertainty make us prefer large caps over small caps in Europe.
X High beta small caps can outperform in a rebound rally
3 Equities Long US Banks vs. EU insurance
-Negative rates and flatter rate curves will be damaging for insurers' prospects, but they have remained resilient relative to the large de-rating in bank valuations.
X Regulatory risks more challenging for Banks
4 Credit/ Rates
Buy 10yr+ US IG bonds. Long breakeven inflation
L: 330bp High quality, low beta asset class that outperforms in low growth backdrop. Locks in the attractive real yield on long-dated IG corporates, and hedges the risk of a larger backup in rates.
X A sharp rise in real yields. Increased IG default risk.
5Securitized Credit
Long US CLO AAAs
Spread L+ L: 200bp T: 200bp
CLO AAAs offer defensive exposure to one of the attractive asset classes - US loans. Spread levels are attractive and slower issuance backdrop is a favorable factor.
X Rates continue to remain low and loans see retail outflows.
6 CreditCDX IG 5s10s Curve Flatteners
Spread:34bp 6y Low:7bp
Credit curves flatten or even invert in recessions as front-end starts pricing in higher default risk. Curves are still very steep and flatteners economics are unusually attractive.
X XRecord low rates keep corporate liquidity strong and curves steep.
7 CreditSell CDX IG Protection vs. iTraxx Financials
Spread:2bp 6y Wides:
200bp
Brexit risk and political uncertainty should raise European credit risk premium relative to US. Current spread is close to flat making the trade a cheap asymmetric upside tail hedge.
X XMore aggressive ECB initiatives put a lid on credit spreads.
8 EM Credit Long Pemex '26 vs. Mexico '26
L: 237bp T: 180bp
We are cautious on EM credit but see RV opportunities. We are O/W Mexico and think market is being too pessimisitic in pricing in very little sovereign support for Pemex.
X More commodity volatility raises EM risk premiums
9 DM Rates US vs. DBR 30yr Real Yields
L: 173bp T: 120bp
UST and Bund yield differentials are still high. The market is pricing a more sustained divergence of real monetary policy than we think is likely. Positive carry hedge.
X X A sharp uptick in US growth/inflation
10 DM RatesLong breakevens: Buy JBGi with deflation floors
L: 30bp T: 70bp
Several Japan/Europe inflation bonds trade close to their breakevens floors (10y JGBi, 3y BTPei, 4y SPGBei & 5y TIPS). These are cheap optionality on reflation, with asymmetric upside.
XInflation moves sideways rather than swing in either direction
11 EM RatesReceive Mexico 10y TIIE swaps
Yield L: 6.2% T: 5.9%
Despite the Feb Banxico hike, the front end remains well-anchored, inflation is low. Spread to US Treasuries is highest in three years.
XA sharp improvement in US growth and rise in US yields. Access, liquidity a challenge
12 FX Sell EUR/JPY L: 127 T: 106
Political uncertainty, CB action will weigh on EUR and make it less resilient in risk-off periods. JPY is the cheapest G10 currency on REER and has support from structural factors.
X XAggressive easing by the BoJ even as ECB disappoints
13 FX Buy USD/KRW L: 1193 T: 1350
KRW has had one of the lowest peak-to-trough declines across DM and EM FX and one of the lowest yields in EM. It is a key China and global trade exposed currency.
XA moderate cycle buys EM time through lower rates and limits tail risks
14 Equity Volatility
Buy VIX Calls Implied Vol 17%
Recent declines in VIX and VVIX make equity vol hedges cheap today. Average VIX levels in a recession are likely to be well north of 20%.
X Aggressive central bank action keeps vol contained
15 Rate Volatility
Buy Receivers on US 5yr Rates
Implied Vol (6m5y) L: 81bp
Rates vol looks the cheapest of all asset classes and offers good optionality. In our bear scenario that involves a global recession, US 5yr rates drop to as low as 0.5%.
X Aggressive central bank action keeps vol contained
16 FX Volatility Buy EUR/JPY, AUD/JPY puts
Implied vol 6m L: 12.2%, 6m L:15.0%
FX is sensitive to global growth uncertainty, economic and policy differentials. Select DM FX vols are still at long-term averages and have room to rise.
X Aggressive central bank action keeps vol contained
Asset Class
Type

M O R G A N S T A N L E Y R E S E A R C H
8
March 13, 2016 Spring Global Strategy Outlook
Global Equities: Sell the Recent Rally Jonathan Garner Asia/ GEMs Adam S. Parker, Ph.D. United States Graham Secker Europe
The bottom line is that we are sellers of the recent rally, which has seen MSCI ACWI rise 9% since the trough on 11th February, reversing 80% of the losses year to date. Our new 12-month forward base, bull and bear case target prices are given in Exhibit 1 together with our prior forecasts. We see downside to the base case in EM and only very limited upside in the US, Japan and Europe.
Exhibit 1 Revised and Previous Bull, Base and Bear Targets for Major Regions
Source: MSCI, Rimes, Bloomberg, Morgan Stanley Research forecasts. Data as of March 10, 2016
Revisions to our house macro view are unequivocally negative versus the scenarios for 2016 and 2017 published in our prior year-ahead update in late November. Most notably, our base case forecast for 3.0% global GDP growth in 2016 is
below that in 2015, and we also look for a more muted recovery to 3.4% in 2017. Our FX team continues to expect the US dollar to strengthen and is today revising its yen forecast to expect a near-term acceleration of the recent trend to yen appreciation. Our commodities teams do not expect a sustained recovery in oil and base metals, and our rates team expects yields to move lower in the short to medium term.
Factoring in this macro view, recent trends in earnings announcements, and the other components of our earnings models, we anticipate that earnings will decline yoy in 2016 versus 2015 in EM, Europe and Japan, rising only modestly in the US (see Exhibit 3).
We are significantly below bottom-up consensus on earnings cumulatively to end 2017 in all four major regions: by 6% for the US, 8% for Europe, 16% for Japan, and 19% for EM. We are marginally above consensus for US earnings in 2016 but below consensus elsewhere. Only in the US do we see ROE stabilizing through the end of 2016. Elsewhere we expect further declines, although some improvement is likely as we head into 2017.
Exhibit 2 Trailing ROE for Major Regions with MS forecasts for 2016 and 2017 – No Inflexion Point in Sight Near term
Source: MSCI, Rimes, Morgan Stanley Research. Data as of March 9, 2016
In terms of our multiple assumptions, we have brought our 12m forward PE target down from 16.5x to 16.0x for the S&P 500, from 15.0x to 14.0x for Europe, and from 14.4x to 14.0x for Japan. We have left our base case multiple target unchanged for EM at 11.6x. The start of the Fed hike cycle has coincided with a reduction in consensus forward PE multiples globally, as we discussed in our year-ahead piece. But this has occurred to a greater extent than we anticipated in DM equities, particularly in Japan. We note that the current forward PE multiple on consensus estimates is somewhat
Bear Base Bull Bear Base Bull1525 2050 2200 1600 2175 2425
-23.4% 3.0% 10.6% -19.6% 9.3% 21.9%925 1,300 1,665 1100 1500 1720
-29.7% -1.2% 26.6% -16.4% 14.0% 30.8%915 1400 1780 1230 1640 1880
-32.3% 3.6% 31.6% -9.0% 21.3% 39.0%500 735 960 590 850 980
-36.7% -7.1% 21.4% -25.4% 7.5% 23.9%
MSCI Europe 1315
TOPIX 1352
MSCI EM 791
Index Current Price
New Target Price Old Target Price
S&P 500 1990-5%
0%
5%
10%
15%
20%
25%
1996 2001 2006 2011 2016
Trailing ROE for Major Regions TOPIXMSCI EMMSCI APxJMSCI EuropeS&P 500
MS Forecasts
Key Investment Ideas • We are sellers of the recent rally. There is downside to
our 12m forward Base Case Target Prices for EM (-7%) and Europe (-1%), and only modest upside for the US (+3%) and Japan (+4%).
• Earnings will likely decline yoy in 2016 versus 2015 in EM (-7%), Europe (-4%) and Japan (-6%), rising only in the US (+4%). We are significantly below consensus earnings estimates for 2017 in all regions (more so in EM and Japan than in Europe and US).
• Most preferred to least preferred: US (1), Japan (2), Europe (3) & EM (4) on our risk-adjusted returns forecast.
• We favour high FCF yield and dividend yield names globally and identify where our sector and style preferences differ between regions.
Equities – +USEuropeJapanAPxJEM

M O R G A N S T A N L E Y R E S E A R C H
9
March 13, 2016 Spring Global Strategy Outlook
below our new base case assumptions in EM and Japan, broadly in line for the SPX, and somewhat above for Europe.
Our bear case target prices are materially lower than before, reflecting our economics team’s revised bear case scenario (20% probability) of a two-year slump in global economic activity through both 2016 and 2017, and hence a more material decline in earnings in the bear case than envisaged previously. Our bull case target prices are reduced to a lesser degree.
Exhibit 3 MS Top-down EPS Estimates and Bull, Bear and Base Case PE Targets versus Consensus
Source: MSCI, Rimes, Morgan Stanley Research forecasts
Contextualising the current earnings recession
Equities globally are now in an earnings recession, which in our base case continues almost everywhere except the US, where we forecast a modest recovery. In aggregate, MSCI ACWI earnings peaked in US$ terms in August 2014 and have since declined by 11%, whilst in local currency terms earnings peaked in February 2015 and have since declined by 6%. Exhibit 4 contextualises the current earnings recession versus the 6 prior such earnings recessions in MSCI World since 1970 and 3 prior episodes in EM since 1995. The current earnings recession is already the longest in the history of EM at 27 months, although its depth thus far is on par with the relatively mild 2001/02 experience. Our forecast is that it continues over at least the next 12 months. For DM, the earnings recession is also relatively shallow thus far – and not particularly long lived at just 13 months’ duration.
Exhibit 4 Historical Precedents of MSCI World and MSCI EM Earnings Recessions (Local Currency Terms)
Source: MSCI, Rimes, Morgan Stanley Research. Data as of March 9, 2016
What’s in the Price?
We do not view current global equity valuations as particularly cheap to history or priced attractively in relation to our base or bear case outlooks. For MSCI ACWI, valuations across a range of metrics are in line to marginally above long-run average levels since 1988 (see Exhibit 5). On a consensus forward PE basis for all four major regions, valuations are well above 5-year average levels, although that period does include the lengthy Eurozone sovereign crisis.
Exhibit 5 MSCI AC World – Absolute Valuations vs History for the Market and the Median stock – Slightly Above the Long-term Average on Most Metrics
Source: MSCI, IBES, FactSet, Worldscope, Morgan Stanley Research. *Note: All data used starts from Jan-1988. Data as of March 9, 2016
2015 2016 2017 Mar-18 2016 2017
118.5 122.7 127.1 128.1 119.0 134.9-0.7% 3.6% 3.6% 4.0% 2.0% 13.4%86.8 82.9 90.9 92.7 88.6 99.9
-4.5% -4.5% 9.6% 9.3% 3.9% 12.8%91.8 86.4 96.3 100.4 103.6 113.45.9% -5.9% 11.5% 19.4% 12.4% 9.5%58.4 54.4 61.3 63.3 65.1 75.0
-18.9% -6.8% 12.7% 12.8% 6.4% 15.2%118.5 125.1 132.1 133.1 119.0 134.9-0.7% 5.6% 5.6% 6.0% 2.0% 13.4%87.2 91.4 107.5 110.5 88.6 99.9
-4.0% 4.7% 17.7% 12.9% 3.9% 12.8%91.8 103.5 121.0 125.7 103.6 113.45.9% 12.7% 16.9% 17.6% 12.4% 9.5%58.4 65.8 77.3 79.9 65.1 75.0
-18.9% 12.7% 17.5% 16.3% 6.4% 15.2%118.5 110.6 105.5 104.9 119.0 134.9-0.7% -6.6% -4.6% -5.0% 2.0% 13.4%86.3 74.5 69.8 71.9 88.6 99.9
-5.0% -13.7% -6.3% -2.0% 3.9% 12.8%91.8 80.2 71.8 70.5 103.6 113.45.9% -12.6% -10.5% -7.0% 12.4% 9.5%58.4 48.5 44.9 45.5 65.1 75.0
-18.9% -17.0% -7.4% -4.3% 6.4% 15.2%
BEA
R C
ASE
S&P 500 14.5x 14.2x 16.1x
MSCI Europe 13.0x 12.5x 14.7x
TOPIX 13.0x 13.2x 12.6x
MSCI EM 11.0x 10.4x
10.4x 11.7x
11.7x
12.0x 10.4x 11.7x
BU
LL C
ASE
S&P 500 16.5x 14.2x 16.1x
MSCI Europe 15.0x 12.5x 14.7x
TOPIX 14.2x 13.2x 12.6x
MSCI EM
Consensus 12m Fwd
P/E Current
BA
SE C
ASE
S&P 500 16.0x 14.2x 16.1x
MSCI Europe 14.0x 12.5x 14.7x
TOPIX 14.0x 13.2x 12.6x
MSCI EM 11.6x
IndexMS Top-Down EPS / YoY % Consensus EPS /
YoY %MS Fwd
P/EMar-17
Consensus Fwd P/E5Y Avg
# EPS decline (%) since peak level Date of Peak Date of Trough # of months of EPS
decline since peak
1 -21.5% Sep-74 Jan-76 162 -20.7% Sep-80 May-83 323 -34.9% Aug-89 Jun-93 464 -9.6% Apr-98 Jun-99 145 -38.3% Feb-01 Sep-02 196 -59.7% Nov-07 Jan-10 267 -5.7% Feb-15 ? 13
# EPS decline (%) since peak level Date of Peak Date of Trough # of months of EPS
decline since peak
1 -56.2% Jan-98 Jun-99 172 -14.1% Aug-01 Jul-02 113 -39.3% Oct-08 Nov-09 134 -14.3% Dec-13 ? 27
MSCI WORLD
MSCI EM
Latest Avg Median Max MinTrailing Price / Earnings 20.7 20.6 20.3 45.9 11.8 0.0 1.9 52Trailing Dividend Yield (%) 2.8 2.4 2.4 4.3 1.4 -1.0 -19.7 12Trailing Price / Book Value 2.0 2.2 2.3 4.1 1.3 -0.7 -12.3 25Trailing Price / Cash Earnings 9.7 9.5 9.8 17.5 5.3 0.1 -0.4 49Trailing Price / Sales 1.3 1.0 1.1 1.9 0.6 1.0 22.7 85Trailing EV / Sales 1.6 1.3 1.4 2.3 0.9 0.9 16.2 83Trailing EV / EBITDA 10.1 8.9 9.0 15.0 6.0 0.7 12.0 79Trailing EV / EBIT 16.8 14.5 14.6 25.4 9.0 0.7 15.0 74N12M Price / Earnings 14.8 14.6 14.7 25.5 5.6 0.0 0.7 54
Trailing Price / Earnings 20.0 19.1 19.6 29.0 10.9 0.3 2.1 58Trailing Dividend Yield (%) 2.3 2.0 1.9 3.4 1.5 -1.0 -20.7 17Trailing Price / Book Value 2.0 1.9 2.0 2.8 1.3 0.2 2.1 60Trailing Price / Cash Earnings 11.3 9.8 10.2 12.8 5.8 0.8 10.9 80Trailing Price / Sales 1.6 1.1 1.1 1.7 0.7 1.6 49.1 98Trailing EV / Sales 2.0 1.4 1.4 2.1 1.0 1.6 42.1 99Trailing EV / EBITDA 11.2 9.4 9.5 11.8 6.3 1.3 17.8 96Trailing EV / EBIT 17.1 14.8 15.2 19.6 9.3 0.9 12.6 84N12M Price / Earnings 15.6 14.6 15.1 19.4 9.1 0.5 3.3 65
AVERAGE 0.4 8.6 65
Med
ian
Stoc
k
Versus History*Standard
Deviations vs Avg
% From
Median
%ile vs Historical
Range
Mar
ket

M O R G A N S T A N L E Y R E S E A R C H
10
March 13, 2016 Spring Global Strategy Outlook
Exhibit 6 illustrates the implied percent upside to MSCI ACWI equities on a 12M view. A reading of 0% suggests a combination of 12M forward PE and EPS growth that the market can be assumed to be currently discounting for. For example, the current consensus 12M forward PE is 15.0x. Were that to apply in March 2017, we can say that the market today is priced for a -1% US$ return if earnings grow at a +2%US$ EPS CAGR. This is closest to our base case scenario mapping across to MSCI ACWI our four regional index targets (they account for around 93% of MSCI ACWI).
Exhibit 6 Implied % Upside/Downside to MSCI ACWI Equities on a 12M View Under Different EPS Growth and PE Assumptions – Highlighting our Bull, Base and Bear scenarios
Source: MSCI, IBES, FactSet, Worldscope, Morgan Stanley Research. Data as of March 9, 2016
How do we make money in equities for the remainder of 2016?
Given our shift to an overall Underweight stance on equities, the question is how should clients position to make money for the remainder of 2016? We approach this question in three ways: a) regional selection; b) factor efficacy analysis on a global basis; and c) key sector and style picks between regions. (Our various regional and country stock focus lists offer up-to-date ideas at the stock level).
Regional preferences: 1) US, 2) Japan, 3) Europe, 4) EM
At the regional level we rank US first, followed by Japan, Europe, and EM. This rank order flows from the risk-adjusted returns forecast in Exhibit 7. On an information ratio basis (forecast base case return divided by the forecast deviation between the bull and bear case) the US scores best, just ahead of Japan, and Europe and EM worst (see Exhibit 7). Japan outscores Europe by a clear margin. The house FX forecast of one-year forward euro weakness and yen strength versus the US dollar favours Europe to outperform Japan. However, Europe has major idiosyncratic negatives in the forecast horizon, including the upcoming Brexit referendum at
the end of June and macro uncertainties to the base case surrounding the potential breakdown of the Schengen agreement for borderless travel within Europe. Japan arguably has potential idiosyncratic positive catalysts on the horizon. These include a larger than consensus supplementary budget and corporate tax cut and the possibility that Prime Minister Abe calls a snap election to propose delaying the second consumption tax hike due in early 2017. In our base case we assume the consumption tax hike goes ahead.
Exhibit 7 MS Risk-adjusted Returns for Regional Indices
Source: MSCI, Rimes, Morgan Stanley Research forecasts. Data as of March 10, 2016.
The state of the world where our regional hierarchy would most go awry would be if China’s growth rebounds on a sustained basis in 2H 2016, whilst the US economy slows materially in the run-up to the next Presidential election. Commodity prices would recover sustainably in this scenario, whilst the US dollar would likely weaken, in particular versus the CNY.
Factor efficacy – continue to focus on dividend yield and FCF yield
Exhibit 8 explores changes year-to-date in factor efficacy by region in driving one-month YTD returns versus full year 2015. The data is sorted for Quintile 1 less Quintile 5 performance in relation to a range of valuation, earnings revisions, price momentum and other factors. We think there are key lessons to be learned regarding what is “working” so far this year, which can be integrated with our overall macro and asset class views elsewhere in this document to drive successful strategies in equities.
Most notable in our view are the strong returns to the normalized PE, historical FCF yield, and dividend yield factors year to date across the major regions. In contrast, high ROE − although it has worked well in the US and to a lesser extent in Europe − has underperformed recently in Japan, APxJ and EM. Estimate revisions breadth has been choppy. Price momentum and sales growth have had the most negative returns of all the factors analysed across the major regions in the last two months. Our top-down economic view sees further pressures on growth for the remainder of the year,
-10 -8 -6 -4 -2 0 2 4 6 8 1011.0 -44 -41 -38 -36 -33 -30 -27 -25 -22 -19 -1611.5 -41 -38 -36 -33 -30 -27 -24 -21 -18 -15 -1212.0 -38 -36 -33 -30 -27 -24 -21 -18 -15 -11 -812.5 -36 -33 -30 -27 -24 -21 -18 -14 -11 -8 -413.0 -33 -30 -27 -24 -21 -18 -14 -11 -7 -4 013.5 -31 -28 -24 -21 -18 -14 -11 -7 -4 0 414.0 -28 -25 -22 -18 -15 -11 -8 -4 0 4 714.5 -26 -22 -19 -15 -12 -8 -4 -1 3 7 1115.0 -23 -19 -16 -12 -9 -5 -1 3 7 11 1515.5 -20 -17 -13 -9 -6 -2 2 6 10 15 1916.0 -18 -14 -10 -6 -3 1 6 10 14 18 2316.5 -15 -11 -8 -4 0 5 9 13 18 22 2717.0 -13 -9 -5 -1 4 8 12 17 21 26 30
MSCI ACWI Price Up/Downside
2Y EPS CAGR (%)
12M Fwd PE In Mar-
17
Bear Case : -30% downside; PE: 13.6x; EPS CAGR: -8%
Bull Case : +17% upside; PE: 15.3x; EPS CAGR: +9%
Base Case : -1% downside; PE: 14.7x; EPS CAGR: +3%
Category S&P 500 MSCI Europe TOPIX MSCI EMBase Case Price Target Upside (%) 3.0% -1.2% 3.6% -7.1%
Historical Annualized Volatility (%)
15.1% 17.5% 23.7% 19.1%
Bull-Bear Skew 33.9% 56.3% 63.9% 58.1%
Base Case PT Upside / Bull-Bear Skew
0.09 -0.02 0.06 -0.12

M O R G A N S T A N L E Y R E S E A R C H
11
March 13, 2016 Spring Global Strategy Outlook
whilst our rates strategists expect bond yields to move lower near term – with the US 10-year troughing at 1.45% in Q3 before only gently rising thereafter. This suggests to us that investors should continue to focus on FCF and dividend yield over sales growth and ROE as factors going forward.
Exhibit 8 Factor Efficacy Year to Date 2016 versus 2015 for Major Global Equity Regions (Quintile1-Quintile5 Monthly Return Spread)
Source: MSCI, Rimes, Morgan Stanley Research
Exhibit 9 screens for our leading ideas with high historical FCF yields from amongst the universe of large-cap stocks (over US$10bn market cap) rated Overweight by MS analysts in each region.
Exhibit 9 Global Stock Ideas with High FCF Yields
Note: For important disclosures and valuation methodology and risks, please see disclosures at the end of this report. Source: Morgan Stanley Research, Bloomberg. Data as of March 9, 2016
Sector and Style Preferences between Regions
Our final key sector and style preferences between regions have been discussed separately in prior reports but are summarized for convenience in Exhibit 10. Within the defensive sectors we prefer Utilities in the US and EM but prefer Telcos and Healthcare in Europe and Staples in Japan. Within the growth sectors we prefer Consumer Discretionary over IT in the US and Japan but prefer IT over Consumer Discretionary in Europe and EM. (This to a significant degree reflects divergence in business models within the hetereogenous IT sectors across geographies). Within the macro-variable dependent sectors we broadly disfavor Materials except in Europe. In EM and Japan we are positive Real Estate over other financial sectors. In the US we are more positive financials than elsewhere (but with a skew to specific themes such as the US credit card companies). We are generally cautious Energy.
Exhibit 10 Sector and Style Preferences Between Regions
Source: Morgan Stanley Research
PeriodNorth
America Europe Japan APxJ & EMAsia ex. Japan
Normalized P/E Avg 2015 (0.5%) (1.4%) 0.2% (0.7%) (0.7%)Jan 2016 3.9% 1.6% 2.1% 3.1% 3.0%Feb 2016 3.0% 2.7% 1.7% 3.4% 2.7%
FCF Yield Avg 2015 0.5% 0.8% (0.2%) 0.3% 0.4%Jan 2016 5.1% 1.2% 1.9% 3.7% 4.4%Feb 2016 3.0% 2.4% 1.5% 1.3% 2.0%
Dividend Yield Avg 2015 (0.8%) (1.2%) 0.3% (0.0%) 0.1%Jan 2016 0.9% 1.6% 1.1% 2.4% 3.6%Feb 2016 1.7% 0.8% 2.5% 4.2% 4.4%
Buyback Yield Avg 2015 0.6% 0.2% (0.0%) (0.3%) (0.6%)Jan 2016 3.1% 2.7% (0.2%) 2.5% 3.8%Feb 2016 1.2% 1.3% 0.6% 1.0% 1.2%
Capex-to-Depreciation Avg 2015 (0.1%) 0.6% (0.5%) 0.6% 0.7%
Jan 2016 1.9% 0.6% 1.3% 1.2% 1.7%Feb 2016 0.6% 0.7% 0.7% (0.7%) (1.0%)
Accruals Avg 2015 0.1% (0.2%) (0.5%) 0.9% 0.8%Jan 2016 0.3% 2.0% 2.6% 1.6% 1.2%Feb 2016 0.3% 1.5% 0.6% 1.9% 2.0%
ROE Avg 2015 0.8% 1.1% (0.1%) 0.3% 0.2%Jan 2016 5.8% 2.6% (1.2%) 3.0% 3.3%Feb 2016 1.3% 0.4% (2.9%) (1.0%) (1.2%)
Net Margin Z-score
Avg 2015 0.9% 1.5% 0.1% 0.8% 0.8%
Jan 2016 1.3% (0.5%) 0.5% 0.1% 0.6%Feb 2016 (1.2%) (2.5%) (2.5%) (2.3%) (2.3%)
YoY Sales Growth
Avg 2015 (0.0%) 1.2% (0.2%) 0.4% 0.2%
Jan 2016 (2.4%) (0.1%) (2.2%) 1.3% 1.4%Feb 2016 (3.1%) (1.8%) (3.2%) (3.4%) (3.3%)
9-M. Price Momentum Avg 2015 1.8% 1.6% (0.6%) 1.2% 1.0%
Jan 2016 1.2% 2.7% 1.8% 1.6% 1.9%Feb 2016 (2.5%) (1.7%) (3.1%) (3.1%) (2.9%)
Up vs. Down Revisions
Avg 2015 0.6% 0.7% (0.5%) 1.0% 0.7%
Jan 2016 (1.5%) 0.8% 3.6% 2.9% 2.4%Feb 2016 (1.6%) (0.7%) 0.2% (0.8%) (0.8%)
Stocks Share price, last Country GICS sector Stock
ratingMcap in USD Bn
FY2016 Div Yield
FY2016 FCF Yield
Delta Air Lines Inc 47 USA Industrials OW 37.8 1.5% e 14.5% eQualcomm Inc 52 USA IT OW 78.4 3.7% e 9.7% eLyondellbasell Industries Nv 83 USA Materials OW 34.6 3.9% e 9.0% e
Intl Airlines Group 7 Spain Industrials OW 15.5 4.5% e 9.3% eITV 233 UK Cons Disc. OW 13.6 3.1% e 6.7% eImperial Brands 3,690 UK Cons Staples OW 50.9 4.3% e 6.6% e
Sony 2,632 Japan Cons Disc. OW 22.2 2.1% e 27.8% eToyota Motor 5,972 Japan Cons Disc. OW 162.7 4.2% e 9.7% eNTT 4,904 Japan Telecom Services OW 89.3 2.5% e 9.4% e
Korea Electric Power 57,300 S. Korea Utilities OW 30.7 5.1% e 10.0% eInfosys Limited 1,177 India IT OW 38.0 3.0% e 6.6% eChunghwa Telecom 105 Taiwan Telecom OW 24.8 5.5% e 6.0% e
S&P 500
MSCI Europe
TOPIX
MSCI EM
S&P 500 MSCI Europe TOPIX MSCI EM
Defensive Sectors
Utilities Over Consumer
Staples
Telcos and Health Care over Utilities
and StaplesStaples over Utilities Utilities over
Staples
Growth Sectors
Consumer Discretionary
Over IT
Industrials and IT over Consumer Discretionary
Consumer Discretionary over IT
IT over Consumer
Discretionary
Macro-variable dependent Sectors
Financials Over Energy and Materials
Banks over EnergyReal Estate over
Materials
Real Estate over Energy and Materials
Style Preference
Mega/Large Cap, Modest Growth
Bias
Large-caps, High & Secure Dividend
Yield
Shareholder Rewards and Corporate Governance
Best Business Models
(Quality)
M O R G A N S T A N L E Y R E S E A R C H
12
March 13, 2016 Spring Global Strategy Outlook
Global Government Bonds: Year of the BullMatthew Hornbach United States Anton Heese Europe Koichi Sugisaki Japan
The global backdrop for rates markets looks so supportive that 2016 may become known as the ‘Year of the Bull’. Indeed, the year got off to a very bullish start. Our economists forecast below-consensus growth and inflation across most of the developed and emerging world. They are telling us that the global economy will no longer accelerate in 2016, and most major economies will perform worse in 2016 than in 2015. And, as a result, the ECB and BoJ will keep easing policy and the BoE and Fed will push rate hikes further out. At this point, our economists expect the ECB and BoJ to continue with their negative interest rate policies (NIRP) – an ominous sign for risk sentiment.
To make the outlook for rates markets more bullish, our China experts suggest that the PBoC will eventually guide the trade-weighted renminbi weaker such that USD/CNY will end 2016 at 6.93 (+6% from spot) and end 2017 at 7.30 (+12% from spot). That compares with the 5% appreciation in USD/CNY since August 10, 2015 – the day before the PBoC altered its currency regime. The combination of a continued slowdown in China and NIRP in the developed world makes it easier to see developed sovereign bond yields remaining low – and at some point going lower. In this context, we lowered our forecasts for yields in the US and the UK, in the euro area and Japan. Over the next 12 months, we have sovereign yields falling to local lows in 3Q16 before rebounding higher.
By the end of 1Q17, we have 10-year UST yields roughly unchanged versus spot, 10-year DBR and UKT yields slightly
higher than spot, and 10-year JGB yields slightly lower than spot.
• In the US, our economists look for the Fed to delay its next rate hike until the December 2016 FOMC meeting – a big change from their previous expectation of three hikes this year. Our economists expect quarterly real GDP growth to stay below 2.0% through 2017. Annual growth in 2016 and 2017, 1.7% and 1.6% on their forecasts respectively, represents a notable downshift from 2.4% Y/Y growth in 2015. Our economists also expect core PCE inflation at 1.4% to miss the Fed’s median projection of 1.6% Q4/Q4 in 2016, as the Y/Y rate inflects downward in 2Q16. With the Fed hiking again, but only in December, policy plays out in 2016 much like in 2015. We expect a mid-year rally to take 10y Treasury yields down to 1.45% − a new cycle low – by the end of 3Q16. 2-year yields re-test the 0.60% level at the same time, but rebound more strongly as the next rate hike approaches in December. By year-end, the 2s10s curve flattens to 0.80% from 1.00% spot and versus the forward at 0.84%. The marginal pickup vs. forwards means playing the yield curve continues to offer little reward for the risk, so we continue to focus on duration over curve.
• In Euro, further ECB easing is well anticipated by the market but the weak inflation and faltering growth outlook means we expect 2y rates to remain well anchored around current levels (-50 to -60bp). We expect longer maturities to trade directionally with global rates, but with a lower beta because investor demand is likely to be impaired if yields fall further while the expansion of the ECB purchase program is likely to moderate any sell-off. Short-dated inflation breakevens remain very cheap, but the risk is that they remain cheap as long as the realized inflation outlook is weak. We expect a modest tightening of sovereign spreads in the short term, due to the ramping up of QE purchases, but are concerned about political risks and slightly weaker growth over the next 12 months, so that we forecast generally flat spreads.
• In the UK, the binary risk around the EU referendum will keep the rates outlook uncertain until the end of June. Assuming our base case of the UK staying in the EU is realized, we expect gilts to largely trade in line with USTs, reflecting similar global growth concerns as well as a similar domestic economic outlook. However, as we approach year-end, and the Fed moves to raise rates again, we expect gilts to underperform cross market, as
Key Investment Ideas • We suggest investors go long duration across G4
bond markets over the next six months – a period over which we expect yield curves to bull-flatten by more than forwards in the US and UK. We suggest US and UK 2s10s curve flatteners vs. steepeners in Germany and Japan. For the next 12 months, we prefer 5s30s flatteners in the UK vs. 5s30s steepeners in Germany.
• We think pricing of global breakeven inflation offers investors a compelling opportunity to purchase protection against higher-than-expected inflation outcomes over the coming year. Given downside risks evident in energy markets, we suggest investors purchase linkers with at-the-money deflation floors.
Government Bonds – +TreasuriesBundsJGBsEM Local
M O R G A N S T A N L E Y R E S E A R C H
13
March 13, 2016 Spring Global Strategy Outlook
the market starts to price in the first rate hike our economists forecast in February 2017. The combination of rate hikes being priced in, but still strong demand for duration globally, causes the 2s10s curve to flatten. We expect UK breakevens to remain well supported and trade at a premium to other inflation markets.
• In Japan, our economists expect further rate cuts totaling at least 20bp ahead of the July Upper House election, and have few (if any) concerns about the prospect of BoJ tapering, given that the core CPI inflation rate (excluding fresh foods) looks highly unlikely to climb near 2.0% by 2017. Thus, we expect that the JGB market will continue to be driven mostly by supply/demand and BoJ rate cut speculation. NIRP has effectively eliminated the ‘floor’ for short- to medium-term yields, for which reason the balance of risks to JGB rates is probably weighted to the downside. Thus, we lowered our yield forecast significantly with the 10y yield falling to around -0.2% by 1Q17. We expect the JGB curve to bull-steepen through the 10y sector and bull-flatten through the super-long end. The super-long sector is likely to outperform on the curve, as domestic investors looking to avoid negative yields take on greater duration risk. We expect the 30y yield to fall to 0.4% in 1Q17.
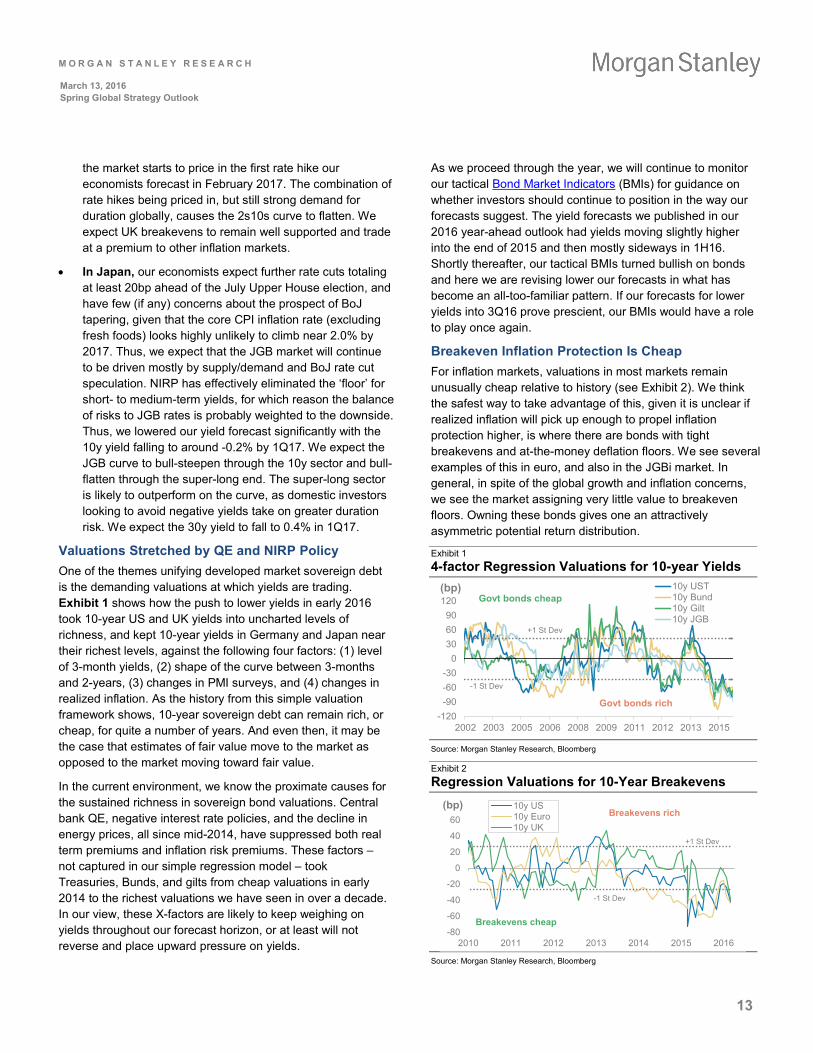
Valuations Stretched by QE and NIRP Policy One of the themes unifying developed market sovereign debt is the demanding valuations at which yields are trading. Exhibit 1 shows how the push to lower yields in early 2016 took 10-year US and UK yields into uncharted levels of richness, and kept 10-year yields in Germany and Japan near their richest levels, against the following four factors: (1) level of 3-month yields, (2) shape of the curve between 3-months and 2-years, (3) changes in PMI surveys, and (4) changes in realized inflation. As the history from this simple valuation framework shows, 10-year sovereign debt can remain rich, or cheap, for quite a number of years. And even then, it may be the case that estimates of fair value move to the market as opposed to the market moving toward fair value.
In the current environment, we know the proximate causes for the sustained richness in sovereign bond valuations. Central bank QE, negative interest rate policies, and the decline in energy prices, all since mid-2014, have suppressed both real term premiums and inflation risk premiums. These factors – not captured in our simple regression model – took Treasuries, Bunds, and gilts from cheap valuations in early 2014 to the richest valuations we have seen in over a decade. In our view, these X-factors are likely to keep weighing on yields throughout our forecast horizon, or at least will not reverse and place upward pressure on yields.
As we proceed through the year, we will continue to monitor our tactical Bond Market Indicators (BMIs) for guidance on whether investors should continue to position in the way our forecasts suggest. The yield forecasts we published in our 2016 year-ahead outlook had yields moving slightly higher into the end of 2015 and then mostly sideways in 1H16. Shortly thereafter, our tactical BMIs turned bullish on bonds and here we are revising lower our forecasts in what has become an all-too-familiar pattern. If our forecasts for lower yields into 3Q16 prove prescient, our BMIs would have a role to play once again.
Breakeven Inflation Protection Is Cheap For inflation markets, valuations in most markets remain unusually cheap relative to history (see Exhibit 2). We think the safest way to take advantage of this, given it is unclear if realized inflation will pick up enough to propel inflation protection higher, is where there are bonds with tight breakevens and at-the-money deflation floors. We see several examples of this in euro, and also in the JGBi market. In general, in spite of the global growth and inflation concerns, we see the market assigning very little value to breakeven floors. Owning these bonds gives one an attractively asymmetric potential return distribution.
Exhibit 1 4-factor Regression Valuations for 10-year Yields
Source: Morgan Stanley Research, Bloomberg
Exhibit 2 Regression Valuations for 10-Year Breakevens
Source: Morgan Stanley Research, Bloomberg
-120-90-60-30
0306090
120
2002 2003 2005 2006 2008 2009 2011 2012 2013 2015
(bp) 10y UST10y Bund10y Gilt10y JGB
Govt bonds cheap
Govt bonds rich
+1 St Dev
-1 St Dev
-80
-60
-40
-20
0
20
40
60
2010 2011 2012 2013 2014 2015 2016
(bp) 10y US10y Euro10y UK
Breakevens rich
Breakevens cheap
+1 St Dev
-1 St Dev

M O R G A N S T A N L E Y R E S E A R C H
14
March 13, 2016 Spring Global Strategy Outlook
Global FX: The Bullish JPY, USD and CHF Trio Hans Redeker Global Head of FX Strategy
The Currencies to Buy: JPY, USD and CHF
The JPY remains our currency of the year, with Japan’s strong foreign asset position and pension fund repatriation needs catapulting it higher. Our benign outlook for Japanese foreign risk appetite adds to envisaged JPY strength, overwhelming the efforts of the Bank of Japan to control the appreciation of the JPY. While yen strength has been our call for some time, we have changed our CHF outlook and now expect strength. The ability of Swiss-based portfolio managers to export long-term capital against the current account surplus has diminished. If the risk outlook within the Eurozone remains more negative than elsewhere, we would expect the CHF to strengthen.
The USD completes the main trio of appreciating currencies, supported by continued repatriation demand coming out of EM countries. Since the USD has not converted into an investment currency yet, the Fed’s ability to dampen USD appreciation will remain limited and not go beyond a tactical impact. The strategic USD outlook will remain determined by the poor investment outlook elsewhere in the world and the related increase of non-US savings. The inability to find adequate local investment opportunities for these savings should lead to a permanent flow of funds into the USD. We think the SEK outperforms in Europe, with efforts by the Riksbank to prevent SEK appreciation increasingly lacking credibility as the relative growth outlook becomes stronger.
The Currencies to Sell: EUR
Outside the JPY, CHF, USD and the SEK, it is hard to find a positive currency story. In fact, the outlook has weakened further in some cases, such as GBP and the EUR. Tightening global liquidity conditions, which are the result of falling currency reserves, Japan’s taking funds back into the JPY instead of their previous foreign investments, and an overvalued USD becoming even more overvalued, suggest that creditors will be more selective about where to place funds. Entities with particularly large balance sheets may find it harder to fund exposures under previously lucrative conditions.
Exhibit 1 Major FX Forecasts
Source: Morgan Stanley Research forecasts
We think that FX investors will start to become more worried about the large balance sheets in the European banking sector. In 2011, the EUR and European equities fell simultaneously as EMU’s peripheral sovereign risk outlook caused an asset sell-off. Peripheral banks’ investments put the quality of their balance sheets into doubt, and investors were rattled by a sharp rise of non-performing loans and questioned the ability of peripheral sovereign bonds to provide the backbone for these balance sheets. Back then, it was the asset side that mattered. Regulatory changes and the OMT establishing a quasi ‘lender of last resort’ capacity for the ECB stabilised the situation from July 2012. This time it is not so much the asset outlook that concerns EUR traders. Instead, it is the capacity to fund large balance sheets, the impact on bank credit spreads, and the ability and willingness of banks to provide credit that may send the EUR lower. Concretely, banks cutting balance sheets may tighten their lending standards. Thus, weakening global liquidity conditions may impact monetary velocity the most where balance sheets are still most
2Q16 3Q16 4Q16 1Q17EUR/USD 1.06 1.03 1.00 0.98
Before 1.03 1.01 1.00 0.99GBP/USD 1.45 1.38 1.32 1.30
Before 1.41 1.40 1.40 1.41USD/JPY 110 105 106 108
Before 121 118 115 112USD/INR 71.0 72.0 73.0 73.0
Before 68.5 69.3 70.0 69.0USD/KRW 1280 1310 1350 1350
Before 1260 1280 1300 1280USD/TRY 3.20 3.25 3.35 3.32
Before 3.15 3.20 3.25 3.26
Key Investment Ideas • The JPY, USD and the CHF are expected to rally as
cross-border capital flows ease.
• The anticipated decline in risk appetite suggests to us staying short the EM/commodity FX block.
• Low EM asset returns combined with ambitiously sized balance sheets should increase local savings.
• Failure to find adequate local non-US investment opportunities should lead to capital exports, boosting USD.
• US repatriation demand will likely remain the dominant reason for USD strength.
• We have become more bearish on INR, KRW and GBP and have upgraded our JPY call further.
FX – +USDEURJPYEM
M O R G A N S T A N L E Y R E S E A R C H
15
March 13, 2016 Spring Global Strategy Outlook
ambitious. The recent decline in EMU monetary velocity has come on the heels of tighter global monetary conditions.
Generally, when monetary velocity declines, the central bank should compensate with an adequate increase in base money. The more that money supply growth is driven by the central bank’s pumping base money into the system, instead of via commercial bank lending activities, the more the currency will come under selling pressure. In the case of the EUR, traders and investors need to watch indications of global liquidity conditions and the impact on European bank funding and lending conditions. The more Japan repatriates, global currency reserves fall, and the USD rallies as EM pushes local savings into USD-denominated holdings, the more the EUR is likely to come under selling pressure.
The Currencies to Sell: GBP
The expected decline in the GBP is not only due to Brexit related concerns. Other concerns include a pro-cyclical fiscal policy, the important UK financial sector being challenged by globally low rates, increasing regulation pushing financial sector productivity lower, and a current account deficit fluctuating around 4%. All of this will make it more difficult to fund Britain’s financial needs at current attractive levels, arguing for a lower GBP. Should the UK vote for Brexit on the 23 June, GBP/USD could fall as low as 1.20, taking the EUR with it.
The Currencies to Sell: EMFX
We stay bearish the commodity and EM FX block, but there are some new nuances as weakness moves away from LatAm and high-beta FX and towards AxJ. Against the USD, LatAm currencies may still lose between 8-10%, but after accounting for carry, we think being short AxJ is more attractive. LatAm fundamentals remain weak, and we expect commodity prices to remain soft. However, improved external positions and central bank pushback may mean LatAm currencies are not going to be the underperformers within EM this year.
The Currencies to Sell: AxJ
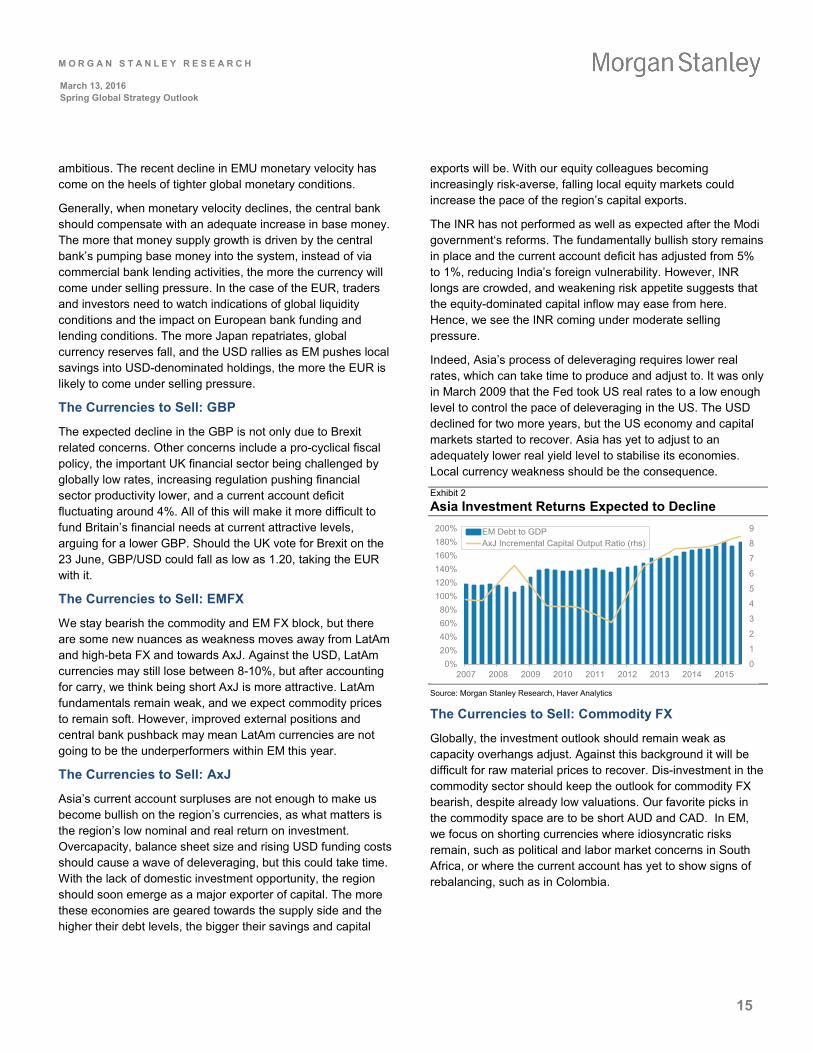
Asia’s current account surpluses are not enough to make us become bullish on the region’s currencies, as what matters is the region’s low nominal and real return on investment. Overcapacity, balance sheet size and rising USD funding costs should cause a wave of deleveraging, but this could take time. With the lack of domestic investment opportunity, the region should soon emerge as a major exporter of capital. The more these economies are geared towards the supply side and the higher their debt levels, the bigger their savings and capital
exports will be. With our equity colleagues becoming increasingly risk-averse, falling local equity markets could increase the pace of the region’s capital exports.
The INR has not performed as well as expected after the Modi government‘s reforms. The fundamentally bullish story remains in place and the current account deficit has adjusted from 5% to 1%, reducing India’s foreign vulnerability. However, INR longs are crowded, and weakening risk appetite suggests that the equity-dominated capital inflow may ease from here. Hence, we see the INR coming under moderate selling pressure.
Indeed, Asia’s process of deleveraging requires lower real rates, which can take time to produce and adjust to. It was only in March 2009 that the Fed took US real rates to a low enough level to control the pace of deleveraging in the US. The USD declined for two more years, but the US economy and capital markets started to recover. Asia has yet to adjust to an adequately lower real yield level to stabilise its economies. Local currency weakness should be the consequence.
Exhibit 2 Asia Investment Returns Expected to Decline
Source: Morgan Stanley Research, Haver Analytics
The Currencies to Sell: Commodity FX
Globally, the investment outlook should remain weak as capacity overhangs adjust. Against this background it will be difficult for raw material prices to recover. Dis-investment in the commodity sector should keep the outlook for commodity FX bearish, despite already low valuations. Our favorite picks in the commodity space are to be short AUD and CAD. In EM, we focus on shorting currencies where idiosyncratic risks remain, such as political and labor market concerns in South Africa, or where the current account has yet to show signs of rebalancing, such as in Colombia.
0
1
2
3
4
5
6
7
8
9
0%20%40%60%80%
100%120%140%160%180%200%
2007 2008 2009 2010 2011 2012 2013 2014 2015
EM Debt to GDPAxJ Incremental Capital Output Ratio (rhs)
M O R G A N S T A N L E Y R E S E A R C H
16
March 13, 2016 Spring Global Strategy Outlook
Global EM Fixed Income: The Case for Alpha Gordian Kemen & EM Fixed Income Strategy Team
EM adjustment not complete: Our economists have downgraded both DM and EM growth for 2016 and 2017, expecting 2016 global growth at 3% vs. 3.3% previously, and pushing out the turnaround to late 2016. More importantly, EM is still not taking steps to deal with its problems, and structural reforms to lift productivity are still missing. EMFX is left do the heavy lifting in the adjustment process; and this is where we expect another bout of weakness over the next year.
Risks still skewed to the downside: The macro bear case sees larger downside than the upside in our bull case. This factors in the potential volatility on the back of growing political risks related to further erosion of the EU project, Brexit and geopolitics. Our oil forecasts have a similarly negative skew, with the base case for Brent still averaging US$30 for 2016. Finally, given the debt overhang and tight financial conditions, we cannot rule out a more disorderly end to the EM credit cycle. However, we confine this scenario to our bear case. In our base case, our EM bank analysts expect NPLs to rise further and take a toll on ROE, but they do not expect more negative capital shortfalls and eventual spillovers to sovereigns.
EM flows also a challenge: Both push factors (less US monetary accommodation) and pull factors (depressed EM growth) are likely to challenge overall flows into EM this year, just as in 2015. Since May 2015, EM debt dedicated funds have seen outflows of 13% of AUM. Low sovereign supply has
thus far been a partial offset, particularly in hard currency. Yet, with widening fiscal deficits, supply is likely to pick up. Therefore, if outflows from EM continue, this would in turn put pressure on bond yields.
Valuations have improved, however: Spreads on sovereign credit have only been wider 11% of days over the past 10 years, mainly during the global financial crisis, meaning spreads look cheap in the absence of a global recession. This cheapness is less clear when compared to US credit. EM IG credits provide 1.2% yield pickup over US IG, towards the lower end of the range since the taper tantrum, while HY only provides 0.9% compared to 5% a year ago. This supports our view that globally elevated risk premia are also behind the current wide EM spreads. It also caps the potential spread tightening in EM, as our US colleagues expect US IG spreads to tighten only 20bp in the coming year.
In local rates, most markets lagged core rates in the recent rally, with spreads widening to historically wide levels that provide a cushion to absorb higher UST yields. Across most curves, the front end is pricing in more tightening than our economists expect, providing protection against EM FX depreciation.
Ability to capture carry makes sovereign credit the preferred asset class: We project total returns of 6.6% over 12m, although less than 1% in the next 6 months. While we project spreads to widen to 480bp, given that UST yields are expected to remain flat, most of the high carry can be captured. Our spread forecasts also factor in a negative skew, with a bear case of 625bp vs. 425bp in the bull case.
Anticipated FX depreciation limits local rates total return, but opportunities exist: On a 12-month basis, expected return for the GBI-EM is negative in USD terms, given our expectation of 8-10% FX depreciation against the USD. However, we expect small positive returns after FX hedging in the next quarter as many countries still have steep local market curves and rates can move slightly lower on the back of UST move. In addition, the total return profile improves dramatically if FX hedges are taken off after 6 months, which is when we expect the depreciation to relent.
Neutral stance with focus on selective opportunities: The negative skew still reinforces a cautious approach, especially in the coming 6 months. Therefore, we advocate a very selective approach in our near-term asset allocation. However, lower core yields are expected to keep EM carry opportunities on the radar over the next 12 months. We maintain a preference for external debt.
Key Investment Ideas • Both EM fundamentals and flows remain challenged.
Better valuations and carry over a 12-month horizon offer a partial offset for total return, but given the multitude of risks that remain, especially in the next 6 months, we maintain a cautious approach and focus on selective alpha opportunities.
• We still favour sovereign credit where we project total returns of 6.6% over 12 months. We see less value in CEEMEA over time and recommend gradual reallocation to LatAm instead. Long Pemex vs Mexico remains one of our key trades in external debt, and we like the Argentina GDP warrant.
• Anticipated FX depreciation limits local rates total returns. Dexterity in FX hedging, however, can still deliver attractive total returns in a number of countries. Mexico remains one of our key OW’s here.

M O R G A N S T A N L E Y R E S E A R C H
17
March 13, 2016 Spring Global Strategy Outlook
Local Rates Allocation
We bucket our OW in two categories: (1) countries with positive total returns on a hedged basis due to an attractive combination of yield, carry/roll-down and cheap hedging costs, such as Mexico, Hungary, Poland and (2) countries where we expect yields to be supported by other factors, i.e., in South Africa tactically via reduced rate hike expectations and compression of risk premium and in Indonesia via further rate cuts and foreign inflows. Mexico remains one of our strongest calls, given wide yield spreads to the US versus history. Our OW’s in Poland and Hungary are supported by disinflation and further ECB easing. Two former OW’s, Colombia and India fall in the first category, but both are market weights for us now. In India we see limited rally potential after markets have priced in the fiscally prudent budget and another 50bp of RBI cuts. We recently downgraded Colombia to reflect fiscal challenges and likely supply pressures.
Among our market weights we have two high yielders, Brazil and Turkey, where high carry offsets idiosyncratic risks. A strong recent rally has eroded further upside in Brazil, while the fundamental backdrop remains challenging. In Turkey, we also see limited rally potential, but a benign external environment should provide decent carry against the backdrop of a still depreciating TRY. We move Peru to MW from UW given attractive yields and improving fundamentals. We stay MW in China, but are near-term cautious given ongoing capital outflows and FX weakness. In Korea, we expect KTB to rally further as the BoK eases again in 2Q16.
Malaysia and Singapore remain UW. We expect spreads to US rates to widen in the latter two as risk sentiment and FX weaken. Lastly, we move Russia to UW from Max UW. Yields here are expensive as they price in an aggressive easing cycle, in contrast to our expectations.
Sovereign Credit Allocation
Prepare to reduce CEEMEA exposure: We remain cautious on Turkey and South Africa. We expect the CEE countries to maintain a low beta in the near term, but with the growing political risk in Europe, we think the region is unlikely to outperform over the next 12 months.
Gradually reallocating to LatAm: LatAm has been the clear underperformer in the past year, largely due to its high commodity exposure. While the rebalancing is proceeding at varying speeds, we think this is where exposure should be added in the coming year. We like Peru and Mexico now and see Pemex as attractive. We also like Argentina, but express it through the GDP warrant instead of the bonds in anticipation of significant supply. We maintain Brazil as MW in our
portfolio, but we think long-end bonds offer attractive risk-reward due to the low dollar price and steep curve.
Too early to buy oil exporters: With oil prices expected to remain low for longer, it’s too early to buy the oil complex. Indeed, despite Venezuela trading at distressed prices, the high uncertainty around recovery value keeps us MW, favouring long-end low dollar price bonds. To position for an upside surprise in oil while keeping downside capped, we like the long end of the very steep Colombia curve. Despite Colombia now being a double deficit credit, it faces much smaller structural headwinds than Turkey and South Africa.
Very low-beta credits moving with UST: Chile and the Philippines are trading at very tight spreads, having been among the outperformers YTD courtesy of much lower UST yields. While expectations of lower UST yields in 2Q16 may present some tactical trading opportunities, we believe these credits will underperform on a longer time horizon.
Exhibit 1 Local Rates/ Sovereign Credit Return Forecast
Source: Morgan Stanley Research forecasts, Bloomberg
Exhibit 2 Valuation Assessment (2016 year-end Horizon)
Source: Bloomberg, Morgan Stanley Research forecast; * What’s in the Price refers to MS economists’ 16-end forecast and current market pricing. 2s10s refers to the swap market except IDR (bond). Bond return is based our latest forecast with 10m FX forward hedge. Real yield is the difference between 2yr swap rate and MS 2yr CPI forecast.
90
95
100
105
110
Mar-16 Jun-16 Sep-16 Dec-16 Mar-17
FX (with carry)Local Bonds (Hedged)Local Bonds (Unhedged)Sovereign Credit
Real Forecast Market Diff Level Bond FX Total Yield
BRL 0 -29 29 85 8.0% -8.9% -0.9% 5.8CLP 0 32 -32 66 3.3% -4.6% -1.4% 0.3COP 25 14 11 115 3.0% -5.4% -2.4% 0.7MXN 50 57 -7 159 5.8% -3.1% 2.7% 1.3
HUF -35 -30 -5 107 1.3% -0.7% 0.6% -0.2ILS 0 1 -1 151 0.7% 0.3% 1.0% -0.2PLN -50 -29 -21 76 0.3% -0.7% -0.5% 0.8ZAR 50 86 -36 105 5.5% -6.7% -1.2% 1.5TRY 0 -40 4.0% -8.8% -4.8% 2.1RUB -100 -106 4.6% -8.0% -3.4% 1.0
MYR 0 -25 25 45 1.3% -1.9% -0.6% 1.0IDR -50 32 4.5% -6.9% -2.4% 3.1KRW -25 -24 -1 18 1.3% -1.0% 0.3% -0.5THB 0 -3 3 55 0.8% -1.7% -0.9% -0.1INR -25 13 4.1% -5.7% -1.7% 2.2CNY -25 55 2.7% -3.6% -0.9% 1.2
Bond Return (FX Hedged)What's in the Price* 2s10s (Jan 2013 to Now)*Absolute Range
LATA
MC
EEM
EAA
SIA
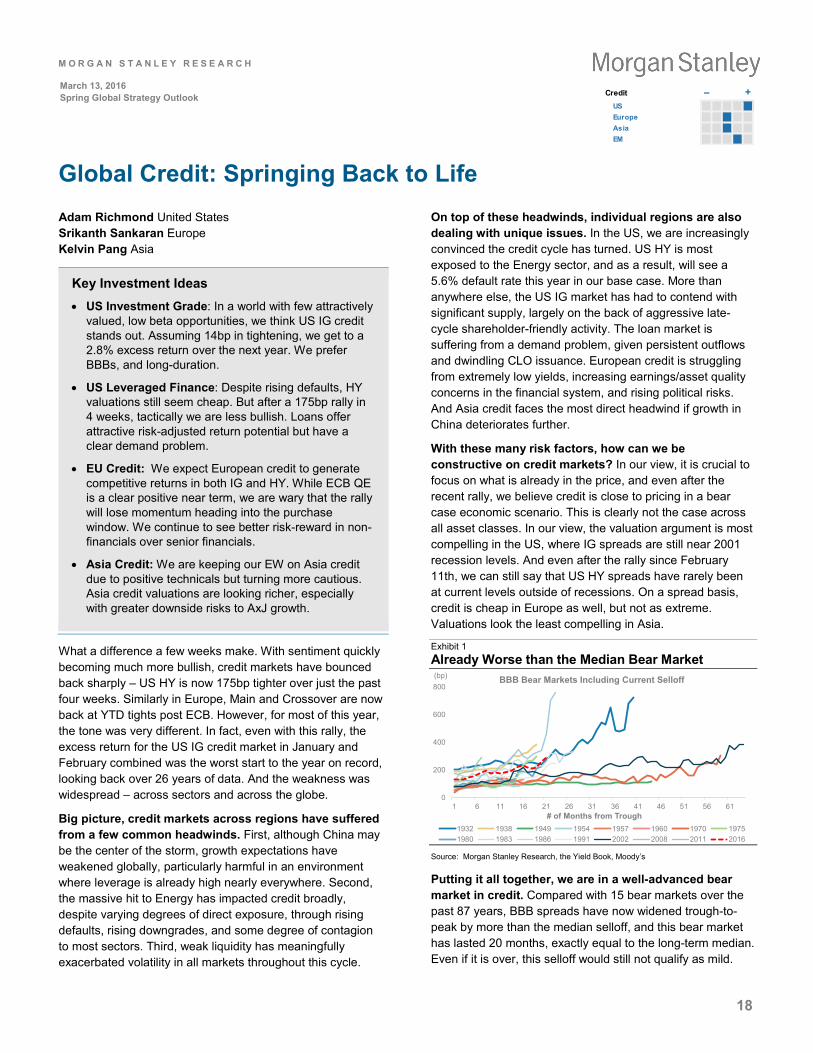
M O R G A N S T A N L E Y R E S E A R C H
18
March 13, 2016 Spring Global Strategy Outlook
Global Credit: Springing Back to Life Adam Richmond United States Srikanth Sankaran Europe Kelvin Pang Asia
What a difference a few weeks make. With sentiment quickly becoming much more bullish, credit markets have bounced back sharply – US HY is now 175bp tighter over just the past four weeks. Similarly in Europe, Main and Crossover are now back at YTD tights post ECB. However, for most of this year, the tone was very different. In fact, even with this rally, the excess return for the US IG credit market in January and February combined was the worst start to the year on record, looking back over 26 years of data. And the weakness was widespread – across sectors and across the globe.
Big picture, credit markets across regions have suffered from a few common headwinds. First, although China may be the center of the storm, growth expectations have weakened globally, particularly harmful in an environment where leverage is already high nearly everywhere. Second, the massive hit to Energy has impacted credit broadly, despite varying degrees of direct exposure, through rising defaults, rising downgrades, and some degree of contagion to most sectors. Third, weak liquidity has meaningfully exacerbated volatility in all markets throughout this cycle.
On top of these headwinds, individual regions are also dealing with unique issues. In the US, we are increasingly convinced the credit cycle has turned. US HY is most exposed to the Energy sector, and as a result, will see a 5.6% default rate this year in our base case. More than anywhere else, the US IG market has had to contend with significant supply, largely on the back of aggressive late-cycle shareholder-friendly activity. The loan market is suffering from a demand problem, given persistent outflows and dwindling CLO issuance. European credit is struggling from extremely low yields, increasing earnings/asset quality concerns in the financial system, and rising political risks. And Asia credit faces the most direct headwind if growth in China deteriorates further.
With these many risk factors, how can we be constructive on credit markets? In our view, it is crucial to focus on what is already in the price, and even after the recent rally, we believe credit is close to pricing in a bear case economic scenario. This is clearly not the case across all asset classes. In our view, the valuation argument is most compelling in the US, where IG spreads are still near 2001 recession levels. And even after the rally since February 11th, we can still say that US HY spreads have rarely been at current levels outside of recessions. On a spread basis, credit is cheap in Europe as well, but not as extreme. Valuations look the least compelling in Asia.
Exhibit 1 Already Worse than the Median Bear Market
Source: Morgan Stanley Research, the Yield Book, Moody’s
Putting it all together, we are in a well-advanced bear market in credit. Compared with 15 bear markets over the past 87 years, BBB spreads have now widened trough-to-peak by more than the median selloff, and this bear market has lasted 20 months, exactly equal to the long-term median. Even if it is over, this selloff would still not qualify as mild.
0
200
400
600
800
1 6 11 16 21 26 31 36 41 46 51 56 61# of Months from Trough
BBB Bear Markets Including Current Selloff
1932 1938 1949 1954 1957 1960 1970 19751980 1983 1986 1991 2002 2008 2011 2016
(bp)
Key Investment Ideas • US Investment Grade: In a world with few attractively
valued, low beta opportunities, we think US IG credit stands out. Assuming 14bp in tightening, we get to a 2.8% excess return over the next year. We prefer BBBs, and long-duration.
• US Leveraged Finance: Despite rising defaults, HY valuations still seem cheap. But after a 175bp rally in 4 weeks, tactically we are less bullish. Loans offer attractive risk-adjusted return potential but have a clear demand problem.
• EU Credit: We expect European credit to generate competitive returns in both IG and HY. While ECB QE is a clear positive near term, we are wary that the rally will lose momentum heading into the purchase window. We continue to see better risk-reward in non-financials over senior financials.
• Asia Credit: We are keeping our EW on Asia credit due to positive technicals but turning more cautious. Asia credit valuations are looking richer, especially with greater downside risks to AxJ growth.
Credit – +USEuropeAsiaEM

M O R G A N S T A N L E Y R E S E A R C H
19
March 13, 2016 Spring Global Strategy Outlook
However, in all likelihood, this bear market has not ended. Usually spreads peak sometime close to, but before the economic data troughs for a cycle, and we are likely not there yet. In fact, tactically speaking, we do not think credit is a buy across the board. European credit has received the QE boost and shouldl continue to trade well near-term. But in US HY, for example, which has rallied significantly over the last month, we believe investors will get a better entry point.
That said, for those with a longer time horizon, we think buying credit in most regions at current levels will not be a mistake longer term – especially relative to many of the alternatives out there. Spreads could clearly peak at considerably wider levels at some point before the next bull market begins. But at risk of stating the obvious, timing that peak is never easy. And more importantly, even when spreads gap wider, the market rarely gives investors much time to execute at those extreme valuations.
Forecasts and Positioning Exhibit 2 Global Credit Forecasts – 1 Year Forward
Source: Morgan Stanley Research forecasts. *Note: TR = Total Return, ER = Excess Return
In a world with few attractively valued, low-beta opportunities, we think US IG credit stands out. Assuming 14bp in tightening, we get to a 2.8% excess return over the next year, a number surpassed in only 5 years of the past 26. Heavy supply is a risk, but we think that if growth concerns continue to rise and volatility remains elevated, corporate behavior will become more conservative at the margin, especially for lower quality IG companies, regardless of the level of yields. We prefer BBBs, long-duration IG, and Industrials over Financials.
Tactically, we are less bullish on US HY. Yes, valuations also look cheap. And while defaults will rise over the next few years, the market is already pricing in meaningful defaults. Thus, we reiterate our view that buying at current levels will
not be a mistake longer term. But after a 175bp rally, we think the likelihood that investors get a better entry point is quite high. In the loan market, we think risk-adjusted return potential is attractive, defaults will remain lower than in HY, and with few investors expecting a big move higher in rates, having an imbedded hedge against such a scenario is not a bad thing. However, loans face unique fundamental challenges and have a clear demand problem, driving our expectation for only modest spread tightening. In high yield, we prefer ex-Energy B-rated credits, and we think BB loans are an attractive defensive opportunity.
We maintain a constructive bias in European credit. Our 12-month excess return forecasts for IG and HY remain strong at 2.0% and 4.2%, respectively, after taking last week’s rally into account. Given the ECB’s actions last week, the rally in European credit looks set to continue over the coming weeks, but we remain wary that it will lose steam as we approach the actual purchase window. We also believe that the already low absolute yields are likely to limit the magnitude of spread compression over a 6-12 month timeframe. Over our forecast horizon, we also expect assets benefiting directly from purchases to outperform non-eligible assets. Our preference for non-financials over senior financials in IG therefore remains intact for now. Within non-financials, we see Utilities as being a prime beneficiary of ECB QE. In European HY, we see a case for portfolio rebalancing flows that benefit BB performance and recommend using the recent strength to reduce single-B HY exposure and move up in quality. More specifically, in the context of the ECB’s CSPP, we size the potential universe of benchmark size ECB repo-eligible bonds to be ~400bln and see €4-5bln per month as an upper limit for purchase volumes. Please see European Credit Strategy: The ECB’s Latest Gambit (11 Mar 2016) for more details.
We are keeping our EW on Asia credit due to supportive technicals but turning more cautious. We are expecting a modest 5bp in spread widening as valuation look rich. This is due to Asia credit’s recent strong outperformance over global credit. However, technicals remain positive. Our economist expects the AxJ policy rate to decrease by 30bps to 4.4%, which supports our call for weaker supply this year as onshore funding continues to be cheaper than USD funding. Gross supply for Asia credit is currently down 23% YoY. At the same time, demand for USD assets should remain supported by forecast AXJ currency weakness versus the USD. We continue to closely monitor the technicals of Asia credit, and much weaker demand would be a catalyst for us to move from EW to UW.
Spread ForecastsCurrent Bull Case Base Case Bear Case
US Investment Grade 182 145 168 240US High Yield 683 573 668 933US Leveraged Loans 646 566 641 861European IG 142 115 130 170European HY 506 425 475 600Asia 300 290 305 376Return Forecasts
Bull Case Base Case Bear CaseUS Investment Grade (ER) 4.3% 2.8% -2.1%US High Yield (TR) 5.4% 4.6% -2.6%US Leveraged Loans (TR) 7.0% 5.3% -2.2%European IG (ER) 2.8% 2.0% 0.0%European HY (ER) 6.1% 4.2% -0.6%Asia (ER) 2.1% 1.5% -1.3%
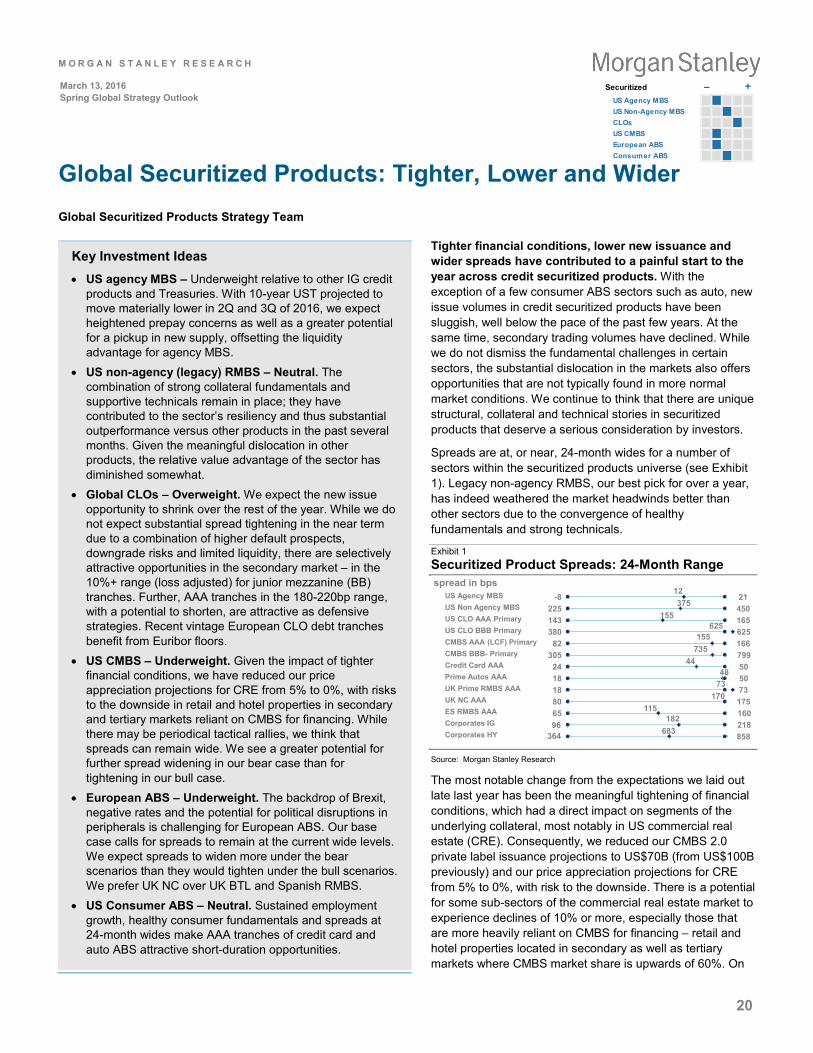
M O R G A N S T A N L E Y R E S E A R C H
20
March 13, 2016 Spring Global Strategy Outlook
Global Securitized Products: Tighter, Lower and Wider Global Securitized Products Strategy Team
Tighter financial conditions, lower new issuance and wider spreads have contributed to a painful start to the year across credit securitized products. With the exception of a few consumer ABS sectors such as auto, new issue volumes in credit securitized products have been sluggish, well below the pace of the past few years. At the same time, secondary trading volumes have declined. While we do not dismiss the fundamental challenges in certain sectors, the substantial dislocation in the markets also offers opportunities that are not typically found in more normal market conditions. We continue to think that there are unique structural, collateral and technical stories in securitized products that deserve a serious consideration by investors.
Spreads are at, or near, 24-month wides for a number of sectors within the securitized products universe (see Exhibit 1). Legacy non-agency RMBS, our best pick for over a year, has indeed weathered the market headwinds better than other sectors due to the convergence of healthy fundamentals and strong technicals.
Exhibit 1 Securitized Product Spreads: 24-Month Range
Source: Morgan Stanley Research The most notable change from the expectations we laid out late last year has been the meaningful tightening of financial conditions, which had a direct impact on segments of the underlying collateral, most notably in US commercial real estate (CRE). Consequently, we reduced our CMBS 2.0 private label issuance projections to US$70B (from US$100B previously) and our price appreciation projections for CRE from 5% to 0%, with risk to the downside. There is a potential for some sub-sectors of the commercial real estate market to experience declines of 10% or more, especially those that are more heavily reliant on CMBS for financing – retail and hotel properties located in secondary as well as tertiary markets where CMBS market share is upwards of 60%. On
12375
155625
155735
4448
73170
115182
683
-8225143380
82305
2418188065
21450165625166799505073175160218 858
spread in bps
Prime Autos AAA
ES RMBS AAA
US Agency MBSUS Non Agency MBSUS CLO AAA PrimaryUS CLO BBB PrimaryCMBS AAA (LCF) PrimaryCMBS BBB- PrimaryCredit Card AAA
UK Prime RMBS AAAUK NC AAA
Corporates HY 364 Corporates IG 96
Key Investment Ideas • US agency MBS – Underweight relative to other IG credit
products and Treasuries. With 10-year UST projected to move materially lower in 2Q and 3Q of 2016, we expect heightened prepay concerns as well as a greater potential for a pickup in new supply, offsetting the liquidity advantage for agency MBS.
• US non-agency (legacy) RMBS – Neutral. The combination of strong collateral fundamentals and supportive technicals remain in place; they have contributed to the sector’s resiliency and thus substantial outperformance versus other products in the past several months. Given the meaningful dislocation in other products, the relative value advantage of the sector has diminished somewhat.
• Global CLOs – Overweight. We expect the new issue opportunity to shrink over the rest of the year. While we do not expect substantial spread tightening in the near term due to a combination of higher default prospects, downgrade risks and limited liquidity, there are selectively attractive opportunities in the secondary market – in the 10%+ range (loss adjusted) for junior mezzanine (BB) tranches. Further, AAA tranches in the 180-220bp range, with a potential to shorten, are attractive as defensive strategies. Recent vintage European CLO debt tranches benefit from Euribor floors.
• US CMBS – Underweight. Given the impact of tighter financial conditions, we have reduced our price appreciation projections for CRE from 5% to 0%, with risks to the downside in retail and hotel properties in secondary and tertiary markets reliant on CMBS for financing. While there may be periodical tactical rallies, we think that spreads can remain wide. We see a greater potential for further spread widening in our bear case than for tightening in our bull case.
• European ABS – Underweight. The backdrop of Brexit, negative rates and the potential for political disruptions in peripherals is challenging for European ABS. Our base case calls for spreads to remain at the current wide levels. We expect spreads to widen more under the bear scenarios than they would tighten under the bull scenarios. We prefer UK NC over UK BTL and Spanish RMBS.
• US Consumer ABS – Neutral. Sustained employment growth, healthy consumer fundamentals and spreads at 24-month wides make AAA tranches of credit card and auto ABS attractive short-duration opportunities.
Securitized – +US Agency MBSUS Non-Agency MBSCLOsUS CMBSEuropean ABSConsumer ABS
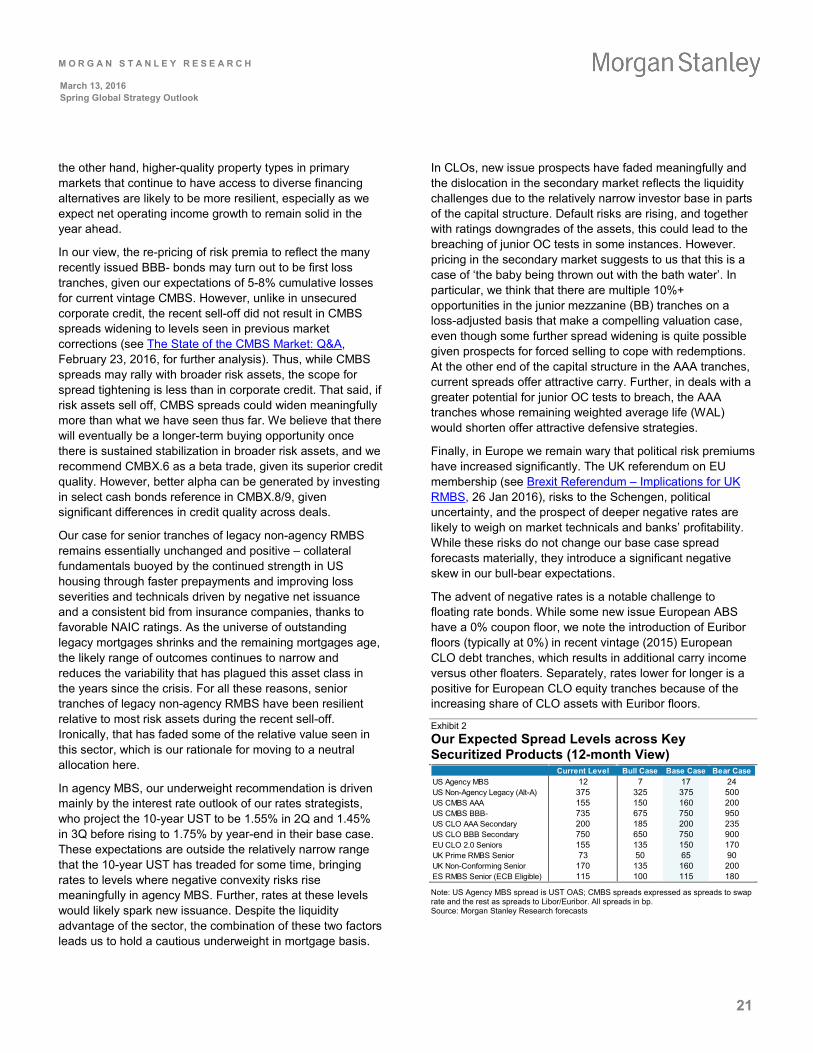
M O R G A N S T A N L E Y R E S E A R C H
21
March 13, 2016 Spring Global Strategy Outlook
the other hand, higher-quality property types in primary markets that continue to have access to diverse financing alternatives are likely to be more resilient, especially as we expect net operating income growth to remain solid in the year ahead.
In our view, the re-pricing of risk premia to reflect the many recently issued BBB- bonds may turn out to be first loss tranches, given our expectations of 5-8% cumulative losses for current vintage CMBS. However, unlike in unsecured corporate credit, the recent sell-off did not result in CMBS spreads widening to levels seen in previous market corrections (see The State of the CMBS Market: Q&A, February 23, 2016, for further analysis). Thus, while CMBS spreads may rally with broader risk assets, the scope for spread tightening is less than in corporate credit. That said, if risk assets sell off, CMBS spreads could widen meaningfully more than what we have seen thus far. We believe that there will eventually be a longer-term buying opportunity once there is sustained stabilization in broader risk assets, and we recommend CMBX.6 as a beta trade, given its superior credit quality. However, better alpha can be generated by investing in select cash bonds reference in CMBX.8/9, given significant differences in credit quality across deals.
Our case for senior tranches of legacy non-agency RMBS remains essentially unchanged and positive – collateral fundamentals buoyed by the continued strength in US housing through faster prepayments and improving loss severities and technicals driven by negative net issuance and a consistent bid from insurance companies, thanks to favorable NAIC ratings. As the universe of outstanding legacy mortgages shrinks and the remaining mortgages age, the likely range of outcomes continues to narrow and reduces the variability that has plagued this asset class in the years since the crisis. For all these reasons, senior tranches of legacy non-agency RMBS have been resilient relative to most risk assets during the recent sell-off. Ironically, that has faded some of the relative value seen in this sector, which is our rationale for moving to a neutral allocation here.
In agency MBS, our underweight recommendation is driven mainly by the interest rate outlook of our rates strategists, who project the 10-year UST to be 1.55% in 2Q and 1.45% in 3Q before rising to 1.75% by year-end in their base case. These expectations are outside the relatively narrow range that the 10-year UST has treaded for some time, bringing rates to levels where negative convexity risks rise meaningfully in agency MBS. Further, rates at these levels would likely spark new issuance. Despite the liquidity advantage of the sector, the combination of these two factors leads us to hold a cautious underweight in mortgage basis.
In CLOs, new issue prospects have faded meaningfully and the dislocation in the secondary market reflects the liquidity challenges due to the relatively narrow investor base in parts of the capital structure. Default risks are rising, and together with ratings downgrades of the assets, this could lead to the breaching of junior OC tests in some instances. However. pricing in the secondary market suggests to us that this is a case of ‘the baby being thrown out with the bath water’. In particular, we think that there are multiple 10%+ opportunities in the junior mezzanine (BB) tranches on a loss-adjusted basis that make a compelling valuation case, even though some further spread widening is quite possible given prospects for forced selling to cope with redemptions. At the other end of the capital structure in the AAA tranches, current spreads offer attractive carry. Further, in deals with a greater potential for junior OC tests to breach, the AAA tranches whose remaining weighted average life (WAL) would shorten offer attractive defensive strategies.
Finally, in Europe we remain wary that political risk premiums have increased significantly. The UK referendum on EU membership (see Brexit Referendum – Implications for UK RMBS, 26 Jan 2016), risks to the Schengen, political uncertainty, and the prospect of deeper negative rates are likely to weigh on market technicals and banks’ profitability. While these risks do not change our base case spread forecasts materially, they introduce a significant negative skew in our bull-bear expectations.
The advent of negative rates is a notable challenge to floating rate bonds. While some new issue European ABS have a 0% coupon floor, we note the introduction of Euribor floors (typically at 0%) in recent vintage (2015) European CLO debt tranches, which results in additional carry income versus other floaters. Separately, rates lower for longer is a positive for European CLO equity tranches because of the increasing share of CLO assets with Euribor floors.
Exhibit 2 Our Expected Spread Levels across Key Securitized Products (12-month View)
Note: US Agency MBS spread is UST OAS; CMBS spreads expressed as spreads to swap rate and the rest as spreads to Libor/Euribor. All spreads in bp. Source: Morgan Stanley Research forecasts
Current Level Bull Case Base Case Bear CaseUS Agency MBS 12 7 17 24US Non-Agency Legacy (Alt-A) 375 325 375 500US CMBS AAA 155 150 160 200US CMBS BBB- 735 675 750 950US CLO AAA Secondary 200 185 200 235US CLO BBB Secondary 750 650 750 900EU CLO 2.0 Seniors 155 135 150 170UK Prime RMBS Senior 73 50 65 90UK Non-Conforming Senior 170 135 160 200ES RMBS Senior (ECB Eligible) 115 100 115 180

M O R G A N S T A N L E Y R E S E A R C H
22
March 13, 2016 Spring Global Strategy Outlook
Crude Oil: Low and Range-bound Through Mid-17Adam Longson Energy Commodity Strategy
Plenty of risks in oil markets. Despite increasingly bullish rhetoric, oil fundamentals remain challenged. US supply is falling, but the poor GDP backdrop suggests we won’t see enough fundamental improvement to correct the oversupply in 2016. Rather, our macro forecasts suggest that 1) fundamentals may disappoint in 2H16, just as the imbalance is expected to improve, and 2) FX markets may create renewed headwinds for oil prices later this year. In the interim, prices can rally on headlines and a USD pullback, but upside should be limited by bloated global inventories and producer hedging.
As long as markets are oversupplied, marginal changes in fundamentals do not tend to drive changes in oil prices. The supply-demand balance only indicates when the market will rebalance, not the price. For now, prices are driven by headlines, positioning and FX (i.e., the trade-weighted USD). This lack of fundamental connection to flat price has been demonstrated repeatedly over the past year. In fact, a large portion of the recent melt-up is a result of USD depreciation, along with macro and OPEC headlines (i.e., a reversal of trends that drove the selloff early in the year), rather than material fundamental changes. With oversupply likely to persist into early 2017, we do not expect this paradigm to change any time soon. For more on our oil pricing framework through the cycle, see Cross-Asset Insights: Oil – The Implications of Lower for Longer (Update) (04 Feb 2016)).
The 2015 oil rally offers a warning. In Mar/Apr 2015, disappointing US data and dovish Fed commentary led to a notable USD pullback and oil price rally. A coincident fall in rig count and low quality weekly US production figures led to a false bullish confirmation bias among investors, even as OPEC supply was rising and US producers were hedging. By June, EM currency devaluations drove trade-weighted USD appreciation (not DXY) and a retest of prior price lows. With our economists calling for RMB depreciation in 3Q16, and our FX team bullish the USD, oil could face a similar fate in 2016.
Exhibit 1 MS Average Brent Price Forecasts ($/bbl)
Source: Morgan Stanley Commodity Research forecasts
Exhibit 2 The Trade-Weighted USD Continues to Drive a Large Share of Price Movement – An Ominous Sign (Brent vs. inverted broad trade-weighted USD)
Source: Bloomberg, Morgan Stanley Commodity Research
We see WTI trading in a $25-45 range until 2Q17. As long as the market is oversupplied (through 2Q17 in our base case), we see oil trading in a range set by several key factors.
The ceiling: Set by producer hedging and inventory overhangs. The global inventory overhang should prevent prices from rising to levels that fully encourage US supply growth, but producer hedging is likely to cap prices below those levels. Today, producers are hedging WTI in the 40s for calendar 2017 vs. $60-65 in 2Q15. This lower price tolerance is supported by desperation, lenders forcing hedging, and creative hedging structures (often selling upside calls). If 2017 WTI rises to $45+, we would expect to see more producer hedging given low hedging ratios. This selling pressure can flatten the curve, but we find it unlikely that the front month will trade above the back as long as such large inventory overhangs persist. Thus, WTI is unlikely to break the low 40s. Such hedging can also be self-defeating and have long-term consequences by providing a lifeline to producers that extends the cycle.
The floor: Lifted by OPEC chatter and investor sentiment. If the USD appreciates as our FX team expects, oil prices should fall. However, setting new lows may be difficult. First, any move back into the mid-$20 range will likely generate commentary about OPEC intervention that continues to scare off shorts. We have seen this dynamic play out recently, and
2016 2017 2018 2019 2020Avg 1Q 2Q 3Q 4Q 1Q 2Q 3Q 4Q 1Q 2Q 3Q 4QBase 35 35 30 30 30 40 52 55 55 68 75 80 85 75Bear 33 28 26 25 25 29 35 35 40 45 45 48 58 65Bull 36 47 47 50 55 60 60 72 80 90 90 90 95 90Fwd 35 42 44 45 46 47 47 48 49 49 49 50 51 52
Key Investment Ideas • Despite some better oil supply trends, slower demand
growth could delay rebalancing until mid-2017.
• We see WTI trading in a $25-45 range until the market rebalances, with the ceiling set by producer hedging.
• New headwinds may emerge by 2H16 from the USD and the potential for fundamentals to disappoint.
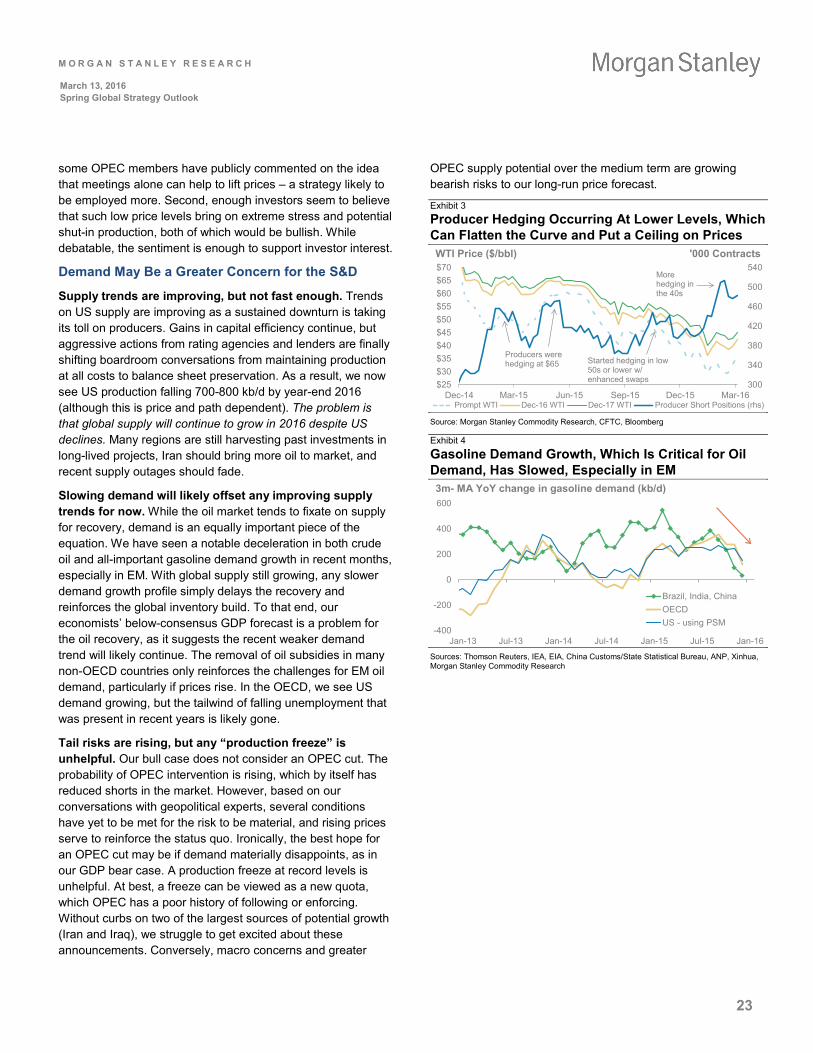
M O R G A N S T A N L E Y R E S E A R C H
23
March 13, 2016 Spring Global Strategy Outlook
some OPEC members have publicly commented on the idea that meetings alone can help to lift prices – a strategy likely to be employed more. Second, enough investors seem to believe that such low price levels bring on extreme stress and potential shut-in production, both of which would be bullish. While debatable, the sentiment is enough to support investor interest.
Demand May Be a Greater Concern for the S&D
Supply trends are improving, but not fast enough. Trends on US supply are improving as a sustained downturn is taking its toll on producers. Gains in capital efficiency continue, but aggressive actions from rating agencies and lenders are finally shifting boardroom conversations from maintaining production at all costs to balance sheet preservation. As a result, we now see US production falling 700-800 kb/d by year-end 2016 (although this is price and path dependent). The problem is that global supply will continue to grow in 2016 despite US declines. Many regions are still harvesting past investments in long-lived projects, Iran should bring more oil to market, and recent supply outages should fade.
Slowing demand will likely offset any improving supply trends for now. While the oil market tends to fixate on supply for recovery, demand is an equally important piece of the equation. We have seen a notable deceleration in both crude oil and all-important gasoline demand growth in recent months, especially in EM. With global supply still growing, any slower demand growth profile simply delays the recovery and reinforces the global inventory build. To that end, our economists’ below-consensus GDP forecast is a problem for the oil recovery, as it suggests the recent weaker demand trend will likely continue. The removal of oil subsidies in many non-OECD countries only reinforces the challenges for EM oil demand, particularly if prices rise. In the OECD, we see US demand growing, but the tailwind of falling unemployment that was present in recent years is likely gone.
Tail risks are rising, but any “production freeze” is unhelpful. Our bull case does not consider an OPEC cut. The probability of OPEC intervention is rising, which by itself has reduced shorts in the market. However, based on our conversations with geopolitical experts, several conditions have yet to be met for the risk to be material, and rising prices serve to reinforce the status quo. Ironically, the best hope for an OPEC cut may be if demand materially disappoints, as in our GDP bear case. A production freeze at record levels is unhelpful. At best, a freeze can be viewed as a new quota, which OPEC has a poor history of following or enforcing. Without curbs on two of the largest sources of potential growth (Iran and Iraq), we struggle to get excited about these announcements. Conversely, macro concerns and greater
OPEC supply potential over the medium term are growing bearish risks to our long-run price forecast.
Exhibit 3 Producer Hedging Occurring At Lower Levels, Which Can Flatten the Curve and Put a Ceiling on Prices
Source: Morgan Stanley Commodity Research, CFTC, Bloomberg
Exhibit 4 Gasoline Demand Growth, Which Is Critical for Oil Demand, Has Slowed, Especially in EM
Sources: Thomson Reuters, IEA, EIA, China Customs/State Statistical Bureau, ANP, Xinhua, Morgan Stanley Commodity Research
300
340
380
420
460
500
540
$25$30$35$40$45$50$55$60$65$70
Dec-14 Mar-15 Jun-15 Sep-15 Dec-15 Mar-16Prompt WTI Dec-16 WTI Dec-17 WTI Producer Short Positions (rhs)
WTI Price ($/bbl) '000 Contracts
Started hedging in low 50s or lower w/ enhanced swaps
Producers were hedging at $65
More hedging in the 40s
-400
-200
0
200
400
600
Jan-13 Jul-13 Jan-14 Jul-14 Jan-15 Jul-15 Jan-16
Brazil, India, ChinaOECDUS - using PSM
3m- MA YoY change in gasoline demand (kb/d)
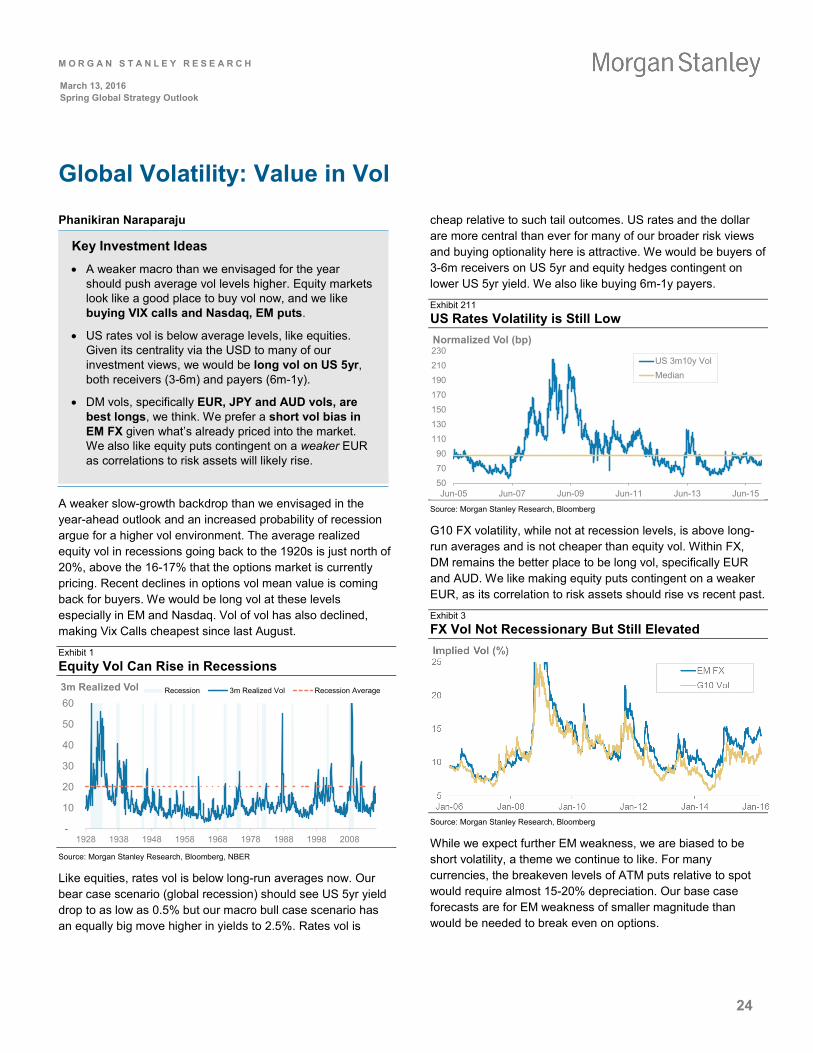
M O R G A N S T A N L E Y R E S E A R C H
24
March 13, 2016 Spring Global Strategy Outlook
Global Volatility: Value in Vol
Phanikiran Naraparaju
A weaker slow-growth backdrop than we envisaged in the year-ahead outlook and an increased probability of recession argue for a higher vol environment. The average realized equity vol in recessions going back to the 1920s is just north of 20%, above the 16-17% that the options market is currently pricing. Recent declines in options vol mean value is coming back for buyers. We would be long vol at these levels especially in EM and Nasdaq. Vol of vol has also declined, making Vix Calls cheapest since last August.
Exhibit 1 Equity Vol Can Rise in Recessions
Source: Morgan Stanley Research, Bloomberg, NBER
Like equities, rates vol is below long-run averages now. Our bear case scenario (global recession) should see US 5yr yield drop to as low as 0.5% but our macro bull case scenario has an equally big move higher in yields to 2.5%. Rates vol is
cheap relative to such tail outcomes. US rates and the dollar are more central than ever for many of our broader risk views and buying optionality here is attractive. We would be buyers of 3-6m receivers on US 5yr and equity hedges contingent on lower US 5yr yield. We also like buying 6m-1y payers.
Exhibit 211 US Rates Volatility is Still Low
Source: Morgan Stanley Research, Bloomberg
G10 FX volatility, while not at recession levels, is above long-run averages and is not cheaper than equity vol. Within FX, DM remains the better place to be long vol, specifically EUR and AUD. We like making equity puts contingent on a weaker EUR, as its correlation to risk assets should rise vs recent past.
Exhibit 3 FX Vol Not Recessionary But Still Elevated
Source: Morgan Stanley Research, Bloomberg
While we expect further EM weakness, we are biased to be short volatility, a theme we continue to like. For many currencies, the breakeven levels of ATM puts relative to spot would require almost 15-20% depreciation. Our base case forecasts are for EM weakness of smaller magnitude than would be needed to break even on options.
0.2
0.3
0.4
0.5
0.6
0.7
0.8
0.9
-
10
20
30
40
50
60
1928 1938 1948 1958 1968 1978 1988 1998 2008
3m Realized Vol Recession 3m Realized Vol Recession Average
507090
110130150170190210230
Jun-05 Jun-07 Jun-09 Jun-11 Jun-13 Jun-15
Normalized Vol (bp)
US 3m10y VolMedian
Key Investment Ideas • A weaker macro than we envisaged for the year
should push average vol levels higher. Equity markets look like a good place to buy vol now, and we like buying VIX calls and Nasdaq, EM puts.
• US rates vol is below average levels, like equities. Given its centrality via the USD to many of our investment views, we would be long vol on US 5yr, both receivers (3-6m) and payers (6m-1y).
• DM vols, specifically EUR, JPY and AUD vols, are best longs, we think. We prefer a short vol bias in EM FX given what’s already priced into the market. We also like equity puts contingent on a weaker EUR as correlations to risk assets will likely rise.

M O R G A N S T A N L E Y R E S E A R C H
25
March 13, 2016 Spring Global Strategy Outlook
What We Debated
Andrew Sheets
This Outlook involved multiple discussions with the entire Morgan Stanley Global Economic and Strategy team. Much of what we debate doesn’t make it into the final version. In the hopes that it helps your investment process, here is what we left on the cutting room floor. - The Global Macro Research Team
How Below-Consensus on Growth? Making growth forecasts is straightforward. Quantifying where these sit versus the ‘market’ is less so. While our forecasts sit comfortably below the Bloomberg Consensus, one risk that was raised is that the difference could diminish as others refresh their numbers over the coming months. Details also matter. We are materially below consensus on overall US growth, but probably in line (or a bit above) on private consumption, with the downside instead coming from government and net trade.
Are we selling enough stocks or buying enough bonds? On our new global strategy forecasts, there is more upside over the next 6 months for government bonds than over the next 12 months for equities. That doesn’t happen often, and on its own would argue to move underweight equities and overweight bonds. We haven’t followed this, in part because of contradictory messages from other parts of our cross-asset framework (long-run valuations, cycle models). But it was debated, with a number arguing for being more cautious.
Why isn’t this a repeat of last spring’s ‘Reflation’ Trade? 2015 also began with intense fears around growth, deflation and commodity prices, before seeing all reverse in a ‘reflation’ trade that lasted through mid-year. A majority felt this was unlikely to repeat, given greater risks to China policy, weaker US growth forecasts, and the risks from negative rate policy.
Doesn’t poor liquidity undermine the argument for Credit over Equities? Liquidity in credit markets remains poor. But we worry less about it for two reasons. First, we see little historical evidence that buying assets when liquidity is good (2000, 2006, 2010) works all that well. Better valuations and poor liquidity, unfortunately, often go together. Second, despite extreme levels of stress (the VIX hitting 53, sizeable credit outflows, the worst start to a year for US equities since 1928), we haven’t seen the breakdown in bond pricing that many envisioned when speaking of market liquidity.
And there is the irony. It has often been more-liquid equity markets that were punished for the poor liquidity elsewhere. In August, large US equities opened down -20% and traded there. The Nikkei fell 12% while the rest of Asia was closed for New Year’s. This is one reason we prefer credit over equities, despite the liquidity difference.
Why is US the preferred equity region? The US was our preferred equity region in our 2016 Outlook, and some question whether it should remain so given the valuation premium. We keep the US on top, given a) its higher quality mix amidst a challenging macro outlook, b) skepticism that measures like Cyclically-Adjusted P/E, which are more favorable to Europe and EM, adequately correct for outsized earnings by financials and commodities over their respective super-cycles, c) concerns around political risk in Europe and policy risk in China.
How does the USD go up, and the EUR go down, when our GDP forecasts are the other way round? Several questioned whether our FX forecasts weren’t inconsistent with our economic expectations. Despite being above consensus on Eurozone growth, and below consensus on US and Japanese growth, we have the USD and JPY substantially outperforming the EUR.
The answer, put briefly, is that we expect factors other than growth differentials to be the primary driver for the USD, JPY, and EUR. For the USD and JPY, we see supportive flows. For the EUR, we see larger risk premiums for political uncertainty.
Are we missing a bigger turning point in Commodities/EM? As with prior recent Outlooks, we discussed whether it was time to close long-held underweights in EM Equities and FX, especially given the strong relative performance of EM Equities YTD, and the ongoing bounce in Energy and Metals prices.
We concluded that this was a bounce that we wanted to fade. We remain below consensus on EM GDP growth over the next 18 months. We believe that the USD remains in a secular bull market. And the view of our commodity team is that the price rebound in Energy and Metals will moderate as excess supply and hedging demand limit upside. This said, we do see pockets of EM with good outright return potential, including EM Sovereign Credit and Korean & Taiwan Equities.
Is there a Bull Case? It was a general consensus among the group that markets face a negative skew of outcomes. There seem to be multiple catalysts for multiple de-rating (the rising risk of global recession, European politics, China currency policy), while the group saw limited opportunity for re-rating in a world of subdued earnings growth.
It is fair to say that a resumption of earnings growth would be a risk to our cautious equity view. Were currency markets to prove more stable, and earnings from the Energy sector to flatten out, there is a risk that headline earnings growth could look better than it does today. This is something we will need to watch for when we get 1Q numbers in April.
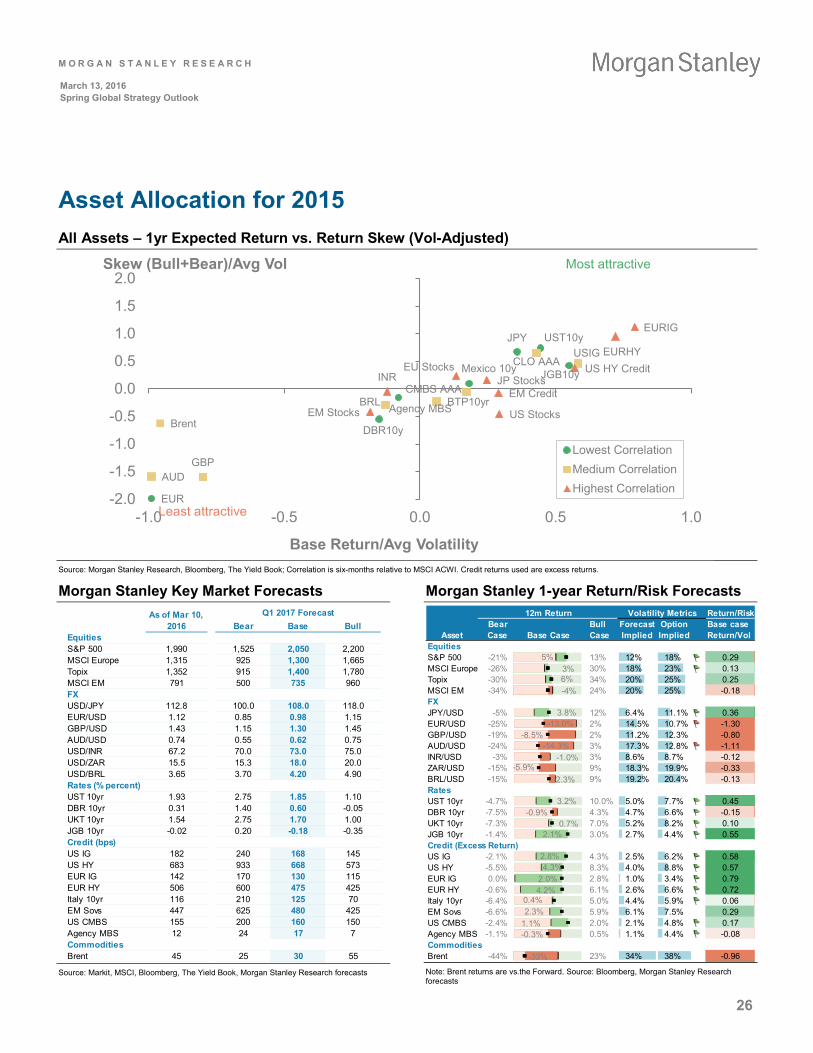
M O R G A N S T A N L E Y R E S E A R C H
26
March 13, 2016 Spring Global Strategy Outlook
Asset Allocation for 2015 All Assets – 1yr Expected Return vs. Return Skew (Vol-Adjusted)
Source: Morgan Stanley Research, Bloomberg, The Yield Book; Correlation is six-months relative to MSCI ACWI. Credit returns used are excess returns.
Morgan Stanley Key Market Forecasts
Source: Markit, MSCI, Bloomberg, The Yield Book, Morgan Stanley Research forecasts
Morgan Stanley 1-year Return/Risk Forecasts
Note: Brent returns are vs.the Forward. Source: Bloomberg, Morgan Stanley Research forecasts
UST10yJPY
Agency MBS
DBR10y
EUR
JGB10yMexico 10y
GBP
USIG
AUD
Brent
BRLCMBS AAA
BTP10yr
CLO AAAINR
EURIG
EURHY
JP StocksEM Credit
US HY Credit
EM Stocks
EU Stocks
US Stocks
-2.0
-1.5
-1.0
-0.5
0.0
0.5
1.0
1.5
2.0
-1.0 -0.5 0.0 0.5 1.0
Base Return/Avg Volatility
Skew (Bull+Bear)/Avg Vol
Lowest CorrelationMedium CorrelationHighest Correlation
Least attractive
Most attractive
Bear Base BullEquitiesS&P 500 1,990 1,525 2,050 2,200MSCI Europe 1,315 925 1,300 1,665Topix 1,352 915 1,400 1,780MSCI EM 791 500 735 960FXUSD/JPY 112.8 100.0 108.0 118.0EUR/USD 1.12 0.85 0.98 1.15GBP/USD 1.43 1.15 1.30 1.45AUD/USD 0.74 0.55 0.62 0.75USD/INR 67.2 70.0 73.0 75.0USD/ZAR 15.5 15.3 18.0 20.0USD/BRL 3.65 3.70 4.20 4.90Rates (% percent)UST 10yr 1.93 2.75 1.85 1.10DBR 10yr 0.31 1.40 0.60 -0.05UKT 10yr 1.54 2.75 1.70 1.00JGB 10yr -0.02 0.20 -0.18 -0.35Credit (bps)US IG 182 240 168 145US HY 683 933 668 573EUR IG 142 170 130 115EUR HY 506 600 475 425Italy 10yr 116 210 125 70EM Sovs 447 625 480 425US CMBS 155 200 160 150Agency MBS 12 24 17 7CommoditiesBrent 45 25 30 55
As of Mar 10, 2016
Q1 2017 Forecast 12m Return Return/Risk
AssetBear Case Base Case
Bull Case
Forecast Implied
Option Implied
Base case Return/Vol
EquitiesS&P 500 -21% 13% 12% 18% 0.29MSCI Europe -26% 30% 18% 23% 0.13Topix -30% 34% 20% 25% 0.25MSCI EM -34% 24% 20% 25% -0.18FX JPY/USD -5% 12% 6.4% 11.1% 0.36EUR/USD -25% 2% 14.5% 10.7% -1.30GBP/USD -19% 2% 11.2% 12.3% -0.80AUD/USD -24% 3% 17.3% 12.8% -1.11INR/USD -3% 3% 8.6% 8.7% -0.12ZAR/USD -15% 9% 18.3% 19.9% -0.33BRL/USD -15% 9% 19.2% 20.4% -0.13Rates UST 10yr -4.7% 10.0% 5.0% 7.7% 0.45DBR 10yr -7.5% 4.3% 4.7% 6.6% -0.15UKT 10yr -7.3% 7.0% 5.2% 8.2% 0.10JGB 10yr -1.4% 3.0% 2.7% 4.4% 0.55Credit (Excess Return)US IG -2.1% 4.3% 2.5% 6.2% 0.58US HY -5.5% 8.3% 4.0% 8.8% 0.57EUR IG 0.0% 2.8% 1.0% 3.4% 0.79EUR HY -0.6% 6.1% 2.6% 6.6% 0.72Italy 10yr -6.4% 5.0% 4.4% 5.9% 0.06EM Sovs -6.6% 5.9% 6.1% 7.5% 0.29US CMBS -2.4% 2.0% 2.1% 4.8% 0.17Agency MBS -1.1% 0.5% 1.1% 4.4% -0.08CommoditiesBrent -44% 23% 34% 38% -0.96
Volatility Metrics
5% 3% 6% -4%
3.8% -13.0%
-8.5%
3.2% -0.9%
0.7% 2.1%
0.4%
2.8% 4.3%
-0.3%
-14.3%
-2.3%
4.2%
2.3% 1.1%
2.0%
-5.9%
-33%
-1.0%

M O R G A N S T A N L E Y R E S E A R C H
27
March 13, 2016 Spring Global Strategy Outlook
Current Morgan Stanley Asset Allocations
We hold a modest overweight in credit (+1 on the five-point scale from -2 to +2). This adds a +1% weight for each asset (US, Europe, EM, securitized), relative to benchmark. Next, we make adjustments based on sector-specific views. US Corp. is a key Overweight within credit (+2 on the five-point scale), raising its allocation by +2%. Combined with the strategic overweight of +1%, this nets to a 3% deviation from benchmark.
Text in grey represents the change vs. previous allocation.
Source: Morgan Stanley Research
What’s in Our Benchmark?
Note: * MS constant-weighted basket of 10yr Local bonds. Source: Morgan Stanley Research
- +Equites -1% -3% -1% -3%
US +1% -1% +1% -1%Europe -1% -1% -1% -1%Japan -1% -1%EM -1% -1%
- +Govt. Bonds -8% +3% -8% +3%
Treasuries -2% +2% +2% +2%Bunds -2% -2% -4%JGBs -2% -1% +1% -3% +1%EM Local -2% +1% -1%
- +Credit +4% +2% -1% +6% -1%
US Corp. +1% +2% +3%EU Corp. +1% -1% +1% -1%EM Sov. +1% +1% +2%Securitized +1% -1%
- +Other +3% +1%
Cash +3% +1%
Top-DownAllocation
Relative Allocation
O/W vs.Benchmark
MS Asset Allocation Views
CurrentPrevious
Asset Sub-Asset Weight Returns Index Sub-Weights
US Equities 25% SPX Index 25.0%European Equities 10% MSCI Europe 10.0%Japan Equities 5% TOPIX 5.0%EM Equities 10% MSCI EM 10.0%US Rates 10% UST 10yr 10.0%European Rates 10% DBR 10yr 10.0%Japan Rates 5% JGB 10yr 5.0%EM Local 5% MS EM Local Index* 5.0%
US BIG Corp index (Yield Book) 4.0%US HY Market (Yield Book) 2.0%iBoxx EUR IG Corporate Index 2.0%iBoxx EUR HY Index 1.0%
EM Sovereigns 3% EMBI Global Index 3.0%Agency MBS 0.75%Non-Agency MBS 0.75%CLO 0.75%CMBS 0.75%
Commodities 2% Bloomberg Commodity Index 2.0%Cash 3% US Libor 1m 3.0%
Other
Equities
Rates
Credit
US Corporates 6%
European Corporates 3%
Securitized Credit 3%
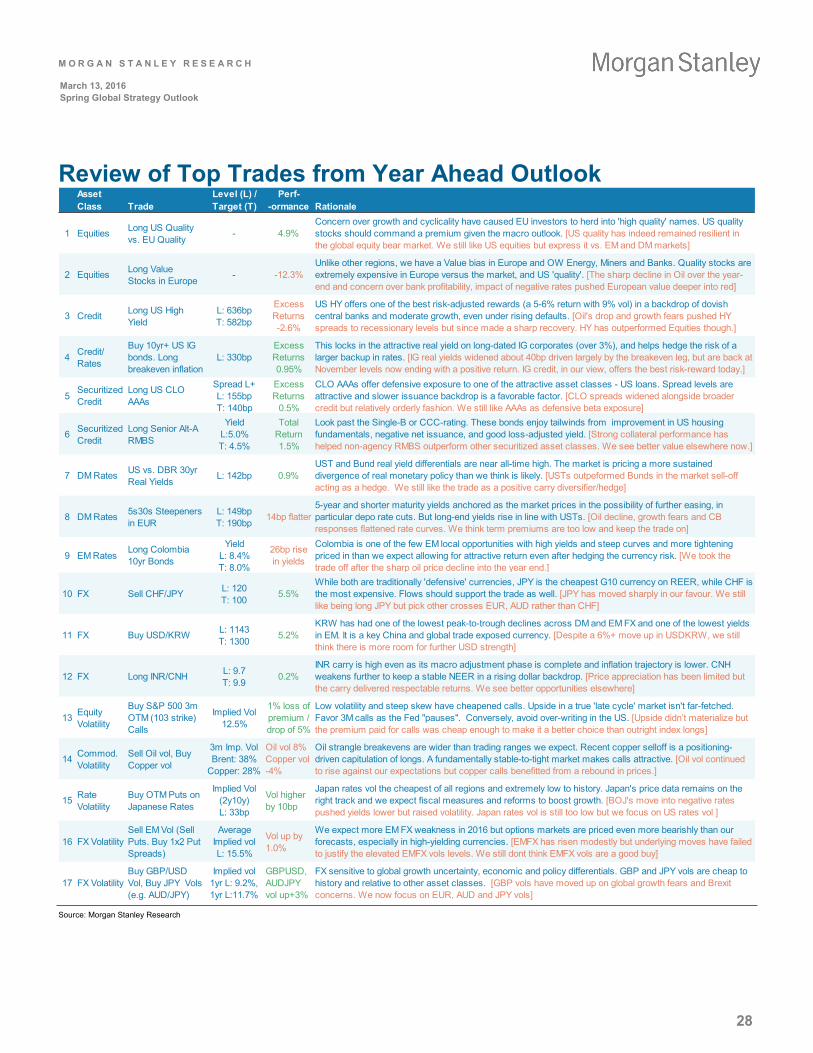
M O R G A N S T A N L E Y R E S E A R C H
28
March 13, 2016 Spring Global Strategy Outlook
Review of Top Trades from Year Ahead Outlook
Source: Morgan Stanley Research
Level (L) / Perf-Trade Target (T) -ormance Rationale
1 Equities Long US Quality vs. EU Quality
- 4.9%Concern over growth and cyclicality have caused EU investors to herd into 'high quality' names. US quality stocks should command a premium given the macro outlook. [US quality has indeed remained resilient in the global equity bear market. We still like US equities but express it vs. EM and DM markets]
2 Equities Long Value Stocks in Europe
- -12.3%Unlike other regions, we have a Value bias in Europe and OW Energy, Miners and Banks. Quality stocks are extremely expensive in Europe versus the market, and US 'quality'. [The sharp decline in Oil over the year-end and concern over bank profitability, impact of negative rates pushed European value deeper into red]
3 Credit Long US High Yield
L: 636bp T: 582bp
Excess Returns -2.6%
US HY offers one of the best risk-adjusted rewards (a 5-6% return with 9% vol) in a backdrop of dovish central banks and moderate growth, even under rising defaults. [Oil's drop and growth fears pushed HY spreads to recessionary levels but since made a sharp recovery. HY has outperformed Equities though.]
4 Credit/ Rates
Buy 10yr+ US IG bonds. Long breakeven inflation
L: 330bp Excess Returns 0.95%
This locks in the attractive real yield on long-dated IG corporates (over 3%), and helps hedge the risk of a larger backup in rates. [IG real yields widened about 40bp driven largely by the breakeven leg, but are back at November levels now ending with a positive return. IG credit, in our view, offers the best risk-reward today.]
5Securitized Credit
Long US CLO AAAs
Spread L+ L: 155bp T: 140bp
Excess Returns
0.5%
CLO AAAs offer defensive exposure to one of the attractive asset classes - US loans. Spread levels are attractive and slower issuance backdrop is a favorable factor. [CLO spreads widened alongside broader credit but relatively orderly fashion. We still like AAAs as defensive beta exposure]
6 Securitized Credit
Long Senior Alt-A RMBS
Yield L:5.0% T: 4.5%
Total Return 1.5%
Look past the Single-B or CCC-rating. These bonds enjoy tailwinds from improvement in US housing fundamentals, negative net issuance, and good loss-adjusted yield. [Strong collateral performance has helped non-agency RMBS outperform other securitized asset classes. We see better value elsewhere now.]
7 DM Rates US vs. DBR 30yr Real Yields
L: 142bp 0.9%UST and Bund real yield differentials are near all-time high. The market is pricing a more sustained divergence of real monetary policy than we think is likely. [USTs outpeformed Bunds in the market sell-off acting as a hedge. We still like the trade as a positive carry diversifier/hedge]
8 DM Rates 5s30s Steepeners in EUR
L: 149bp T: 190bp
14bp flatter5-year and shorter maturity yields anchored as the market prices in the possibility of further easing, in particular depo rate cuts. But long-end yields rise in line with USTs. [Oil decline, growth fears and CB responses flattened rate curves. We think term premiums are too low and keep the trade on]
9 EM RatesLong Colombia 10yr Bonds
Yield L: 8.4% T: 8.0%
26bp rise in yields
Colombia is one of the few EM local opportunities with high yields and steep curves and more tightening priced in than we expect allowing for attractive return even after hedging the currency risk. [We took the trade off after the sharp oil price decline into the year end.]
10 FX Sell CHF/JPY L: 120 T: 100
5.5%While both are traditionally 'defensive' currencies, JPY is the cheapest G10 currency on REER, while CHF is the most expensive. Flows should support the trade as well. [JPY has moved sharply in our favour. We still like being long JPY but pick other crosses EUR, AUD rather than CHF]
11 FX Buy USD/KRW L: 1143 T: 1300
5.2%KRW has had one of the lowest peak-to-trough declines across DM and EM FX and one of the lowest yields in EM. It is a key China and global trade exposed currency. [Despite a 6%+ move up in USDKRW, we still think there is more room for further USD strength]
12 FX Long INR/CNH L: 9.7 T: 9.9
0.2%INR carry is high even as its macro adjustment phase is complete and inflation trajectory is lower. CNH weakens further to keep a stable NEER in a rising dollar backdrop. [Price appreciation has been limited but the carry delivered respectable returns. We see better opportunities elsewhere]
13 Equity Volatility
Buy S&P 500 3m OTM (103 strike) Calls
Implied Vol 12.5%
1% loss of premium / drop of 5%
Low volatility and steep skew have cheapened calls. Upside in a true 'late cycle' market isn't far-fetched. Favor 3M calls as the Fed "pauses". Conversely, avoid over-writing in the US. [Upside didn’t materialize but the premium paid for calls was cheap enough to make it a better choice than outright index longs]
14 Commod. Volatility
Sell Oil vol, Buy Copper vol
3m Imp. Vol Brent: 38%
Copper: 28%
Oil vol 8% Copper vol -4%
Oil strangle breakevens are wider than trading ranges we expect. Recent copper selloff is a positioning-driven capitulation of longs. A fundamentally stable-to-tight market makes calls attractive. [Oil vol continued to rise against our expectations but copper calls benefitted from a rebound in prices.]
15 Rate Volatility
Buy OTM Puts on Japanese Rates
Implied Vol (2y10y) L: 33bp
Vol higher by 10bp
Japan rates vol the cheapest of all regions and extremely low to history. Japan's price data remains on the right track and we expect fiscal measures and reforms to boost growth. [BOJ's move into negative rates pushed yields lower but raised volatility. Japan rates vol is still too low but we focus on US rates vol ]
16 FX VolatilitySell EM Vol (Sell Puts. Buy 1x2 Put Spreads)
Average Implied vol L: 15.5%
Vol up by 1.0%
We expect more EM FX weakness in 2016 but options markets are priced even more bearishly than our forecasts, especially in high-yielding currencies. [EMFX has risen modestly but underlying moves have failed to justify the elevated EMFX vols levels. We still dont think EMFX vols are a good buy]
17 FX VolatilityBuy GBP/USD Vol, Buy JPY Vols (e.g. AUD/JPY)
Implied vol 1yr L: 9.2%, 1yr L:11.7%
GBPUSD, AUDJPY vol up+3%
FX sensitive to global growth uncertainty, economic and policy differentials. GBP and JPY vols are cheap to history and relative to other asset classes. [GBP vols have moved up on global growth fears and Brexit concerns. We now focus on EUR, AUD and JPY vols]
Asset Class

M O R G A N S T A N L E Y R E S E A R C H
29
March 13, 2016 Spring Global Strategy Outlook
Morgan Stanley Key Economic Forecasts Global Economics Team
Note: Global and regional aggregates for GDP growth are GDP-weighted averages, using PPPs; Japan CPI includes VAT; Japan policy rate is the interest rate on excess reserves; CPI numbers are period averages. *For GDP, Global includes G10, BRICs and Korea. For Consumer Price Inflation aggregates, Global and EM exclude Venezuela and Argentina. **US tracking estimate Source: IMF, Morgan Stanley Research forecasts
Quarterly2015 2016 2017 2015 2016E 2017E
Real GDP (%Q, SAAR) 1Q 2Q 3Q 4Q 1Qe 2Qe 3Qe 4Qe 1Qe 2Qe 3Qe 4QeGlobal* 2.7 3.3 3.1 2.3 2.5 3.1 3.4 3.4 3.4 3.1 3.4 3.4 3.1 3.0 3.4 G10 1.7 2.2 1.8 1.0 1.4 1.4 1.9 1.9 1.9 1.0 1.5 1.6 1.9 1.5 1.6 US 0.6 3.9 2.0 1.1 1.5 1.5 1.8 1.7 1.6 1.6 1.5 1.4 2.4 1.7 1.6 Euro Area 2.3 1.6 1.2 1.3 1.4 1.6 2.0 2.0 1.8 1.6 1.6 1.6 1.5 1.5 1.8 Japan 4.6 -1.4 1.4 -1.1 1.2 0.8 1.6 1.9 2.6 -4.5 0.0 1.2 0.5 0.6 0.5 UK 1.7 2.4 1.7 1.9 1.5 0.8 2.5 2.0 2.4 2.4 2.5 2.5 2.2 1.7 2.3 EM (%Y) 4.3 4.1 4.1 3.9 3.9 4.1 4.0 4.2 4.7 4.6 4.7 4.8 4.1 4.0 4.7 China 7.0 7.0 6.9 6.8 6.7 6.5 6.4 6.4 6.5 6.5 6.4 6.3 6.9 6.5 6.4 India 6.7 7.6 7.7 7.3 7.3 7.4 7.6 7.7 7.8 7.7 7.7 7.8 7.3 7.5 7.7 Brazil -2.0 -3.0 -4.5 -5.9 -6.2 -5.1 -3.6 -2.5 0.5 0.6 0.9 0.6 -3.8 -4.3 0.6 Russia -2.2 -4.6 -4.1 -3.8 -3.0 -2.1 -2.0 -1.5 -0.2 0.7 1.2 1.6 -3.7 -2.1 0.9
Consumer price inflation (%Y)Global* 2.4 2.6 2.5 2.6 2.6 2.3 2.4 2.6 2.7 2.8 2.8 2.7 2.5 2.5 2.8 G10 0.2 0.2 0.2 0.4 0.6 0.5 0.8 1.1 1.6 1.9 2.0 2.0 0.2 0.8 1.9 US -0.1 0.0 0.1 0.4 1.0 1.1 1.2 1.5 1.9 1.9 1.9 1.9 0.1 1.2 1.9 Euro Area -0.3 0.2 0.1 0.2 0.0 -0.2 0.3 0.9 1.6 1.8 1.8 1.8 0.0 0.2 1.7 Japan 2.3 0.5 0.2 0.3 0.0 -0.5 -0.4 0.0 0.5 2.3 2.6 2.7 0.8 -0.2 2.0 UK 0.1 0.0 0.0 0.1 0.4 0.6 0.9 1.3 1.6 1.7 1.8 1.8 0.0 0.8 1.7 EM 4.1 4.4 4.4 4.4 4.1 3.7 3.6 3.6 3.6 3.5 3.4 3.3 4.3 3.8 3.4 China 1.2 1.4 1.7 1.5 1.6 1.2 0.8 1.0 1.0 1.1 1.1 1.1 1.4 1.1 1.1 India 5.3 5.1 3.9 5.3 5.5 5.1 4.9 4.7 4.8 4.8 4.4 4.2 4.9 5.0 4.5 Brazil 7.7 8.5 9.5 10.4 10.3 9.3 8.9 8.3 7.5 7.3 7.1 7.0 9.0 9.2 7.2 Russia 16.2 15.8 15.7 14.5 8.6 8.8 9.3 8.8 8.1 7.3 6.9 6.7 15.6 8.9 7.3
Monetary policy rate (% p.a.)Global 3.5 3.3 3.2 3.2 3.2 3.1 3.0 3.1 3.0 3.0 3.0 3.0 3.2 3.1 3.0G10 0.1 0.1 0.1 0.2 0.1 0.1 0.1 0.2 0.2 0.3 0.3 0.4 0.2 0.2 0.4 US 0.125 0.125 0.125 0.375 0.375 0.375 0.375 0.625 0.625 0.875 0.875 1.125 0.375 0.625 1.125 Euro Area -0.20 -0.20 -0.20 -0.30 -0.40 -0.40 -0.50 -0.50 -0.50 -0.50 -0.50 -0.50 -0.30 -0.50 -0.50 Japan 0.10 0.10 0.10 0.10 -0.10 -0.30 -0.30 -0.30 -0.30 -0.30 -0.30 -0.30 0.10 -0.30 -0.30 UK 0.50 0.50 0.50 0.50 0.50 0.50 0.50 0.50 0.75 0.75 1.00 1.00 0.50 0.50 1.00EM 6.30 5.90 5.70 5.70 5.70 5.60 5.50 5.40 5.30 5.20 5.20 5.20 5.70 5.40 5.20 China 5.35 4.85 4.60 4.35 4.35 4.35 4.10 4.10 3.85 3.85 3.85 3.85 4.35 4.10 3.85 India 7.50 7.25 6.75 6.75 6.75 6.50 6.50 6.50 6.50 6.50 6.50 6.75 6.75 6.50 6.75 Brazil 12.75 13.75 14.25 14.25 14.25 14.25 14.25 14.25 14.25 14.25 14.25 13.25 14.25 14.25 13.25 Russia 14.00 11.50 11.00 11.00 11.00 11.00 10.50 10.00 9.00 8.50 8.00 7.50 11.00 10.00 7.50
Annual
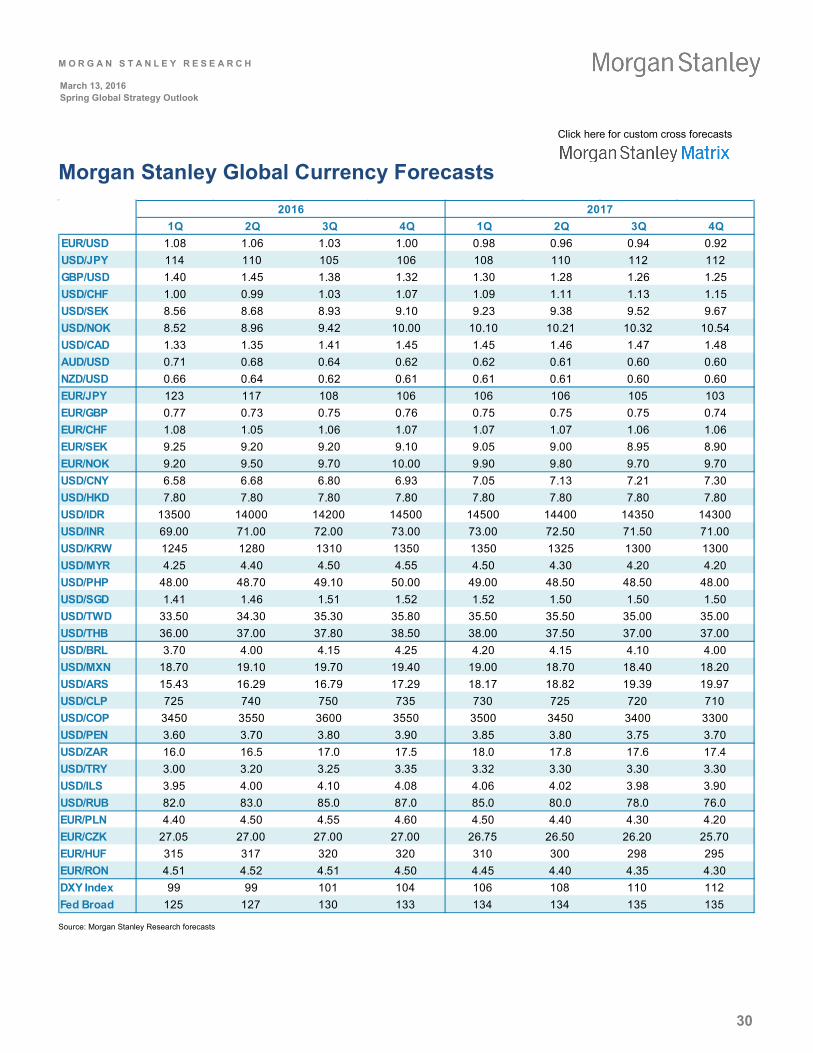
M O R G A N S T A N L E Y R E S E A R C H
30
March 13, 2016 Spring Global Strategy Outlook
Morgan Stanley Global Currency Forecasts
Source: Morgan Stanley Research forecasts
2016 20171Q 2Q 3Q 4Q 1Q 2Q 3Q 4Q
EUR/USD 1.08 1.06 1.03 1.00 0.98 0.96 0.94 0.92USD/JPY 114 110 105 106 108 110 112 112GBP/USD 1.40 1.45 1.38 1.32 1.30 1.28 1.26 1.25USD/CHF 1.00 0.99 1.03 1.07 1.09 1.11 1.13 1.15USD/SEK 8.56 8.68 8.93 9.10 9.23 9.38 9.52 9.67USD/NOK 8.52 8.96 9.42 10.00 10.10 10.21 10.32 10.54USD/CAD 1.33 1.35 1.41 1.45 1.45 1.46 1.47 1.48AUD/USD 0.71 0.68 0.64 0.62 0.62 0.61 0.60 0.60NZD/USD 0.66 0.64 0.62 0.61 0.61 0.61 0.60 0.60EUR/JPY 123 117 108 106 106 106 105 103EUR/GBP 0.77 0.73 0.75 0.76 0.75 0.75 0.75 0.74EUR/CHF 1.08 1.05 1.06 1.07 1.07 1.07 1.06 1.06EUR/SEK 9.25 9.20 9.20 9.10 9.05 9.00 8.95 8.90EUR/NOK 9.20 9.50 9.70 10.00 9.90 9.80 9.70 9.70USD/CNY 6.58 6.68 6.80 6.93 7.05 7.13 7.21 7.30USD/HKD 7.80 7.80 7.80 7.80 7.80 7.80 7.80 7.80USD/IDR 13500 14000 14200 14500 14500 14400 14350 14300USD/INR 69.00 71.00 72.00 73.00 73.00 72.50 71.50 71.00USD/KRW 1245 1280 1310 1350 1350 1325 1300 1300USD/MYR 4.25 4.40 4.50 4.55 4.50 4.30 4.20 4.20USD/PHP 48.00 48.70 49.10 50.00 49.00 48.50 48.50 48.00USD/SGD 1.41 1.46 1.51 1.52 1.52 1.50 1.50 1.50USD/TWD 33.50 34.30 35.30 35.80 35.50 35.50 35.00 35.00USD/THB 36.00 37.00 37.80 38.50 38.00 37.50 37.00 37.00USD/BRL 3.70 4.00 4.15 4.25 4.20 4.15 4.10 4.00USD/MXN 18.70 19.10 19.70 19.40 19.00 18.70 18.40 18.20USD/ARS 15.43 16.29 16.79 17.29 18.17 18.82 19.39 19.97USD/CLP 725 740 750 735 730 725 720 710USD/COP 3450 3550 3600 3550 3500 3450 3400 3300USD/PEN 3.60 3.70 3.80 3.90 3.85 3.80 3.75 3.70USD/ZAR 16.0 16.5 17.0 17.5 18.0 17.8 17.6 17.4USD/TRY 3.00 3.20 3.25 3.35 3.32 3.30 3.30 3.30USD/ILS 3.95 4.00 4.10 4.08 4.06 4.02 3.98 3.90USD/RUB 82.0 83.0 85.0 87.0 85.0 80.0 78.0 76.0EUR/PLN 4.40 4.50 4.55 4.60 4.50 4.40 4.30 4.20EUR/CZK 27.05 27.00 27.00 27.00 26.75 26.50 26.20 25.70EUR/HUF 315 317 320 320 310 300 298 295EUR/RON 4.51 4.52 4.51 4.50 4.45 4.40 4.35 4.30DXY Index 99 99 101 104 106 108 110 112Fed Broad 125 127 130 133 134 134 135 135
Click here for custom cross forecasts

M O R G A N S T A N L E Y R E S E A R C H
31
March 13, 2016 Spring Global Strategy Outlook
Morgan Stanley Government Bond Yield / Spread Forecasts
*Yield spread to Bunds Source: Morgan Stanley Research forecasts
10-Year 1Q16 2Q16 3Q16 4Q16 1Q17US 1.93 1.55 1.45 1.75 1.85Germany 0.31 0.15 0.10 0.55 0.60Japan -0.02 -0.15 -0.23 -0.20 -0.18UK 1.54 1.35 1.25 1.50 1.70Australia 2.50 2.25 2.10 2.35 2.45New Zealand 3.06 2.80 2.60 2.70 2.80Austria* 24 25 28 28 30Netherlands* 11 10 12 12 15France* 38 35 37 40 42Belgium* 41 38 45 50 52Ireland* 64 65 70 75 80Spain* 128 120 135 140 150Italy* 116 100 115 120 125Portugal* 283 260 280 300 315
10-Year 1Q16 2Q16 3Q16 4Q16 1Q17Russia 9.50 10.00 9.80 9.50 9.00Poland 2.90 2.80 2.90 3.00 3.10Czech Rep. 0.30 0.20 0.30 0.60 0.65Hungary 3.20 3.00 3.10 3.20 3.30Turkey 10.20 10.30 10.40 10.50 10.50Israel 1.80 1.60 1.70 1.80 2.00S. Africa 9.30 9.10 9.30 9.40 9.50China 2.90 2.85 2.80 2.70 2.55India 7.65 7.60 7.55 7.80 7.80Hong Kong 1.40 1.25 1.25 1.55 1.65S. Korea 1.83 1.55 1.50 1.80 1.90Taiwan 1.93 1.65 1.55 1.90 2.00Indonesia 8.00 7.80 7.80 8.00 8.10Malaysia 3.90 3.80 3.80 4.00 4.10Thailand 1.95 1.75 1.65 2.00 2.10Brazil 14.35 14.50 14.75 14.80 14.85Mexico 5.90 5.75 5.80 5.90 5.95Chile 4.30 4.15 4.30 4.40 4.30Peru 7.50 7.60 7.70 7.60 7.50Colombia 8.60 8.70 8.80 8.90 9.25
M O R G A N S T A N L E Y R E S E A R C H
32
March 13, 2016 Spring Global Strategy Outlook
Global Strategy Team Contributors to this Report
James Egan1 +1 (212) 761-4715 [email protected] Richard Hill1 +1 (212) 761-9810 [email protected] Matthew Hornbach1 +1 (212) 761-1837 [email protected] Gordian Kemen1 +1 (212) 761-0144 [email protected] Adam Longson1 +1 (212) 761-4061 [email protected] Adam S. Parker1 +1 (212) 761-1755 [email protected] Adam Richmond1 +1 (212) 761-1485 [email protected] Vishwanath Tirupattur1 +1 (212) 761-1043 [email protected] Michael Zezas1 +1 (212) 761-8609 [email protected]
Anton Heese2 +44 (0)20 7677-6951 [email protected] Phanikiran Naraparaju2 +44 (0)20 7677-5065 [email protected] Tom Price2 +44 (0)20 7425-4655 [email protected] Hans Redeker2 +44 (0)20 7425-2430 [email protected] Srikanth Sankaran2 +44 (0)20 7677-2969 [email protected] Graham Secker2 +44 (0)20 7425-6188 [email protected] Andrew Sheets2 +44 (0)20 7677-2905 [email protected]
Jonathan Garner3 +852 2848-7288 [email protected] Kewei Yang3 +852 3963-0562 [email protected]
Koichi Sugisaki6 +813 6836-8428 [email protected] 1 Morgan Stanley & Co. LLC 2 Morgan Stanley & Co. International plc+
3 Morgan Stanley Asia Limited+ 4 Morgan Stanley Taiwan Limited+
5 Morgan Stanley & Co. International plc, Seoul Branch+ 6 Morgan Stanley MUFG Securities Co., Ltd.+
We would like to thank James Lord for his contribution to this report.

M O R G A N S T A N L E Y R E S E A R C H
33
March 13, 2016 Spring Global Strategy Outlook
Options Disclaimer Options are not for everyone. Before engaging in the purchasing or writing of options, investors should understand the nature and extent of their rights and obligations and be aware of the risks involved, including the risks pertaining to the business and financial condition of the issuer and the underlying stock. A secondary market may not exist for these securities. For customers of Morgan Stanley & Co. LLC who are purchasing or writing exchange-traded options, your attention is called to the publication “Characteristics and Risks of Standardized Options;” in particular, the statement entitled “Risks of Option Writers.” That publication, which you should have read and understood prior to investing in options, can be viewed on the Web at the following address: http://www.optionsclearing.com/publications/risks/riskchap1.jsp. Spreading may also entail substantial commissions, because it involves at least twice the number of contracts as a long or short position and because spreads are almost invariably closed out prior to expiration. Potential investors should be advised that the tax treatment applicable to spread transactions should be carefully reviewed prior to entering into any transaction. Also, it should be pointed out that while the investor who engages in spread transactions may be reducing risk, he is also reducing his profit potential. The risk/ reward ratio, hence, is an important consideration. The risk of exercise in a spread position is the same as that in a short position. Certain investors may be able to anticipate exercise and execute a "rollover" transaction. However, should exercise occur, it would clearly mark the end of the spread position and thereby change the risk/reward ratio. Due to early assignments of the short side of the spread, what appears to be a limited risk spread may have more risk than initially perceived. An investor with a spread position in index options that is assigned an exercise is at risk for any adverse movement in the current level between the time the settlement value is determined on the date when the exercise notice is filed with OCC and the time when such investor sells or exercises the long leg of the spread. Other multiple-option strategies involving cash settled options, including combinations and straddles, present similar risk. Important Information: Examples within are indicative only, please call your local Morgan Stanley Sales representative for current levels. By selling an option, the seller receives a premium from the option purchaser, and the purchase receives the right to exercise the option at the strike price. If the option purchaser elects to exercise the option, the option seller is obligated to deliver/purchase the underlying shares to/from the option buyer at the strike price. If the option seller does not own the underlying security while maintaining the short option position (naked), the option seller is exposed to unlimited market risk. Spreading may entail substantial commissions, because it involves at least twice the number of contracts as a long or short position and because spreads are almost invariably closed out prior to expiration. Potential investors should carefully review tax treatment applicable to spread transactions prior to entering into any transactions. Multi-legged strategies are only effective if all components of a suggested trade are implemented. Investors in long option strategies are at risk of losing all of their option premiums. Investors in short option strategies are at risk of unlimited losses. There are special risks associated with uncovered option writing which expose the investor to potentially significant loss. Therefore, this type of strategy may not be suitable for all customers approved for options transactions. The potential loss of uncovered call writing is unlimited. The writer of an uncovered call is in an extremely risky position, and may incur large losses if the value of the underlying instrument increases above the exercise price. As with writing uncovered calls, the risk of writing uncovered put options is substantial. The writer of an uncovered put option bears a risk of loss if the value of the underlying instrument declines below the exercise price. Such loss could be substantial if there is a significant decline in the value of the underlying instrument. Uncovered option writing is thus suitable only for the knowledgeable investor who understands the risks, has the financial capacity and willingness to incur potentially substantial losses, and has sufficient liquid assets to meet applicable margin requirements. In this regard, if the value of the underlying instrument moves against an uncovered writer’s options position, the investor’s broker may request significant additional margin payments. If an investor does not make such margin payments, the broker may liquidate stock or options positions in the investor’s account, with little or no prior notice in accordance with the investor’s margin agreement. For combination writing, where the investor writes both a put and a call on the same underlying instrument, the potential risk is unlimited. If a secondary market in options were to become unavailable, investors could not engage in closing transactions, and an option writer would remain obligated until expiration or assignment. The writer of an American-style option is subject to being assigned an exercise at any time after he has written the option until the option expires. By contrast, the writer of a European-style option is subject to exercise assignment only during the exercise period. Strategy Risk Factors Buying calls or call spreads: Investors who buy call options risk loss of the entire premium paid if the underlying security finishes below the strike price at expiration. Investors who buy call spreads (buy a call and sell a further OTM call) also have a maximum loss of the entire up-front premium paid. The maximum gain from buying call spreads is the difference between the strike prices, less the upfront premium paid. Buying puts or put spreads: Investors who buy put options risk loss of the entire premium paid if the underlying security finishes above the strike price at expiration. Investors who buy put spreads (buy a put and sell a further OTM put) also have a maximum loss of the upfront premium paid. The maximum gain from buying put spreads is the difference between the strike prices, less the upfront premium paid. Selling calls: Investors who sell covered calls (own the underlying security and sell a call) risk limiting their upside to the strike price plus the upfront premium received and may have their security called away if the security price exceeds the strike price of the short call. Additionally, the investor has full downside exposure that is only partially offset by the upfront premium taken in. Investors short naked calls (i.e. sold calls but don’t hold underlying security) risk unlimited losses of security price less strike price. Investors who sell naked call spreads (i.e. sell a call and buy a farther out-of-the-money call with no underlying security position) have a maximum loss of the difference between the long call strike and the short call strike, less the upfront premium taken in, if the underlying security finishes above the long call strike at expiration. The maximum gain is the upfront premium taken in, if the security finishes below the short call strike at expiration. Selling puts: Put sellers commit to buying the underlying security at the strike price in the event the security falls below the strike price. The maximum loss is the full strike price less the premium received for selling the put. Put sellers who are also long a lower dollar-strike put face a maximum loss of the difference between the long and short put strikes less the options premium received. Buying strangles: The maximum loss is the entire premium paid (put + call), if the security finishes between the put strike and the call strike at expiration. Selling strangles or straddles: Investors who are long a security and short a strangle or straddle risk capping their upside in the security to the strike price of the call that is sold plus the upfront premium received. Additionally, if the security trades below the strike price of the short put, the investor risks losing the difference between the strike price and the security price (less the value of the premium received) on the short put and will also experience losses in the security position if he owns shares. The maximum potential loss is the full value of the strike price (less the value of the premium received) plus losses on the long security position. Investors who are short naked strangles or straddles have unlimited potential loss since if the security trades above the call strike price, the investor risks losing the difference between the strike price and the security price (less the value of the premium received) on the short call. Additionally, they are obligated to buy the security at the put strike price (less upfront premium received) if the security finishes below the put strike price at expiration. Strangle/straddle sellers risk assignment on short put positions that become in the money. Additionally, they risk having stock called away from short call positions that become in the money.
Other Important Disclosures For important disclosures regarding companies that are the subject of the stock screen that appears in this report, please see the Morgan Stanley Research Disclosure Website at www.morganstanley.com/researchdisclosures. For valuation methodology and risks associated with any price targets, ratings and recommendations referenced in this research report, please contact the Client Support Team as follows: US/Canada +1 800 303-2495; Hong Kong +852 2848-5999; Latin America +1 718 754-5444 (U.S.); London +44 (0)20-7425-8169; Singapore +65 6834-6860; Sydney +61 (0)2-9770-1505; Tokyo +81 (0)3-5424-4349. Alternatively you may contact your investment representative or Morgan Stanley Research at 1585 Broadway (Attention: Research Management), New York, NY 10036 USA.

M O R G A N S T A N L E Y R E S E A R C H
34
March 13, 2016 Spring Global Strategy Outlook
Mortgage Backed Securities (MBS) and Collateralized Mortgage Obligations (CMO) Principal is returned on a monthly basis over the life of the security. Principal prepayment can significantly affect the monthly income stream and the maturity of any type of MBS, including standard MBS, CMOs and Lottery Bonds. Yields and average lives are estimated based on prepayment assumptions and are subject to change based on actual prepayment of the mortgages in the underlying pools. The level of predictability of an MBS/CMO's average life, and its market price, depends on the type of MBS/CMO class purchased and interest rate movements. In general, as interest rates fall, prepayment speeds are likely to increase, thus shortening the MBS/CMO's average life and likely causing its market price to rise. Conversely, as interest rates rise, prepayment speeds are likely to decrease, thus lengthening average life and likely causing the MBS/CMO's market price to fall. Some MBS/CMOs may have “original issue discount” (OID). OID occurs if the MBS/CMO’s original issue price is below its stated redemption price at maturity, and results in “imputed interest” that must be reported annually for tax purposes, resulting in a tax liability even though interest was not received. Investors are urged to consult their tax advisors for more information. Government agency backing applies only to the face value of the CMO and not to any premium paid.
Disclosure Section The information and opinions in Morgan Stanley Research were prepared or are disseminated by Morgan Stanley & Co. LLC and/or Morgan Stanley C.T.V.M. S.A. and/or Morgan Stanley México, Casa de Bolsa, S.A. de C.V. and/or Morgan Stanley Canada Limited and/or Morgan Stanley & Co. International plc and/or RMB Morgan Stanley (Proprietary) Limited and/or Morgan Stanley MUFG Securities Co., Ltd. and/or Morgan Stanley Capital Group Japan Co., Ltd. and/or Morgan Stanley Asia Limited and/or Morgan Stanley Asia (Singapore) Pte. (Registration number 199206298Z) and/or Morgan Stanley Asia (Singapore) Securities Pte Ltd (Registration number 200008434H), regulated by the Monetary Authority of Singapore (which accepts legal responsibility for its contents and should be contacted with respect to any matters arising from, or in connection with, Morgan Stanley Research) and/or Morgan Stanley Taiwan Limited and/or Morgan Stanley & Co International plc, Seoul Branch, and/or Morgan Stanley Australia Limited (A.B.N. 67 003 734 576, holder of Australian financial services license No. 233742, which accepts responsibility for its contents), and/or Morgan Stanley Wealth Management Australia Pty Ltd (A.B.N. 19 009 145 555, holder of Australian financial services license No. 240813, which accepts responsibility for its contents), and/or Morgan Stanley India Company Private Limited, regulated by the Securities and Exchange Board of India (“SEBI”) and holder of licenses as a Research Analyst (SEBI Registration No. INH000001105), Stock Broker (BSE Registration No. INB011054237 and NSE Registration No. INB/INF231054231), Merchant Banker (SEBI Registration No. INM000011203), and depository participant with National Securities Depository Limited (SEBI Registration No. IN-DP-NSDL-372-2014) which accepts the responsibility for its contents and should be contacted with respect to any matters arising from, or in connection with, Morgan Stanley Research, and/or PT Morgan Stanley Asia Indonesia and their affiliates (collectively, "Morgan Stanley"). For important disclosures, stock price charts and equity rating histories regarding companies that are the subject of this report, please see the Morgan Stanley Research Disclosure Website at www.morganstanley.com/researchdisclosures, or contact your investment representative or Morgan Stanley Research at 1585 Broadway, (Attention: Research Management), New York, NY, 10036 USA. For valuation methodology and risks associated with any price targets referenced in this research report, please contact the Client Support Team as follows: US/Canada +1 800 303-2495; Hong Kong +852 2848-5999; Latin America +1 718 754-5444 (U.S.); London +44 (0)20-7425-8169; Singapore +65 6834-6860; Sydney +61 (0)2-9770-1505; Tokyo +81 (0)3-6836-9000. Alternatively you may contact your investment representative or Morgan Stanley Research at 1585 Broadway, (Attention: Research Management), New York, NY 10036 USA. Analyst Certification The following analysts hereby certify that their views about the companies and their securities discussed in this report are accurately expressed and that they have not received and will not receive direct or indirect compensation in exchange for expressing specific recommendations or views in this report: Jonathan F Garner; Anton Heese; Matthew Hornbach; Gordian Kemen; Phanikiran L Naraparaju; Kelvin Pang; Adam S. Parker, Ph.D.; Adam S Richmond; Srikanth Sankaran; Graham Secker; Andrew Sheets; Koichi Sugisaki; Vishwanath Tirupattur.. Unless otherwise stated, the individuals listed on the cover page of this report are research analysts. Global Research Conflict Management Policy Morgan Stanley Research has been published in accordance with our conflict management policy, which is available at www.morganstanley.com/institutional/research/conflictpolicies. Important US Regulatory Disclosures on Subject Companies Within the last 12 months, Morgan Stanley managed or co-managed a public offering (or 144A offering) of securities of Government Of United Kingdom Of Great Britain And Northern Ireland, China, Germany, Japan, Mexico, Peru, Philippines, United States of America. Within the last 12 months, Morgan Stanley has received compensation for investment banking services from Government Of United Kingdom Of Great Britain And Northern Ireland, Petroleos Mexicanos, Brazil, China, Germany, Japan, Mexico, Peru, Philippines, United States of America. In the next 3 months, Morgan Stanley expects to receive or intends to seek compensation for investment banking services from Government Of United Kingdom Of Great Britain And Northern Ireland, Petroleos Mexicanos, Argentina, Brazil, Chile, China, Colombia, Germany, Japan, Mexico, Peru, Philippines, South Africa, Turkey, United States of America. Within the last 12 months, Morgan Stanley has received compensation for products and services other than investment banking services from Government Of United Kingdom Of Great Britain And Northern Ireland, Petroleos Mexicanos, Brazil, Chile, China, Colombia, Germany, Japan, Mexico, Philippines, Turkey, United States of America, Venezuela. Within the last 12 months, Morgan Stanley has provided or is providing investment banking services to, or has an investment banking client relationship with, the following company: Government Of United Kingdom Of Great Britain And Northern Ireland, Petroleos Mexicanos, Argentina, Brazil, Chile, China, Colombia, Germany, Japan, Mexico, Peru, Philippines, South Africa, Turkey, United States of America. Within the last 12 months, Morgan Stanley has either provided or is providing non-investment banking, securities-related services to and/or in the past has entered into an agreement to provide services or has a client relationship with the following company: Government Of United Kingdom Of Great Britain And Northern Ireland, Petroleos Mexicanos, Argentina, Brazil, Chile, China, Colombia, Germany, Japan, Mexico, Peru, Philippines, South Africa, Turkey, United States of America, Venezuela. Morgan Stanley & Co. LLC makes a market in the securities of Government Of United Kingdom Of Great Britain And Northern Ireland, Argentina, Brazil, China, Colombia.
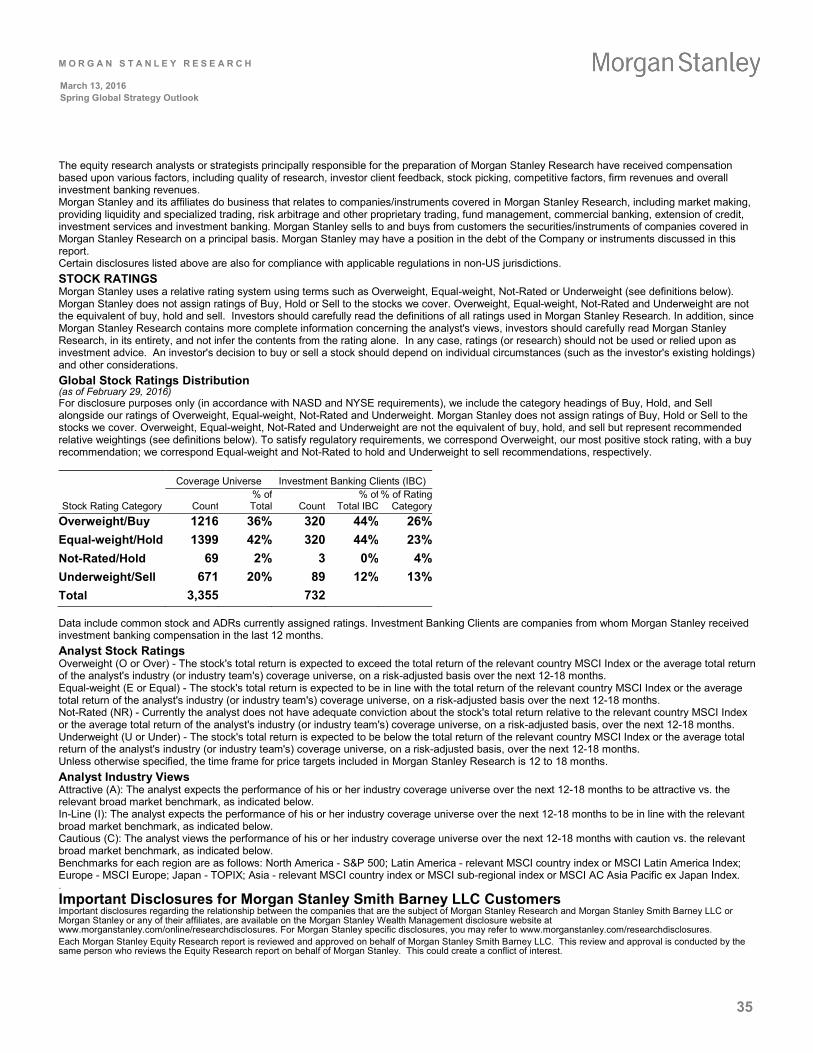
M O R G A N S T A N L E Y R E S E A R C H
35
March 13, 2016 Spring Global Strategy Outlook
The equity research analysts or strategists principally responsible for the preparation of Morgan Stanley Research have received compensation based upon various factors, including quality of research, investor client feedback, stock picking, competitive factors, firm revenues and overall investment banking revenues. Morgan Stanley and its affiliates do business that relates to companies/instruments covered in Morgan Stanley Research, including market making, providing liquidity and specialized trading, risk arbitrage and other proprietary trading, fund management, commercial banking, extension of credit, investment services and investment banking. Morgan Stanley sells to and buys from customers the securities/instruments of companies covered in Morgan Stanley Research on a principal basis. Morgan Stanley may have a position in the debt of the Company or instruments discussed in this report. Certain disclosures listed above are also for compliance with applicable regulations in non-US jurisdictions. STOCK RATINGS Morgan Stanley uses a relative rating system using terms such as Overweight, Equal-weight, Not-Rated or Underweight (see definitions below). Morgan Stanley does not assign ratings of Buy, Hold or Sell to the stocks we cover. Overweight, Equal-weight, Not-Rated and Underweight are not the equivalent of buy, hold and sell. Investors should carefully read the definitions of all ratings used in Morgan Stanley Research. In addition, since Morgan Stanley Research contains more complete information concerning the analyst's views, investors should carefully read Morgan Stanley Research, in its entirety, and not infer the contents from the rating alone. In any case, ratings (or research) should not be used or relied upon as investment advice. An investor's decision to buy or sell a stock should depend on individual circumstances (such as the investor's existing holdings) and other considerations. Global Stock Ratings Distribution (as of February 29, 2016) For disclosure purposes only (in accordance with NASD and NYSE requirements), we include the category headings of Buy, Hold, and Sell alongside our ratings of Overweight, Equal-weight, Not-Rated and Underweight. Morgan Stanley does not assign ratings of Buy, Hold or Sell to the stocks we cover. Overweight, Equal-weight, Not-Rated and Underweight are not the equivalent of buy, hold, and sell but represent recommended relative weightings (see definitions below). To satisfy regulatory requirements, we correspond Overweight, our most positive stock rating, with a buy recommendation; we correspond Equal-weight and Not-Rated to hold and Underweight to sell recommendations, respectively. Coverage Universe Investment Banking Clients (IBC)
Stock Rating Category Count % of Total Count
% of Total IBC
% of Rating Category
Overweight/Buy 1216 36% 320 44% 26% Equal-weight/Hold 1399 42% 320 44% 23% Not-Rated/Hold 69 2% 3 0% 4% Underweight/Sell 671 20% 89 12% 13% Total 3,355 732 Data include common stock and ADRs currently assigned ratings. Investment Banking Clients are companies from whom Morgan Stanley received investment banking compensation in the last 12 months. Analyst Stock Ratings Overweight (O or Over) - The stock's total return is expected to exceed the total return of the relevant country MSCI Index or the average total return of the analyst's industry (or industry team's) coverage universe, on a risk-adjusted basis over the next 12-18 months. Equal-weight (E or Equal) - The stock's total return is expected to be in line with the total return of the relevant country MSCI Index or the average total return of the analyst's industry (or industry team's) coverage universe, on a risk-adjusted basis over the next 12-18 months. Not-Rated (NR) - Currently the analyst does not have adequate conviction about the stock's total return relative to the relevant country MSCI Index or the average total return of the analyst's industry (or industry team's) coverage universe, on a risk-adjusted basis, over the next 12-18 months. Underweight (U or Under) - The stock's total return is expected to be below the total return of the relevant country MSCI Index or the average total return of the analyst's industry (or industry team's) coverage universe, on a risk-adjusted basis, over the next 12-18 months. Unless otherwise specified, the time frame for price targets included in Morgan Stanley Research is 12 to 18 months. Analyst Industry Views Attractive (A): The analyst expects the performance of his or her industry coverage universe over the next 12-18 months to be attractive vs. the relevant broad market benchmark, as indicated below. In-Line (I): The analyst expects the performance of his or her industry coverage universe over the next 12-18 months to be in line with the relevant broad market benchmark, as indicated below. Cautious (C): The analyst views the performance of his or her industry coverage universe over the next 12-18 months with caution vs. the relevant broad market benchmark, as indicated below. Benchmarks for each region are as follows: North America - S&P 500; Latin America - relevant MSCI country index or MSCI Latin America Index; Europe - MSCI Europe; Japan - TOPIX; Asia - relevant MSCI country index or MSCI sub-regional index or MSCI AC Asia Pacific ex Japan Index. . Important Disclosures for Morgan Stanley Smith Barney LLC Customers Important disclosures regarding the relationship between the companies that are the subject of Morgan Stanley Research and Morgan Stanley Smith Barney LLC or Morgan Stanley or any of their affiliates, are available on the Morgan Stanley Wealth Management disclosure website at www.morganstanley.com/online/researchdisclosures. For Morgan Stanley specific disclosures, you may refer to www.morganstanley.com/researchdisclosures. Each Morgan Stanley Equity Research report is reviewed and approved on behalf of Morgan Stanley Smith Barney LLC. This review and approval is conducted by the same person who reviews the Equity Research report on behalf of Morgan Stanley. This could create a conflict of interest.

M O R G A N S T A N L E Y R E S E A R C H
36
March 13, 2016 Spring Global Strategy Outlook
Other Important Disclosures Morgan Stanley & Co. International PLC and its affiliates have a significant financial interest in the debt securities of Petroleos Mexicanos, Argentina, Brazil, Chile, China, Colombia, Germany, Japan, Mexico, Peru, Philippines, South Africa, Turkey, United Kingdom, United States of America, Venezuela. Morgan Stanley is not acting as a municipal advisor and the opinions or views contained herein are not intended to be, and do not constitute, advice within the meaning of Section 975 of the Dodd-Frank Wall Street Reform and Consumer Protection Act. Morgan Stanley produces an equity research product called a "Tactical Idea." Views contained in a "Tactical Idea" on a particular stock may be contrary to the recommendations or views expressed in research on the same stock. This may be the result of differing time horizons, methodologies, market events, or other factors. For all research available on a particular stock, please contact your sales representative or go to Matrix at http://www.morganstanley.com/matrix. Morgan Stanley Research is provided to our clients through our proprietary research portal on Matrix and also distributed electronically by Morgan Stanley to clients. Certain, but not all, Morgan Stanley Research products are also made available to clients through third-party vendors or redistributed to clients through alternate electronic means as a convenience. For access to all available Morgan Stanley Research, please contact your sales representative or go to Matrix at http://www.morganstanley.com/matrix. Any access and/or use of Morgan Stanley Research is subject to Morgan Stanley's Terms of Use (http://www.morganstanley.com/terms.html). By accessing and/or using Morgan Stanley Research, you are indicating that you have read and agree to be bound by our Terms of Use (http://www.morganstanley.com/terms.html). In addition you consent to Morgan Stanley processing your personal data and using cookies in accordance with our Privacy Policy and our Global Cookies Policy (http://www.morganstanley.com/privacy_pledge.html), including for the purposes of setting your preferences and to collect readership data so that we can deliver better and more personalized service and products to you. To find out more information about how Morgan Stanley processes personal data, how we use cookies and how to reject cookies see our Privacy Policy and our Global Cookies Policy (http://www.morganstanley.com/privacy_pledge.html). If you do not agree to our Terms of Use and/or if you do not wish to provide your consent to Morgan Stanley processing your personal data or using cookies please do not access our research. Morgan Stanley Research does not provide individually tailored investment advice. Morgan Stanley Research has been prepared without regard to the circumstances and objectives of those who receive it. Morgan Stanley recommends that investors independently evaluate particular investments and strategies, and encourages investors to seek the advice of a financial adviser. The appropriateness of an investment or strategy will depend on an investor's circumstances and objectives. The securities, instruments, or strategies discussed in Morgan Stanley Research may not be suitable for all investors, and certain investors may not be eligible to purchase or participate in some or all of them. Morgan Stanley Research is not an offer to buy or sell or the solicitation of an offer to buy or sell any security/instrument or to participate in any particular trading strategy. The value of and income from your investments may vary because of changes in interest rates, foreign exchange rates, default rates, prepayment rates, securities/instruments prices, market indexes, operational or financial conditions of companies or other factors. There may be time limitations on the exercise of options or other rights in securities/instruments transactions. Past performance is not necessarily a guide to future performance. Estimates of future performance are based on assumptions that may not be realized. If provided, and unless otherwise stated, the closing price on the cover page is that of the primary exchange for the subject company's securities/instruments. The fixed income research analysts, strategists or economists principally responsible for the preparation of Morgan Stanley Research have received compensation based upon various factors, including quality, accuracy and value of research, firm profitability or revenues (which include fixed income trading and capital markets profitability or revenues), client feedback and competitive factors. Fixed Income Research analysts', strategists' or economists' compensation is not linked to investment banking or capital markets transactions performed by Morgan Stanley or the profitability or revenues of particular trading desks. The "Important US Regulatory Disclosures on Subject Companies" section in Morgan Stanley Research lists all companies mentioned where Morgan Stanley owns 1% or more of a class of common equity securities of the companies. For all other companies mentioned in Morgan Stanley Research, Morgan Stanley may have an investment of less than 1% in securities/instruments or derivatives of securities/instruments of companies and may trade them in ways different from those discussed in Morgan Stanley Research. Employees of Morgan Stanley not involved in the preparation of Morgan Stanley Research may have investments in securities/instruments or derivatives of securities/instruments of companies mentioned and may trade them in ways different from those discussed in Morgan Stanley Research. Derivatives may be issued by Morgan Stanley or associated persons. With the exception of information regarding Morgan Stanley, Morgan Stanley Research is based on public information. Morgan Stanley makes every effort to use reliable, comprehensive information, but we make no representation that it is accurate or complete. We have no obligation to tell you when opinions or information in Morgan Stanley Research change apart from when we intend to discontinue equity research coverage of a subject company. Facts and views presented in Morgan Stanley Research have not been reviewed by, and may not reflect information known to, professionals in other Morgan Stanley business areas, including investment banking personnel. Morgan Stanley Research personnel may participate in company events such as site visits and are generally prohibited from accepting payment by the company of associated expenses unless pre-approved by authorized members of Research management. Morgan Stanley may make investment decisions that are inconsistent with the recommendations or views in this report. To our readers in Taiwan: Information on securities/instruments that trade in Taiwan is distributed by Morgan Stanley Taiwan Limited ("MSTL"). Such information is for your reference only. The reader should independently evaluate the investment risks and is solely responsible for their investment decisions. Morgan Stanley Research may not be distributed to the public media or quoted or used by the public media without the express written consent of Morgan Stanley. Information on securities/instruments that do not trade in Taiwan is for informational purposes only and is not to be construed as a recommendation or a solicitation to trade in such securities/instruments. MSTL may not execute transactions for clients in these securities/instruments. To our readers in Hong Kong: Information is distributed in Hong Kong by and on behalf of, and is attributable to, Morgan Stanley Asia Limited as part of its regulated activities in Hong Kong. If you have any queries concerning Morgan Stanley Research, please contact our Hong Kong sales representatives. Certain information in Morgan Stanley Research was sourced by employees of the Shanghai Representative Office of Morgan Stanley Asia Limited for the use of Morgan Stanley Asia Limited. Morgan Stanley is not incorporated under PRC law and the research in relation to this report is conducted outside the PRC. Morgan Stanley Research does not constitute an offer to sell or the solicitation of an offer to buy any securities in the PRC. PRC investors shall have the relevant qualifications to invest in such securities and shall be responsible for obtaining all relevant approvals, licenses, verifications and/or registrations from the relevant governmental authorities themselves. Morgan Stanley Research is disseminated in Brazil by Morgan Stanley C.T.V.M. S.A.; in Mexico by Morgan Stanley México, Casa de Bolsa, S.A. de C.V which is regulated by Comision Nacional Bancaria y de Valores. Paseo de los Tamarindos 90, Torre 1, Col. Bosques de las Lomas Floor 29, 05120 Mexico City; in Japan by Morgan Stanley MUFG Securities Co., Ltd. and, for Commodities related research reports only, Morgan Stanley Capital Group Japan Co., Ltd; in Hong Kong by Morgan Stanley Asia Limited (which accepts responsibility for its contents) and by Bank Morgan Stanley AG, Hong Kong Branch; in Singapore by Morgan Stanley Asia (Singapore) Pte. (Registration number 199206298Z) and/or Morgan Stanley Asia (Singapore) Securities Pte Ltd (Registration number 200008434H), regulated by the Monetary Authority of Singapore (which accepts legal responsibility for its contents and should be contacted with respect to any matters arising from, or in connection with, Morgan Stanley Research) and by Bank Morgan Stanley AG, Singapore Branch (Registration number T11FC0207F); in Australia to "wholesale clients" within the meaning of the Australian Corporations Act by Morgan Stanley Australia Limited A.B.N. 67 003 734 576, holder of Australian financial services license No. 233742, which accepts responsibility for its contents; in Australia to "wholesale clients" and "retail clients" within the meaning of the Australian Corporations Act by Morgan Stanley Wealth Management Australia Pty Ltd (A.B.N. 19 009 145 555, holder of Australian financial services license No. 240813, which accepts responsibility for its contents; in Korea by Morgan Stanley & Co International plc, Seoul Branch; in India by Morgan Stanley India Company Private Limited; in Indonesia by PT Morgan Stanley Asia Indonesia; in Canada by Morgan Stanley Canada Limited, which has approved of and takes responsibility for its contents in Canada; in Germany by Morgan Stanley Bank AG, Frankfurt am Main and Morgan Stanley Private Wealth Management Limited, Niederlassung Deutschland, regulated by Bundesanstalt fuer Finanzdienstleistungsaufsicht (BaFin); in Spain by Morgan Stanley, S.V., S.A., a Morgan Stanley group company, which is supervised by the Spanish Securities Markets Commission (CNMV) and states that Morgan Stanley Research has been written and distributed in accordance with the rules of conduct applicable to financial research as established under Spanish regulations; in the US by Morgan Stanley & Co. LLC, which accepts responsibility for its contents. Morgan Stanley & Co. International plc, authorized by the Prudential Regulatory Authority and regulated by the Financial Conduct Authority and the Prudential Regulatory Authority, disseminates in the UK research that it has prepared, and approves solely for the purposes of section 21 of the Financial Services and Markets Act 2000, research which has been prepared by any of its affiliates. RMB Morgan Stanley (Proprietary) Limited is a member of the JSE Limited and regulated by the Financial Services Board in South Africa. RMB Morgan Stanley (Proprietary) Limited is a joint venture owned equally by Morgan Stanley International Holdings Inc. and RMB Investment Advisory (Proprietary) Limited, which is wholly owned by FirstRand Limited. The information in Morgan Stanley Research is being disseminated by Morgan Stanley Saudi Arabia, regulated by the Capital Market Authority in the Kingdom of Saudi Arabia , and is directed at Sophisticated investors only.
M O R G A N S T A N L E Y R E S E A R C H
37
March 13, 2016 Spring Global Strategy Outlook
The information in Morgan Stanley Research is being communicated by Morgan Stanley & Co. International plc (DIFC Branch), regulated by the Dubai Financial Services Authority (the DFSA), and is directed at Professional Clients only, as defined by the DFSA. The financial products or financial services to which this research relates will only be made available to a customer who we are satisfied meets the regulatory criteria to be a Professional Client. The information in Morgan Stanley Research is being communicated by Morgan Stanley & Co. International plc (QFC Branch), regulated by the Qatar Financial Centre Regulatory Authority (the QFCRA), and is directed at business customers and market counterparties only and is not intended for Retail Customers as defined by the QFCRA. As required by the Capital Markets Board of Turkey, investment information, comments and recommendations stated here, are not within the scope of investment advisory activity. Investment advisory service is provided exclusively to persons based on their risk and income preferences by the authorized firms. Comments and recommendations stated here are general in nature. These opinions may not fit to your financial status, risk and return preferences. For this reason, to make an investment decision by relying solely to this information stated here may not bring about outcomes that fit your expectations. The trademarks and service marks contained in Morgan Stanley Research are the property of their respective owners. Third-party data providers make no warranties or representations relating to the accuracy, completeness, or timeliness of the data they provide and shall not have liability for any damages relating to such data. The Global Industry Classification Standard (GICS) was developed by and is the exclusive property of MSCI and S&P. Morgan Stanley Research, or any portion thereof may not be reprinted, sold or redistributed without the written consent of Morgan Stanley. © 2016 Morgan Stanley
M O R G A N S T A N L E Y R E S E A R C H
The Americas 1585 Broadway New York, NY 10036-8293 United States Tel: +1 (1)212 761 4000
Europe 20 Bank Street, Canary Wharf London E14 4AD United Kingdom Tel: +44 (0)20 7425 8000
Japan 1-9-7 Otemachi, Chiyoda-ku, Tokyo 100-8104, Japan Tel: +81 (0)3 6836 5000
Asia/Pacific 1 Austin Road West Kowloon Hong Kong Tel: +852 2848 5200
© 2015 Morgan Stanley