spring cleaning: marie kondo your looker instance...spring cleaning: marie kondo your looker...
TRANSCRIPT

Spring Cleaning: Marie Kondo your Looker InstanceHow to identify and remove the things that don’t spark joy.

Agenda
1 Introductions
2 Declutter Content
3 System Activity Dashboards
4 System Activity Explores
5 Optimization using System Activity Explores
6 General Instance Monitoring
7 Questions
© L
ooke
r 20
18.
Conf
iden
tial

Why Monitor Looker?
● Reactive Monitoring○ Scheduler Failures○ Abnormal PDT build times
● Proactive Discovery of High Value Activities○ Identify Performance Bottlenecks○ Find content to promote
● Assess Your “Data Culture”○ Drive adoption○ Discover “power users”/advocates
© L
ooke
r 20
18.
Conf
iden
tial

© L
ooke
r 20
18.
Conf
iden
tial
Declutter content

© L
ooke
r 20
18.
Conf
iden
tial
Keep? Discard?● It is used on a
regular basis● It supports
crucial processes
● It is rarely or never used
● No one in the organization needs it

Low hanging fruit: empty the trash
© L
ooke
r 20
18.
Conf
iden
tial
● Reduce clutter by clearing out the trash on a regular basis
● Sort by deleted date to remove long-deleted items first
● Pro tip: Retain items deleted in the last 30 days or so in case they were deleted by accident

Finding unused content
© L
ooke
r 20
18.
Conf
iden
tial
● Unused content does still get validated via the content validator, causing the validator to run more slowly
● “Time since last use” dropdown can be set to different timeframes
Identify stagnant content in the Unused Content space
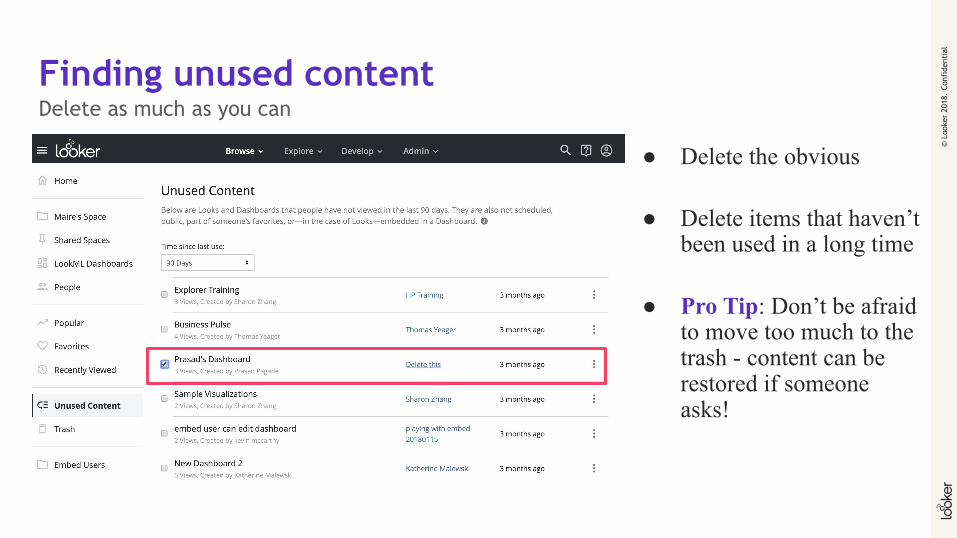
Finding unused content
© L
ooke
r 20
18.
Conf
iden
tial
● Delete the obvious
● Delete items that haven’t been used in a long time
● Pro Tip: Don’t be afraid to move too much to the trash - content can be restored if someone asks!
Delete as much as you can

© L
ooke
r 20
18.
Conf
iden
tial
System Activity Dashboards
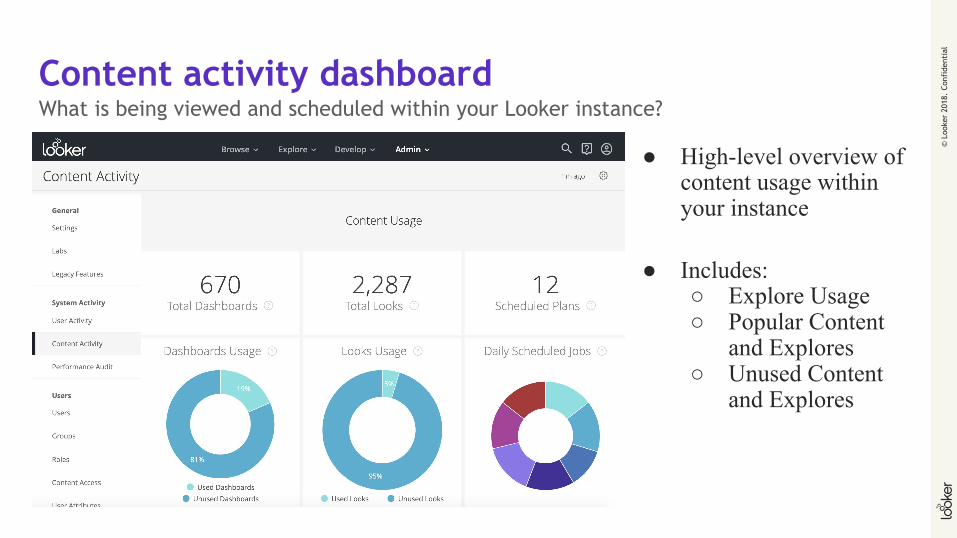
Content activity dashboard
© L
ooke
r 20
18.
Conf
iden
tial
● High-level overview of content usage within your instance
● Includes:○ Explore Usage○ Popular Content
and Explores○ Unused Content
and Explores
What is being viewed and scheduled within your Looker instance?

User activity dashboard
© L
ooke
r 20
18.
Conf
iden
tial
● High-level overview of user activity within your instance
● Includes:○ Percentage of users
viewing data○ Time spent viewing
queries○ Lists of the most
active and inactive users
Who is using your Looker instance the most, and what are they doing?

Performance audit dashboard
© L
ooke
r 20
18.
Conf
iden
tial
● High-level overview of instance and query performance
● Includes:○ Average run times
of queries and PDTs
○ Query errors○ PDT build failures
How is Looker performing?

Usage dashboard
© L
ooke
r 20
18.
Conf
iden
tial
● High-level usage information
● Includes:○ History○ Looks○ Field Usage○ Schedules
● Explore from any of the tiles to dive deeper
Present Looker instance usage information

Usage dashboard: key tiles
● Query by Source: how are people in your organization engaging with Looker (via dashboards, Explores, etc.)
● Top Users, Last 30 Days: who has been really active in Looker and would be a good candidate to spark further adoption
● Query Runtime Performance: what queries are taking the longest to run and may require further investigation
● List of Top Dashboards: which dashboards are used the most frequently and should be monitored closely
© L
ooke
r 20
18.
Conf
iden
tial

© L
ooke
r 20
18.
Conf
iden
tial
Those dashboards are really just entry points for exploring system activity
System Activity Overview
● An internal Looker database ● Stores information about the Looker instance● Covers the following key areas
○ Content (looks and dashboards)○ Users○ Queries
● Maintains 90-days of history
© L
ooke
r 20
18.
Conf
iden
tial
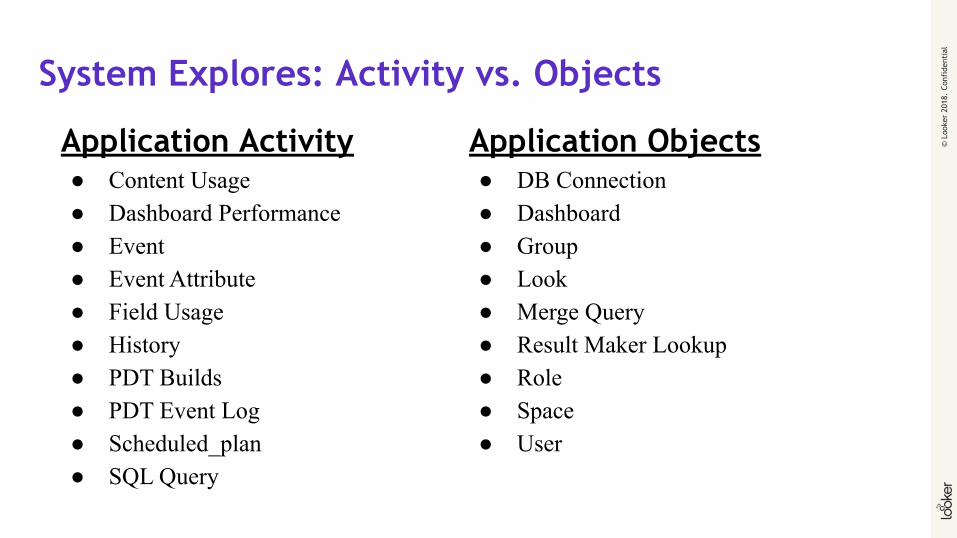
System Explores: Activity vs. Objects
© L
ooke
r 20
18.
Conf
iden
tial
Application Activity● Content Usage● Dashboard Performance● Event● Event Attribute● Field Usage● History● PDT Builds● PDT Event Log● Scheduled_plan● SQL Query
Application Objects● DB Connection● Dashboard● Group● Look● Merge Query● Result Maker Lookup● Role● Space● User

© L
ooke
r 20
18.
Conf
iden
tial
Using system activity to identify areas for improvement

Which dashboards have too many tiles?
© L
ooke
r 20
18.
Conf
iden
tial

Dashboard optimization
● Start with the Dashboard explore
● The Dashboard explore includes information about dashboard elements
● Here we can find a count of tiles by dashboard
© L
ooke
r 20
18.
Conf
iden
tial
Which dashboards have too many tiles?
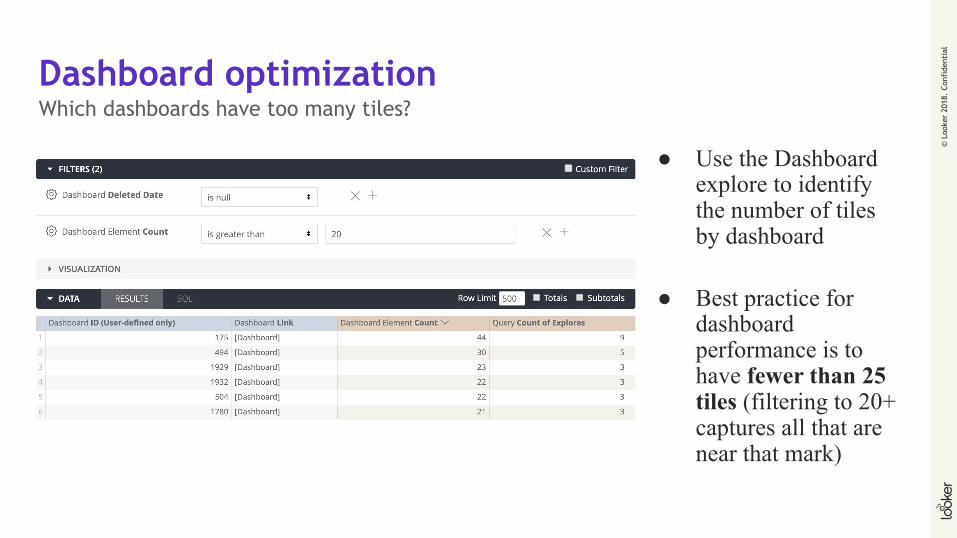
Dashboard optimization
● Use the Dashboard explore to identify the number of tiles by dashboard
● Best practice for dashboard performance is to have fewer than 25 tiles (filtering to 20+ captures all that are near that mark)
© L
ooke
r 20
18.
Conf
iden
tial
Which dashboards have too many tiles?

Dashboard optimization
● Add the Run on Load field to ensure that any large dashboards are set to “No”
● Use the Refresh Interval field to see if any large dashboards are set to auto refresh
© L
ooke
r 20
18.
Conf
iden
tial
Which dashboards have too many tiles?

Are there looks that could be turned into tiles instead of being saved as individual reports?
© L
ooke
r 20
18.
Conf
iden
tial

Content optimization
● Start with the Dashboard explore
● The Dashboard explore includes information about dashboard tiles and whether they are look-based or dashboard tiles only
© L
ooke
r 20
18.
Conf
iden
tial
Are there looks that can be deleted?

Content optimization
● Identify counts of Look and Lookless dashboard elements for each dashboard
● Best practice is for any tiles that are only used within a single dashboard to be converted to lookless
© L
ooke
r 20
18.
Conf
iden
tial
Are there looks that can be deleted?

Content optimization
● Filter out any dashboards that already have only lookless tiles
● Create a table calculation to find the % of look-based tiles by dashboard
© L
ooke
r 20
18.
Conf
iden
tial
Are there looks that can be deleted?

Are there spaces with too much clutter?
© L
ooke
r 20
18.
Conf
iden
tial

Space optimization
● Start with the Dashboard explore
● The Dashboard explore includes information about the spaces that dashboards are saved in.
© L
ooke
r 20
18.
Conf
iden
tial
Should spaces be reorganized?

Space optimization
● Identify counts dashboards by Space
● Include the number of dashboards created within the last 30 days
● Too many dashboards in a single space can make browsing difficult
© L
ooke
r 20
18.
Conf
iden
tial
Should spaces be reorganized?

Space optimization
© L
ooke
r 20
18.
Conf
iden
tial
What do you do when you have a lot of dashboards in a space?
Set up subspaces to organize content!
● Use Groups & Access Controls to hide spaces when appropriate
● Create an intuitive structure○ By team○ By use case

Space optimization
© L
ooke
r 20
18.
Conf
iden
tial
What do you do when you have a lot of dashboards in a space?

© L
ooke
r 20
18.
Conf
iden
tial
Using system activity to investigate performance issues

Which queries are taking the longest to run?
© L
ooke
r 20
18.
Conf
iden
tial

Query optimization
● Start with the History explore
● The History explore includes details about all queries run in the past 90 days
● Here we can find recent queries that have taken a long time to execute
© L
ooke
r 20
18.
Conf
iden
tial
Which queries are taking the longest to run?

Query optimization
● Apply a relevant timeframe filter that is within the past 90 days● Filtering the History source to Dashboard or Saved Look ensures that only saved
queries are included
© L
ooke
r 20
18.
Conf
iden
tial
Which queries are taking the longest to run?

Query optimization
● Identify long-running queries using the Average Runtime in Seconds measure
● Query Run Count shows how many times the query has been run
● Dashboard Count shows how many dashboards the query appears on
© L
ooke
r 20
18.
Conf
iden
tial
Which queries are taking the longest to run?

Query optimization
● Find out more by adding in additional fields from the Query view
● Row and column totals often drive up query times since these execute as separate queries within the Look or Tile
© L
ooke
r 20
18.
Conf
iden
tial
Which queries are taking the longest to run?

Looker optimization
Save your custom system activities queries as looks and set up alerts so that you are notified when new issues arise with dashboards or queries!
These can be set to run on a regular cadence and only when there are results and results have changed.
© L
ooke
r 20
18.
Conf
iden
tial
Pro tip

© L
ooke
r 20
18.
Conf
iden
tial
General instance monitoring

Explore clean-up
● Prioritize explores used by non-developers for clean-up to keep these user-friendly
● Identify Explores that aren’t commonly used
© L
ooke
r 20
18.
Conf
iden
tial
Which Explores are the most popular with different types of users?

Explore clean-up
● Select the following fields○ history.created_
date○ query.explore○ query.link
● Filter on query.explore and type in the specific explore name of interest
© L
ooke
r 20
18.
Conf
iden
tial
Has a specific Explore been used in the past 90 days?

Explore clean-up
● Select the following fields:○ History.created
_date○ Query.explore○ Query.link
● Filter on query.fields_used “contains” and then type in the view_name.field
© L
ooke
r 20
18.
Conf
iden
tial
Has a specific field been used in the past 90 days?

Using the history explore
● When investigating database performance, consider filtering on history.result_source = 'query' to look just at history records in which results were returned from the connecting database.
● The result_source is typically null for erroring queries. Add the status and message fields into your query to confirm and troubleshoot.
● The “Query” view should be used for general query investigation. The “Source Query” view pertains to Merged Results queries only.
© L
ooke
r 20
18.
Conf
iden
tial
Pro tips

© L
ooke
r 20
18.
Conf
iden
tial
If you are looking for something more advanced (and have some dev/ops support)

Try Henry!
© L
ooke
r 20
18.
Conf
iden
tial
Henry is an open source tool that helps Looker admins and developers identify aspects of the model that are not in use and can be removed
Please note that this tool is open source and is not supported by Looker’s normal support channels - any issues encountered while using the tool are encouraged to be filed here.

Henry will help identify
● Explores that have not been used in the last 90 days● Scheduled data and dashboard deliveries that are not succeeding● Any legacy features that are still in use● The number of fields that are not in use within each Explore● The specific fields that are not in use within each Explore
© L
ooke
r 20
18.
Conf
iden
tial

Keeping Looker clean
● Majority of content is utilized● Content is easy to find
○ Named with clarity (minimized duplication of content)○ Intuitive spaces
● Tiles and Looks are not broken● Explores are purposeful
○ Fields are useful○ Explore user interface is friendly
● LookML is DRY
© L
ooke
r 20
18.
Conf
iden
tial

QUESTIONS?
© L
ooke
r 20
18.
Conf
iden
tial

© L
ooke
r 20
18.
Conf
iden
tial