sporadic vs familial classification given etiologic heterogeneity: i. sensitivity, specificity, and...
TRANSCRIPT
Genetic Epidemiology 4:313-330 (1987)
Sporadic vs Familial Classification Given Etiologic Heterogeneity: I. Sensitivity, Specificity, and Positive and Negative Predictive Value
Kenneth S. Kendler
Departments of Psychiatry and Human Genetics, Medical College of Virginid Virginia Common wealth University, Richmond
Environmental factors are etiologically important in many non-Mendelian familial disorders in man. Because such disorders often occur as “sporadic” cases, (ie, an affected individual with no affected relatives), it is tempting to assume that such cases represent an “environmental” form of the disorder. This paper presents an evaluation of the sensitivity, specificity, and positive and negative predictive power (PPV and NPV) of this “sporadic vs familial classification.” The model assumes etiologic heterogeneity with a subpopulation of cases due to a “major” environ- mental event acting independent of genotype and the remaining cases resulting from a generalized single major locus (SML). Sibship size is modeled by a truncated negative binomial distribution. For rare disorders, this classification has high sensitivity and NPV but low specificity and PPV. As the disorder becomes more common, sensitivity and NPV fall while specificity and PPV rise. The power of the method increases substantially with increasing sibship size up to four or five, but further increases in power are minimal. MZ twins add considerable power to the method but aunts and uncles add little if anything. Both a correlational (phi) and an agreement-based (kappa) statistic indicate that, under most realistic circumstances, the relationship between etiology and family history is modest.
Key words: phenocopies, non-Mendelian familial disorders, genetic heterogeneity
lNTRODUCTlON
While genes are etiologically important in many common diseases of man, these disorders frequently occur as “sporadic” cases, that is, in individuals with no close
Received for publication March 11, 1987; revision accepted June 4, 1987.
Address reprint requests to Kenneth S. Kendler MD, Department of Psychiatry, Medical College of Virginia, Box 710, Richmond, VA 23298.
0 1987 Alan R. Liss, Inc.
314 Kendler
relatives affected with the same condition. Since environmental factors are also of etiological importance in many of these disorders, it is tempting to assume that sporadic cases represent an “environmental” form of the disorder. Similarly, it is appealing to assume that “familial” cases (ie, individuals with one or more close relatives affected with the same condition) represent a “genetic” form of the disease. The approach of dividing cases on the basis of the presence or absence of one or more affected relatives can be termed the “sporadic vs familial” method. While particularly widely used with psychiatric disorders [eg, Winokur et al, 1978; Duncavage et al, 1982; Walker and Shaye, 1982; Kendler and Hays, 1982; Goodwin, 1984; Rudduck et al, 19851, this approach has also been used with other common familial disorders of man [Anderson 1971; Berg, 1983; Williams et al, 19841.
This method has certain obvious limitations, as it (1) neglects differences in the size and age structure of families, (2) ignores the possibility that environmental factors shared by relatives could also be responsible for familial cases, and (3) does not consider the fact that all forms of genetic transmission except that of a fully penetrant Mendelian dominant (without mutation) predict that individuals with a predominantly genetic disorder may have no affected relatives [Kendler and Hays, 19821.
Recently, Eaves et a1 [ 19861, assuming a normally distributed multifactorial threshold model, explored the statistical power of the sporadic vs familial classifica- tion. They concluded that, unless monozygotic (MZ) twins were utilized, this method was a relatively weak method of detecting etiologic heterogeneity.
This article outlines a complementary method of evaluating the sporadic vs familial classification. The present approach assumes distinct “genetic” and “environ- mental” forms of illness. This assumption permits the evaluation of the specificity, sensitivity, and positive and negative predictive value of the sporadic vs familial method. By restricting genetic effects to a single locus, it becomes possible to evaluate a much more realistic range of family sizes and relationships than was possible with the multifactorial threshold model.
METHODS Model of Disease Etiology
The model used in this report, similar to that proposed by Greenberg and Hodge [1985], assumes two distinct processes of disease etiology. The first is based on a generalized diallelic single “major” locus (SML). “A” is the pathogenic allele, and the population frequency of the A and a alleles are, respectively, p and q, with q= 1 -p. The “true” probability of illness (reflected by the subscript t) for each of the three genotypes is AA - ftl, Aa - fa, and aa - ft3. The true penetrances differ from zero and one only because of either developmental stochastic processes or many environmental factors of small effect, the exposure to which are uncorrelated in relatives. For simplicity and heuristic clarity, we assume random mating and the absence of selection, secular trends, or sex-dependent penetrance. Many of the diseases that have been examined by the sporadic vs familial method demonstrate variable age at onset. Therefore, we express the probability of illness under a given condition as a “risk” and assume that all individuals considered have been followed through their age at risk.
Sporadic vs Familial Classification 315
The second etiologic process involves a “major” environmental factor which, given exposure, always causes illness independent of genotype. Exposure to this “major” environmental factor, which occurs with a lifetime probability in the popu- lation of E, is uncorrelated in relatives.
Individuals who become affected by the first and second etiologic processes will be termed, respectively, “genetic” and “environmental” cases. These terms, which are adopted for their heuristic clarity, are here used in an approximate and not a precise manner. That is, “genetic” means “due largely to effects of a single genetic locus but also affected by stochastic developmental parameters and/or many random environmental factors of small effect,” and “environmental” means “due to a major environmental factor of large effect. ” So that individuals with the environmental form of the disorder are a random genotypic sample of the population, a person affected by both processes will be treated as an environmental case.
The population risk for the disorder (K,) is then simply the sum of the risk for the genetic form of the disorder (KpG) and the risk for the environmental form of the disorder (KpE) (which is simply E, the risk of exposure in the population to the major environmental factor). KPG equals
Because individuals may become affected as a result of exposure to the environ- mental factor, the total probability of illness for any genotypic class of individuals exceeds the value of the “true” penetrance. The total probability of illness of individuals by genotype, termed the “observed” penetrance (designated by the sub- script “0”) is, for values of N from 1 to 3, equal to
For any given set of observed penetrances, the maximum proportion of environmental cases in the population (MaxEnv) is constrained by the lowest observed penetrance (usually fo3) by the following relationship:
fo3 MaxEnv = - . KP
(3)
A central feature of the model is that the geaotypic distribution differs in individuals with the genetic vs the environmental form of the disorder. Genotypically, individuals with the environmental form of the disorder are a random sample of the population. The proportion of genetic cases with specific genotypes can be derived from eq (1). An instructive way to summarize this property of the model is to derive the ratio of the proportion of individuals with a given genotype in genetic cases divided by the proportion of individuals with the same genotype in environmental cases. This ratio (RatProp) for genotype N, where N takes values of 1 to 3, equals
foN - . K, - E
RatProp = (5)
316 Kendler
When foN is greater than K,, RatProp will be greater than unity, while when foN is less than K,, RatProp will be less than unity.
SML Model
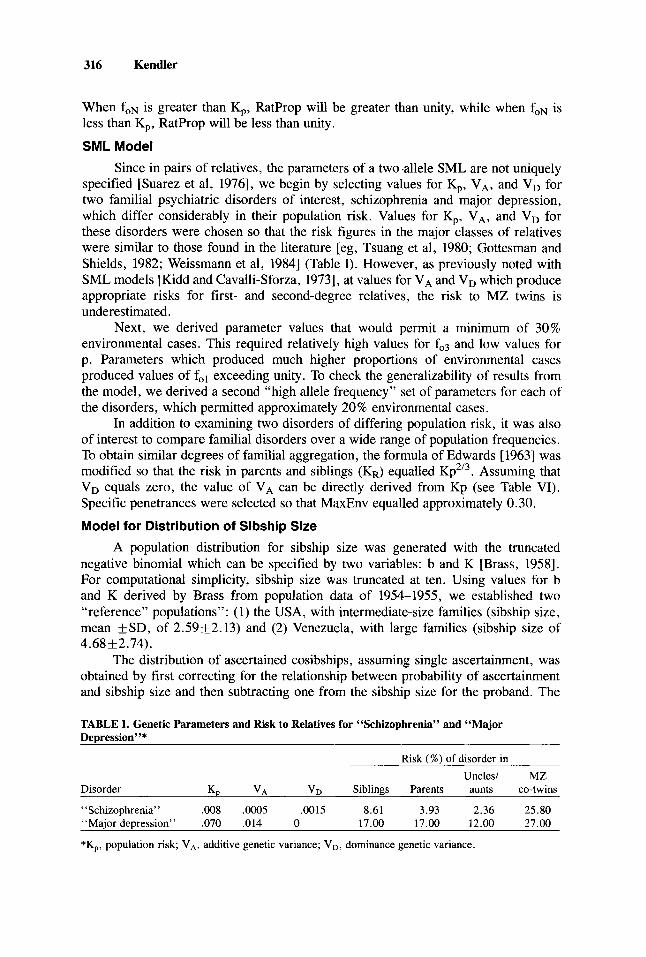
Since in pairs of relatives, the parameters of a two-allele SML are not uniquely specified [Suarez et al, 19761, we begin by selecting values for K,, VA, and VD for two familial psychiatric disorders of interest, schizophrenia and major depression, which differ considerably in their population risk. Values for K,, VA, and VD for these disorders were chosen so that the risk figures in the major classes of relatives were similar to those found in the literature [eg, Tsuang et al, 1980; Gottesman and Shields, 1982; Weissmann et al, 19841 (Table I). However, as previously noted with SML models [Kidd and Cavalli-Sforza, 19731, at values for VA and VD which produce appropriate risks for first- and second-degree relatives, the risk to MZ twins is underestimated.
Next, we derived parameter values that would permit a minimum of 30% environmental cases. This required relatively high values for fo3 and low values for p. Parameters which produced much higher proportions of environmental cases produced values of fol exceeding unity. To check the generalizability of results from the model, we derived a second “high allele frequency” set of parameters for each of the disorders, which permitted approximately 20 % environmental cases.
In addition to examining two disorders of differing population risk, it was also of interest to compare familial disorders over a wide range of population frequencies. To obtain similar degrees of familial aggregation, the formula of Edwards [ 19631 was modified so that the risk in parents and siblings (KR) equalled KP*’~. Assuming that VD equals zero, the value of VA can be directly derived from Kp (see Table VI). Specific penetrances were selected so that MaxEnv equalled approximately 0.30.
Model for Distribution of Sibship Size A population distribution for sibship size was generated with the truncated
negative binomial which can be specified by two variables: b and K [Brass, 19581. For computational simplicity, sibship size was truncated at ten. Using values for b and K derived by Brass from population data of 1954-1955, we established two “reference” populations”: (1) the USA, with intermediate-size families (sibship size, mean +SD, of 2.59+2.13) and (2) Venezuela, with large families (sibship size of 4.68 + 2.74).
The distribution of ascertained cosibships, assuming single ascertainment, was obtained by first correcting for the relationship between probability of ascertainment and sibship size and then subtracting one from the sibship size for the proband. The
TABLE I. Genetic Parameters and Risk to Relatives for “Schizophrenia” and “Major Depression”*
Risk (%) of disorder in Uncles/ MZ
Disorder K, V A VD Siblings Parents aunts co-twins
‘Schizophrenia” ,008 .0005 ,0015 8.61 3.93 2.36 25.80 “Major depression” ,070 .014 0 17.00 17.00 12.00 27.00
*Kp, population risk; VA, additive genetic variance; VD, dominance genetic variance.
Sporadic vs Familial Classification 317
means and SDs of the ascertained cosibships was 3.34k2.24 in the USA and 5.28k2.42 in Venezuela.
A distribution of sibships of parents of probands, termed “uncleships,” was also generated assuming no intergenerational change and no heritable component in sibship size. Sibships of size zero were eliminated because they could not produce a parent, and then one had to be subtracted for the parent. The means and standard deviations of uncleship sizes was 2.06k 1.98 in the USA and 3.90k2.60 in Venezuela.
Calculating Proportion of Cases With Positive Family Histories
The remaining major computational problem was to calculate the proportion of genetic and environmental cases with and without an affected relative conditional on (1) the classes of relatives considered, (2) the distribution of sibship sizes in the population, (3) the gene frequency and observed penetrance parameters, and (4) the proportion of cases in the population that are environmental in origin. Computer programs were developed in BASIC to perform these calculations for (1) nuclear families (SPORFAM), (2) nuclear families with one MZ co-twin substituted for the first co-sib (SPFAMMZ), and (3) nuclear families with maternal and paternal uncles/ aunts (SPFAMUN). In addition, SPORFAM was modified to determine the propor- tion of environmental and genetic cases with no affected, one affected, and two or more affected relatives (SPORFAM2). Further details and/or copies of these pro- grams are available on request.
Descriptive Statistics and Measures of Association
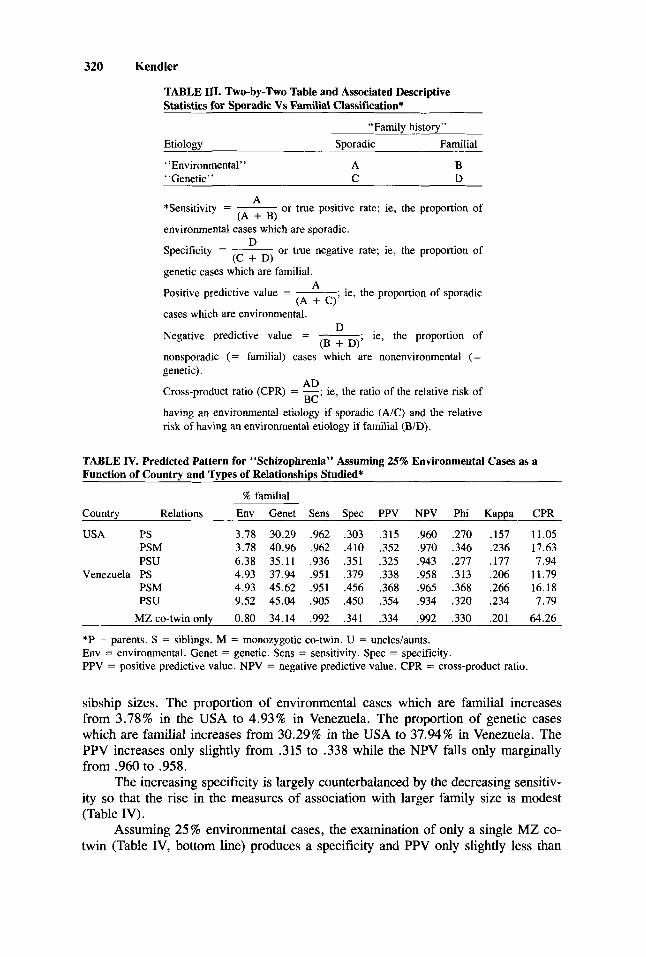
The output of these programs is a 2 X 2 table that depicts the relationship between etiology and “family history” by showing the proportion of environmental and genetic cases which are, respectively, sporadic and familial (Table 111). In this paper, we employ four “descriptive” statistics and three measures of what can loosely be termed “association. ” The four descriptive statistics-sensitivity, specificity, and positive and negative predictive value (PPV and NPV)-are defined in Table 111.
The first measure of association used is the phi coefficient. A limitation of this statistic is that the marginal values fix the maximum possible correlation. However, as noted by Ferguson [1971, p 3511, this fact “rightly reflects the loss in degree of prediction resulting from the lack of concordance of the two marginal distributions. ” As a true correlation coefficient, the square of the value of phi reflects the proportion of variance in the dependent measure (etiology) accounted for by the independent measure (family history) and is directly related to the sample size required to detect with a given power a significant relationship between the two measures.
The second measure of association, the kappa coefficient [Cohen, 19601, reflects how often, corrected for chance agreement, our putative index of etiology (family history) accurately informs us of the true etiology. The third measure of association, the cross-product ratio (CPR), reflects how much the relative risk of having an environmental etiology is increased when a case is sporadic vs when it is familial (Table 111).
RESULTS “Schizophrenia”
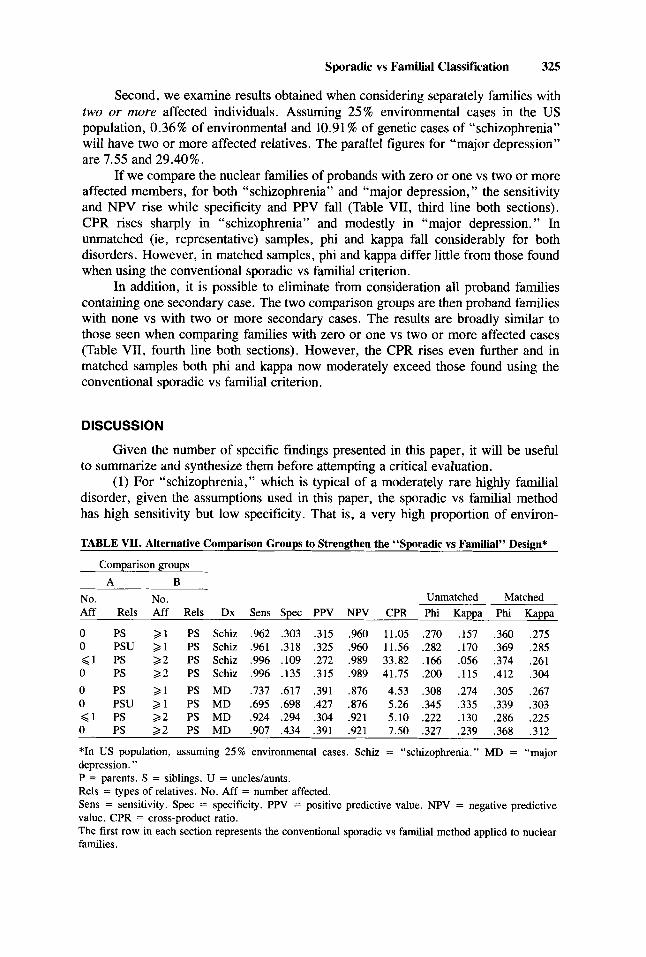
Figure 1 depicts the results obtained by using the “low-frequency” allele parameters for schizophrenia (Table II) with nuclear families in the US population
318 Kendler
I 0 I I I I I I
5 10 15 2 0 25 30
% ENVIRONMENTAL CASES
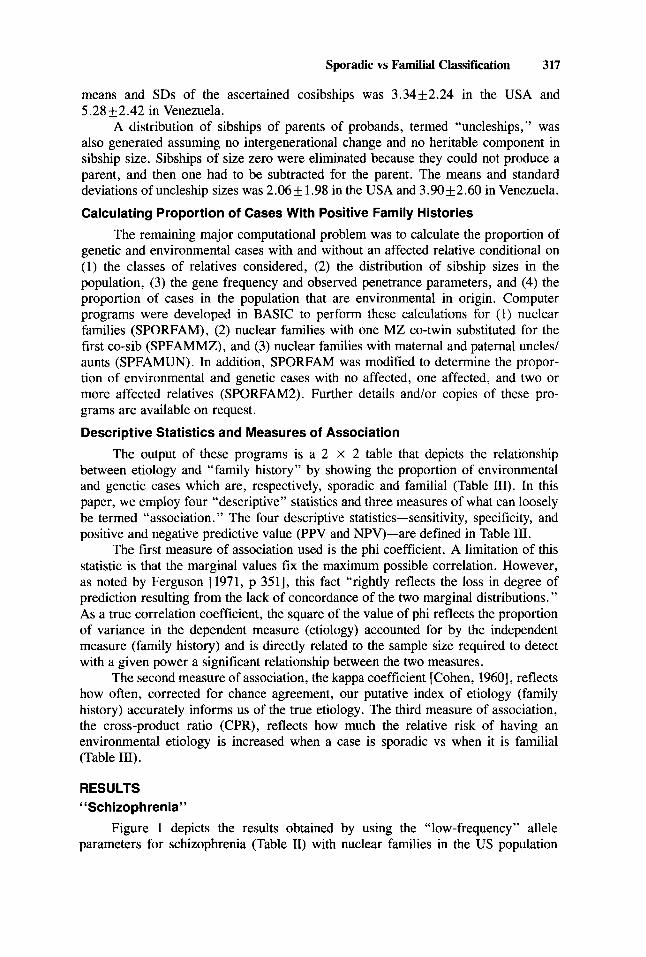
Fig. 1. Sensitivity (Sens), specificity (Spec), positive predictive value (PPV), negative predictive value (NPV), kappa, phi (c#J), and the cross-product ratio (CPR) of the sporadic vs familial classification for “schizophrenia” (with the “low frequency” allele parameters, Table 11) in nuclear families in the US population as a function of the proportion of affected individuals with an environmental etiology.
TABLE 11. “LOW” and “High” Frequency Allele Parameters for Single Major Locus (SML) Models for “Schizophrenia” and “Major Depression”*
% affected
Penetrances Maximum % environmental
Disorder P f l f2 f3 AA Aa aa cases
“Schizophrenia’ ’ .05 .8817 .0346 .00278 27.6 41.1 31.4 34.7 .I2 .3777 ,00625 ,00160 68.0 16.5 15.5 20.0
“Major depression” .05 ,7994 ,4155 ,0316 2.9 56.4 40.7 45.1 .I0 ,5720 .2931 .0142 8.2 75.4 16.4 20.3
f3
KP *Maximum % environmental cases = - . 100.
when the proportion of affected individuals with an environmental etiology varies from 5 to 30%. The proportion of environmental cases that are sporadic (ie, the sensitivity) is constant at .962. The proportion of genetic cases which are familial (ie, the specificity), increases slowly from .247 when 5 % of affected cases are environ- mental to .322 when 30% are environmental. The proportion of sporadic cases which are environmental (the PPV, increases more sharply from .063 to .378, while the proportion of familial cases which are genetic (the NPV, falls slightly from .992 to .952.
Sporadic vs Familial Classification 319
Values for both phi and kappa increase considerably as a function of the proportion of environmental cases. For example, when 10 % of affected individuals are environmental, phi equals .156 and kappa equals .056. When 30% of cases are environmental, the parallel values are .306 and .197, respectively. By contrast, the CPR changes only modestly over the range, equalling 8.87 when 10% of cases are environmental and 12.07 with 30% environmental cases.
We assessed the impact of family size on the results of the sporadic vs familial classification in two ways. First, we assumed nuclear families with a fixed co-sibship size. Although unrealistic, this approach permits an easy exploration of a wide range of family sizes. Second, using the truncated negative binomial distribution, we examined our two reference populations.
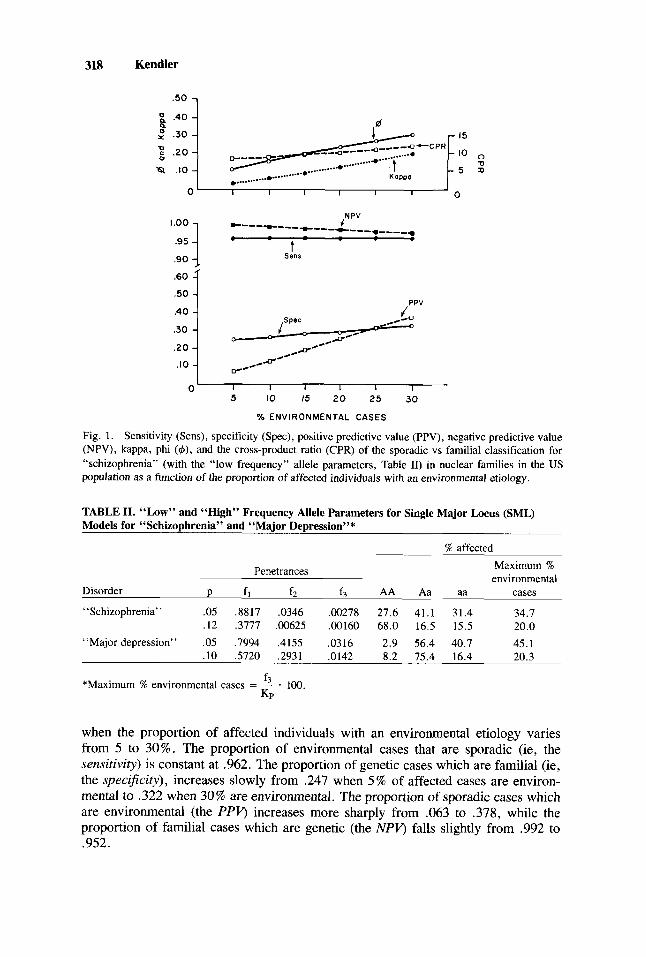
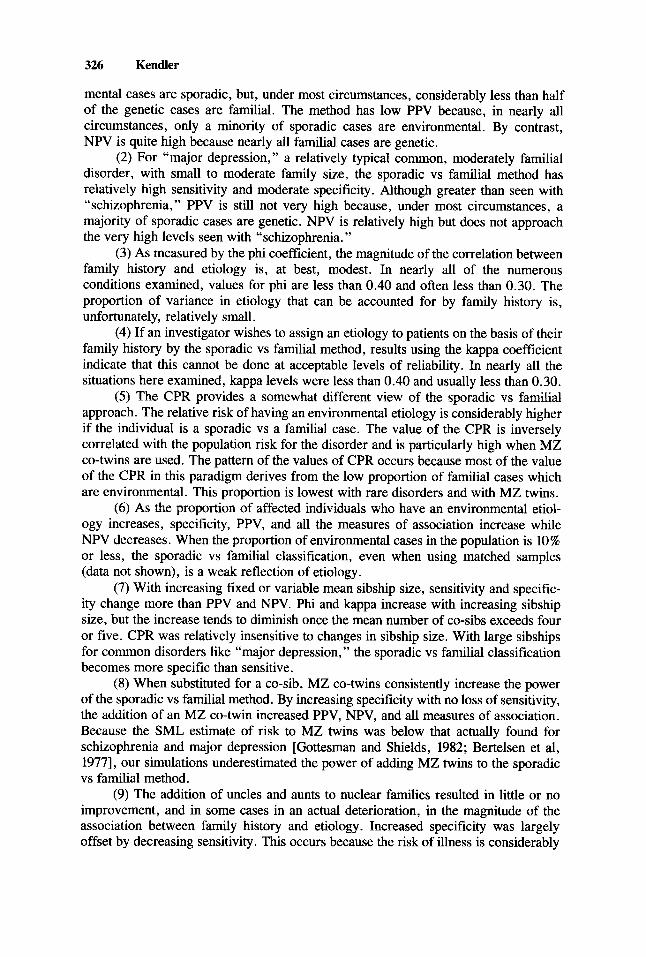
Assuming 25% environmental cases, the results for “schizophrenia” with nu- clear families of fixed co-sibship size from 0 to 9 are seen in Figure 2. As sibship size increases, specificity rises rapidly, but sensitivity falls. PPV rises with increasing sibship size, but more slowly than specificity. NPV increases slightly up to co- sibships of size 4 and then decreases slightly.
Values for both phi and kappa increase rapidly up to co-sibship sizes of 4, but after that increase more slowly. The CPR behaves differently, increasing in magnitude up to sibship size 6 and then slowly decreasing.
Table IV depicts the results assuming 25% environmental cases in the two reference populations. The pattern of results is similar to that seen with the fixed co-
.50 1 d
0‘ I 1 I I I I I I I ‘ 0
/ Sens
.60 { + ;qyF;-; r’l-
.I0
0 1 2 3 4 5 6 7 8 9
FIXED NUMBER OF CO-SIBS
Fig. 2. Sensitivity (Sens), specificity (Spec), positive predictive value (PPV), negative predictive value (NPV), kappa, phi (4), and the cross-product ratio (CPR) of the sporadic vs familial classification for “schizophrenia” (with the “low frequency” allele parameters, Table 11) in nuclear families as a function of fixed co-sibship size given that 25 X of affected individuals have an environmental etiology.
320 Kendler
TABLE 111. Two-by-Two Table and Associated Descriptive Statistics for Sporadic Vs Familial Classification*
“Family history” Etiology Sporadic Familial
“Environmental” “Genetic”
A C
B D
A (A + B)
*Sensitivity = ~ or true positive rate; ie, the proportion of
environmental cases which are sporadic. D
Specificity = ~ or true negative rate; ie, the proportion of (C + D)
genetic cases which are familial.
Positive predictive value = -. A ie, the proportion of sporadic (A + C)’
cases which are environmental.
ie, the proportion of D
Negative predictive value = -‘ (B + D)’
nonsporadic (= familial) cases which are nonenvironmental (= genetic).
Cross-product ratio (CPR) = -; ie, the ratio of the relative risk of
having an environmental etiology if sporadic (AK) and the relative risk of having an environmental etiology if familial (BID).
AD . BC
TABLE IV. Predicted Pattern for “Schizophrenia” Assuming 25% Environmental Cases as a Function of Country and Types of Relationships Studied*
% familial Country Relations Env Genet Sens Spec PPV NPV Phi Kappa CPR
USA PS 3.78 30.29 .962 .303 .315 .960 ,270 .157 11.05 PSM 3.78 40.96 .962 .410 .352 .970 .346 ,236 17.63 PSU 6.38 35.11 ,936 .351 ,325 .943 ,277 .177 7.94
Venezuela PS 4.93 37.94 ,951 ,379 .338 ,958 .313 .206 11.79 PSM 4.93 45.62 .951 .456 ,368 .965 .368 .266 16.18 PSU 9.52 45.04 .905 ,450 .354 ,934 .320 ,234 7.79
MZco-twinonly 0.80 34.14 ,992 .341 ,334 .992 .330 .201 64.26
*P = parents. S = siblings. M = monozygotic co-twin. U = uncles/aunts. Env = environmental. Genet = genetic. Sens = sensitivity. Spec = specificity. PPV = positive predictive value. NPV = negative predictive value. CPR = cross-product ratio.
sibship sizes. The proportion of environmental cases which are familial increases from 3.78% in the USA to 4.93% in Venezuela. The proportion of genetic cases which are familial increases from 30.29% in the USA to 37.94% in Venezuela. The PPV increases only slightly from .315 to .338 while the NPV falls only marginally from .960 to .958.
The increasing specificity is largely counterbalanced by the decreasing sensitiv- ity so that the rise in the measures of association with larger family size is modest (Table IV).
Assuming 25% environmental cases, the examination of only a single MZ co- twin (Table IV, bottom line) produces a specificity and PPV only slightly less than
Sporadic vs Familial Classification 321
that seen with nuclear families in Venezuela, but with a much higher sensitivity and NPV. The value of CPR (64.26) far exceeds that found with any nuclear family size examined. The value of phi and kappa are similar to that found with nuclear families in Venezuela.
Substituting an MZ co-twin for the first co-sib increases specificity, PPV, NPV, and all measures of association in both reference populations (Table IV). Sensitivity, however, is not reduced. This effect is greater in the USA than in Venezuela.
The inclusion of maternal and paternal uncledaunts (ie, uncleships) produces quite a different picture (Table IV). Specificity is substantially increased but with a considerable drop in sensitivity. The large increase in the number of relatives, especially in countries with large sibship sizes, considerably increases the proportion of environmental cases with one or more affected relatives. For example, the addition of uncleships to nuclear families increases the proportion of environmental cases which are familial over 68% in the US population and over 93% in Venezuela. Adding uncleships modestly increases the PPV, but NPV values fall. The increase in specificity is nearly entirely offset by the fall in sensitivity as CPR decreases and phi and kappa increase only very slightly with the addition of uncleships to nuclear families.
As family size increases by the addition of siblings or uncledaunts, the propor- tion of cases of “schizophrenia” in the population that are familial also rises. It is of interest to understand how the measures of association behave in the sporadic vs familial method when this alteration in the underlying proportion of familial cases in the population is eliminated. This can most easily be done by changing the sampling strategy to match, in each population, an equal number of sporadic and familial cases. CPR does not change with such matching, but for “schizophrenia” in the family sizes examined, both phi and kappa increase. Using matched samples, the addition of MZ twins to nuclear families increases both phi and kappa. By contrast, the addition of uncleships decreases both measures of association. Using matched samples also attenuates the rise in phi and kappa seen with increasing family size. With matched samples of fixed co-sibship size, these measures of association hardly increase at all as co-sibship size increases beyond five.
To address the question of how sensitive our results for “schizophrenia” are to changes in parameters of the SML model, results expected in the US population were calculated for the “high” allele frequency parameters (Table 11) for nuclear families when the proportion of environmental cases equaled 10 and 20%. The results are similar to those found with the “low” allele frequency parameters, although specific- ity and the measures of association are 10-20% higher (data not shown).
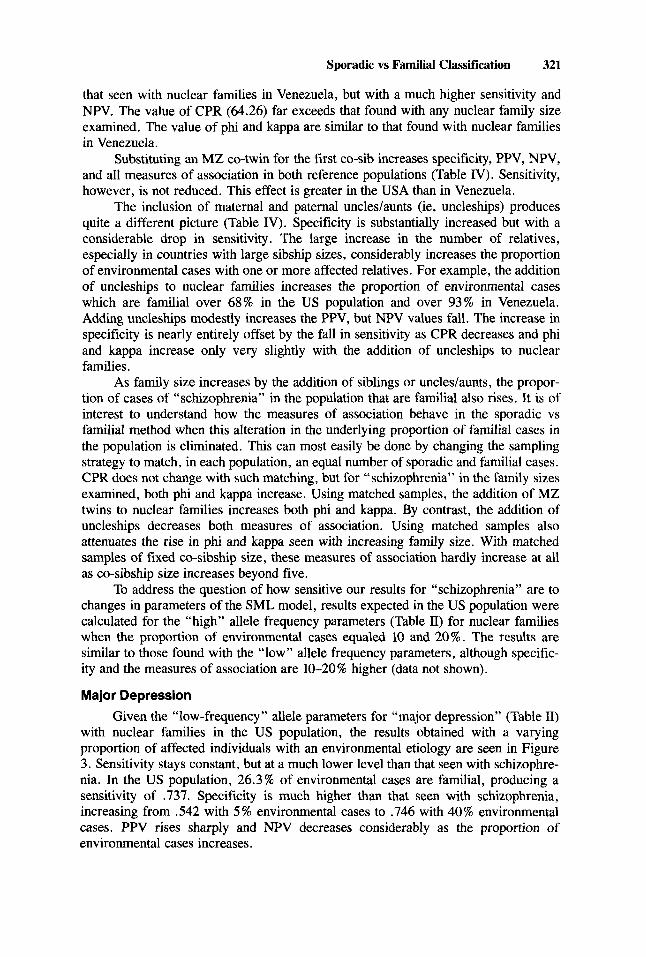
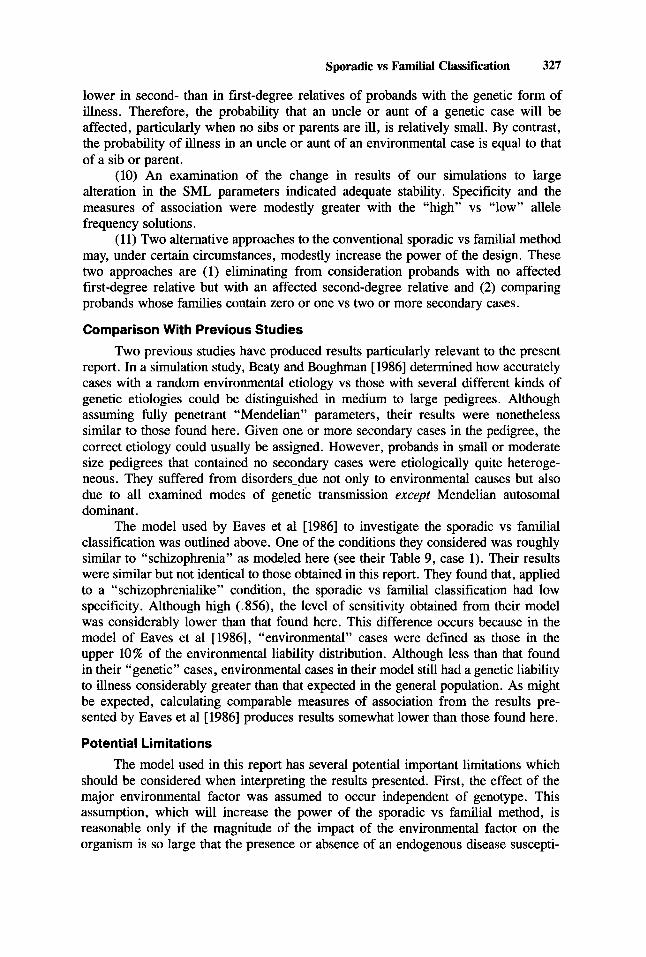
Major Depression Given the “low-frequency ” allele parameters for “major depression” (Table 11)
with nuclear families in the US population, the results obtained with a varying proportion of affected individuals with an environmental etiology are seen in Figure 3. Sensitivity stays constant, but at a much lower level than that seen with schizophre- nia. In the US population, 26.3% of environmental cases are familial, producing a sensitivity of -737. Specificity is much higher than that seen with schizophrenia, increasing from .542 with 5% environmental cases to .746 with 40% environmental cases. PPV rises sharply and NPV decreases considerably as the proportion of environmental cases increases.
322 Kendler
20
I0 II; 0 5 10 % ENVIRONMENTAL 15 2 0 25 CASES 30 35 40
Fig. 3 . Sensitivity (Sens), specificity (Spec), positive predictive value (PPV), negative predictive value (NPV), kappa, phi (+), and the cross-product ratio (CPR) of the sporadic vs familial classification for “major depression” (with the “low frequency” allele parameters, Table 11) in nuclear families in the US population as a function of the proportion of affected individuals with an environmental etiology.
Values for phi and kappa increase considerably as the proportion of environ- mental cases in the population rises. At comparable proportions of environmental cases, phi and kappa are greater for “major depression” than for “schizophrenia.” Values for the CPR increase modestly with an increasing proportion of environmental cases, but the levels remain considerably lower than those found with schizophrenia.
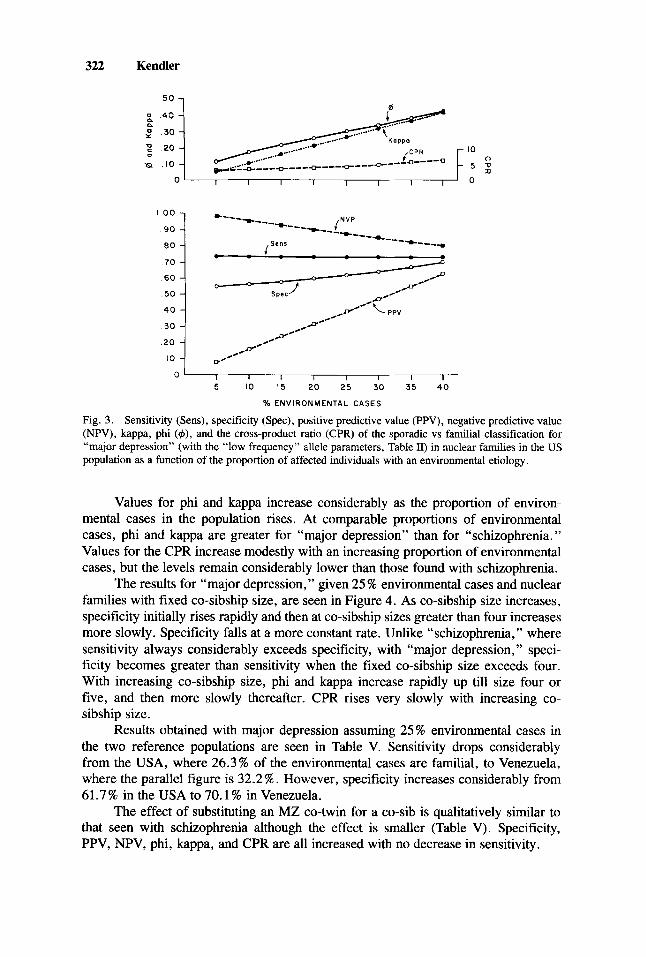
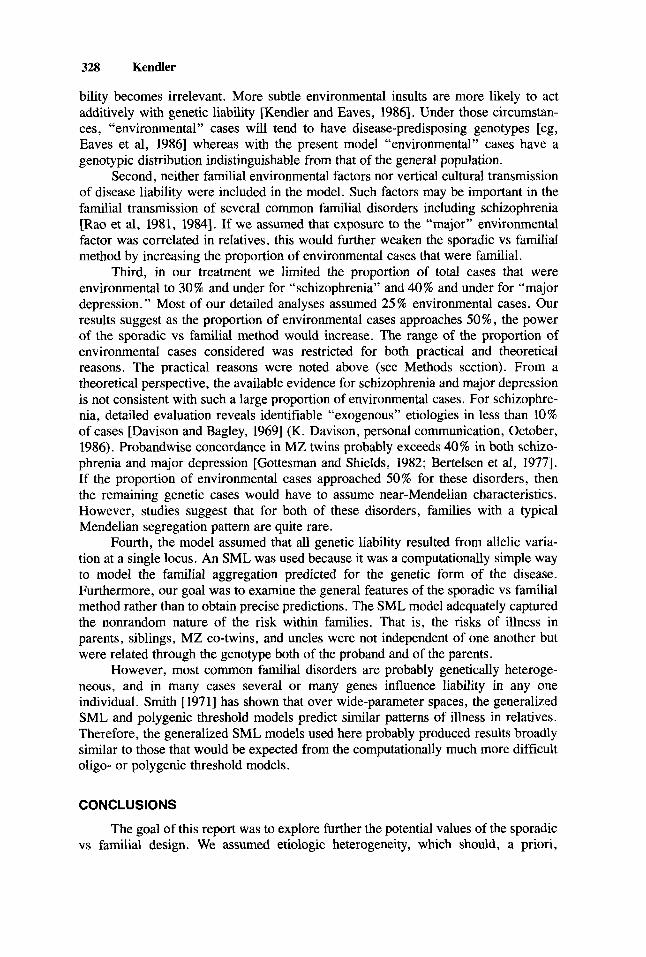
The results for “major depression,” given 25 % environmental cases and nuclear families with fixed co-sibship size, are seen in Figure 4. As co-sibship size increases, specificity initially rises rapidly and then at co-sibship sizes greater than four increases more slowly. Specificity falls at a more constant rate. Unlike “schizophrenia,” where sensitivity always considerably exceeds specificity, with “major depression, ” speci- ficity becomes greater than sensitivity when the fixed co-sibship size exceeds four. With increasing co-sibship size, phi and kappa increase rapidly up till size four or five, and then more slowly thereafter. CPR rises very slowly with increasing co- sibship size.
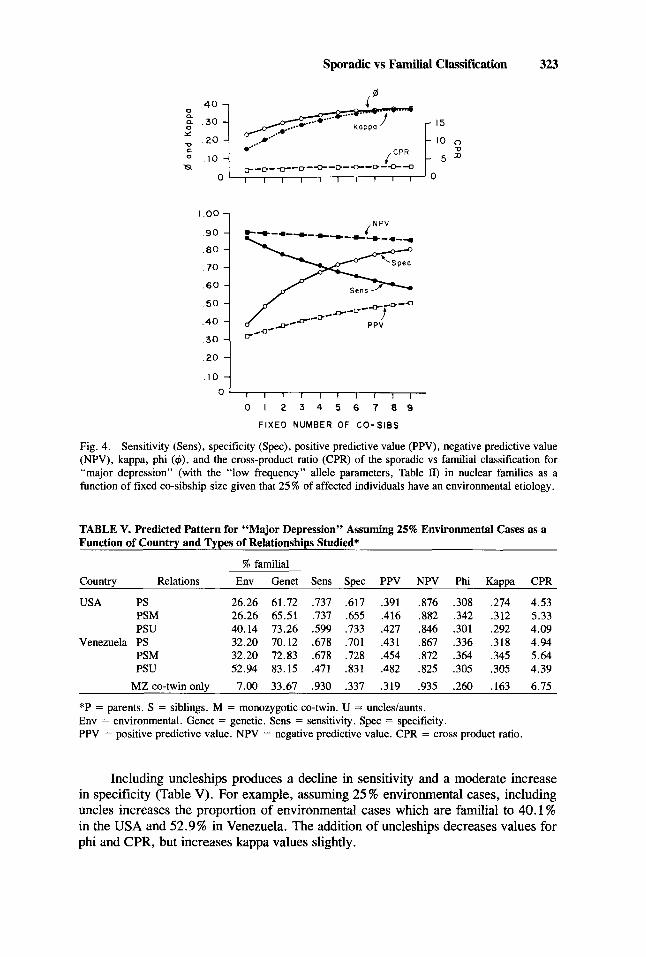
Results obtained with major depression assuming 25% environmental cases in the two reference populations are seen in Table V. Sensitivity drops considerably from the USA, where 26.3% of the environmental cases are familial, to Venezuela, where the parallel figure is 32.2%. However, specificity increases considerably from 61.7% in the USA to 70.1 % in Venezuela.
The effect of substituting an MZ co-twin for a co-sib is qualitatively similar to that seen with schizophrenia although the effect is smaller (Table V). Specificity, PPV, NPV, phi, kappa, and CPR are all increased with no decrease in sensitivity.
Sporadic YS Familial Classification 323
I .oo
90
.80
70
60
50
.40
.30
,NPV
, , , , , I I I I
0 1 2 3 4 5 8 7 8 9
FIXED NUMBER OF C O - S I B S
0
Fig. 4. Sensitivity (Sens), specificity (Spec), positive predictive value (PPV), negative predictive value (NPV), kappa, phi ($), and the cross-product ratio (CPR) of the sporadic vs familial classification for “major depression” (with the “low frequency” allele parameters, Table II) in nuclear families as a function of fixed co-sibship size given that 25 % of affected individuals have an environmental etiology.
TABLE V. Predicted Pattern for “Major Depression” Assuming 25% Environmental Cases as a Function of Country and Types of Relationships Studied’
% familial Country Relations Env Genet Sens Spec PPV NPV Phi Kappa CPR
USA PS 26.26 61.72 .737 .617 ,391 .876 .308 ,274 4.53 PSM 26.26 65.51 ,737 .655 .416 ,882 .342 .312 5.33 PSU 40.14 73.26 .599 .733 .427 .846 .301 ,292 4.09
Venezuela PS 32.20 70.12 .678 .701 ,431 .867 .336 ,318 4.94 PSM 32.20 72.83 .678 .728 .454 ,872 .364 ,345 5.64 PSU 52.94 83.15 ,471 .831 .482 .825 .305 ,305 4.39
MZ co-twin onlv 7.00 33.67 ,930 .337 .319 .935 .260 .163 6.75
*P = parents. S = siblings. M = monozygotic co-twin. U = uncles/aunts. Env = environmental. Genet = genetic. Sens = sensitivity. Spec = specificity. PPV = positive predictive value. NPV = negative predictive value. CPR = cross product ratio.
Including uncleships produces a decline in sensitivity and a moderate increase in specificity (Table V). For example, assuming 25 % environmental cases, including uncles increases the proportion of environmental cases which are familial to 40.1 % in the USA and 52.9% in Venezuela. The addition of uncleships decreases values for phi and CPR, but increases kappa values slightly.
324 Kendler
Matching sporadic and familial cases for “major depression” produces rela- tively little change in values for phi and kappa. However, with matched samples, values for phi are consistently higher for “schizophrenia” than for “major depression.”
Differences in results using the “low” vs “high” allele frequency solutions for “major depression” (Table 11) are similar to those found with “schizophrenia”: specificity, PPV, and the measures of association are all modestly greater with the high than with the low allele frequency solution (resuits not shown).
Disorders With Variable Population Risks
We have, in some detail, examined results for “schizophrenia” with a population risk of .008 and “major depression” with a population risk of .07. Table VI depicts results for familial disorders where K, (ie, population risk) ranges from .001 to .20. Results are simulated in the US population, assuming 25% environmental cases. As K, increases, sensitivity and NPV fall while specificity and PPV rise. In the US population with these parameters, the specificity of the sporadic vs familial method will exceed sensitivity when K, is .10 or higher. CPR falls rapidly as K, rises. In unmatched samples, phi and kappa both increase rapidly as K, increases. However, in matched samples, phi is nearly constant and kappa increases more slowly with rising values of K,.
Alternative Comparison Groups As traditionally used, the “sporadic vs familial” method separates probands on
the basis of their having zero vs one or more affected individuals. It is of interest to explore two alternative strategies for strengthening the sporadic vs familial method. First, following a strategy used by Kendler and Hays [1982] and Walker and Shaye [ 19821, we eliminate from consideration “familial” cases in which the only affected relative is an uncle or aunt. That is, sporadic cases are now defined as having no affected parents, siblings, or uncledaunts, while familial cases are defined as having one or more affected siblings or parents. As seen in Table VII (second line in both sections), this approach modestly increases specificity and decreases sensitivity for both “schizophrenia” and “major depression.” PPV rises with no decrease in NPV in both disorders. Phi and kappa increase slightly for “schizophrenia” and moderately for “major depression.”
TABLE VI. The Effect of Variable Population Risk on Results of the Sporadic Vs Familial Classification*
% familial Unmatched Matched Kp KR Env Genet Sens Spec PPV NPV CPR Phi Kappa Phi Kappa
.001 .01 0.52 6.70 .995 .067 .262 .975 13.71 .121 .032 .338 .237
.005 .029 2.49 17.99 ,975 .180 .284 .956 8.60 ,193 ,086 ,324 .240
.01 .046 4.78 26.64 .952 .266 .302 .944 7.23 .232 .127 .320 .246
.05 .136 19.80 57.29 .802 .573 .385 .897 5.43 .325 .275 .328 ,282
. 10 .215 34.09 72.60 ,659 ,726 ,445 ,865 5.12 .345 .332 ,341 .310
.20 ,342 54.87 86.14 .451 .861 .520 .824 5.11 .329 ,327 ,362 .345
*KR = risk to parents and siblings. KR set to equal Kp2’3. Results obtained when VD=O, then V, equal to 2(Kps’3-Kp2). Specific penetrances were obtained so that maximum % environmental cases equal 30%. Results above in the US population when the proportion of environmental cases equals 25%. Env = environmental. Genet = genetic. Sens = sensitivity. Spec = specificity. PPV = positive predictive value. NPV = negative predictive value. CPR = cross-product ratio.
Sporadic vs Familial Classification 325
Second, we examine results obtained when considering separately families with two or more affected individuals. Assuming 25% environmental cases in the US population, 0.36% of environmental and 10.91 % of genetic cases of “schizophrenia” will have two or more affected relatives. The parallel figures for “major depression” are 7.55 and 29.40%.
If we compare the nuclear families of probands with zero or one vs two or more affected members, for both “schizophrenia” and “major depression, ” the sensitivity and NPV rise while specificity and PPV fall (Table VII, third line both sections). CPR rises sharply in “schizophrenia” and modestly in “major depression.” In unmatched (ie, representative) samples, phi and kappa fall considerably for both disorders. However, in matched samples, phi and kappa differ little from those found when using the conventional sporadic vs familial criterion.
In addition, it is possible to eliminate from consideration all proband families containing one secondary case. The two comparison groups are then proband families with none vs with two or more secondary cases. The results are broadly simdar to those seen when comparing families with zero or one vs two or more affected cases (Table VII, fourth line both sections). However, the CPR rises even further and in matched samples both phi and kappa now moderately exceed those found using the conventional sporadic vs familial criterion.
DISCUSSION
Given the number of specific findings presented in this paper, it will be useful to summarize and synthesize them before attempting a critical evaluation.
(1) For “schizophrenia,” which is typical of a moderately rare highly familial disorder, given the assumptions used in this paper, the sporadic vs familial method has high sensitivity but low specificity. That is, a very high proportion of environ-
TABLE VII. Alternative Comparison Groups to Strengthen the “Sporadic vs Familial” Design*
Comparison groups A B
No. No. Unmatched Matched Aff Rels Aff Rels Dx Sens Spec PPV NPV CPR Phi Kappa Phi Kappa
0 PS 2 1 PS Schiz .962 ,303 .3 15 .960 11.05 .270 .157 ,360 .275 0 PSU > 1 PS Schiz ,961 .3 18 .325 ,960 11.56 .282 .170 ,369 ,285 < 1 PS 2 2 PS Schiz .996 .lo9 ,272 .989 33.82 .166 .056 .374 .261 0 PS 2 2 PS Schiz ,996 .135 ,315 .989 41.75 ,200 ,115 .412 .304 0 PS 2 1 PS MD ,737 .617 .391 ,876 4.53 .308 ,274 .305 .267 0 PSU 2 1 PS MD ,695 ,698 .427 ,876 5.26 .345 ,335 .339 ,303 < 1 PS 2 2 PS MD .924 .294 .304 .921 5.10 .222 .130 .286 .225 0 PS 2 2 PS MD ,907 ,434 .391 .921 7.50 .327 .239 .368 .312
*In US population, assuming 25% environmental cases. Schiz = “schizophrenia.” MD = “major depression. ” P = parents. S = siblings. U = uncleslaunts. Rels = types of relatives. No. Aff = number affected. Sens = sensitivity. Spec = specificity. PPV = positive predictive value. NPV = negative predictive value. CPR = cross-product ratio. The first row in each section represents the conventional sporadic vs familial method applied to nuclear families.
326 Kendler
mental cases are sporadic, but, under most circumstances, considerably less than half of the genetic cases are familial. The method has low PPV because, in nearly all circumstances, only a minority of sporadic cases are environmental. By contrast, NPV is quite high because nearly all familial cases are genetic.
(2) For “major depression,” a relatively typical common, moderately familial disorder, with small to moderate family size, the sporadic vs familial method has relatively high sensitivity and moderate specificity. Although greater than seen with “schizophrenia,” PPV is still not very high because, under most circumstances, a majority of sporadic cases are genetic. NPV is relatively high but does not approach the very high levels seen with “schizophrenia.”
(3) As measured by the phi coefficient, the magnitude of the correlation between family history and etiology is, at best, modest. In nearly all of the numerous conditions examined, values for phi are less than 0.40 and often less than 0.30. The proportion of variance in etiology that can be accounted for by family history is, unfortunately, relatively small.
(4) If an investigator wishes to assign an etiology to patients on the basis of their family history by the sporadic vs familial method, results using the kappa coefficient indicate that this cannot be done at acceptable levels of reliability. In nearly all the situations here examined, kappa levels were less than 0.40 and usually less than 0.30.
(5) The CPR provides a somewhat different view of the sporadic vs familial approach. The relative risk of having an environmental etiology is considerably higher if the individual is a sporadic vs a familial case. The value of the CPR is inversely correlated with the population risk for the disorder and is particularly high when MZ co-twins are used. The pattern of the values of CPR occurs because most of the value of the CPR in this paradigm derives from the low proportion of familial cases which are environmental. This proportion is lowest with rare disorders and with MZ twins.
(6) As the proportion of affected individuals who have an environmental etiol- ogy increases, specificity, PPV, and all the measures of association increase while NPV decreases. When the proportion of environmental cases in the population is 10 % or less, the sporadic vs familial classification, even when using matched samples (data not shown), is a weak reflection of etiology.
(7) With increasing fixed or variable mean sibship size, sensitivity and specific- ity change more than PPV and NPV. Phi and kappa increase with increasing sibship size, but the increase tends to diminish once the mean number of co-sibs exceeds four or five. CPR was relatively insensitive to changes in sibship size. With large sibships for common disorders like “major depression,” the sporadic vs familial classification becomes more specific than sensitive.
(8) When substituted for a co-sib, MZ co-twins consistently increase the power of the sporadic vs familial method. By increasing specificity with no loss of sensitivity, the addition of an MZ co-twin increased PPV, NPV, and all measures of association. Because the SML estimate of risk to MZ twins was below that actually found for schizophrenia and major depression [Gottesman and Shields, 1982; Bertelsen et al, 19771, our simulations underestimated the power of adding MZ twins to the sporadic vs familial method.
(9) The addition of uncles and aunts to nuclear families resulted in little or no improvement, and in some cases in an actual deterioration, in the magnitude of the association between family history and etiology. Increased specificity was largely offset by decreasing sensitivity. This occurs because the risk of illness is considerably
Sporadic vs Familial Classification 327
lower in second- than in first-degree relatives of probands with the genetic form of illness. Therefore, the probability that an uncle or aunt of a genetic case will be affected, particularly when no sibs or parents are ill, is relatively small. By contrast, the probability of illness in an uncle or aunt of an environmental case is equal to that of a sib or parent.
(10) An examination of the change in results of our simulations to large alteration in the SML parameters indicated adequate stability. Specificity and the measures of association were modestly greater with the “high” vs “low” allele frequency solutions.
(11) Two alternative approaches to the conventional sporadic vs familial method may, under certain circumstances, modestly increase the power of the design. These two approaches are (1) eliminating from consideration probands with no affected first-degree relative but with an affected second-degree relative and (2) comparing probands whose families contain zero or one vs two or more secondary cases.
Comparison With Previous Studies Two previous studies have produced results particularly relevant to the present
report. In a simulation study, Beaty and Boughman [ 19861 determined how accurately cases with a random environmental etiology vs those with several different kinds of genetic etiologies could be distinguished in medium to large pedigrees. Although assuming fully penetrant “Mendelian” parameters, their results were nonetheless similar to those found here. Given one or more secondary cases in the pedigree, the correct etiology could usually be assigned. However, probands in small or moderate size pedigrees that contained no secondary cases were etiologically quite heteroge- neous. They suffered from disorders-due not only to environmental causes but also due to all examined modes of genetic transmission except Mendelian autosomal dominant.
The model used by Eaves et al [1986] to investigate the sporadic vs familial classification was outlined above. One of the conditions they considered was roughly similar to “schizophrenia” as modeled here (see their Table 9, case 1). Their results were similar but not identical to those obtained in this report. They found that, applied to a “schizophrenialike” condition, the sporadic vs familial classification had low specificity. Although high (.856), the level of sensitivity obtained from their model was considerably lower than that found here. This difference occurs because in the model of Eaves et a1 [ 19861, “environmental” cases were defined as those in the upper 10% of the environmental liability distribution. Although less than that found in their “genetic” cases, environmental cases in their model still had a genetic liability to illness considerably greater than that expected in the general population. As might be expected, calculating comparable measures of association from the results pre- sented by Eaves et al [ 19861 produces results somewhat lower than those found here.
Potential Limitations The model used in this report has several potential important limitations which
should be considered when interpreting the results presented. First, the effect of the major environmental factor was assumed to occur independent of genotype. This assumption, which will increase the power of the sporadic vs familial method, is reasonable only if the magnitude of the impact of the environmental factor on the organism is so large that the presence or absence of an endogenous disease suscepti-
328 Kendler
bility becomes irrelevant. More subtle environmental insults are more likely to act additively with genetic liability [Kendler and Eaves, 19861. Under those circumstan- ces, “environmental” cases will tend to have disease-predisposing genotypes [eg , Eaves et al, 19861 whereas with the present model “environmental” cases have a genotypic distribution indistinguishable from that of the general population.
Second, neither familial environmental factors nor vertical cultural transmission of disease liability were included in the model. Such factors may be important in the familial transmission of several common familial disorders including schizophrenia [Rao et al, 1981, 19841. If we assumed that exposure to the “major’, environmental factor was correlated in relatives, this would further weaken the sporadic vs familial method by increasing the proportion of environmental cases that were familial.
Third, in our treatment we limited the proportion of total cases that were environmental to 30% and under for “schizophrenia” and 40% and under for “major depression.” Most of our detailed analyses assumed 25 % environmental cases. Our results suggest as the proportion of environmental cases approaches 50%, the power of the sporadic vs familial method would increase. The range of the proportion of environmental cases considered was restricted for both practical and theoretical reasons. The practical reasons were noted above (see Methods section). From a theoretical perspective, the available evidence for schizophrenia and major depression is not consistent with such a large proportion of environmental cases. For schizophre- nia, detailed evaluation reveals identifiable “exogenous” etiologies in less than 10 % of cases [Davison and Bagley, 19691 (K. Davison, personal communication, October, 1986). Probandwise concordance in MZ twins probably exceeds 40% in both schizo- phrenia and major depression [Gottesman and Shields, 1982; Bertelsen et al, 19771. If the proportion of environmental cases approached 50% for these disorders, then the remaining genetic cases would have to assume near-Mendelian characteristics. However, studies suggest that for both of these disorders, families with a typical Mendelian segregation pattern are quite rare.
Fourth, the model assumed that all genetic liability resulted from allelic varia- tion at a single locus. An SML was used because it was a computationally simple way to model the familial aggregation predicted for the genetic form of the disease. Furthermore, our goal was to examine the general features of the sporadic vs familial method rather than to obtain precise predictions. The SML model adequately captured the nonrandom nature of the risk within families. That is, the risks of illness in parents, siblings, MZ co-twins, and uncles were not independent of one another but were related through the genotype both of the proband and of the parents.
However, most common familial disorders are probably genetically heteroge- neous, and in many cases several or many genes influence liability in any one individual. Smith [ 19711 has shown that over wide-parameter spaces, the generalized SML and polygenic threshold models predict similar patterns of illness in relatives. Therefore, the generalized SML models used here probably produced results broadly similar to those that would be expected from the computationally much more difficult oligo- or polygenic threshold models.
CONCLUSIONS
The goal of this report was to explore further the potential values of the sporadic vs familial design. We assumed etiologic heterogeneity, which should, a priori,
Sporadic vs Familial Classifcation 329
maximize the power of this method. Furthermore, we explored the relative value of different family sizes and combinations of relatives.
Given that the model used in this paper is an adequate representation of reality, what are the major practical implications of our findings? Most importantly, the power of the sporadic vs familial classification should not be overestimated. Even in the presence of “purely” environmental cases, the division of probands into those with and without one or more affected relatives produces a classification that is at best only modestly correlated with etiology.
A second major point is that although it is generally not very powerful, for certain specific questions, the sporadic vs familial method can be quite informative. The best example of this is with rare familial disorders where the absence of secondary cases in the family provides little information about etiology (ie, PPV is low), but the presence of one or more secondary cases makes an environmental etiology very unlikely (ie, NPV is high).
Given the major limitations of the “sporadic vs familial” method, investigators should seriously consider other approaches to data analysis. We will here mention three. The first is to calculate, for each family, the observed age-corrected risk of illness. This can then be used directly as a quantitative index of familial risk or can be “weighted” by family size [Kendler et al, in press]. Second, for each family, a ratio or “family history score” can be derived from the observed number of affected individuals and the number expected given the specific age structure of the family [Williams et al, 1984; Chakraborty et al, 19841. Third, methods of segregation analysis can be used to calculate likelihoods for individual families under a series of possible models of disease transmission (including a “sporadic” model) peaty and Boughman, 19861. As all of these methods use more information than the “sporadic vs familial” classification, they are likely to be more powerful. However, none of them is capable of solving all of the problems inherent in attempts to relate etiology to family history. For example, in moderate-sized pedigrees, probands with no affected relatives will often be identified by likelihood methods as probably “environ- mental” when in fact their disorder is caused by a “recessivelike” major gene [Beaty and Boughma;, 19861.
ACKNOWLEDGMENTS
Dr. J.S. Gale kindly provided the proof for the simplified treatment of the bi- and trinomial distributions used in SPORFAM and related programs. This work was supported in part by Public Health Service grant MH-40828.
REFERENCES
Anderson DE (1971): Some characteristics of familial breast cancer. Cancer 28: 1500-1504. Beaty TH, Boughman JA (1986): Problems in detecting etiological heterogeneity in genetic disease
Berg K (1983): Genetics of coronary heart disease. In Steinberg AG, Bearn AB, Motulsky AG, Childs
Bertelsen A, Harvald B, Hauge M (1977): A Danish twin study of manic-depressive disorders. Br J
Brass W (1958): The distribution of births in human populations. Popul Stud 12:51-72.
illustrated with retinitis pigmentosa. Am J Med Genet 24:493-504.
(4s ) : “Progress in Medical Genetics. ” Philadelphia: Saunders, pp 35-90.
Psychiatry 130:330-351.
330 Kendler
Chakraborty R, Weiss KM, Majumder PP, Strong LC, Herson J (1984): A method to detect excess risk of disease in structured data: Cancer in relatives of retinoblastoma patients. Genet Epidemiol 1:229-244.
Cohen J (1960): A coefficient of agreement for nominal scales. Educ Psycho1 Measur 20:37-46. Davision K, Bagley CR (1969): Schizophrenia-like psychoses associated with organic disorders of the
central nervous system: A review of the literature. In Herrington RN (ed): “Current Problems in Neuropsychiatry : Schizophrenia, Epilepsy, the Temporal Lobes. ” Ashford, Kent: Headley Broth- ers, pp 113-184.
Duncavage M, Luchins DJ, Meltzer HY (1982): Platelet MA0 activity and family history of schizophre- nia. Psychiatry Res 7:47-51.
Eaves LJ, Kendler KS, Schulz SC (1986): The familial sporadic classification: Its power for the resolution of genetic and environmental etiologic factors. J Psychiatr Res 20:115-130.
Edwards JH (1963): The genetic basis of common disease. Am J Med 34:627-638. Ferguson GA (1971): “Statistical Analysis in Psychology and Education,” 3rd Ed. New York: McGraw-
Goodwin DW (1984): Studies of familial alcoholism: A review. J Clin Psychiatry 45:14-17. Gottesman II, Shields J (1982): “Schizophrenia: The Epigenetic Puzzle.” Cambridge: Cambridge
Greenberg DA, Hodge SE (1985): The heterogeneity problem. I. Separating genetic from environmental
Kendler KS, Eaves LJ (1986): Models for the joint effect of genotype and environment on liability to
Kendler KS, Hays P (1982): Familial and sporadic schizophrenia: A symptomatic, prognostic, and EEG
Kendler KS, Hays P, Tsuang MT: Age at onset in schizophrenia: A familial perspective. Arch Gen
Kidd KK, Cavalli-Sforza LL (1973): An analysis of the genetics of schizophrenia. SOC Biol20:254-265. Rao DC, Morton NE, Gottesman 11, Lew R (1981): Path analysis of qualitative data on pairs of relatives:
Application to schizophrenia. Hum Hered 31:325-333. Rao DC, McGue M, Wette R, Glueck CJ (1984): Path analysis in genetic epidemiology. In Chakravarti
A (4) : “Human Population Genetics: The Pittsburgh Symposium.’’ New York: Van Nostrand Reinhold, pp 35-81.
Rudduck C, Franzen G, Low B, Rorsman B (1984): HLA antigens in patients with and without a family history of schizophrenia. Hum Hered 34:291-296.
Smith C (1971): Discriminating between different modes of inheritance in genetic disease. Clin Genet
Suarez BK, Reich T, Trost J (1976): Limits of the general two-allele single locus model with incomplete penetrance. Ann Hum Genet 40:231-244.
Tsuang MT, Winokur G, Crowe RR (1980): Morbidity risks in schizophrenia and affective disorders among first degree relatives of patients with schizophrenia, mania, depression and surgical conditions. Br J Psychiatry 137:497-504.
Walker E, Shaye J (1982): Familial schizophrenia: A predictor of neuromotor and attentional abnormal- ities in schizophrenia. Arch Gen Psychiatry 39: 1153-1156.
Weissmann MM, Gershon ES, Kidd KK, Prusoff BA, Leckman JF, Dibble E, Hamovit J, Thompson WD, Pads DL, Guroff JJ (1984): Psychiatric disorders in relatives of probands with affective disorders: The Yale University-National Institutes of Mental Health collaborative study. Arch Gen Psychiatry 41:13-21.
Williams RR, Dadone MM, Hunt SC, Jorden LB, Hopkins PN, Smith JB, Ash KO, Kuida H (1984): The genetic epidemiology of hypertension. A review of past studies and current results for 948 persons in 48 Utah pedigrees. In Rao DC, Elston RC, Kuller LH, Feinleib M, Carter C, Havlik R (eds): “Genetic Epidemiology of Coronary Heart Disease: Past, Present, and Future.” New York: Alan R. Liss, Inc., pp. 419442.
Winokur G, Behar D, Vanvalkenburg C, Lowry M (1978): Is a familial definition of depression both feasible and valid? J Nerv Ment Dis 166:764-768.
Hill.
University Press.
forms of the same disease. Am J Med Genet 21:357-371.
psychiatric illness. Am J Psychiatry 143:279-289.
comparison. Am J Psychiatry 139:1557-1562.
Psychiatry (in press).
21303-314.
Edited by C.R. Cloninger