spontaneous marangoni mixing of miscible liquids at a liquid...
TRANSCRIPT
Spontaneous Marangoni Mixing of Miscible Liquids at a Liquid−Liquid−Air Contact LineHyoungsoo Kim,*,† Jeongsu Lee,‡ Tae-Hong Kim,‡ and Ho-Young Kim*,‡
†Department of Mechanical and Aerospace Engineering, Princeton University, Princeton, New Jersey 08544, United States‡Department of Mechanical and Aerospace Engineering, Seoul National University, Seoul 151-744, Republic of Korea
*S Supporting Information
ABSTRACT: We investigate the flow patterns created when a liquid dropcontacts a reservoir liquid, which has implications on various physicochem-ical and biochemical reactions including mixing in microfluidic systems. Thelocalized vortical flow spontaneously triggered by the difference of surfacetension between the two liquids is studied, which is thus termed theMarangoni vortex. To quantitatively investigate the strength of vortices, weperformed particle image velocimetry (PIV) experiments by varying thesurface tension difference, the gap of the flow cell, the density and viscosityof the reservoir liquid, and the size of the drop. A scaling law that balancesthe interfacial energy of the system with the kinetic energy of the vorticalflows allows us to understand the functional dependence of the Marangonivortex strength on various experimental parameters.
■ INTRODUCTIONMixing of different liquids confined within a small volume is animportant issue in many emerging technologies, such as lab-on-a-chip,1 semiconductor cleaning,2,3 and polymer processing.4 Ina microfluidic system where two channels filled with differentliquids merge at a junction to form a single channel, moleculardiffusion is mainly responsible for mixing of the two liquidsunless some mixing scheme is devised. Active mixers useexternal energies (e.g., mechanical, electrical, and magneticeffect) to resonate the mixing,1,5,6 while passive mixingenhances the mixing efficiency by using a complex geometry.7,8
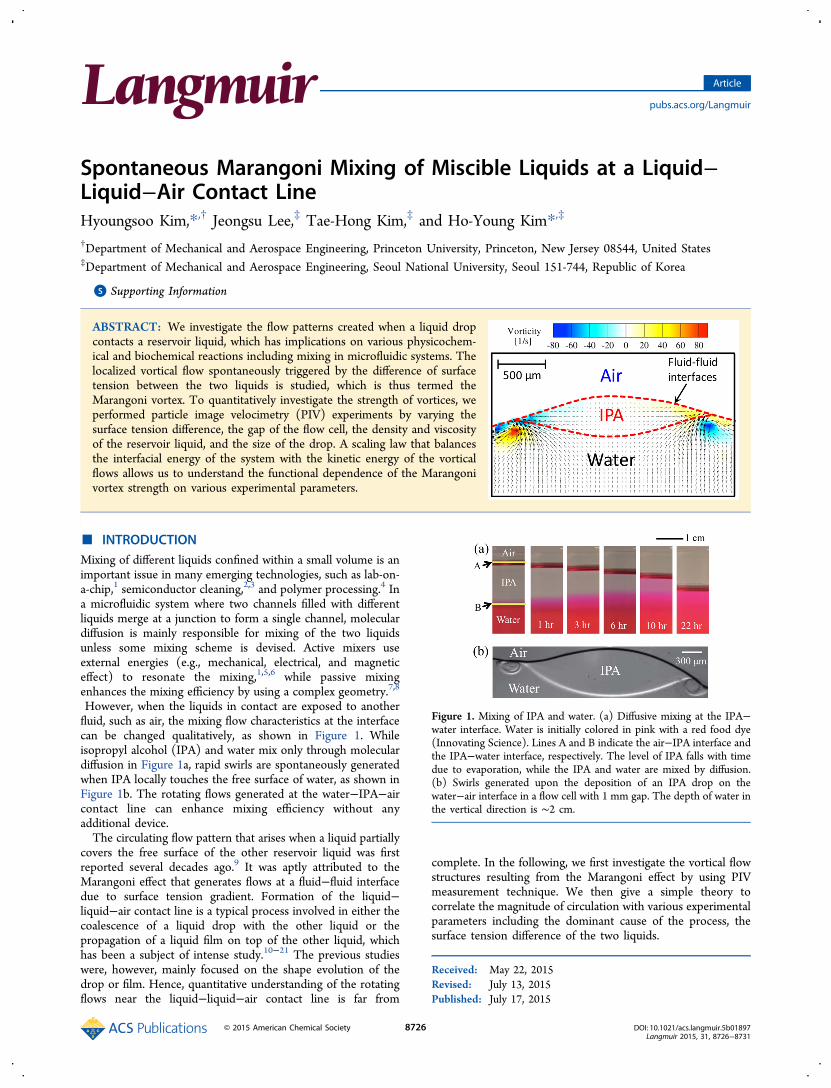
However, when the liquids in contact are exposed to anotherfluid, such as air, the mixing flow characteristics at the interfacecan be changed qualitatively, as shown in Figure 1. Whileisopropyl alcohol (IPA) and water mix only through moleculardiffusion in Figure 1a, rapid swirls are spontaneously generatedwhen IPA locally touches the free surface of water, as shown inFigure 1b. The rotating flows generated at the water−IPA−aircontact line can enhance mixing efficiency without anyadditional device.The circulating flow pattern that arises when a liquid partially
covers the free surface of the other reservoir liquid was firstreported several decades ago.9 It was aptly attributed to theMarangoni effect that generates flows at a fluid−fluid interfacedue to surface tension gradient. Formation of the liquid−liquid−air contact line is a typical process involved in either thecoalescence of a liquid drop with the other liquid or thepropagation of a liquid film on top of the other liquid, whichhas been a subject of intense study.10−21 The previous studieswere, however, mainly focused on the shape evolution of thedrop or film. Hence, quantitative understanding of the rotatingflows near the liquid−liquid−air contact line is far from
complete. In the following, we first investigate the vortical flowstructures resulting from the Marangoni effect by using PIVmeasurement technique. We then give a simple theory tocorrelate the magnitude of circulation with various experimentalparameters including the dominant cause of the process, thesurface tension difference of the two liquids.
Received: May 22, 2015Revised: July 13, 2015Published: July 17, 2015
Figure 1. Mixing of IPA and water. (a) Diffusive mixing at the IPA−water interface. Water is initially colored in pink with a red food dye(Innovating Science). Lines A and B indicate the air−IPA interface andthe IPA−water interface, respectively. The level of IPA falls with timedue to evaporation, while the IPA and water are mixed by diffusion.(b) Swirls generated upon the deposition of an IPA drop on thewater−air interface in a flow cell with 1 mm gap. The depth of water inthe vertical direction is ∼2 cm.
Article
pubs.acs.org/Langmuir
© 2015 American Chemical Society 8726 DOI: 10.1021/acs.langmuir.5b01897Langmuir 2015, 31, 8726−8731
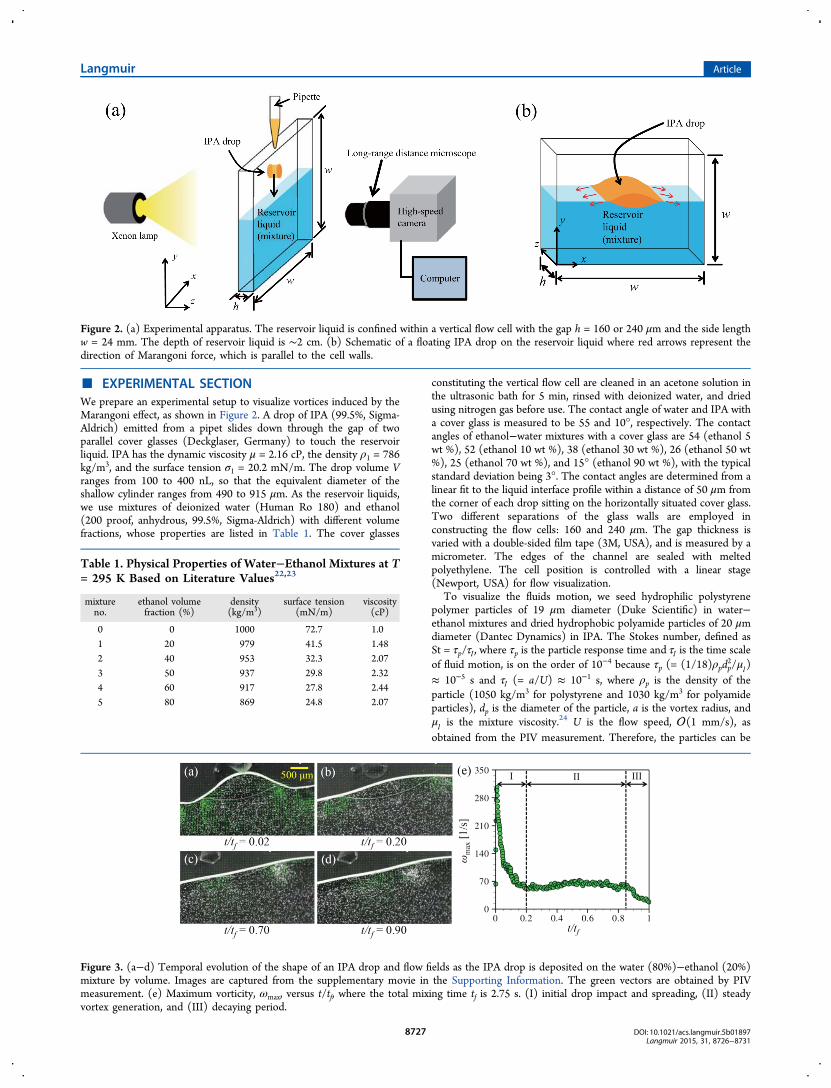
■ EXPERIMENTAL SECTIONWe prepare an experimental setup to visualize vortices induced by theMarangoni effect, as shown in Figure 2. A drop of IPA (99.5%, Sigma-Aldrich) emitted from a pipet slides down through the gap of twoparallel cover glasses (Deckglaser, Germany) to touch the reservoirliquid. IPA has the dynamic viscosity μ = 2.16 cP, the density ρ1 = 786kg/m3, and the surface tension σ1 = 20.2 mN/m. The drop volume Vranges from 100 to 400 nL, so that the equivalent diameter of theshallow cylinder ranges from 490 to 915 μm. As the reservoir liquids,we use mixtures of deionized water (Human Ro 180) and ethanol(200 proof, anhydrous, 99.5%, Sigma-Aldrich) with different volumefractions, whose properties are listed in Table 1. The cover glasses
constituting the vertical flow cell are cleaned in an acetone solution inthe ultrasonic bath for 5 min, rinsed with deionized water, and driedusing nitrogen gas before use. The contact angle of water and IPA witha cover glass is measured to be 55 and 10°, respectively. The contactangles of ethanol−water mixtures with a cover glass are 54 (ethanol 5wt %), 52 (ethanol 10 wt %), 38 (ethanol 30 wt %), 26 (ethanol 50 wt%), 25 (ethanol 70 wt %), and 15° (ethanol 90 wt %), with the typicalstandard deviation being 3°. The contact angles are determined from alinear fit to the liquid interface profile within a distance of 50 μm fromthe corner of each drop sitting on the horizontally situated cover glass.Two different separations of the glass walls are employed inconstructing the flow cells: 160 and 240 μm. The gap thickness isvaried with a double-sided film tape (3M, USA), and is measured by amicrometer. The edges of the channel are sealed with meltedpolyethylene. The cell position is controlled with a linear stage(Newport, USA) for flow visualization.
To visualize the fluids motion, we seed hydrophilic polystyrenepolymer particles of 19 μm diameter (Duke Scientific) in water−ethanol mixtures and dried hydrophobic polyamide particles of 20 μmdiameter (Dantec Dynamics) in IPA. The Stokes number, defined asSt = τp/τ , where τp is the particle response time and τ is the time scaleof fluid motion, is on the order of 10−4 because τp (= (1/18)ρpdp
2/μ )≈ 10−5 s and τ (= a/U) ≈ 10−1 s, where ρp is the density of theparticle (1050 kg/m3 for polystyrene and 1030 kg/m3 for polyamideparticles), dp is the diameter of the particle, a is the vortex radius, andμ is the mixture viscosity.24 U is the flow speed, (1 mm/s), asobtained from the PIV measurement. Therefore, the particles can be
Figure 2. (a) Experimental apparatus. The reservoir liquid is confined within a vertical flow cell with the gap h = 160 or 240 μm and the side lengthw = 24 mm. The depth of reservoir liquid is ∼2 cm. (b) Schematic of a floating IPA drop on the reservoir liquid where red arrows represent thedirection of Marangoni force, which is parallel to the cell walls.
Table 1. Physical Properties of Water−Ethanol Mixtures at T= 295 K Based on Literature Values22,23
mixtureno.
ethanol volumefraction (%)
density(kg/m3)
surface tension(mN/m)
viscosity(cP)
0 0 1000 72.7 1.01 20 979 41.5 1.482 40 953 32.3 2.073 50 937 29.8 2.324 60 917 27.8 2.445 80 869 24.8 2.07
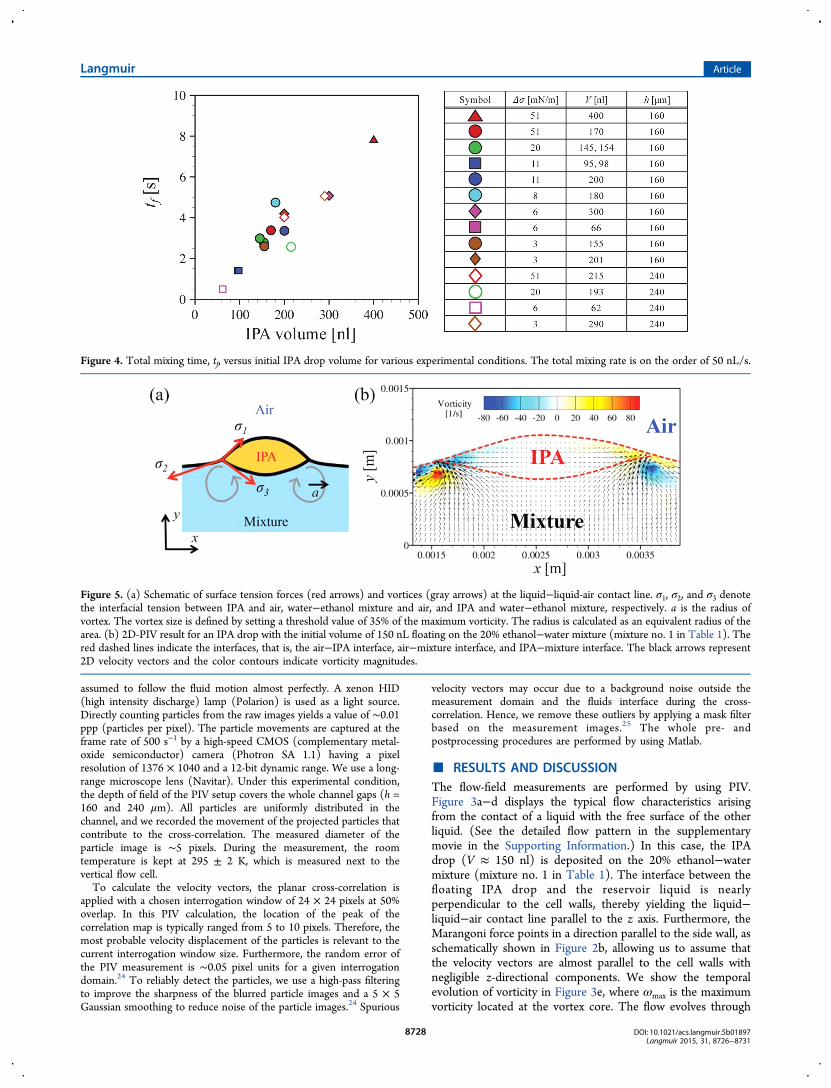
Figure 3. (a−d) Temporal evolution of the shape of an IPA drop and flow fields as the IPA drop is deposited on the water (80%)−ethanol (20%)mixture by volume. Images are captured from the supplementary movie in the Supporting Information. The green vectors are obtained by PIVmeasurement. (e) Maximum vorticity, ωmax, versus t/tf, where the total mixing time tf is 2.75 s. (I) initial drop impact and spreading, (II) steadyvortex generation, and (III) decaying period.
Langmuir Article
DOI: 10.1021/acs.langmuir.5b01897Langmuir 2015, 31, 8726−8731
8727
assumed to follow the fluid motion almost perfectly. A xenon HID(high intensity discharge) lamp (Polarion) is used as a light source.Directly counting particles from the raw images yields a value of ∼0.01ppp (particles per pixel). The particle movements are captured at theframe rate of 500 s−1 by a high-speed CMOS (complementary metal-oxide semiconductor) camera (Photron SA 1.1) having a pixelresolution of 1376 × 1040 and a 12-bit dynamic range. We use a long-range microscope lens (Navitar). Under this experimental condition,the depth of field of the PIV setup covers the whole channel gaps (h =160 and 240 μm). All particles are uniformly distributed in thechannel, and we recorded the movement of the projected particles thatcontribute to the cross-correlation. The measured diameter of theparticle image is ∼5 pixels. During the measurement, the roomtemperature is kept at 295 ± 2 K, which is measured next to thevertical flow cell.To calculate the velocity vectors, the planar cross-correlation is
applied with a chosen interrogation window of 24 × 24 pixels at 50%overlap. In this PIV calculation, the location of the peak of thecorrelation map is typically ranged from 5 to 10 pixels. Therefore, themost probable velocity displacement of the particles is relevant to thecurrent interrogation window size. Furthermore, the random error ofthe PIV measurement is ∼0.05 pixel units for a given interrogationdomain.24 To reliably detect the particles, we use a high-pass filteringto improve the sharpness of the blurred particle images and a 5 × 5Gaussian smoothing to reduce noise of the particle images.24 Spurious
velocity vectors may occur due to a background noise outside themeasurement domain and the fluids interface during the cross-correlation. Hence, we remove these outliers by applying a mask filterbased on the measurement images.25 The whole pre- andpostprocessing procedures are performed by using Matlab.
■ RESULTS AND DISCUSSIONThe flow-field measurements are performed by using PIV.Figure 3a−d displays the typical flow characteristics arisingfrom the contact of a liquid with the free surface of the otherliquid. (See the detailed flow pattern in the supplementarymovie in the Supporting Information.) In this case, the IPAdrop (V ≈ 150 nl) is deposited on the 20% ethanol−watermixture (mixture no. 1 in Table 1). The interface between thefloating IPA drop and the reservoir liquid is nearlyperpendicular to the cell walls, thereby yielding the liquid−liquid−air contact line parallel to the z axis. Furthermore, theMarangoni force points in a direction parallel to the side wall, asschematically shown in Figure 2b, allowing us to assume thatthe velocity vectors are almost parallel to the cell walls withnegligible z-directional components. We show the temporalevolution of vorticity in Figure 3e, where ωmax is the maximumvorticity located at the vortex core. The flow evolves through
Figure 4. Total mixing time, tf, versus initial IPA drop volume for various experimental conditions. The total mixing rate is on the order of 50 nL/s.
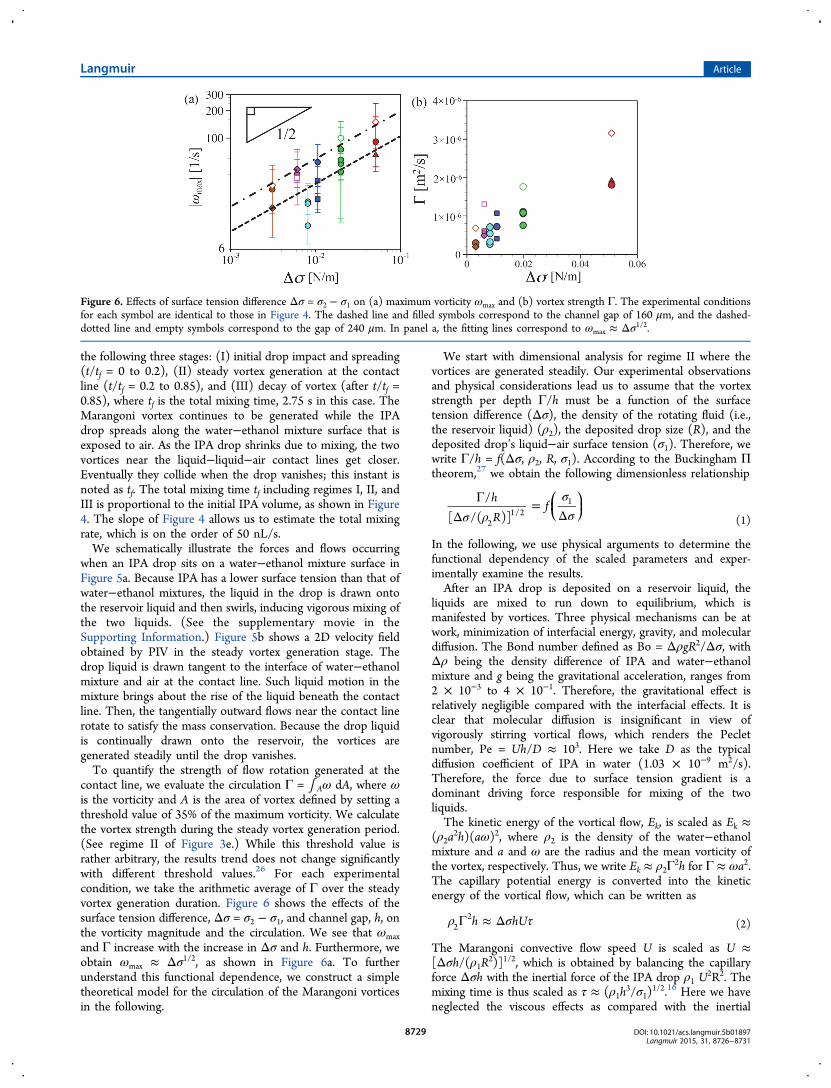
Figure 5. (a) Schematic of surface tension forces (red arrows) and vortices (gray arrows) at the liquid−liquid-air contact line. σ1, σ2, and σ3 denotethe interfacial tension between IPA and air, water−ethanol mixture and air, and IPA and water−ethanol mixture, respectively. a is the radius ofvortex. The vortex size is defined by setting a threshold value of 35% of the maximum vorticity. The radius is calculated as an equivalent radius of thearea. (b) 2D-PIV result for an IPA drop with the initial volume of 150 nL floating on the 20% ethanol−water mixture (mixture no. 1 in Table 1). Thered dashed lines indicate the interfaces, that is, the air−IPA interface, air−mixture interface, and IPA−mixture interface. The black arrows represent2D velocity vectors and the color contours indicate vorticity magnitudes.
Langmuir Article
DOI: 10.1021/acs.langmuir.5b01897Langmuir 2015, 31, 8726−8731
8728
the following three stages: (I) initial drop impact and spreading(t/tf = 0 to 0.2), (II) steady vortex generation at the contactline (t/tf = 0.2 to 0.85), and (III) decay of vortex (after t/tf =0.85), where tf is the total mixing time, 2.75 s in this case. TheMarangoni vortex continues to be generated while the IPAdrop spreads along the water−ethanol mixture surface that isexposed to air. As the IPA drop shrinks due to mixing, the twovortices near the liquid−liquid−air contact lines get closer.Eventually they collide when the drop vanishes; this instant isnoted as tf. The total mixing time tf including regimes I, II, andIII is proportional to the initial IPA volume, as shown in Figure4. The slope of Figure 4 allows us to estimate the total mixingrate, which is on the order of 50 nL/s.We schematically illustrate the forces and flows occurring
when an IPA drop sits on a water−ethanol mixture surface inFigure 5a. Because IPA has a lower surface tension than that ofwater−ethanol mixtures, the liquid in the drop is drawn ontothe reservoir liquid and then swirls, inducing vigorous mixing ofthe two liquids. (See the supplementary movie in theSupporting Information.) Figure 5b shows a 2D velocity fieldobtained by PIV in the steady vortex generation stage. Thedrop liquid is drawn tangent to the interface of water−ethanolmixture and air at the contact line. Such liquid motion in themixture brings about the rise of the liquid beneath the contactline. Then, the tangentially outward flows near the contact linerotate to satisfy the mass conservation. Because the drop liquidis continually drawn onto the reservoir, the vortices aregenerated steadily until the drop vanishes.To quantify the strength of flow rotation generated at the
contact line, we evaluate the circulation Γ = ∫ Aω dA, where ωis the vorticity and A is the area of vortex defined by setting athreshold value of 35% of the maximum vorticity. We calculatethe vortex strength during the steady vortex generation period.(See regime II of Figure 3e.) While this threshold value israther arbitrary, the results trend does not change significantlywith different threshold values.26 For each experimentalcondition, we take the arithmetic average of Γ over the steadyvortex generation duration. Figure 6 shows the effects of thesurface tension difference, Δσ = σ2 − σ1, and channel gap, h, onthe vorticity magnitude and the circulation. We see that ωmaxand Γ increase with the increase in Δσ and h. Furthermore, weobtain ωmax ≈ Δσ1/2, as shown in Figure 6a. To furtherunderstand this functional dependence, we construct a simpletheoretical model for the circulation of the Marangoni vorticesin the following.
We start with dimensional analysis for regime II where thevortices are generated steadily. Our experimental observationsand physical considerations lead us to assume that the vortexstrength per depth Γ/h must be a function of the surfacetension difference (Δσ), the density of the rotating fluid (i.e.,the reservoir liquid) (ρ2), the deposited drop size (R), and thedeposited drop’s liquid−air surface tension (σ1). Therefore, wewrite Γ/h = f(Δσ, ρ2, R, σ1). According to the Buckingham Πtheorem,27 we obtain the following dimensionless relationship
σ ρσσ
ΓΔ
=Δ
⎜ ⎟⎛⎝
⎞⎠
hR
f/
[ /( )]21/2
1
(1)
In the following, we use physical arguments to determine thefunctional dependency of the scaled parameters and exper-imentally examine the results.After an IPA drop is deposited on a reservoir liquid, the
liquids are mixed to run down to equilibrium, which ismanifested by vortices. Three physical mechanisms can be atwork, minimization of interfacial energy, gravity, and moleculardiffusion. The Bond number defined as Bo = ΔρgR2/Δσ, withΔρ being the density difference of IPA and water−ethanolmixture and g being the gravitational acceleration, ranges from2 × 10−3 to 4 × 10⁻¹. Therefore, the gravitational effect isrelatively negligible compared with the interfacial effects. It isclear that molecular diffusion is insignificant in view ofvigorously stirring vortical flows, which renders the Pecletnumber, Pe = Uh/D ≈ 103. Here we take D as the typicaldiffusion coefficient of IPA in water (1.03 × 10⁻⁹ m2/s).Therefore, the force due to surface tension gradient is adominant driving force responsible for mixing of the twoliquids.The kinetic energy of the vortical flow, Ek, is scaled as Ek ≈
(ρ2a2h)(aω)2, where ρ2 is the density of the water−ethanol
mixture and a and ω are the radius and the mean vorticity ofthe vortex, respectively. Thus, we write Ek ≈ ρ2Γ2h for Γ ≈ ωa2.The capillary potential energy is converted into the kineticenergy of the vortical flow, which can be written as
ρ σ τΓ ≈ Δh hU22
(2)
The Marangoni convective flow speed U is scaled as U ≈[Δσh/(ρ1R2)]1/2, which is obtained by balancing the capillaryforce Δσh with the inertial force of the IPA drop ρ1 U
2R2. Themixing time is thus scaled as τ ≈ (ρ1h
3/σ1)1/2.16 Here we have
neglected the viscous effects as compared with the inertial
Figure 6. Effects of surface tension difference Δσ = σ2 − σ1 on (a) maximum vorticity ωmax and (b) vortex strength Γ. The experimental conditionsfor each symbol are identical to those in Figure 4. The dashed line and filled symbols correspond to the channel gap of 160 μm, and the dashed-dotted line and empty symbols correspond to the gap of 240 μm. In panel a, the fitting lines correspond to ωmax ≈ Δσ1/2.
Langmuir Article
DOI: 10.1021/acs.langmuir.5b01897Langmuir 2015, 31, 8726−8731
8729
effects by considering the ratio of the viscous time scale takento be τv = μh/σ1 to the inertial time scale τ: τv/τ. It correspondsto the Ohnesorge number, Oh = μ/(ρ1hσ1)
1/2, which rangesfrom 8 × 10⁻³ to 2 × 10⁻². We note that Oh is analogous to theinverse of the Reynolds number if a characteristic velocity isdefined as U = h/τ ≈ (σ1/ρ1h)
1/2. The Reynolds number Re =ρ1ω R2/μ, defined based on the drop size and measuredvelocity of rotating flow, ranges from 60 to 200. Then, we get
ρ σ σρ
ρσ
Γ ≈ Δ Δ⎛⎝⎜⎜
⎞⎠⎟⎟
⎛⎝⎜⎜
⎞⎠⎟⎟h h
hR
h2
2
12
1/21
3
1
1/2
(3)
This finally yields
σρ σ
Γ ≈ Δ⎛⎝⎜⎜
⎞⎠⎟⎟h
R
2 3/2
2 11/2
1/2
(4)
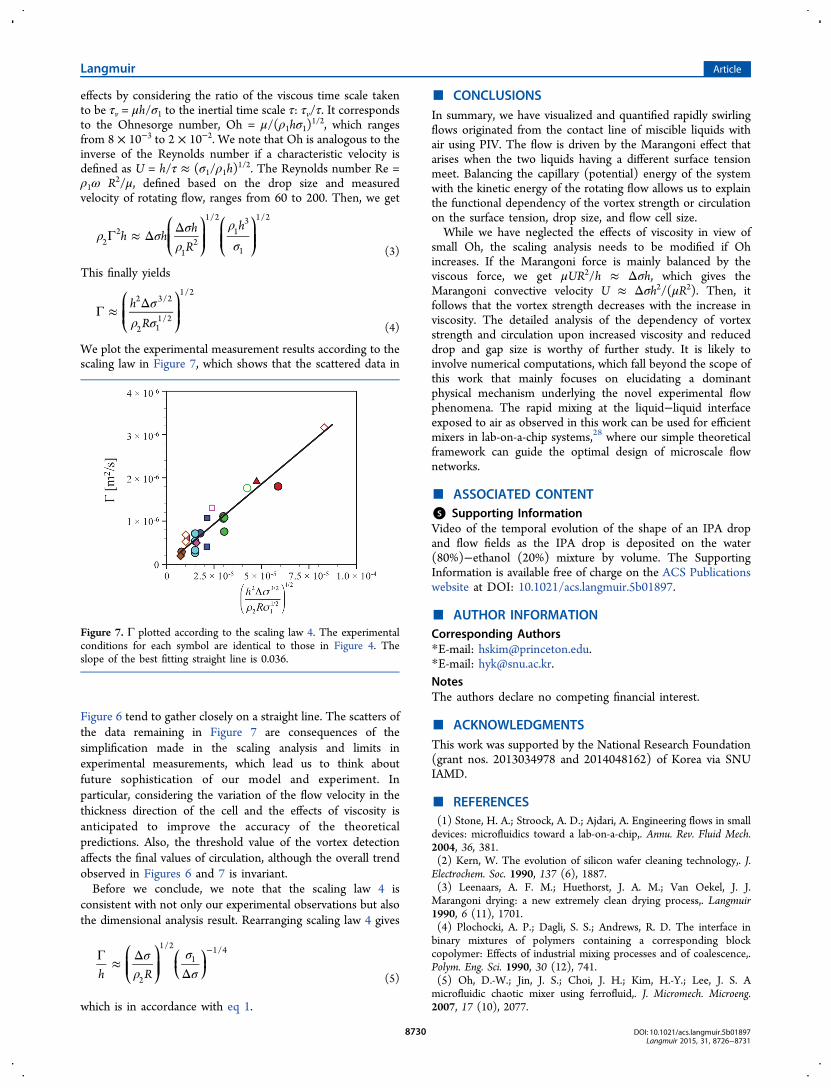
We plot the experimental measurement results according to thescaling law in Figure 7, which shows that the scattered data in
Figure 6 tend to gather closely on a straight line. The scatters ofthe data remaining in Figure 7 are consequences of thesimplification made in the scaling analysis and limits inexperimental measurements, which lead us to think aboutfuture sophistication of our model and experiment. Inparticular, considering the variation of the flow velocity in thethickness direction of the cell and the effects of viscosity isanticipated to improve the accuracy of the theoreticalpredictions. Also, the threshold value of the vortex detectionaffects the final values of circulation, although the overall trendobserved in Figures 6 and 7 is invariant.Before we conclude, we note that the scaling law 4 is
consistent with not only our experimental observations but alsothe dimensional analysis result. Rearranging scaling law 4 gives
σρ
σσ
Γ ≈ ΔΔ
−⎜ ⎟
⎛⎝⎜⎜
⎞⎠⎟⎟ ⎛
⎝⎞⎠h R2
1/21
1/4
(5)
which is in accordance with eq 1.
■ CONCLUSIONSIn summary, we have visualized and quantified rapidly swirlingflows originated from the contact line of miscible liquids withair using PIV. The flow is driven by the Marangoni effect thatarises when the two liquids having a different surface tensionmeet. Balancing the capillary (potential) energy of the systemwith the kinetic energy of the rotating flow allows us to explainthe functional dependency of the vortex strength or circulationon the surface tension, drop size, and flow cell size.While we have neglected the effects of viscosity in view of
small Oh, the scaling analysis needs to be modified if Ohincreases. If the Marangoni force is mainly balanced by theviscous force, we get μUR2/h ≈ Δσh, which gives theMarangoni convective velocity U ≈ Δσh2/(μR2). Then, itfollows that the vortex strength decreases with the increase inviscosity. The detailed analysis of the dependency of vortexstrength and circulation upon increased viscosity and reduceddrop and gap size is worthy of further study. It is likely toinvolve numerical computations, which fall beyond the scope ofthis work that mainly focuses on elucidating a dominantphysical mechanism underlying the novel experimental flowphenomena. The rapid mixing at the liquid−liquid interfaceexposed to air as observed in this work can be used for efficientmixers in lab-on-a-chip systems,28 where our simple theoreticalframework can guide the optimal design of microscale flownetworks.
■ ASSOCIATED CONTENT*S Supporting InformationVideo of the temporal evolution of the shape of an IPA dropand flow fields as the IPA drop is deposited on the water(80%)−ethanol (20%) mixture by volume. The SupportingInformation is available free of charge on the ACS Publicationswebsite at DOI: 10.1021/acs.langmuir.5b01897.
■ AUTHOR INFORMATIONCorresponding Authors*E-mail: [email protected].*E-mail: [email protected] authors declare no competing financial interest.
■ ACKNOWLEDGMENTSThis work was supported by the National Research Foundation(grant nos. 2013034978 and 2014048162) of Korea via SNUIAMD.
■ REFERENCES(1) Stone, H. A.; Stroock, A. D.; Ajdari, A. Engineering flows in smalldevices: microfluidics toward a lab-on-a-chip,. Annu. Rev. Fluid Mech.2004, 36, 381.(2) Kern, W. The evolution of silicon wafer cleaning technology,. J.Electrochem. Soc. 1990, 137 (6), 1887.(3) Leenaars, A. F. M.; Huethorst, J. A. M.; Van Oekel, J. J.Marangoni drying: a new extremely clean drying process,. Langmuir1990, 6 (11), 1701.(4) Plochocki, A. P.; Dagli, S. S.; Andrews, R. D. The interface inbinary mixtures of polymers containing a corresponding blockcopolymer: Effects of industrial mixing processes and of coalescence,.Polym. Eng. Sci. 1990, 30 (12), 741.(5) Oh, D.-W.; Jin, J. S.; Choi, J. H.; Kim, H.-Y.; Lee, J. S. Amicrofluidic chaotic mixer using ferrofluid,. J. Micromech. Microeng.2007, 17 (10), 2077.
Figure 7. Γ plotted according to the scaling law 4. The experimentalconditions for each symbol are identical to those in Figure 4. Theslope of the best fitting straight line is 0.036.
Langmuir Article
DOI: 10.1021/acs.langmuir.5b01897Langmuir 2015, 31, 8726−8731
8730
(6) Gaponenko, Y.; Shevtsova, V. Effects of vibrations on dynamicsof miscible liquids,. Acta Astronaut. 2010, 66 (1), 174.(7) Liu, R. H.; stremler, M. A.; Sharp, K. V.; Olsen, M. G.; Santiago, J.G.; Adrian, R. J.; Aref, H.; Beebe, D. J. Passive mixing in a three-dimensional serpentine microchannel,. J. Microelectromech. Syst. 2000,9 (2), 190.(8) Stroock, A. D.; Dertinger, S. K. W.; Ajdari, A.; Mezic, I.; Stone, H.A.; Whitesides, G. M. Chaotic mixer for microchannels,. Science 2002,295 (5555), 647.(9) Suciu, D. G.; Smigelschi, O.; Ruckenstein, E. Some experimentson the Marangoni effect,. AIChE J. 1967, 13 (6), 1120.(10) Suciu, D. G.; Smigelschi, O.; Ruckenstein, E. The spreading ofliquids on liquids,. J. Colloid Interface Sci. 1970, 33 (4), 520.(11) Lopez, J.; Miller, C. A.; Ruckenstein, E. Spreading kinetics ofliquid drops on solids,. J. Colloid Interface Sci. 1976, 56 (3), 460.(12) Bates, C. M.; Stevens, F.; Langford, S. C.; Dickinson, J. T.Motion and dissolution of drops of sparingly soluble alcohols onwater,. Langmuir 2008, 24 (14), 7193.(13) Svitova, T. F.; Hill, R. M.; Radke, C. J. Clayton J, “Spreading ofaqueous trisiloxane surfactant solutions over liquid hydrophobicsubstrates,. Langmuir 2001, 17 (2), 335.(14) Tan, E.; Thoroddsen, S. T. Marangoni instability of two liquidsmixing at a free surface,. Phys. Fluids 1998, 10 (12), 3038.(15) Santiago-Rosanne, M.; Vignes-Adler, M.; Velarde, M. G. On thespreading of partially miscible liquids,. J. Colloid Interface Sci. 2001, 234(2), 375.(16) Blanchette, F.; Messio, L.; Bush, J. W. M. The influence ofsurface tension gradients on drop coalescence,. Phys. Fluids 2009, 21(7), 072107.(17) Mohamed-Kassim, Z.; Longmire, E. K. Drop coalescencethrough a liquid/liquid interface,. Phys. Fluids 2004, 16 (7), 2170.(18) Chengara, A.; Nikolov, A. D.; Wasan, D. T. Spreading of a waterdrop triggered by the surface tension gradient created by the localizedaddition of a surfactant,. Ind. Eng. Chem. Res. 2007, 46 (10), 2987.(19) Tan, E.; Thoroddsen, S. T. Marangoni instability of two liquidsmixing at a free surface,. Phys. Fluids 1998, 10 (12), 3038.(20) Borcia, R.; Bestehorn, M. Partial coalescence of sessile dropswith different miscible liquids,. Langmuir 2013, 29 (14), 4426.(21) Karpitschka, S.; Hanske, C.; Fery, A.; Riegler, H. Coalescenceand noncoalescence of sessile drops: impact of surface forces,.Langmuir 2014, 30 (23), 6826.(22) Vazquez, G.; Alvarez, E.; Navaza, J. M. Surface tension ofalcohol water + water from 20 to 50°C,. J. Chem. Eng. Data 1995, 40,611.(23) Khattab, I. S.; Bandarkar, F.; Fakhree, M. A. A.; Jouyban, A.Density, viscosity and surface tension of water + ethanol mixtures from293 to 323>K,. Korean J. Chem. Eng. 2012, 29 (6), 812.(24) Adrian, R. J.; Westerweel, J. Particle Image Velocimetry;Cambridge University Press: Cambridge, U.K., 2011.(25) Kim, H.; Westerweel, J.; Elsinga, G. E. Comparison of Tomo-PIV and 3D-PIV for microfluidic flows,. Meas. Sci. Technol. 2013, 24(2), 024007.(26) Poelma, C.; Dickson, W.; Dickinson, M. Time-resolvedreconstruction of the full velocity field around a dynamically scaled-flapping wing,. Exp. Fluids 2006, 41 (2), 213.(27) Buckingham, E. On physically similar systems; illustrations ofthe use of dimensional equations,. Phys. Rev. 1914, 4 (4), 345.(28) Gunther, A.; Jhunjhunwala, M.; Thalmann, M.; Schmidt, M. A.;Jensen, K. F. Micromixing of miscible liquids in segmented gas-liquidflow,. Langmuir 2005, 21 (4), 1547.
Langmuir Article
DOI: 10.1021/acs.langmuir.5b01897Langmuir 2015, 31, 8726−8731
8731