spend analysis strategies performing thsp e nd analysiscbafaculty.org/dau/spend analysis...
TRANSCRIPT
CLCllO Spend Analysis Strategies lesson 3- Performing the Spend Analysis TOC I RESOURCES I PRINT I HELP
Performing the Spend Analysis
The Performing the Spend Analysis lesson addresses the steps involved developing a Spend Profile, interpreting and analyzing data and determining implications and opportunities for sourcing improvements.
After completing this lesson you should be able to:
• Identify the key s teps and considerations involved with developing a Spend Profile .
• Iden ti fy common spend da ta views and the sourcing insigh ts they can provide.
• Identify key considerations involved with translating the Spend Analysis into actionable opportunities.
~ I Poge tof:H I ..... Back Next
CLCllO Spend Analysis Strategies lesson 3- Performing the Spend Analysis TOC I RESOURCES I PRINT 1HELP
Developing the Spend Pr ofile
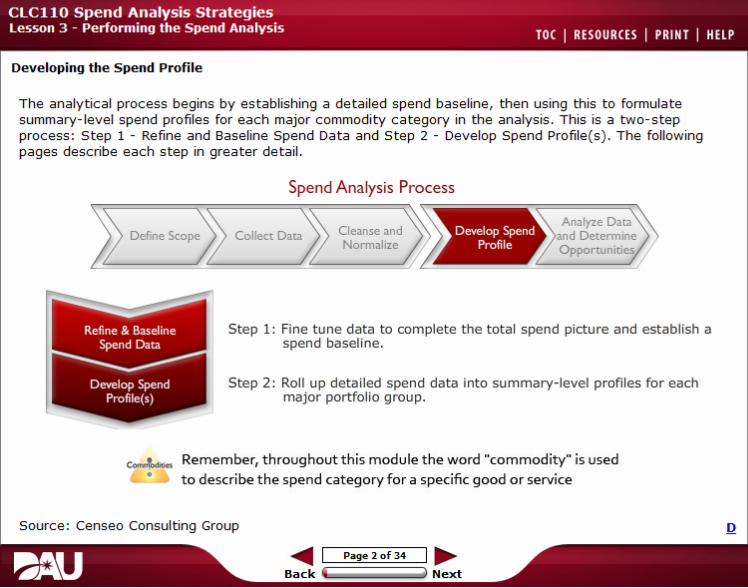
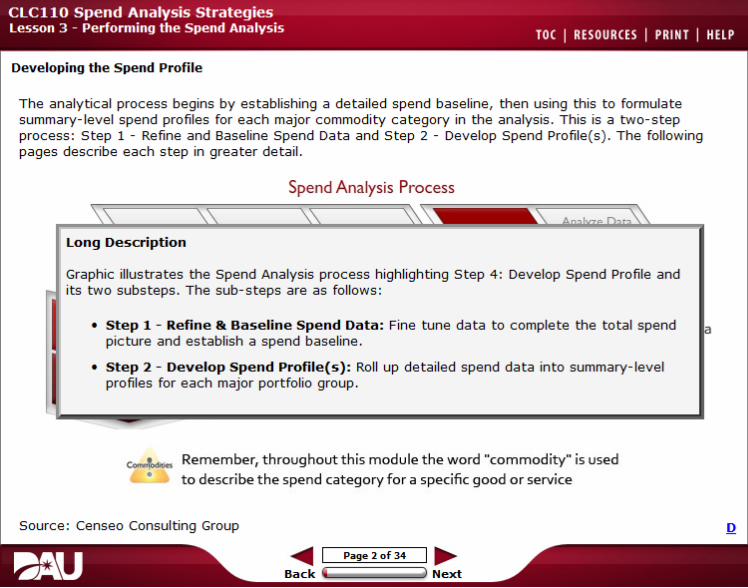
The analy tical process begins by establishing a detailed spend baseline, then using this to formulate summary-level spend profiles for each major commodity category in the analysis . This is a t wo-step process : Step 1 - Refine and Baseline Spend Data and Step 2 - Develop Spend Profile( s) . The following pages describe each step in greater detail.
Spend Analysis Process '\"iiiiiiiiiiiiiii~==~
Analyze Data Cleanse and Deve lop Spe nd Define Scope Collect Data and Determine Normalize Profile Opporwnities
Step 1 : Fine t une data to complete t he total spend picture and establish a spend baseline.
Step 2 : Roll up detailed spend data into summary- level profiles for each major portfolio group.
~ Rem emb er, th roug hout t his m od ule t he word "commodity" is used • t o d escribe t he spen d category for a specific good or service
Source : Censeo Consulting Group
~ I Pa ge2of34 I ..... Back Next
CLCllO Spend Analysis Strategies lesson 3- Performing the Spend Analysis TOC I RESOURCES I PRINT 1HELP
Developing the Spend Profile
The analy tical process begins by establishing a detailed spend baseline, then using this to formulate summary-level spend profiles for each major commodity category in the analysis . This is a two-step process: Step 1 - Refine and Baseline Spend Data and Step 2 - Develop Spend Profile( s) . The following pages describe each step in greater detail.
Spend Analysis Process
l ong Description
Graphic illustrates the Spend Analysis process highlighting Step 4: Develop Spend Profile and its two substeps . The sub-steps are as follows:
• step 1 - Refine & Baseline Spend Data: Fine tune data to complete the total spend picture and establish a spend baseline .
• step 2- Develop Spend Profile(s): Roll up detailed spend data into summary-level profiles for each major portfolio group .
~ Rem emb er, th roughout t his m odule t he w o rd "commodity" is used • t o d escribe t he spen d category for a specific good or service
Source: Censeo Consulting Group
~ I Page2of34 I ..... Back Next

CLCllO Spend Analysis Strategies lesson 3- Performing the Spend Analysis TOC I RESOURCES I PRINT I HELP
Step 1: Refining & Bllselining Spend Data
At this point, all of the spend data that h as been collected is compiled into a single dataset and organized into portfolio groups.
After this is completed, a high- level data scan is done to understand how spend is being allocated across:
• Main portfolio groups
• Customers
• Suppliers
• Contract vehicles and other purchasing methods
~ I Pogel of :H 1 .....
Back i 1 Next
CLCllO Spend Analysis Strategies lesson 3- Performing the Spend Analysis TOC I RESOURCES I PRINT I HELP
Step 1: Refining & Bllselining Spend Data, Cont.
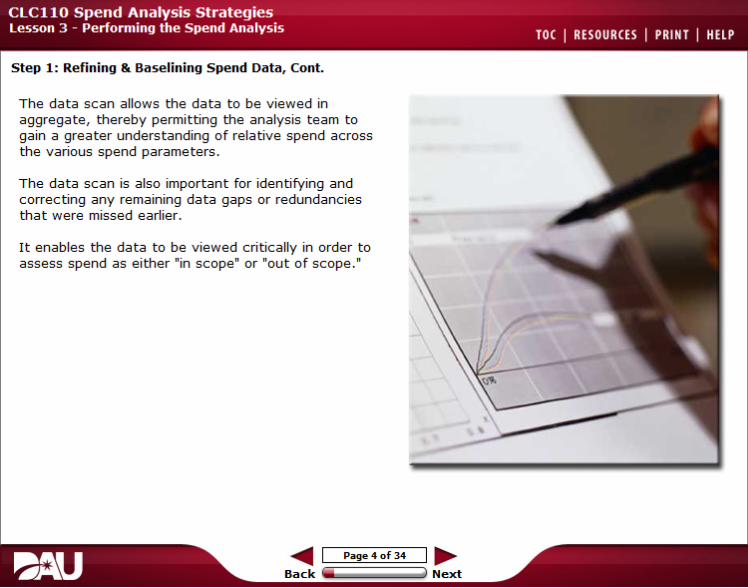
Th e d ata scan allows the data to be viewed in aggregate, thereby permitting the a nalysis team to g ain a greater understanding of rela tive spend across the various spend parameters.
The da ta scan is also important for identifying and correcting any remaining data gaps or redundancies that were missed earlier .
It enables the da ta to be viewed cri t ically in order to assess spend as either "in scope'' or ''out of scope ."
...._ I Pil ge 4 of J.4 1 .....
Back W 1 Next
CLCllO Spend Analysis Strategies lesson 3- Performing the Spend Analysis TOC I RESOURCES I PRINT I HELP
Step 1: Refining & Bllselining Spend Data, Cont.
When addressing critical d ata g ap s, ther e are several options:
• Return to existing data sources to try to find missing data that may have been ov erlooked or inadvertently deleted.
• Seek out additional da ta sources tha t may aid in filling data gaps.
• Use data extrapola tion and o ther statistical techniques to es timate missing da ta .
~ I Poge Sof:H 1 .....
Back W 1 Next
CLCllO Spend Analysis Strategies lesson 3- Performing the Spend Analysis TOC I RESOURCES I PRINT I HELP
Step 1: Refining & Bllselining Spend Data, Cont.
Every time new data is added to the dataset, the data must be cleansed and normalized. This process can take several iterations before a high confidence level in the quality of data is achieved.
At some point, however, a decision must be made as to when the data is sufficient in order to proceed with the analysis. There will never be a complete 100 percen t accurate pic ture available . Therefore, the value of addi tional data versus the time required to obtain it must be continually gauged.
This particular process can also be done during the 'Cleanse and Normalize Data" step.
~ I Poge Gof:H 1 .....
Back 8 1 Next
CLCllO Spend Analysis Strategies lesson 3- Performing the Spend Analysis TOC I RESOURCES I PRINT I HELP
Step 1: Refining & Bllselining Spend Data, Cont.
In the USMC case example during the baselining process, i t was found that:
• A significant portion of spend da ta was missing for hardware purchases made through the Army.
• USMC made hardware purchases on behalf o f other agencies.
• Two large con trac ts were determined to be "non · addressable, " or no t available for sourcing modifica tions.
• T elecom· rela ted spend had a different supply base and market and was removed from the spend.
! I
~ I Poge7of:H I ..... Back Next
CLCllO Spend Analysis Strategies lesson 3- Performing the Spend Analysis
Step 1: Refining & Bllselining Spend Data, Cont.
At this point, it may also be necess ary to eliminate data that is redundant or is determined to be "out o f scope.•
The USMC Commodity Team, for example :
• Eliminated da ta tha t was considered nonUSMC spend - such as hardware purchased by USMC on behalf o f other agencies.
• Removed two large c ontrac ts that were de termined t o be "non-addressable, " or not available for sourcing modifications ( one was for a large enterprise- wide program and t he other was a new contract and considered highly mission critical).
• Determined telecom-related spen d h ad a different supply base a nd market, a nd therefore should not be c onsidered pa rt of IT spend.
TOC I RESOURCES I PRINT I HELP
~ I Poge 8of:H I ..... Back Next
CLCllO Spend Analysis Strategies lesson 3- Performing the Spend Analysis TOC I RESOURCES I PRINT I HELP
Step 1: Refining & Bllselining Spend Data, Cont.
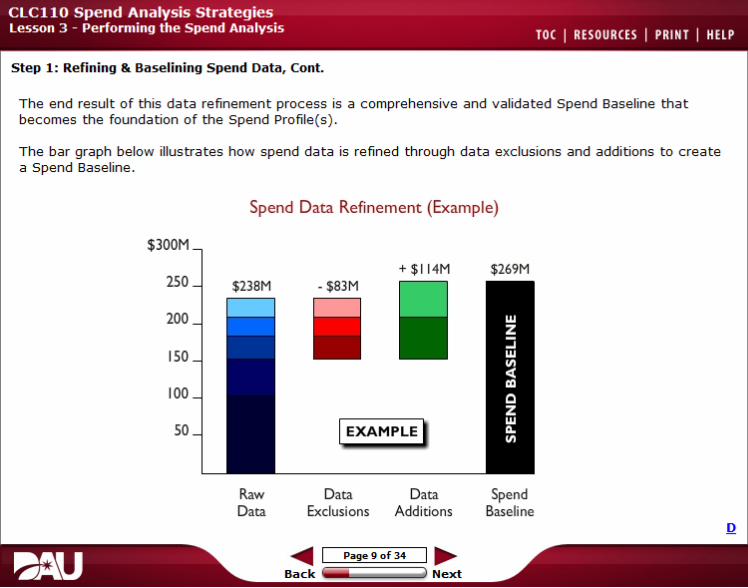
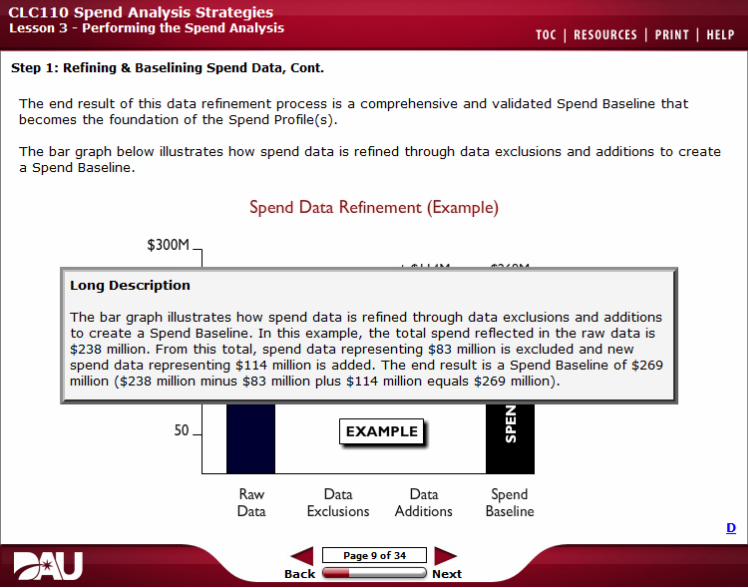
The end result of this data refinement process is a comprehensive and validated Spend Baseline that becomes the foundation of the Spend Profile(s).
The bar graph below illustrates how spend data is refined through data exclusions and additions to create a Spend Baseline.
Spend Data Refinement (Example)
$300M
$269M 250
200
ISO
100
50 IEXAMPLE I
Raw Data Data Spend Data Exclusions Additions Baseline
~ I Poge Q of:H I ..... Back Next
CLCllO Spend Analysis Strategies lesson 3- Performing the Spend Analysis TOC I RESOURCES I PRINT 1HELP
Step 1 : Refining & Baselining Spend Data, Cont.
The end result of this data refinement process is a comprehensive and validated Spend Baseline that becomes the foundation of the Spend Profile( s) .
The bar graph below illustrates how spend data is refined through data exclusions and additions to create a Spend Baseline .
Spend Data Refinement (Example)
$300M
l o ng Descrip tio n
The bar graph illustrates how spend data is refined through data exclusions and additions to create a Spend Baseline . I n this example, the total spend reflected in the raw data is $238 million . From this total, spend data representing $83 million is excluded and new spend data representing $114 million is added . The end result is a Spend Baseline of $269 million ( $238 million minus $83 million plus $114 million equals $269 million ) .
50 IEXAMPLE ~
Raw Data Data Spend Data Exclusions Additions Baseline
~ I Page9of 34 I ..... Back Next

CLCllO Spend Analysis Strategies lesson 3- Performing the Spend Analysis TOC I RESOURCES I PRINT I HELP
Step 2: Developing the Spend Profile(s)
From the Spend Baseline, portfolio g roups or portfolio categories are identified and the data is rolled up into a high- level summary, or Spend Profile.
The purpose of the Spend Profile is to:
• Isolate key targe t portfolio categories within the larger portfolio spend.
• Provide a clear, summary-level snapshot of spend for each category that can be easily analyzed and compared.
• Reveal obvious trends and patterns in the data that can guide more detailed analysis.
• Provide the foundation for asking more probing questions about how and why sp end is allocated.
~ I Poge 10 of J.4 I ...... Back Next
CLCllO Spend Analysis Strategies lesson 3- Performing the Spend Analysis TOC I RESOURCES I PRINT I HELP
Step 2: Developing t he Spend
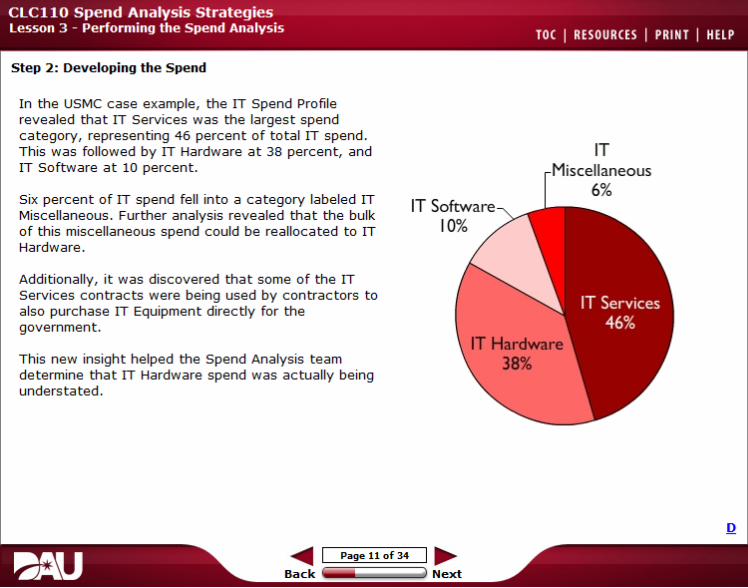
In the USMC case example, the IT Sp end Profile revealed that IT Services was the largest spend category, representing 46 percent of total IT spend. This was followed by IT Hardware at 38 percent, and IT Software at 10 percent.
Six percent of IT spend fell into a ca tegory labeled IT Miscellaneous. Further analysis revealed that the bulk o f this miscellaneous spend could be reallocated to IT Hardware.
IT Software 10%
IT iscellaneous
6%
Additionally, i t was discovered that some of the IT Services con tracts were being used by contrac tors to also purchase IT Equipment directly for the government.
This new insight helped the Spend Analysis team determine that IT Hardware spend was actually being understated.
~ I Poge 11 of J.4 I ...... Back Next

CLCllO Spend Analysis Strategies lesson 3- Performing the Spend Analysis TOC I RESOURCES I PRINT I HELP
Step 2: Developing t he Spend
In the USMC case example, the IT Sp end Profile revealed that IT Services was the largest spend category, representing 46 percent of total IT spend. This was followed by IT Hardware at 38 percent, and IT IT Software at 10 percent.
Six percent of IT spend fr-------------------..L..--,P"' Miscellaneous. Further l ong De scription of this miscellaneous Hardware. A pie chart showing the breakdown o f the u .s . Marine
Corps' IT Spend in to four maj or sub-categories : IT Additionally, it was rlio,rnJ Services ( 46%); IT Hardware (38%); IT Software ( 10%); Services con tracts were IT Miscellaneous ( 6%).
also purchase IT t:qUip•mE!L.---------------.----- govemment.
This new insight helped the Spend Analysis team determine that IT Hardware spend was actually being understated.
~ I Poge 11 of J.4 I ...... Back Next
CLCllO Spend Analysis Strategies lesson 3- Performing the Spend Analysis
Step 2: Developing the Spend Profile(s), Cont.
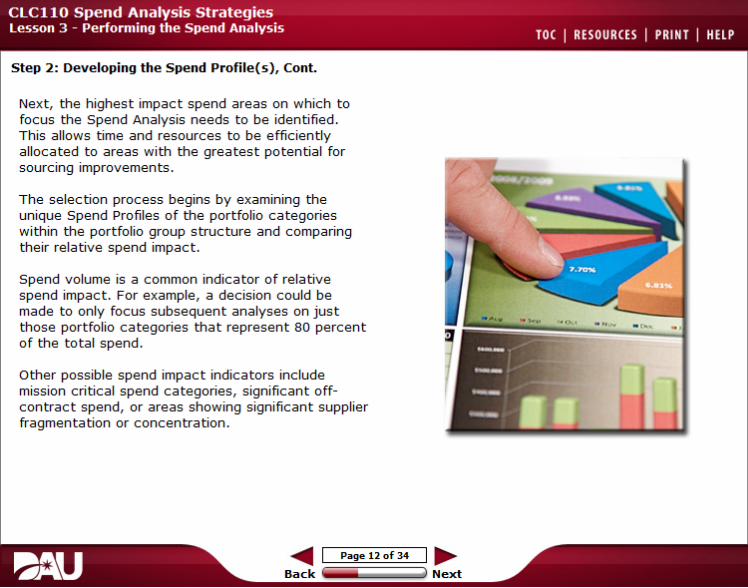
Next, the highest impact spend areas on which to focus the Spend Analysis needs to b e identified. This allows time and resources to be e fficiently allocated to areas with the greatest poten tial for sourcing improvements.
The selection process begins by examining the unique Spend Profiles o f the portfolio categories within the port folio group structure and comparing their rela tive spend impac t .
Spend volume is a common indicator of relative spend impact. For example, a decision could be made t o only focus subsequent analyses on just those port folio categories that represent 80 percent of the total spend.
Other possible spend impact indicators include mission critical spend categories, significant offcontract spend, or areas showing significant supplier fragmentation or concentration.
TOC I RESOURCES I PRINT I HELP
~ I Poge 1lof J.4 I ..... Back Next
CLCllO Spend Analysis Strategies lesson 3- Performing the Spend Analysis TOC I RESOURCE S I PRINT 1HELP
Step 2 : Developing the Spend Profile(s), Cont.
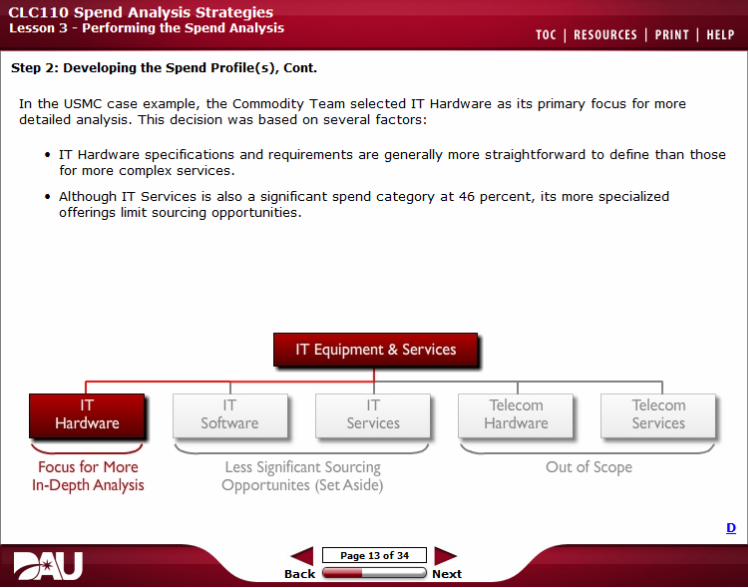
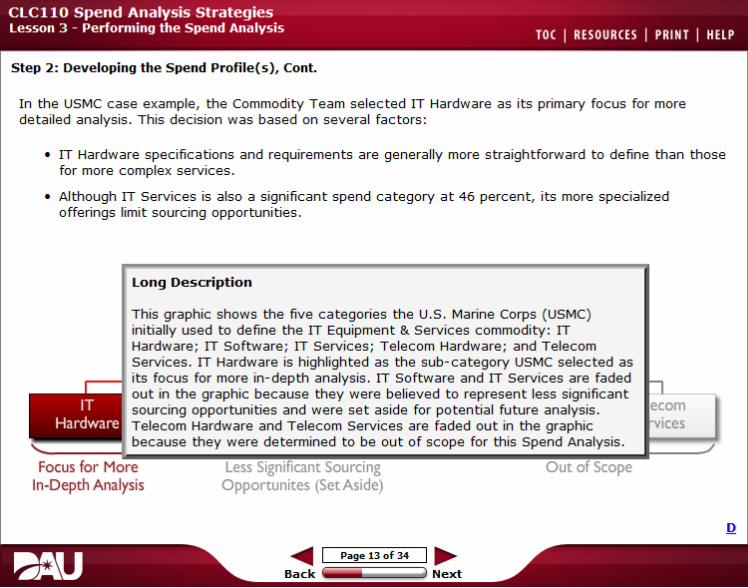
In the USMC case example, the Commodity Team selected IT Hardware as its primary focus for more detailed analysis . This decision was based on several factors :
• IT Hardware specifications and requirements are generally more straightforward to define than those for more complex services .
• Although IT Services is also a significant spend category at 46 percent, its more specialized offerings limit sourcing opportunities.
IT Equipment & Services
,.--, ~ - _ Ir- 1,:- - ~ IT Telecom Telecom Hardware Software Services Hardware Services
' / /' Focus for More Less Significant Sourcing Out of Scope In-Depth Analysis Opportunites (Set Aside)
~ I Page 1 3of 34 I ..... Back Next
CLCllO Spend Analysis Strategies lesson 3- Performing the Spend Analysis TOC I RESOURCES I PRINT 1HELP
Step 2: Developing the Spend Pr ofile(s), Cont.
In the USMC case example, the Commodity Team selected IT Hardware as its primary focus for more detailed analysis . This decision was based on several factors :
• IT Hardware specifications and requirements are generally more straightforward to define than those for more complex services .
• Although IT Services is also a significant spend category at 46 percent, its more specialized offerings limit sourcing opportunities.
l ong Descrip tion
This graphic shows the five categories the U.S. Marine Corps ( USMC) initially used to define the IT Equipment & Services commodity: IT Hardware ; IT Software ; IT Services ; Telecom Hardware ; and Telecom Services . IT Hardware is highlighted as the sub-category USMC selected as its focus for more in-depth analysis . IT Software and IT Services are faded out in the graphic because they were believed to represent less significant
IT ecom - sourcing opportunities and were set aside for potential future analysis . Hardware Telecom Hardware and Telecom Services are faded out in the graphic vices
because they were determined to be out of scope for this Spend Analysis . ./
Focus for More Less Significant Sourcing Out of Scope In-Depth Analysis Opportunites (Set Aside)
~ I Page 13of34 I ..... Back Next

CLCllO Spend Analysis Strategies lesson 3 - Performing the Spend Analysis TOC 1 RESOURCES 1 PRINT 1 HELP
Knowledge Review
Which of the following are reasons for conducting a high-level data scan of the compiled spend data?
( Select all that apply )
( ~ To address any r emaining data gaps and redundancies
To evaluate the quality of data by data source
l ~i To understand total spend across key spend parameters
IJ I To assess which spend is 'in scope' or 'out of scope'
Check Answer
That is correct.
The reasons for conducting a high- level data scan of the compiled spend data are: to address any remaining data gaps and redundancies; to understand total spend across key spend parameters; and to assess which spend is in scope or out of scope.
~ Page 14 of 3 4 I ~ Back Next
CLCllO Spend Analysis Strategies lesson 3 - Performing the Spend Analysis TOC 1 RESOURCES 1 PRINT 1 HELP
Knowledge Review
Once the Spend Profi le has been developed, the data C<in be rolled up into a high-level Spend Baseline.
True
~ False
Check Answer
That is correct.
This is a false statement. We must develop and val idate a comprehensive Spend Baseline before we can roll the data up into a high-level Spend Profi le. The purpose of doing the Spend Baseline is to ensure all of the spend data used by our ana lysis is complete and accurate.
~ Page 15 of 3 4 I ~ Back Next

CLCllO Spend Analysis Strategies lesson 3- Performing the Spend Analysis TOC I RESOURCES I PRINT I HELP
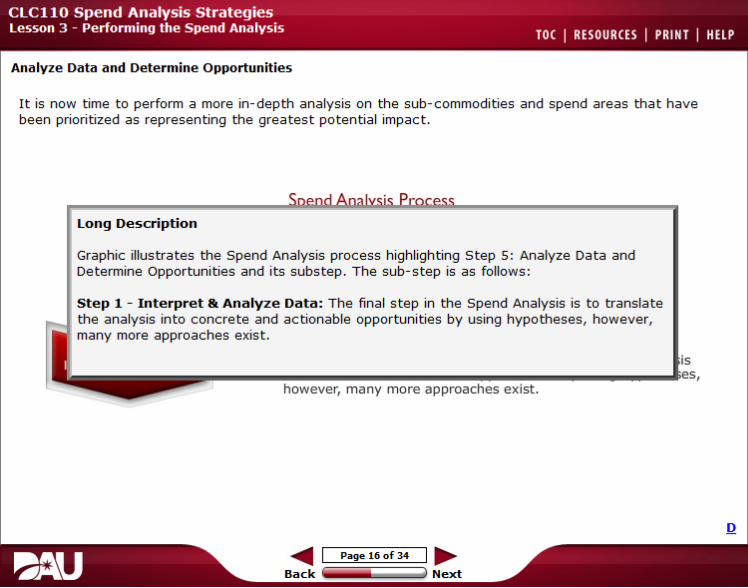
Analyze Data and Determine Opportunities
It is now time to perform a more in-depth analysis on the sub-commodities and spend areas that have been prioritized as representing the greatest potential impact.
Clconsc and DevelopDcfme Scope Collect Data Nom'lillizc Profile
Step 1: The final step in the Spend Analysis is to translate the analysisln<erpret & Analyze O.a into concrete and actionable opportunities by using hypotheses, however, many more approaches exist.
~ I Poge16ofJ.4 I ...... Back Next
CLCllO Spend Analysis Strategies lesson 3- Performing the Spend Analysis TOC I RESOURCES I PRINT 1HELP
Analyze Data and Determine Opportunities
It is now time to perform a more in-depth analysis on the sub-commodities and spend areas that have been prioritized as representing the greatest potential impact.
l ong De script ion
Graphic illustrates the Spend Analysis process highlighting Step 5: Analyze Data and Determine Opportunities and its substep. The sub- step is as follows:
step 1 - I n t erpret & Analyze Da t a: The final step in the Spend Analysis is to translate the analysis into concrete and actionable opportunities by using hypotheses, however, many more approaches exist.
however, many more approaches exist.
~ I Page16of 34 I ..... Bac k Next
CLCllO Spend Analysis Strategies lesson 3- Performing the Spend Analysis
Focusing the Spend Analysis
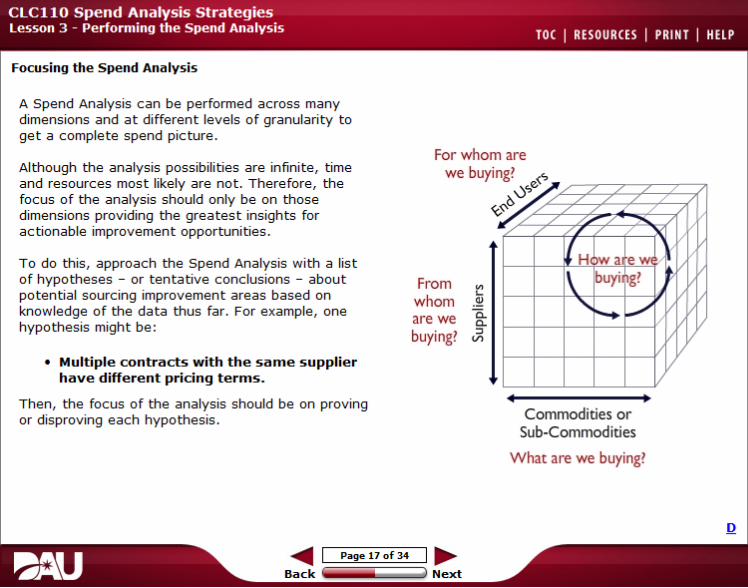
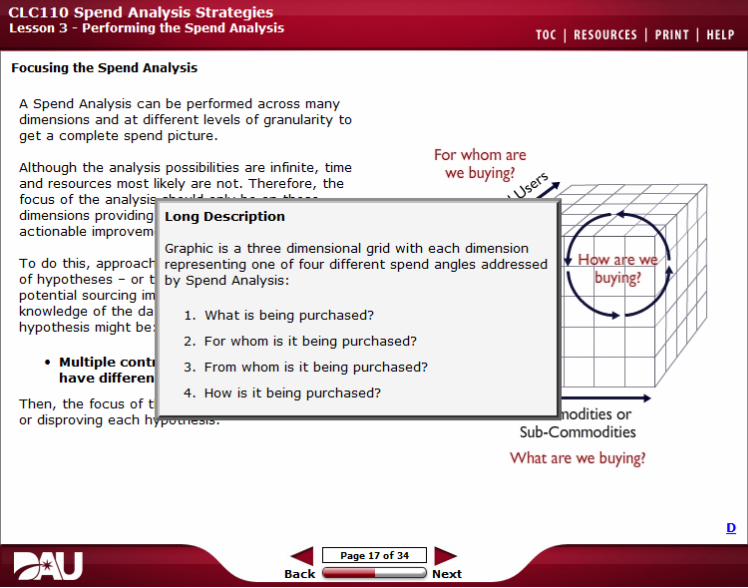
A Spend Analysis can be performed across many dimensions and at different levels of granularity to get a complete spend picture.
Although the analysis possibilities are infinite, time and resources most likely are not. Therefore, the focus of the analysis should only be on those dimensions providing the greatest insigh ts for actionable improvement opportunities.
To do this, approach the Spend Analysis with a list of hypotheses - or tentative conclusions - about potential sourcing improvement areas based on knowledge of the data thus far. For example, one hypothesis might be:
• Multiple contracts with t he same supplier have differ ent pricing t erms.
Then, the focus of the analysis should be on proving or disproving each hypothesis.
TOC I RESOURCES I PRINT I HELP
For whom are
we buying? <"
~~ '/ 7
H wa te w buyi g?From ..."' I\
whom .!!! ..... 0.. ~t are we o.
buying? ~ v
! Commodities or
Sub-Commodities
Wha[ are we buying?
~ I Poge 17 of J.4 I ...... Back Next
CLCllO Spend Analysis Strategies lesson 3- Performing the Spend Analysis TOC I RESOURCES I PRINT I HELP
Focusing the Spend Analysis
A Spend Analysis can be performed across many dimensions and at different levels of granularity to get a complete spend picture.
For whom are Although the analysis possibilities are infinite, time
we buying? <"and resources most likely are not. Therefore, the
~ • ..J'>(!;;?.focus of the analys i,..-............
dimensions providing l ong Descriptio n actionable improvem ~
Graphic is a three dimensional grid with each dimension II/ w~ ·ew,T o do this, approac :t representing one of four different spend angles addressed ~H
of hypotheses - or by Spend Analysis : buyi g? potential sourcing irr .....knowledge of the da 1. What is being purchased? r- .,./ hypothesis might be
2. For whom is it being purchased?
• Multiple con t 3. From whom is it being purchased?have d iffer e n v
4. How is it being purchased?Then, the focus of t
odities oror disproving each h ..Sub-CommodttJes
Wha[ are we buying?
~ I Poge 17 of J.4 I ...... Back Next
CLCllO Spend Analysis Strategies lesson 3- Performing the Spend Analysis
Sample Data Spend Views
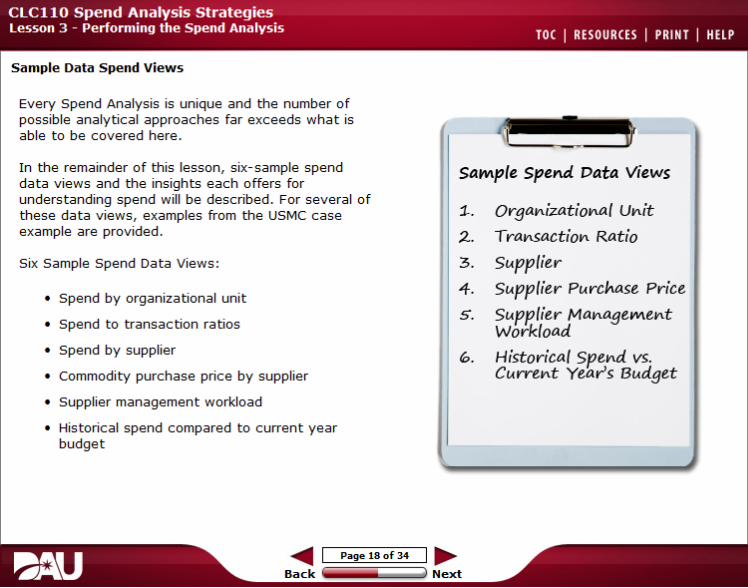
Every Spend Analysis is unique and the number of possible analytical approaches far exceeds what is able to be covered here.
In the remainder of this lesson, six-sample spend da ta views and the insights each offers for understanding spend will be described. For several of these data views, examples from the USMC case example are provided .
Six Sample Spend Data Views:
• Spend by organizational unit
• Spend to transaction ratios
• Spend by supplier
• Commodity purchase price by supplier
• Supplier management workload
• Historical spend compared to current year budget
TOC I RESOURCES I PRINT I HELP
Sai'VI.ple Spend Data Views
:l.. Orga....i:zatio....al U10.it
2. Trai'\Sactio"' Ratio
3. Supplier
4. Supplier Purc~ase Price
s. Supplier tvta....ageWiel'\t Workload
"· Historical Spend vs. Curre10.t Year's Budget
~ I Poge18ofJ.4 I ...... Back Next
CLCllO Spend Analysis Strategies lesson 3- Performing the Spend Analysis TOC I RESOURCES I PRINT 1HELP
Sample Spend View # 1 : Commodity Spend by Organizational Unit
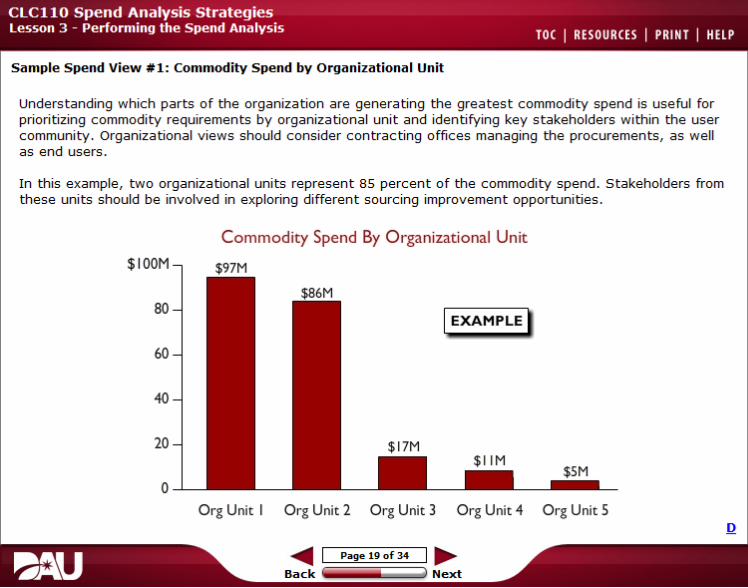
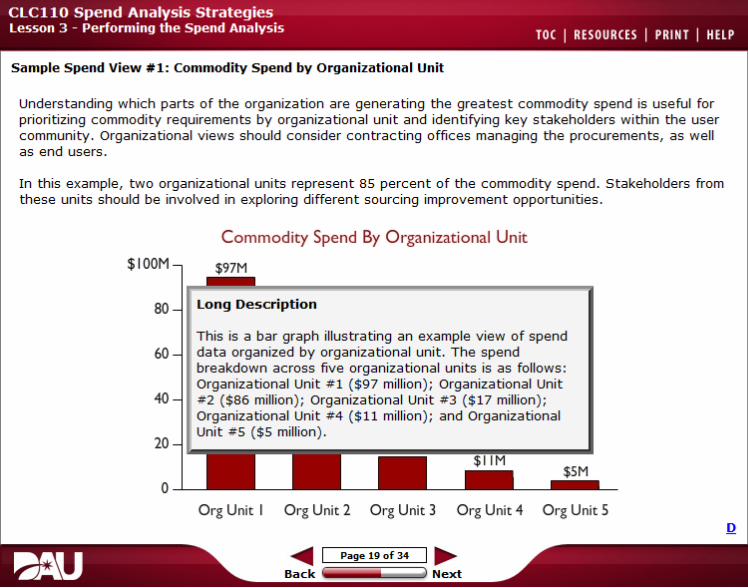
Understanding which parts of the organization are generating the greatest commodity spend is useful for prioritizing commodity requirements by organizational unit and identifying key stakeholders within the user community. Organizational views should consider contracting offices managing the procurements, as well as end users .
In this example, t wo organizational units represent 85 percent of the commodity spend . Stakeholders from these units should be involved in exploring different sourcing improvement opportunities.
Commodity Spend By Organizational Unit
$ 100M
80 IEXAMPLE l 60
40
20
0 O rg Unit I O rg Unit 2 O rg Unit 3 O rg Unit 4 O rg Unit 5
~ I Page19of 34 I ..... Back Next
CLCllO Spend Analysis Strategies lesson 3- Performing the Spend Analysis TOC I RESOURCES I PRINT 1HELP
Sample Spend View # 1 : Commodity Spend by Organizational Unit
Understanding which parts of the organization are generating the greatest commodity spend is useful for prioritizing commodity requirements by organizational unit and identi fying key stakeholders within the user community. Organizational views should consider contracting offices managing the procurements, as well as end users .
In this example, t wo organizational units represent 85 percent of the commodity spend . Stakeholders from these units should be involved in exploring different sourcing improvement opportunities .
Commodity Spend By Organizational Unit
$ 100M
l ong Descript ion80
This is a bar graph illustrating an example view of spend 60 data organized by organizational unit. The spend
breakdown across five organizational units is as follows: Organizational Unit # 1 ( $97 million); Organizational Unit
40 #2 ( $86 million ); Organizational Unit #3 ( $17 million); Organizational Unit # 4 ( $11 million ); and Organizational Unit # 5 ( $5 million ) .
20
0 Org Unit I Org Unit 2 Org Unit 3 Org Unit 4 Org Unit 5
~ I Pa ge19of 34 I ..... Back Next
CLCllO Spend Analysis Strategies lesson 3- Performing the Spend Analysis TOC I RESOURCES I PRINT 1HELP
Sample Spend View # 1 : Commodity Spend by Organizational Unit, Cont.
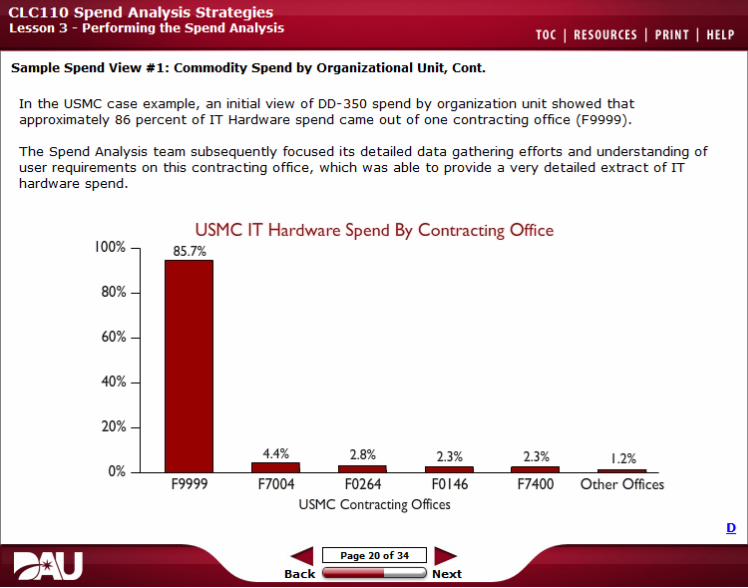
In the USMC case example, an initial view of DD-350 spend by organization unit showed that approximately 86 percent of IT Hardware spend came out of one contracting office ( F9999 ) .
The Spend Analysis team subsequently focused its detailed data gathering efforts and understanding of user requirements on this contracting office, which was able to provide a very detailed extract of IT hardware spend .
USMC IT Hardware Spend By Contracting Office 100% 85.7%
80%
60%
40%
20%
4.4% 2.8% 2.3%2.3% 1.2% 0%
F9999 F7004 F0264 FOI46 F7400 Other O ffices
USMC Contracting Offices
~ I Page20of 34 I ..... Back Next
CLCllO Spend Analysis Strategies lesson 3- Performing the Spend Analysis TOC I RESOURCES I PRINT 1HELP
Sample Spend View # 1 : Commodity Spend by Organizational Unit, Cont.
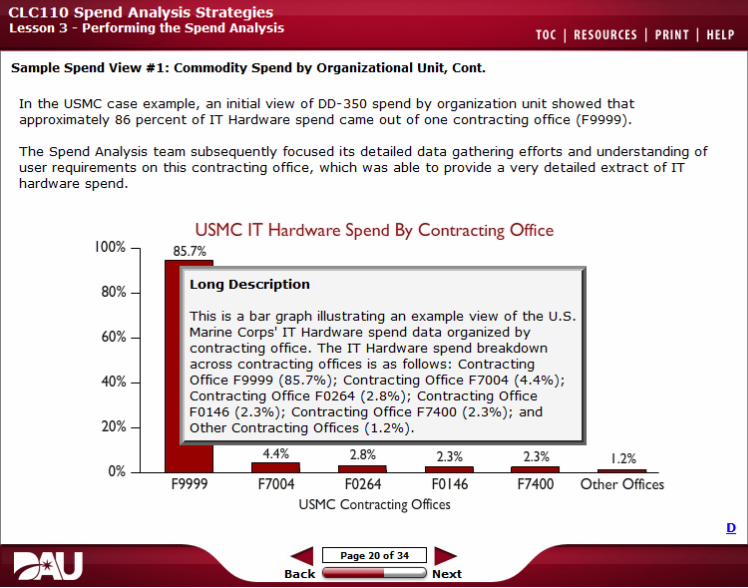
In the USMC case example, an initial view of DD-350 spend by organization unit showed that approximately 86 percent of IT Hardware spend came out of one contracting office ( F9999 ) .
The Spend Analysis team subsequently focused its detailed data gathering efforts and understanding of user requirements on this contracting office, which was able to provide a very detailed extract of IT hardware spend .
USMC IT Hardware Spend By Contracting Office 100% 85.7%
l ong Descript ion80%
This is a bar graph illustrating an example view of the U.S. Marine Corps' IT Hardware spend data organized by 60% contracting office. The IT Hardware spend breakdown across contracting offices is as follows: Contracting
40% Office F9999 ( 85 .7% ); Contracting Office F7004 ( 4.4% ); Contracting Office F0264 ( 2 .8% ); Contracting Office F0146 ( 2.3%); Contracting Office F7400 ( 2.3%); and
20% Other Contracting Offices ( 1.2% ) .
2.8% 2.3% 2.3% 1.2% 0%
F9999 F7004 F0264 FOI46 F7400 O ther Offices
USMC Contracting Offices
~ I Pa ge20of 34 I ..... Back Next
CLCllO Spend Analysis Strategies lesson 3- Performing the Spend Analysis TOC I RESOURCES I PRINT 1HELP
Sample Spend View #2: Spend to Transaction Ratios
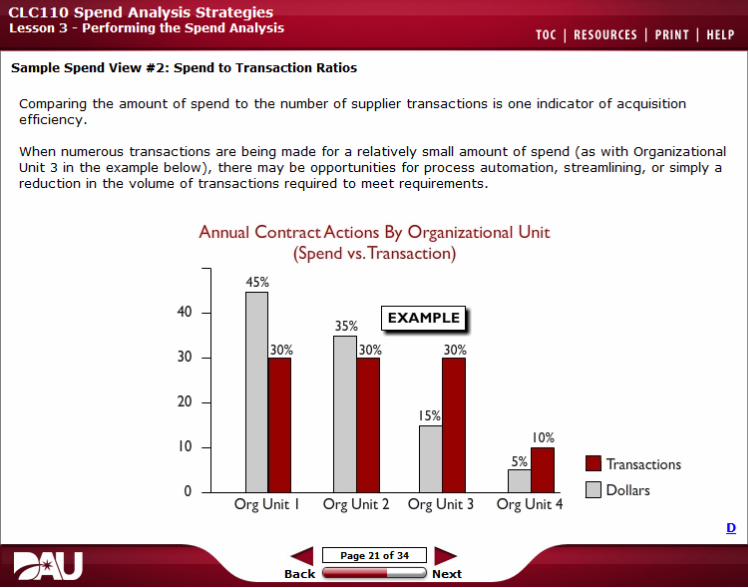
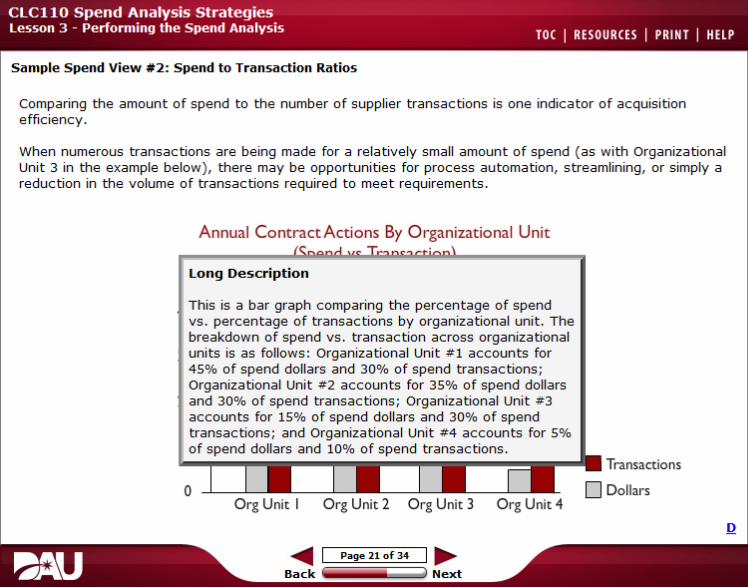
Comparing the amount of spend to the number of supplier transactions is one indicator of acquisition efficiency .
When numerous transactions are being made for a relatively small amount of spend ( as with Organizational Unit 3 in the example below ), there may be opportunities for process automation, streamlining, or simply a reduction in the volume of transactions required to meet requirements .
Annual ContractActions By Organizational Unit (Spend vs. Transaction)
45%
40
30
20
10 • Transactio ns
0 0 D ollars O rg Unit I O rg Unit 2 O rg Unit 3 O rg Unit 4
...._ Page 21 of 34 I ~ Back Next
CLCllO Spend Analysis Strategies lesson 3- Performing the Spend Analysis TOC I RESOURCES I PRINT 1HELP
Sample Spend View #2: Spend to Transaction Ratios
Comparing the amount of spend to the number of supplier transactions is one indicator of acquisition efficiency.
When numerous transactions are being made for a relatively small amount of spend ( as with Organizational Unit 3 in the example below ), there may be opportunities for process automation, streamlining, or simply a reduction in the volume of transactions required to meet requirements .
Annual ContractActions By Organizational Unit
l o ng Descriptio n
This is a bar graph comparing the percentage of spend vs. percentage of transactions by organizational unit. The breakdown of spend vs. transaction across organizational units is as follows: Organizational Unit #1 accounts for 45% of spend dollars and 30% of spend transactions ; Organizational Unit #2 accounts for 35% of spend dollars and 30% of spend transactions ; Organizational Unit #3 accounts for 15% of spend dollars and 30% of spend transactions ; and Organizational Unit #4 accounts for 5% of spend dollars and 10% of spend transactions .
Transactio ns
0 Org Unit I Org Unit 2 Org Unit 3 Org Unit 4
~ I Page21of 34 I ..... Back Next

CLCllO Spend Analysis Strategies lesson 3- Performing the Spend Analysis TOC I RESOURCES I PRINT I HELP
Sample Spend View # 3: Spend by Supplier
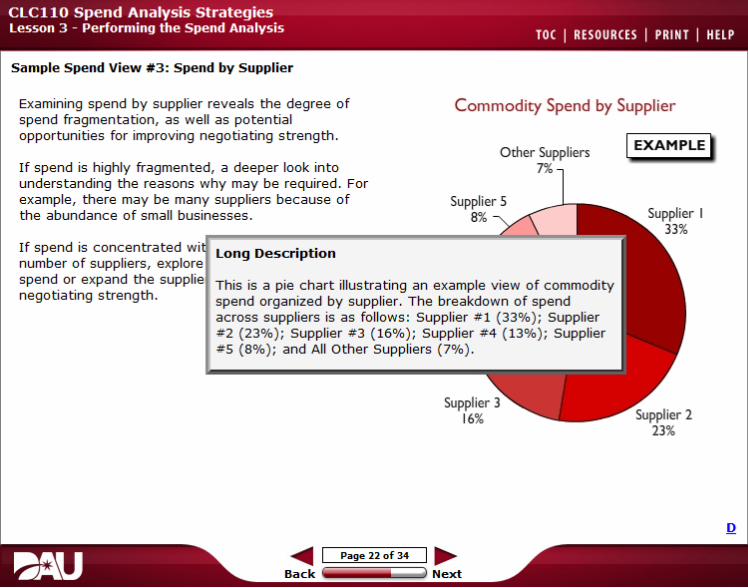
Examining spend by supplier reveals the degree of Commodity Spend by Supplier spend fragmentation, as well as potential opportunities for improving negotia ting strength. IEXAMPLEJ
If spend is highly fragmented, a deeper look into understanding the reasons why may be required. For example, there may be many suppliers because of the abundance of small businesses.
If spend is concen tra ted with a relatively few number of suppliers, explore ways to reallocate spend or expand the supplier base t o improve
Supplier 4 negotiating strength . 13%
~ I Poge llof J.4 I ...... Back Next
CLCllO Spend Analysis Strategies lesson 3- Performing the Spend Analysis TOC 1RESOURCES I PRINT I HELP
Sample Spend View # 3: Spend by Supplier
Examining spend by supplier reveals the degree of spend fragmentation, as well as potential
Commodity Spend by Supplier
opportunities for improving negotia ting strength. Other Suppliers IEXAMPLEJ
If spend is highly fragmented, a deeper look into 7% understanding the reasons why may be required. For example, there may be many suppliers because of Supplier 5 the abundance of small businesses. 8%
I f spend is concen tra ted wi l o ng Descrip tion number of suppliers, exnln,re l
spend or expand the su~JP11"1 This is a pie chart illustrating an example view of commodi ty negotiating strength. spend organized by supplier . T he breakdown of spend
across suppliers is as follows: Supplier # l (33%); Supplier # 2 (23%); Supplier #3 (16%); Supplier # 4 ( 13%); Supplier # 5 (8%); and All Other Suppliers ( 7%).
Supplier 3 16%
~ I Poge llof J.4 I ...... Back Next
CLCllO Spend Analysis Strategies lesson 3- Performing the Spend Analysis TOC I RESOURCES I PRINT I HELP
Sample Spend View # 3: Spend by Supplier, Cont.
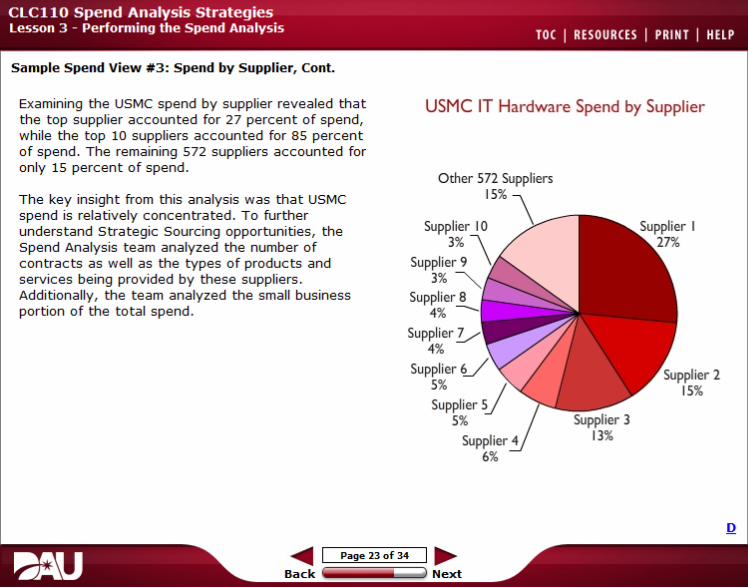
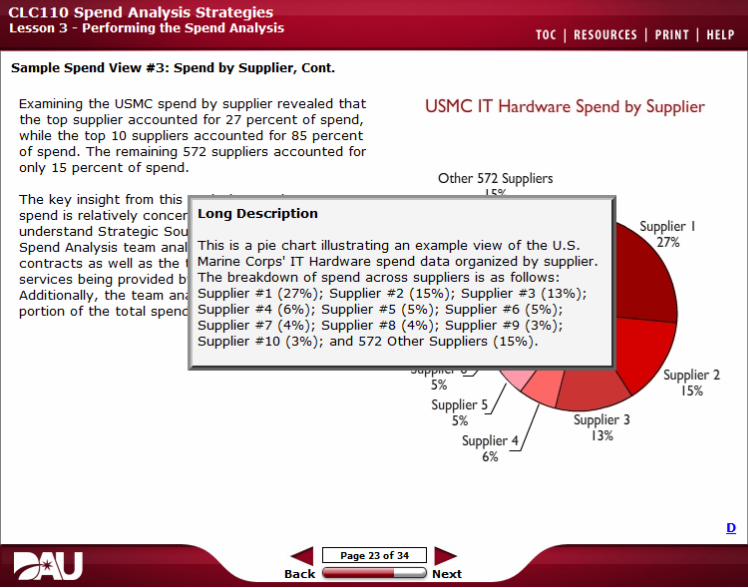
Examining the USMC spend by supplier r evealed that the top supplier accounted for 27 percent of spend, while the top 10 suppliers accounted for 8 5 percent of spend. The remaining 572 suppliers accounted for only 15 percent of spend.
The key insigh t from this analysis was that USMC spend is relatively conc entrated. To further understand Strategic Sourcing opportunities, the Spend Analysis team analyzed the number of contracts as well as the types of products and services being provided by these suppliers. Additionally, the team analy zed the small business portion of t he total spend.
USMC IT Hardware Spend by Supplier
Other 572 Suppliers IS%
Supplier 7 4%
Supplier 5%
~ I Poge 13 of J.4 I ...... Back Next
CLCllO Spend Analysis Strategies lesson 3- Performing the Spend Analysis TOC I RESOURCES I PRINT I HELP
Sample Spend View # 3: Spend by Supplier, Cont.
Examining the USMC spend by supplier revealed that USMC IT Hardware Spend by Supplierthe top supplier accounted for 27 percent of spend, while the top 10 suppliers accounted for 85 percent of spend. The remaining 572 suppliers accounted for only 15 percent of spend.
Other 572 Suppliers
The key insight from this r--------~-------~~------"1 spend is relatively r-n1nr-••rl l ong Descriptio n understand Strategic Spend Analysis team This is a pie chart illus trating an example view of the u .s . contrac t s as well as the Marine Corps' IT Hardware spend data organized by supplier . services being provided The breakdown of spend across suppliers is as follows: Additionally, the team Supplier # 1 ( 27%); Supplier #2 ( 15%); Supplier #3 ( 13%); portion of the total <n•.nrl Supplier #4 ( 6%); Supplier #5 (5%); Supplier #6 ( 5%);
Supplier #7 (4%); Supplier #8 (4%); Supplier #9 (3%); Supplier #10 (3%); and 572 Other Suppliers ( 15%).
~ I Poge 13 of J.4 I ...... Back Next
CLCllO Spend Analysis Strategies lesson 3- Performing the Spend Analysis TOC I RESOURCES I PRINT 1HELP
Sample Spend View #4: Commodity Purchase Pr ice by Supplier
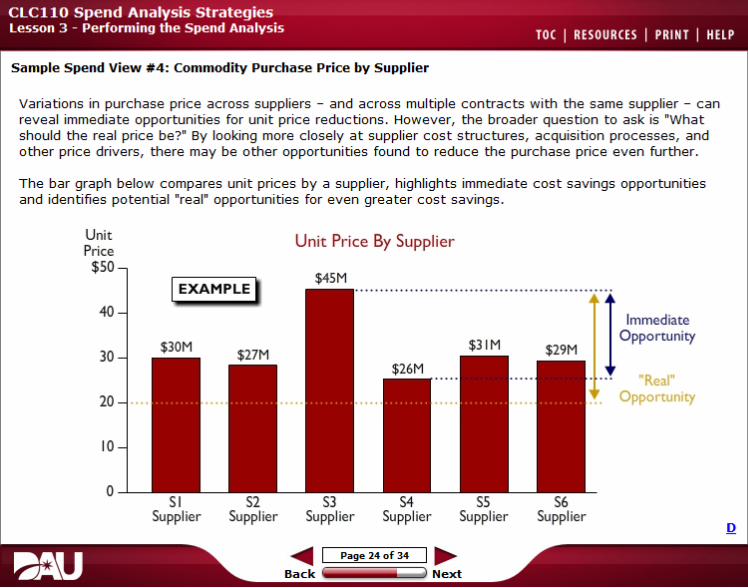
Variations in purchase price across suppliers - and across multiple contracts with the same supplier - can reveal immediate opportunities for unit price reductions . However, the broader question to ask is "What should the real price be?" By looking more closely at supplier cost structures, acquisition processes, and other price drivers, there may be other opportunities found to reduce the purchase price even further.
The bar graph below compares unit prices by a supplier, highlights immediate cost savings opportunities and identifies potential "real" opportunities for even greater cost savings.
Unit Price
Unit Price By Supplier
$50
IEXAMPLE I $45M
40 Immediate Oppo r tunity
30
"Real"
20 Opportunity
10
0 Sl S2 S3 S4 ss S6
Supplier Supplier Supplier Supplier Supplier Supplier
~ I Pa ge24of 34 I ..... Back Next
CLCllO Spend Analysis Strategies lesson 3- Performing the Spend Analysis TOC I RESOURCES I PRINT 1HELP
Sample Spend View # 4 : Commodity Purchase Price by Supplie r
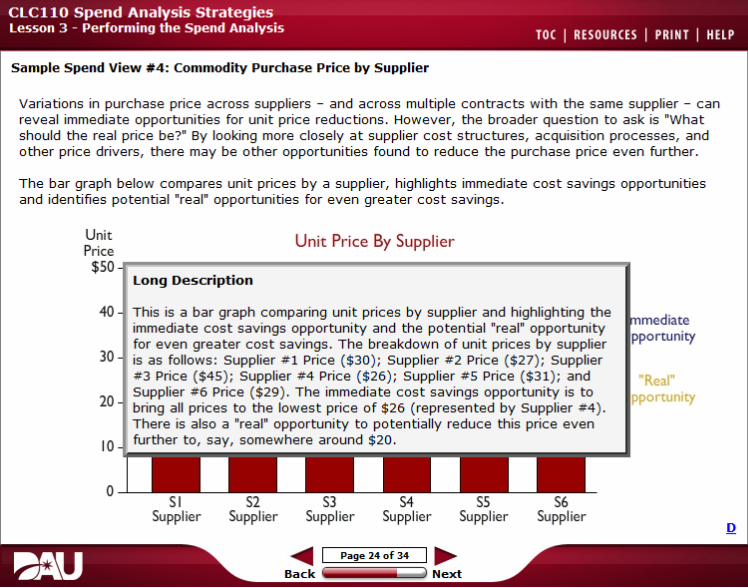
Variations in purchase price across suppliers - and across multiple contracts with the same supplier - can reveal immediate opportunities for unit price reductions . However, the broader question to ask is "What should the real price be?" By looking more closely at supplier cost structures, acquisition processes, and other price drivers, there may be other opportunities found to reduce the purchase price even further.
The bar graph below compares unit prices by a supplier, highlights immediate cost savings opportunities and identifies potential "real" opportunities for even greater cost savings .
Unit Unit Price By SupplierPrice $50 ~--------------------------~~~~~--~
l o ng Descriptio n
40 This is a bar graph comparing unit prices by supplier and highlighting the mediate
immediate cost savings opportunity and the potential "real" opportunity ppo r tunity
for even greater cost savings . The breakdown of unit prices by supplier 30 is as follows: Supplier # 1 Price ($30); Supplier #2 Price ($27) ; Supplier
#3 Price ($45 ); Supplier # 4 Price ($26); Supplier # 5 Price ($3 1 ); and "Real" Supplier #6 Price ( $29 ). The immediate cost savings opportunity is to pportunity20 bring all prices to the lowest price of $26 ( represented by Supplier # 4 ). There is also a "real" opportunity to potentially reduce this price even further to, say, somewhere around $20.10
I I I I I I0 Sl S2 S3 S4 ss S6
Supplier Supplier Supplier Supplier Supplier Supplier
~ I Page 24of 34 I ..... Back Next
CLCllO Spend Analysis Strategies lesson 3- Performing the Spend Analysis TOC I RESOURCES I PRINT 1HELP
Example of Spend View #4: Commodity Purchase Price by Supplier, Cont.
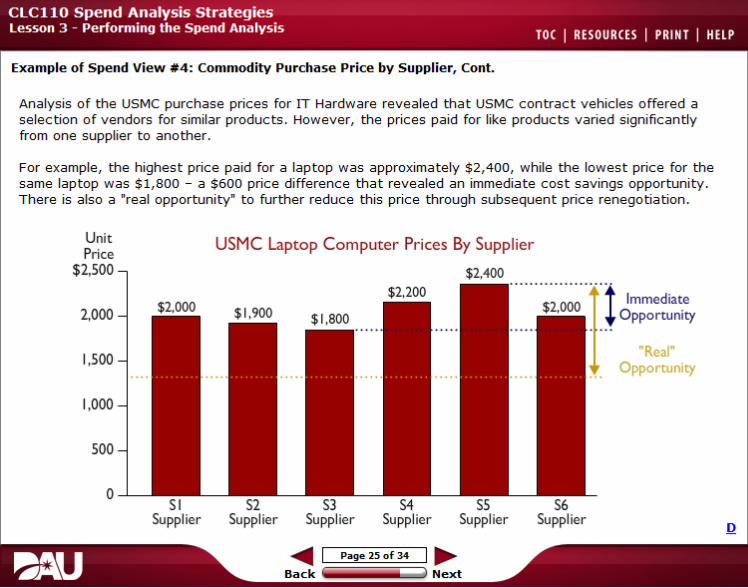
Analysis of the USMC purchase prices for IT Hardware revealed that USMC contract vehicles offered a selection of vendors for similar products. However, the prices paid for like products varied significantly from one supplier to another.
For example, the highest price paid for a laptop was approximately $2, 400, while the lowest price for the same laptop was $ 1,800 - a $600 price difference that revealed an immediate cost savings opportunity. There is also a "real opportunity" to further reduce this price through subsequent price renegotiation .
Unit USMC Laptop Computer Prices By SupplierPrice
$2,500 $2,400 ..Immediate 2,000 Opportunity!
"Real"1,500 Opportunity
1,000
500
0
Supplier Supplier Supplier Supplier Supplier Supplier
~ I Page2Sof 34 I ...... Back Next
CLCllO Spend Analysis Strategies lesson 3- Performing the Spend Analysis TOC I RESOURCES I PRINT 1HELP
Example of Spend View #4: Commodity Purchase Price by Supplier, Cont.
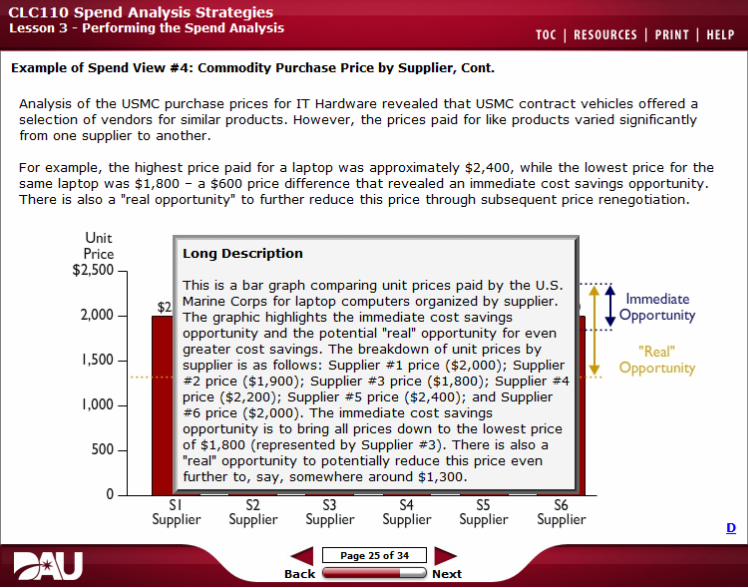
Analysis of the USMC purchase prices for IT Hardware revealed that USMC contract vehicles offered a selection of vendors for similar products. However, the prices paid for like products varied significantly from one supplier to another.
For example, the highest price paid for a laptop was approximately $2, 400, while the lowest price for the same laptop was $ 1,800 - a $600 price difference that revealed an immediate cost savings opportunity. There is also a "real opportunity" to further reduce this price through subsequent price renegotiation .
Unit Price l ong Descrip tion
$2,500 This is a bar graph comparing unit prices paid by the u.s. .. ImmediateMarine Corps for laptop computers organized by supplier.
2,000 The graphic highlights the immediate cost savings Opportunity!opportunity and the potential "real" opportunity for even greater cost savings. The breakdown of unit prices by "Real"1,500 supplier is as follows: Supplier #1 price ($2, 000 ); Supplier Opportunity #2 price ($ 1, 900 ); Supplier # 3 price ($ 1, 800); Supplier #4 price ($2, 200 ); Supplier #5 price ($2, 400 ); and Supplier1,000 #6 price ($2, 000 ) . The immediate cost savings opportunity is to bring all prices down to the lowest price of $ 1, 800 ( represented by Supplier # 3 ) . There is also a500 "real" opportunity to potentially reduce this price even further to, say, somewhere around $ 1,300.
0
Supplier Supplier Supplier Supplier Supplier Supplier
~ I Page2Sof 34 I ..... Back Next
CLCllO Spend Analysis Strategies lesson 3- Performing the Spend Analysis TOC I RESOURCES I PRINT 1HELP
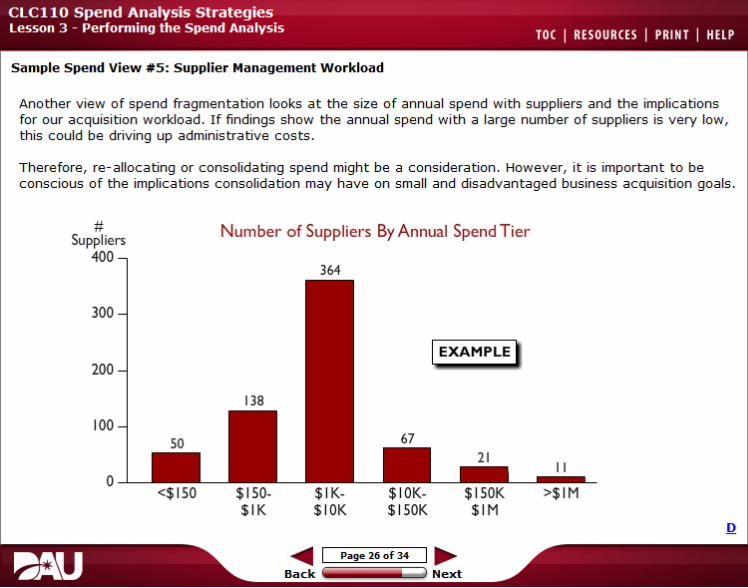
Sample Spend View #5: Supplier Management Workload
Another view of spend fragmentation looks at the size of annual spend with suppliers and the implications for our acquisition workload . If findings show the annual spend with a large number of suppliers is very low, this could be driving up administrativ e costs .
Therefore, re-allocating or consolidating spend might be a consideration . However, it is important to be conscious of the implications consolidation may hav e on small and disadvantaged business acquisition goals.
# Number of Suppliers By Annual Spend Tier Suppliers
400 364
300
IEXAMPLE~ 200
100
II 0
<$ 150 $ 150- $ 1K $ 10K $ 150K >$ 1M $ I K $ 10K $ 150K $1M
~ I Page 26 o f 34 I ..... Back Next

CLCllO Spend Analysis Strategies lesson 3- Performing the Spend Analysis TOC I RESOURCES I PRINT 1HELP
Sample Spend View #5: Supplier Management Workload
Another view of spend fragmentation looks at the size of annual spend with suppliers and the implications for our acquisition w orkload . If findings show the annual spend with a large number of suppliers is v ery low, this could be driving up administrativ e costs .
Therefore, re-allocating or consolidating spend might be a consideration . How ev er, it is important to be conscious of the implications consolidation may hav e on small and disadv antaged business acquisition goals .
# Suppliers
Number of Suppliers By Annual Spend Tier
400 l ong Description
300 Bar graph illustrating an example view of the number of suppliers organized by annual spend tier. The breakdown of suppliers by annual spend tier is as follow s: 50 suppliers are in
200 the "less than $ 150" annual spend tier; 138 suppliers are in the "$ 150 to $ 1K" annual spend tier; 364 suppliers are in the "$ 1K to $ 10K" annual spend tier; 67 suppliers are in the "$ 10K to $ 150K" annual spend tier; 2 1 suppliers are in the $ 150K to
100 $ 1M" annual spend tier; and 11 suppliers are in the "Greater than $ 1M" annual spend tier.
II 0
<$ 150 $ 150 $ 1K $ 10K $ 150K >$ 1M $ I K $ 10K $ 150K $1M
~ I Page26of 34 I ..... Back Next
CLCllO Spend Analysis Strategies lesson 3- Performing the Spend Analysis TOC I RESOURCES I PRINT 1HELP
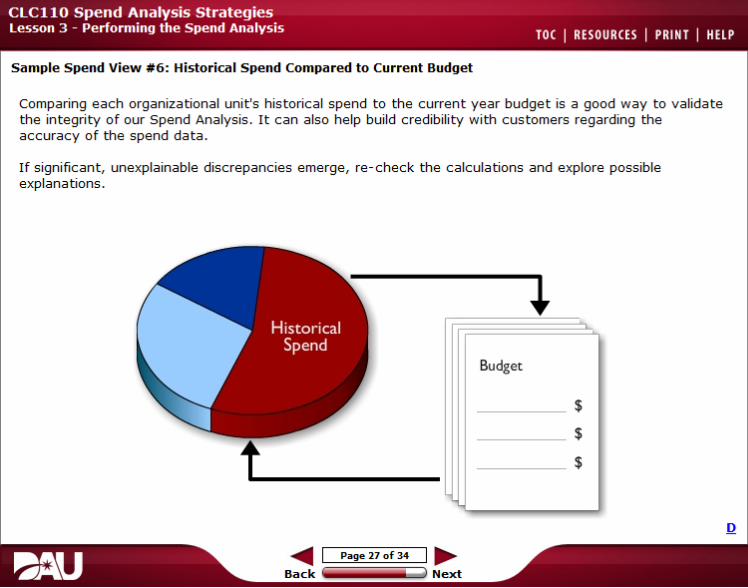
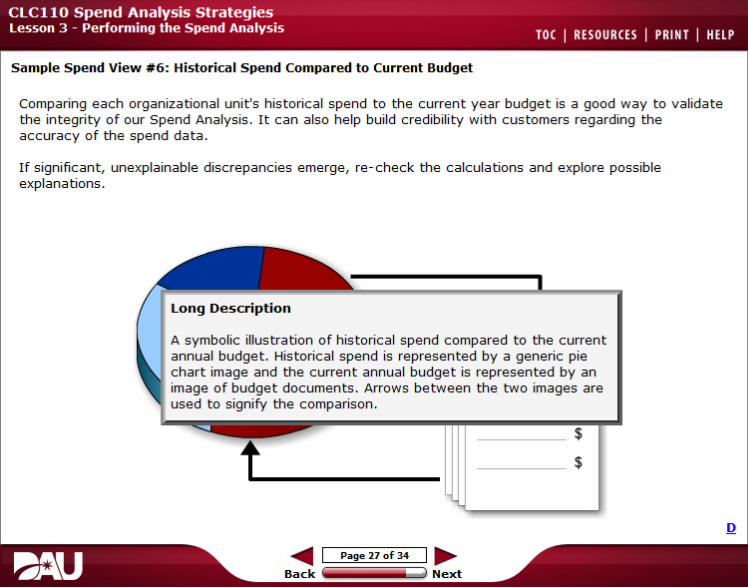
Sample Spend View #6: Historical Spend Compared to Current Budget
Comparing each organizational unit's historical spend to the current year budget is a good way to validate the integrity of our Spend Analysis . It can also help build credibili ty with customers regarding the accuracy of the spend data.
If significant, unexplainable discrepancies emerge, re-check the calculations and explore possible explanations.
Budget
____ $
____ $
____ $
~ I Page27of 34 I ..... Back Next
CLCllO Spend Analysis Strategies lesson 3- Performing the Spend Analysis TOC I RESOURCES I PRINT 1HELP
Sample Spend View #6: Historical Spend Compared to Current Budget
Comparing each organizational unit's historical spend to the current year budget is a good way to validate the integrity of our Spend Analysis . It can also help build credibili ty with customers regarding the accuracy of the spend data.
If significant, unexplainable discrepancies emerge, re- check the calculations and explore possible explanations .
l o ng De scrip tio n
A symbolic illustration of historical spend compared to the current annual budget. Historical spend is represented by a generic pie chart image and the current annual budget is represented by an image of budget documents. Arrows between the two images are used to signify the comparison .
$
$
~ I Page27of 34 I ..... Back Next
CLCllO Spend Analysis Strategies lesson 3- Performing the Spend Analysis TOC I RESOURCES I PRINT 1HELP
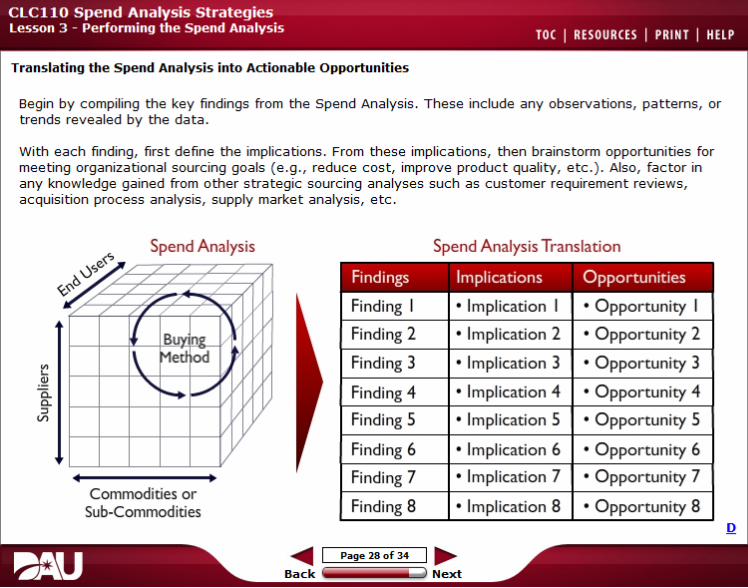
Translating the Spend Analysis into Actionable Opportunities
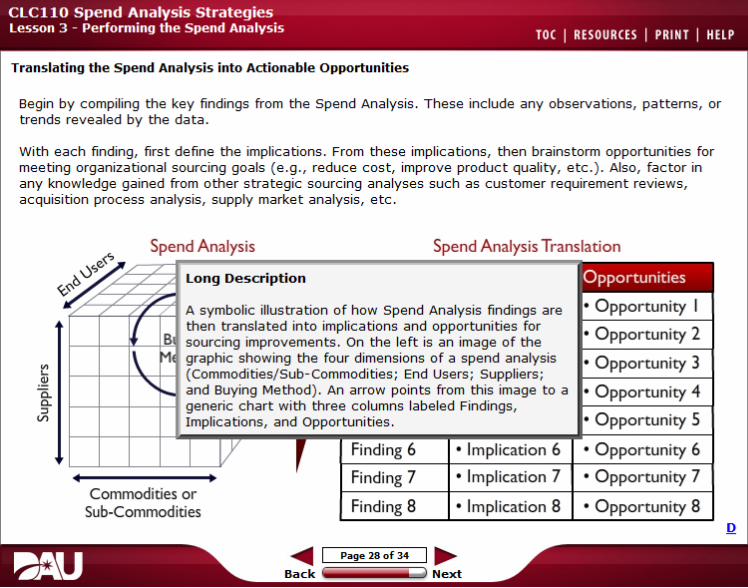
Begin by compiling the key findings from the Spend Analysis . T hese include any observations, patterns, or trends revealed by the data.
With each finding, first define the implications . From these implications, then brainstorm opportunities for meeting organizational sourcing goals ( e.g., reduce cost, improve product quality, etc.) . Also, factor in any knowledge gained from other strategic sourcing analyses such as customer requirement reviews, acquisition process analysis, supply market analysis, etc.
Spend Analysis Spend Analysis Translation
Findings Implications OpportunitiesX:~ / 7 Finding I • Implication I • Opportunity I
I Buv nP Finding 2 • Implication 2 • Opportunity 2
I\ Metl od
" ...... _, Finding 3
Finding 4
• Implication 3
• Implication 4
• Opportunity 3
• Opportunity 4
Finding 5 • Implication 5 • Opportunity 5
Finding 6 • Implication 6 • Opportunity 6
Commodities or Finding 7 • Implication 7 • Opportunity 7
Sub-Commodities Finding 8 • Implication 8 • Opportunity 8
~ I Page 28of34 I ..... Back Next
CLCllO Spend Analysis Strategies lesson 3- Performing the Spend Analysis TOC I RESOURCES I PRINT 1HELP
Translating the Spend Analysis into Actionable Opportunities
Begin by compiling the key findings from the Spend Analy sis . These inc lude any observations, pa tterns, or trends rev ealed by the da ta .
With each finding, firs t define the implica tions. From these implica tions, then brains t orm opportunities f or mee ting organiza tional sourcing goals ( e .g ., reduce cos t, improve produc t quali ty, e t c . ) . Also, fac t or in any knowledge gained from o ther s trategic sourcing analy ses such as c us t omer requirement review s, ac quisition process analysis, supply marke t analy sis, e tc .
Spend Analysis Spend Analysis Translation
l ong De s cript ion
A symbolic illustration of how Spend Analy sis findings are then translated into implic ations and opportunities for sourc ing improvements. On the left is an image of the graphic showing the four dimensions of a spend analysis (Commodities/ Sub-Commodities; End Users ; Suppliers ; and Buying Me thod ) . An arrow points from this image to a
f---+--+-+-1 generic c hart with three columns labeled Findings, Implic ations, and Opportunities.
Finding 6 • Implication 6
Finding 7 • Implication 7
Finding 8 • Implication 8
Opportunities
• O ppor tun ity I
• O ppor tun ity 2
• O ppor tun ity 3
• O ppor tun ity 4
• O ppor tun ity 5
• O ppor tun ity 6
• O ppor tun ity 7
• O ppor tun ity 8 Commodities or
Sub-Commodities
Page 28 of 34 , .....~ I Back Next

CLCllO Spend Analysis Strategies lesson 3- Performing the Spend Analysis TOC I RESOURCES I PRINT I HELP
Guidelines for Spend Analysis Interpretation
In determining the implications of the Spend Analysis and the resulting opportunities, there are four general guidelines to follow:
1. Findings should be measurable and quantifiable.
2. Findings should fac tor in qualitative insights.
3. Findings should consider other organizational fac tors.
4. Recommenda tions should be socialized to gain buy in and identify potential road blocks.
~ I Poge 29 of J.4 I ..... Back Next
CLCllO Spend Analysis Strategies lesson 3- Performing the Spend Analysis TOC I RESOURCES I PRINT I HELP
Guidelines for Spend Analysis Interpretation
In determining the implications of the Spend Analysis and the resulting opportunities, there are four general guidelines to follow:
1. Findings should be measurable and quantifiable.
2. Findings should fac tor in qualitative insights.
3. Findings should consider other organizational fac tors.
4. Recommenda tions should be socialized to gain buy in and identify potential road blocks.
Findings Sh o uld Be Measurable and Quantifiable Hard facts are always preferable to hunches. The recommendations coming out of the Spend Analysis should be clearly supported by the spend data.
~ I Poge 29 of J.4 I ..... Back Next
CLCllO Spend Analysis Strategies lesson 3- Performing the Spend Analysis TOC I RESOURCES I PRINT I HELP
Guidelines for Spend Analysis Interpretation
In determining the implications of the Spend Analysis and the resulting opportunities, there are four general guidelines to follow:
1. Findings should be measurable and quantifiable.
2. Findings should fac tor in qualitative insights.
3. Findings should consider other organizational fac tors.
4. Recommenda tions should be socialized to gain buy in and identify potential road blocks.
Findings Sh ould Factor In Qualit a t ive Insights
Beyond the data, we can also apply our understanding of some of the more qualitative asp ects of sourcing such as user requirements, demand drivers, organizational constraints, etc.
~ I Poge 29 of J.4 I ..... Back Next
CLCllO Spend Analysis Strategies lesson 3- Performing the Spend Analysis TOC I RESOURCES I PRINT I HELP
Guidelines for Spend Analysis Interpretation
In determining the implications of the Spend Analysis and the resulting opportunities, there are four general guidelines to follow:
1. Findings should be measurable and quantifiable.
2. Findings should fac tor in qualitative insights.
3. Findings should consider other organizational fac tors.
4. Recommenda tions should be socialized to gain buy in and identify potential road blocks.
Findings Sh ould Consider Other Organization !!! F!lctors
We should be aware of any special organizational sensitivities (e.g., structural constraints) or political factors (e.g., acquisition mandates) that affect how the commodity is sourced. We also consider the outcomes and lessons learned from any past sourcing improvement efforts.
~ I Poge 29 of J.4 I ..... Back Next

CLCllO Spend Analysis Strategies lesson 3- Performing the Spend Analysis TOC I RESOURCES I PRINT I HELP
Guidelines for Spend Analysis Interpretation
In determining the implications of the Spend Analysis and the resulting opportunities, there are four general guidelines to follow:
1. Findings should be measurable and quantifiable.
2. Findings should fac tor in qualitative insights.
3. Findings should consider other organizational fac tors.
4. Recommenda tions should be socialized to gain buy in and identify potential road blocks.
Recommendiltio n s Should Be Socialized To Gain Buy In l!lnd I d entify Potential Road Blocks Any conclusions or recommendations made should be presented and discussed with key stakeholders. Their feedback is a valuable gauge of the integrity of our analysis and viability of potential improvements.
~ I Poge 29 of J.4 I ..... Back Next
CLCllO Spend Analysis Strategies lesson 3- Performing the Spend Analysis TOC I RESOURCES I PRINT 1HELP
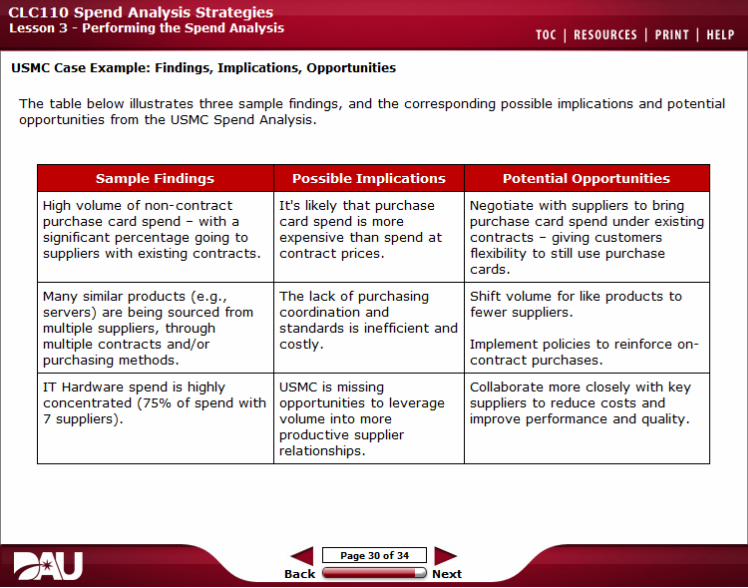
USMC Case Example: Findings, Implications, Opportunities
The table below illustrates three sample findings, and the corresponding possible implications and potential opportunities from the USMC Spend Analysis .
Sample Findings
High volume of non- contract purchase card spend - with a significant percentage going to suppliers with existing contracts .
Many similar products ( e.g., servers ) are being sourced from multiple suppliers, through multiple contracts and/ or purchasing methods.
IT Hardware spend is highly concentrated ( 75% of spend with 7 suppliers ) .
Possible Implications
I t 's likely that purchase card spend is more expensive than spend at contract prices .
The lack of purchasing coordination and standards is inefficient and costly .
USMC is missing opportunities to leverage volume into more productive supplier relationships .
Potential Opportunities
Negotiate with suppliers to bring purchase card spend under existing contracts - giving customers flexibili ty to still use purchase cards .
Shift volume for like products to fewer suppliers .
Implement policies to reinforce on contract purchases .
Collaborate more closely with key suppliers to reduce costs and improve performance and quality.
~ I Page30of 34 I ..... Ba ck Next
CLCllO Spend Analysis Strategies lesson 3 - Performing the Spend Analysis TOC 1 RESOURCES 1 PRINT 1 HELP
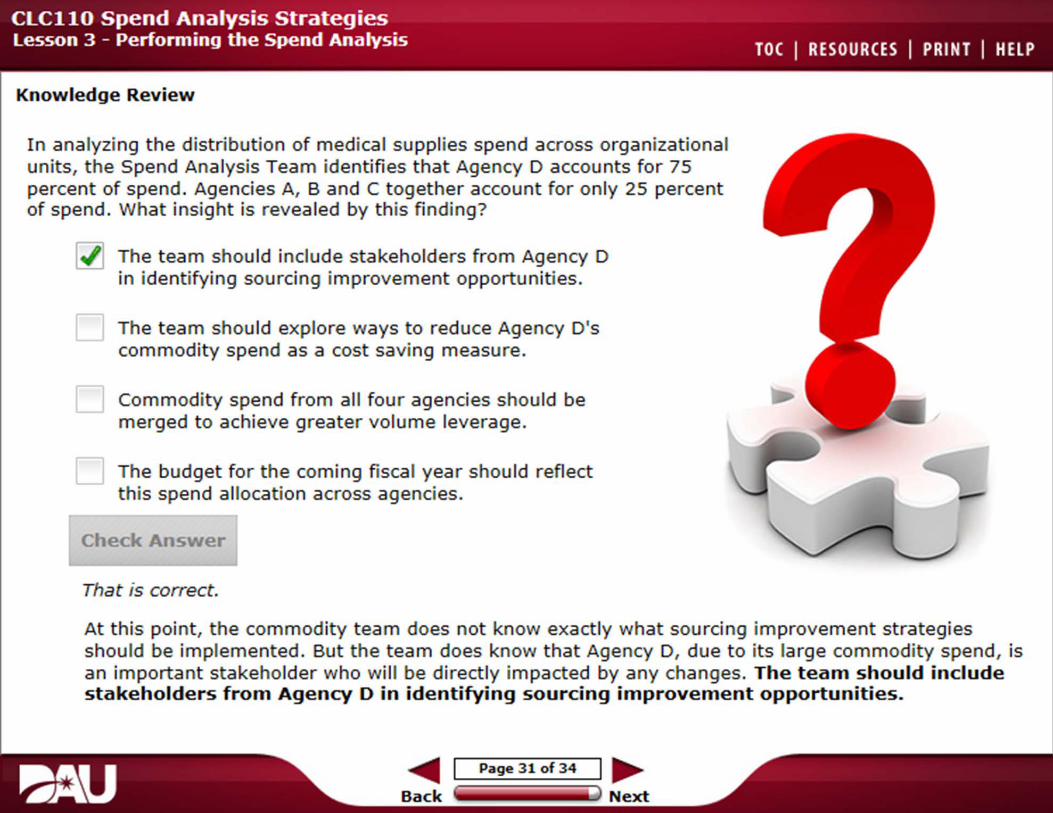
Knowledge Review
I n analyzing the d ist ribution of medica l supplies spend across organizational units, the Spend Ana lysis Team ident ifies that Agency D accounts for 75 percent of spend. Agencies A, B and C together account for only 25 percent of spend . What insight is revealed by this finding?
l ~i The team should include stakeholders from Agency D i n identi,fying sourcing i,mprovement opportunities.
The team should explore ways to reduce Agency o •s commodity spend as a cost saving measure.
Commodity spend from an four agencies s hould be merged to achieve greater volume feverage.
D The budget for the coming fiscal yea r should reflect this spend allocation across agencies.
Check Answer
That is correct.
At this point, the commodity team does not know exactly what sourcing improvement strategies shoul d be implemented . But the team does know that Agency D, due t o its large commodity spend, is an important stakeholder who w ill be directly i mpacted by any changes. The team should include stakeholders from Agency D in identifying sourcing improvement opportunities.
~ Page 3 1 of34 l ~ Back Next
CLCllO Spend Analysis Strategies lesson 3 - Performing the Spend Analysis TOC 1 RESOURCES 1 PRINT 1 HELP
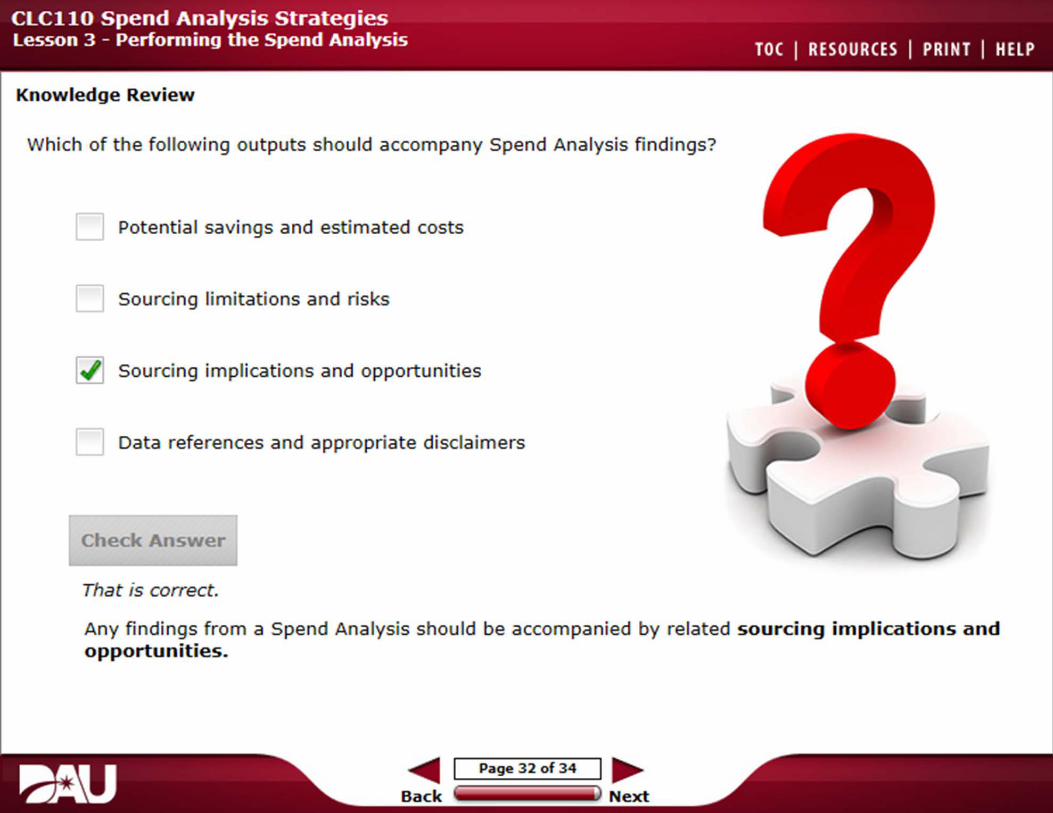
Knowledge Review
Which of the following outputs should accompany Spend Analysis findings?
Potential savings and estimated costs
Sourcing lim itations and risks
61 Sourcing implications and opportunities
Data references and appropriate disclaimers
Check Answer
That is correct.
Any fi ndings from a Spend Ana lysis shou ld be accompanied by related sourcing implications and opportunities.
~ Page 3 2 of 3 4 I ~ Back Next
CLCllO Spend Analysis Strategies lesson 3- Performing the Spend Analysis TOC I RESOURCES I PRINT I HELP
Summary
This concludes the Performing the Spend Analysis lesson. You should now be able to:
• Identify the key steps a nd considerations involved with developing a Spend Profile.
• Identify common spend data views and the sourcing insigh ts they can provide.
• Identi fy key considerations involved with translating the Spend Analysis in to actionable opportuni ties .
~ I Pogellofl4 I ...... Back Next
CLCllO Spend Analysis Strategies lesson 3- Performing the Spend Analysis TOC I RESOURCES I PRINT I HELP
lesson Completion
You have completed the content for this lesson.
To continue, select another lesson from the Table o f Contents on the left.
If you have closed or hidden the Table of Contents, click the Show TOC button at the top in the Atlas navigation bar.
~ I Pogel4ofl4 I ...... Back Next