speech production after glossectomy: methodological aspects. · speech production after...
TRANSCRIPT
Speech production after glossectomy: methodological
aspects.
Audrey Acher, Pascal Perrier, Christophe Savariaux, Cecile Fougeron
To cite this version:
Audrey Acher, Pascal Perrier, Christophe Savariaux, Cecile Fougeron. Speech production afterglossectomy: methodological aspects.. Clinical Linguistics & Phonetics, Taylor & Francis, 2014,28 (4), pp.241-56. <10.3109/02699206.2013.802015>. <hal-00983108>
HAL Id: hal-00983108
https://hal.archives-ouvertes.fr/hal-00983108
Submitted on 24 Apr 2014
HAL is a multi-disciplinary open accessarchive for the deposit and dissemination of sci-entific research documents, whether they are pub-lished or not. The documents may come fromteaching and research institutions in France orabroad, or from public or private research centers.
L’archive ouverte pluridisciplinaire HAL, estdestinee au depot et a la diffusion de documentsscientifiques de niveau recherche, publies ou non,emanant des etablissements d’enseignement et derecherche francais ou etrangers, des laboratoirespublics ou prives.
Speech production after glossectomy:
methodological aspects
Audrey Acher1, Pascal Perrier1, Christophe Savariaux1, & Cecile Fougeron2
1GIPSA-Lab, UMR 5216 CNRS/ Université Grenoble-Alpes,
Saint Martin d’Hères, France
2Laboratoire de Phonétique et Phonologie, UMR 7018 CNRS/Univ. Paris, France
Clin Linguist Phon. 2014 Apr;28(4):241-56. doi: 10.3109/02699206.2013.802015. Epub 2013 Jul 9.
Abstract
This paper focuses on methodological issues related to quantitative assessments of
speech quality after glossectomy. Acoustic and articulatory data were collected for 8
consonants from two patients. The acoustic analysis is based on spectral moments
and the Klatt VOT. Lingual movements are recorded with ultrasound without
calibration. The variations of acoustic and articulatory parameters across pre- and
post-surgery conditions are analysed in the light of perceptual evaluations of the
stimuli. A parameter is considered to be relevant if its variation is congruent with
perceptual ratings. The most relevant acoustic parameters are the skewness and the
Center of Gravity. The Klatt VOT explains differences that could not be explained by
spectral parameters. The SNTS ultrasound parameter provides information to
describe impairments not accounted for by acoustical parameters. These results
suggest that the combination of articulatory, perceptual and acoustic data provides
comprehensive complementary information for a quantitative assessment of speech
after glossectomy.
Keywords: hemiglossectomy, tongue cancer, ultrasound, acoustic analysis.
Introduction
Malignant intraoral tumours have a high lethality and a noticeable socio-
psychological impact. The plexiform musculature of the tongue facilitates the
development of invasive tumours (Meley & Barthelmé, 1987) and 6500 new cases
were diagnosed in France in 2010 (Ligier et al., 2011). Clinical treatments have
recently improved and a variety of possibilities are now available for the patients:
chemotherapy, radiation therapy and surgery.
Surgical treatments of tongue cancers consist of a resection of the tumour and
surrounding tissues, which is known as glossectomy. Depending on the size of the
tumour, the glossectomy can be further classified as partial or total, and it concerns
different types of adjacent structures in the tongue. Usually, if the volume of the
resected tissues is large, the resection is followed by a reconstruction. During the
reconstruction, a flap is grafted to the remaining tongue tissues, in order to give to the
tongue a volume and a form that are similar to the one of the patient before surgery.
The impact of the flap on tongue mobility depends on the volume of the resected
tissues (Heller et al., 1991; Dios et al., 1994), the location of the tumour (Korpijaakko-
Huukha et al., 1998), the mechanical characteristics of the flap (Buchaillard et al.,
2007) and its connections to the tongue tissues (Konstantinovic & Dimic, 1998;
Bressmann, 2004, 2007).
Radiation therapy and chemotheraphy can generate fibrosis, i.e. an excess of
fibrous connective tissues. This tends to increase the rigidity of the tongue and to
decrease its mobility and flexibility (Bundgaard et al., 1993). It can also cause
xerostomia (drying of the mucosa and the mouth). Xerostomia limits mobility,
especially in cases involving contact of the tongue with the teeth or the palate. For all
treatments, specific factors such as age and postoperative complications (Kazi et al.,
2007; Laaksonen et al., 2011) can slow down and limit the speech recovery.
In summary many factors can influence the quality of speech after clinical
treatments of tongue cancer. For speech therapists, quantitative methods are needed
to assess speech quality in post-surgery conditions in order to develop (and later
evaluate) their rehabilitation programme. Crucially, the consequences of articulatory
impairments following the surgery on speech intelligibility need to be further explored
in order to be improved.
The goal of this paper is to contribute to the development of a methodology for
assessing speech quality, which is based on measurements of specific physical
variables, in the acoustic and the articulatory domains. Findings are based on the
combination of data recorded from two patients who have undergone a
hemiglossectomy: the acoustic signal, ultrasound data on tongue position without
calibration and perceptual assessments of speech quality.
The absence of calibration for ultrasound data is an important drawback of
ultrasound studies with patients after vocal tract surgery. Their general health state
does not allow the use of a helmet (such as the one manufactured by Articulate
Instruments Ltd 2008) or any other device for tightly maintaining the head and the
probe in a fixed position (Stone et al,. 1995). The presence of oedema in the first
post-surgery condition prevents from having the same position of the probe across
assessment conditions due to the temporary swelling of the neck. Solutions based on
optical measures have also been proposed (Whalen et al., 2005). However, this
experimental set-up was not available for this study. Consequently, part of the
specificity of this work was to address the issue of extracting reliable information from
non-calibrated ultrasound data.
Materials and methods
Patients
Two native speakers of French participated in this study (P1, a male, 28 years
old and P2, a female, 62 years old). They have undergone a partial glossectomy and
a bilateral neck dissection. The right side of the tongue was resected and
reconstructed using a musculocutaneous infrahyoid flap.
The resection resulted in a hemiglossectomy. A hemiglossectomy is the
resection of half of the tongue longitudinally. In both patients the tip of the tongue
was preserved. Patients were recorded once in pre-surgery condition (condition
PREOP) and twice in post-surgery condition, namely 1 month (condition POSTOP1)
and 3 months (condition POSTOP2) after surgery. Before the first pre-surgery
recording (condition PREOP), both patients received chemotherapy. They started to
receive radiation therapy 6 weeks after surgery (duration 6 weeks). The radiation
therapy occurred between the POSTOP1 and POSTOP2 conditions. Tumours were
classified as T4 according to the TNM classification of malignant tumours.
Experimental Data
The corpus was made of 24 CVCVC sequences where C is one of the/t, d, k,
g, s, z, ʃ, ʒ/ consonants and V is either/i//u/or /a.Each sequence was repeated 6
times in isolation in a specified order in a quiet room in the hospital. The acoustic
signal was recorded together with tongue movements measured with ultrasound. The
sampling frequency for the acoustic signal was 22050 Hz. The ultrasound machine
was a Mindray DP-6600, the convex probe was a Mindray 35C20EA with a frequency
of 3.5 MHz. The ultrasound stream rate was 60 frames per second. The experiment
was run using Articulate Assistant Advanced software (AAA) version 2.09 from
Articulate Instrument (Articulate Instruments Ltd 2011). The probe was placed under
the chin. Lingual imaging data were collected in the coronal and the sagittal plane
(three repetitions each) with the AAA software. In this study, only sagittal data were
analysed.
Recently ultrasound has become more popular in phonetic research. It is non-
invasive technique that does not involve any risk for the patient. In addition, portable
ultrasound units have been designed at reasonable cost. It is a useful tool to describe
static and dynamic aspects of the shape of the tongue during speech and swallowing
(Stone 2005). The real time display of the shape of the tongue on a screen makes
this technique very attractive for speech therapists as a tool for visual feedback. This
technique has been used in particular to study pathological speech. Some
researchers used it to investigate speech production after glossectomy (Schliephake
et al., 1998, Bressmann et al., 2007).
Data analysis
The analysis included (1) extracting the spectral and temporal parameters
from the acoustic signal, (2) extracting information about lingual movement and
tongue positioning in the oral cavity from the ultrasound data and (3) assessing
perceptually the quality of the speech produced. The focus was the analysis of the
consonants /t, d, k, g, s, z, ʃ, ʒ/ in the centre of the CVCVC sequences, surrounded by
a symmetrical vowel context (/i-i/, /u-u/ and /a-a/). Consonantal articulations were
chosen in this study because of the precise accuracy in tongue positioning and in the
timing of the tongue movements required for their production. Hence, they are very
appropriate to the purpose of this study.
Perceptual evaluation
Five speech therapists have participated in a perceptual evaluation of the
speech production of the two patients. Two repetitions of each VCV sequence were
presented once in a random order (N=144 VCV per patient i.e. 8 consonants x 3
vowel contexts x 2 repetitions x 3 conditions). The judges were asked to rank the
quality of the stimuli from 1 (normal), 2 (sightly impaired), 3 (moderately impaired), 4
(strongly impaired) to 5 (unintelligible). The identity of the consonant was given.
Acoustic parameters
The acoustical characterization of all consonants was based on the
computation of the spectral moments (1st moment: Centre Of Gravity (COG), 3rd
moment: skewness and 4th moment: kurtosis) (Forrest et al., 1988). Spectral
moments inform about the distribution of the energy in the frequency domain. For
consonants’ classification, the relevance of methods based on the characterization of
this energy distribution for the burst or for the frication noise is a controversial issue in
the literature (see among others Forrest et al., 1988; Jesus & Shadle, 2002; Jones &
Munhall, 2003). However, based on a number of different trials on our own data, and
in line with Forrest and colleagues (1988), we decided to use and evaluate these
spectral moments in the current study.
The timing of the consonantal gesture was also indirectly captured in the
acoustical domain via the Klatt Voice Onset Time (VOT) (Stevens & Klatt, 1974). As
compared to the initial definition of VOT (Lisker & Abramson, 1964), the Klatt VOT
includes the transition from the consonant to the vowel. It is more relevant for the
purpose of this study, because it accounts for the time properties of tongue
movement after the consonantal release. This definition, originally proposed for
stops, was extended to sibilants (see below).
The acoustical analysis requires a careful manual labelling of the signal in
order to specify the segments of the signal that are relevant for the computation of
the spectral moments. The labelling was achieved using simultaneously the time and
the wide-band spectrographic representation. It includes four time events as shown in
figure 1:
- The offset of the vowel preceding the consonant (V1); it was defined as the
first zero crossing with rising edge after F2 vanishes on the spectrogram.
- The onset and offset of the noisy part of the consonant, i.e. the burst for the
stops, and the frication noise for sibilants: they were determined on the
spectrogram as the beginning and end of the broad band high frequency
region (4000-8000 Hz).
- The onset of laminar flow in the vocal tract after the consonant: it is defined as
the time where formant F2 re-appears clearly on the spectrogram after the
onset of the noisy part of the consonant.
On the basis of these four labels, three durations were determined as seen in
figure 1: (1) the total hold duration of the consonant, from V1 offset to the onset of the
noisy part for the stops, and from V1 offset to the offset of the noisy part for the
sibilant; (2) the noise duration from the onset to the offset of the noisy part of the
consonant; (3) the Klatt VOT from the end of the consonant hold part (i.e. the onset
of the noisy part for the stops and the offset of the noisy part for the sibilants) to the
onset of the laminar flow. In this study, only the noise duration and Klatt VOT were
used.
--------------------- Insert Figure 1 around here --------------------------
To compute the spectral moments, the modulus of the short-term acoustic
spectrum was computed with Digital Fourier Transform (512 points) for a time series
of successive Hanning windows of 5 ms, overlapping by 60%, for the whole duration
of the noise. Spectral moments were calculated with MATLAB®, for the spectral
envelope in the range going from 2000Hz to 6500Hz, and with a linear decibel scale
(dB). The low-frequency part was discarded to remove any potential influence of
voicing. This computation consisted of the following steps (Forrest et al., 1988): (1)
the spectrum modulus in dB in frequency range (2000 Hz – 6500 Hz) was normalised
in amplitude by the integral of this modulus over the frequency range; this
normalization provides the spectrum with properties that are similar to those of a
distribution of probability P(Sp) of a random variable Sp; (2) on this basis, the mean
(mSp) of variable Sp, its standard deviation ( Sp) and the 3rd and 4th moments (M3(Sp)
and M4(Sp)), from the centred variable (Sp-mSp) were calculated; (3) finally the
skewness and kurtosis parameters were calculated according to the classical
formulas (skewness=M3(Sp)/ Sp3; kurtosis=M4(Sp)/ Sp
4). The spectral Centre Of
Gravity (COG) was given by the mean value mSp. The Centre Of Gravity gives
information about the average of the frequency distribution of the spectral energy.
A high COG has been found for anterior phonemes. The skewness parameter
informs about the right-left asymmetry of the spectral envelope: the higher the
skewness the more the spectral energy is localized on low frequencies (left skewed)
as in posterior phonemes. The interpretation of the kurtosis parameter is more
complex (see DeCarlo, 1997). For Gaussian-like distributions of probability it informs
about the shape of the curve P(x): the flatter the curve, the smaller the kurtosis. This
corresponds to the way Forrest et al., 1988 interpreted this parameter. However, for
more complex distributions, the kurtosis depends at the same time on the amplitude
of the maximum and on the amplitude of the tails of the distribution. Hence, for a
spectral envelope having several local maxima, kurtosis becomes a global way to
characterize the shape of the noise envelope of the consonant.
On this basis, it is expected that, in case of reduction of the amplitude of
tongue movements, the COG of the anterior consonants (i.e. the alveolars [t], [d], [s],
[z], and the post-alveolars [ʃ], [ʒ]) should decrease, while their skewness should
increase. For the back consonants ([k, g]), the contrary is expected. Given the
complexity of the relations between the distribution shape and the kurtosis, no
specific predictions were made concerning the links between the pathology and the
values of the kurtosis.
The analysis of the variation of the Klatt VOT, the COG, the skewness and the
kurtosis across conditions (PREOP, POSTOP1, POSTOP2) was carried out
qualitatively. These parameters were considered to provide a reliable assessment of
the speech quality after surgery, when they accounted for the perceptual ratings of
the stimuli and their evolutions after surgery.
Articulatory parameters
Ultrasound devices measure the distance between the tongue contour and the
probe. Hence, ultrasound signals vary both with changes in the tongue position and
with changes in the probe position. In order to make sure that the recorded signals
informs strictly about changes in tongue position, it is required either that the probe
never moves with respect to the head or that probe movements can be detected and
corrected. A number of systems have been designed in the past years to maintain
constant the position of the probe in relation to those of the head (Stone 2005;
Scobbie et al., 2008). They all have been proved to be helpful and efficient. However,
they are physically extremely constraining, and it is not possible to use them with
patients who have undergone a surgery of the vocal tract and, often, a neck
dissection.
A photography of the location of the probe was used to reposition the probe
nearly at the same place across conditions (PREOP, POSTOP1, POSTOP2). In
addition, during the recording a special attention was devoted to a careful visual
control of the probe position. To check if the probe had kept constant during the
production of each stimulus, a rectangle was drawn with a marker at the selected
probe location on the patient’s skin. However, since the probe was not physically
constrained to stay at the same place, the possibility remains that the probe position
has changed across stimuli and conditions. Part of the processing of the data was
thus conceived in order to find a way to extract relevant information about changes in
articulation across conditions, in spite of the lack of calibration. This has been largely
inspired by the proposals made by Menard and colleagues in the Phonetic
Laboratory of Montréal (Ménard et al., 2012).
Tongue contours were extracted and smoothed by a sixth degree polynomial
function, using MATLAB®. For the sequences in which the probe did not move much,
it was possible to reliably evaluate the relative displacement and deformation of the
tongue during the sequence. To do so a parameter that provides a global measure of
the speed of deformation and elevation of the tongue contour in the plane defined by
the ultrasound beam was developed. This parameter was measured as follows. For a
given sequence the origin of the axis system in the plane was set at the location of
the lowest point of all the contours taken together. In this plane a contour is defined a
function y=F(x), in which the x-axis is the horizontal axis, and x varies in the interval
[xmin, xmax]. The integral of function F for x varying within [xmin, xmax] was computed
and this integral was normalized by the difference (xmax-xmin). The time derivative of
this integral was calculated. This derivative was selected to be the parameter that
measures the relative tongue shape changes during each sequence. We named this
parameter “Speech of the Normalized Tongue Surface” (SNTS). The time variation of
this parameter was approximated with a fourth degree polynomial function (see figure
2).
--------------------- Insert Figure 2 around here --------------------------
Relevance of the acoustic and articulatory parameters
The methodology to assess the relevance of the acoustic and articulatory
parameters that are described above, was (1) to compute these parameters for each
of the VCV sequences studied for each speaker, and (2) to investigate which of these
parameters that show differences across recording conditions are compatible with the
perceptual evaluations.
Results
For each consonant, the data recorded in the /i-i/ and /a-a/ contexts were
pooled in a single data set, and no further analysis was made of the specificity of the
vowel context. The /u-u/ context was not considered in this study because the
protrusion of the lips tends to mask the spectral consequences of changes in tongue
position.
Perceptual analysis
Perceptual ratings were first analysed for all consonants together and for each
patient separately with a Friedman test, in order to evaluate the global perceptual
effect of the “condition” factor (PREOP, POSTOP1, POSTOP2) in the /i-i/ and /a-a/
contexts taken together. There is a significant effect of this factor for both patients
(P1: Friedman chi-squared(2)=54.91, p<0.01; P2: Friedman chi-squared(2)=105.22,
p<0.01). Post hoc tests were then conducted to compare conditions pairwise. All
differences were significant. The significance level was adjusted to 0.0167 for the
post hoc tests, following the Bonferroni method. As expected, the perceptual ratings
of both speakers’ stimuli were the worst for the first post-surgery condition, i.e. a
month after surgery (PREOP<POSTOP, PREOP<POSTOP2 and
POSTOP1>POSTOP2). The worse perceptual scores were given for patient P2 as it
can be seen in figure 4. Mean perceptual results are shown in Figures 3 and 4,
respectively for patient P1 and P2.
--------------------- Insert Figures 3 & 4 around here --------------------------
Acoustical analysis
Results are presented in Figures 5 and 6, respectively for patient P1 and P2.
For the alveolar and post-alveolar consonants, the decrease of the perceptual quality
of the stimuli observed for both patients from condition PREOP to condition
POSTOP1 is generally associated with a decrease of the COG and an increase of
the skewness. This is in agreement with our expectations: after surgery the tongue is
less mobile and the amplitude of the forward movements (associated with high
spectral frequencies) is reduced. There are some exceptions: for patient P1 the
perceptual quality of the post-alveolar [ʃ] and [ʒ] does improves from PREOP to
POSTOP1 and the COG and the skewness are fairly constant; for patient P2, the
perceptual quality of [t] and [d] decreases, while the COG increases and skewness
decreases; for [ʒ] produced by patient P2, the skewness does not increase from
PREOP to POSTOP1, while COG and perceptual quality decrease. From condition
POSTOP1 to condition POSTOP2, the perceptual quality tends to improve, without
reaching the baseline (PREOP). This improvement is generally associated with an
increase of the COG and a decrease of the skewness. Again there are some
exceptions: for patient P1, the perceptual quality of consonants [ʃ] and [ʒ] remains
stable and the COG and the skewness also; still for patient P1, the perceptual quality
of [s] becomes worse in POSTOP2 than in POSTOP1, in spite of the fact that the
COG increases and the skewness decreases.
For the velar consonants, the perceptual quality decreases for both patients
from condition PREOP to condition POSTOP1 and improves from condition
POSTOP1 to condition POSTOP2. The decrease of the perceptual quality is
associated with a decrease of the COG and an increase of the skewness. This result
suggests that in contrast to our expectations, the reduction of tongue mobility leads
the patient to articulate velar consonants at a more posterior position, in the
velopharyngeal region and not more forward in the palatal region. This can be
explained by the fact that velopharyngeal sounds do not require as much tongue
bunching than palato-velar ones. This strategy is consistent with observations made
from patients after glossectomy in Savariaux et al. (2000).No clear relation could be
found between the change of the kurtosis and the perceptual ratings.
In sum, in the majority of cases the COG and the skewness parameters
provide information that is congruent with the perceptual rating: for all consonants, a
decrease of the COG and an increase of the skewness reveal a decrease of the
perceptual quality. However, three cases could not be described by these parameters
for patient P2: the global evolution of the production of the stops [t] and [d] and the
change from PREOP to POSTOP1 for the sibilant [ʒ]. For patient P1, only one case
could not be explained: the change of the production of the sibilant [s] from
POSTOP1 to POSTOP2. Two other cases, [ʃ] and [ʒ] of patient P1, did not show any
decrease of the perception quality.
--------------------- Insert Figure 5 & 6 around here --------------------------
The next step was to seek for a measure that could account for these 4 cases not
explained by spectral moments. The Klatt VOT was used and compared across
conditions as illustrated in figures 7. VOT variations across conditions are congruent
with the perceptual ratings for [t, d, ʒ of patient P2: a lengthening of the Klatt VOT is
associated with a decrease of quality (from PREOP to POSTOP1) and a reduction in
the VOT values in POSTOP2 condition corresponds to the improvement of the quality
from POSTOP1 to POSTOP2. For the sibilant [s] of patient P1 the Klatt VOT does not
explain the decrease of the speech quality from POSTOP1 to POSTOP2.
--------------------- Insert Figure 7 around here --------------------------
In sum, neither the spectral changes, which reflect changes in articulatory
position, nor the Klatt VOT can explain the differences in perceptual ratings that
suggest a decrease of speech quality from POSTOP1 to POSTOP2 in [s] for patient
P1. In the next section, we will show that the time variation of the SNTS provides a
possible account for this phenomenon.
Articulatory analysis
Figure 8 depicts the time variation of the SNTS parameter for the sequences
/isi/ and /asa/ produced by speaker P1. The zero-crossings of these curves reflect
changes in movement directions: an increase of the tongue surface indicates either
an elevation of the tongue or more central position of the tongue; a decrease
indicates either a flattening or a clear displacement towards the front of the back of
the vocal tract. The extrema of these curves reflect the maximal speed in either
direction. Hence, both number of zero-crossing and amplitude of the extrema are a
way to assess the dynamics of tongue mobility, i.e. the capacity of the tongue to
move in different directions within a same sequence.
From condition PREOP to POSTOP1 we observe clear differences in the
SNTS time variation in /asa/. These changes in tongue dynamics contribute to the
decrease of speech quality together with the changes in tongue position reflected by
the modification of COG and skewness mentioned earlier and illustrated in Figure 5.
This is not the case for /isi/. For both sequences, in condition POSTOP2, SNTS
varies less and with smaller amplitude than in POSTOP1. This is consistent with the
decrease of the speech quality observed from POSTOP1 to POSTOP2.
Thus, the decrease of the speech quality observed for patient P1 from
POSTOP1 to POSTOP2 condition in the sibilant [s] seems to be due to a reduction of
the dynamics of tongue mobility which is captured by the SNTS time variation.
--------------------- Insert Figure 8 around here --------------------------
Discussion
On the basis of a perceptual evaluation carried out by five speech therapists, it
is shown that the quality of the consonants produced in VCV sequences by the two
patients who underwent hemiglossectomy was significantly lower one month after
surgery (condition POSTOP1) than before surgery (condition PREOP), and it
improved three months after surgery (condition POSTOP2) without reaching the
quality of the pre-surgery condition. Three spectral moments, COG, skewness and
kurtosis, were computed from the acoustic signal in the burst for the stops and in the
frication noise for the sibilants. A specific parameter was extracted from the non-
calibrated ultrasound data, the “Speed Normalised Tongue Surface” (SNTS) that
should inform, in the absence of calibration of the ultrasound data, about the capacity
of the subjects to move and shape the tongue within each VCV sequence.
Changes in the spectral moments COG and skewness corresponded with the
perceptual evaluation of a large majority of the analyzed consonants in the /i-i/ and
/a-a/ contexts. The Kurtosis parameter did not provide reliable information that could
be related to the perceptual ratings. Thus, the kurtosis parameter does not seem to
be an efficient parameter to characterize pathological speech produced by
glossectomized patients.
In the /a-a/ and /i-i/ contexts, the measures of the Klatt VOT were congruent
with the perceptual evaluation when the latter could not be explained by spectral
parameters i.e. [t, d, ʒfor P2 , with an exception though for the [s] of patient P1. It
was found that changes in the SNTS parameter corresponded with changes in the
perceptual evaluation of this consonant in the two vowel contexts.
The combined analysis of acoustic and articulatory parameters enable an
interpretation of the causes of the decrease in speech quality and it change after
surgery. For the majority of the productions, spectral changes measured by the COG
and skewness were shown to be associated with the decrease of speech quality.
These spectral changes can be interpreted as evidence for an inadequate tongue
positioning: a lowering of the COG associated with an increase of the skewness post-
surgery suggests that the location of the articulation of the consonant is more
posterior. An increase of the Klatt VOT is associated with the fact that a longer
duration is required to reach the physical conditions of a laminar airflow in the vocal
tract after the release of the consonant. This can be due either to a decreased
capacity for the patients to move the tongue rapidly or to problems with saliva related
to a possible xerostomia. The articulatory evaluation shows that patient P1 has
decreased capacity in post-operative conditions to shape the entire tongue correctly
within the duration of a V-/s/-V sequence. This articulatory parameter suggests for P1
a significant global stiffening of the tongue or a reduced strength in the tongue.
These physical changes could not be noticed on the basis of the spectral parameters
that we selected.
Combining spectral and temporal acoustic analyses with ultrasound based
articulatory measures enable an inference of the physical origins of the decrease of
speech quality after surgery. This combination of parameters reveals impairments
related either to the dynamics of tongue mobility or to the reduced capacities to
position the tongue correctly in the anterio-posterior direction. This comprehensive
functional assessment could help therapists to define the best possible rehabilitation
protocol including specific tasks involving various kinds of tongue displacement and
shaping.
Conclusion
The combination of acoustic, articulatory and perceptual data about the speech
production of two patients who underwent hemiglossectomy has enabled a first
evaluation of the relevance of some specific acoustic and articulatory parameters.
The relevance has been evaluated by the capacity of these parameters to let emerge
differences across recording conditions which follow perceptual judgements, and,
second, by their capacity to suggest articulatory explanations for these differences.
The COG and the spectral moments give information about tongue positioning that
was relevant for speech quality. The Klatt VOT and articulatory measurement provide
relevant information for the assessment of the sequences that could not be explained
by spectral moments. The articulatory parameter named SNTS provides relevant
information in terms of the dynamics of the mobility of the tongue. It has been
extracted without any calibration of the ultrasound data. This is an important point,
since calibration of the ultrasound data is often not possible with glossectomized
patients in a clinical environment.
Acknowledgments
The data were recorded at European Hospital Georges Pompidou in Paris in the ENT
department (Head: Pr. Brasnu). The authors gratefully thank Lise Crevier-Buchman
(European Hospital Georges Pompidou & LPP, Paris), Benjamin Roustan, Thomas
Hueber (Gipsa-lab) and Alan Wrench (Articulate Instruments) for their help at
different stages of the work.
Conflict of Interest Statement
Audrey Acher, on behalf of Pascal Perrier, Christophe Savariaux and Cécile
Fougeron declares that there is no conflict of interest.
References
Articulate Instruments Ltd 2011. Articulate Assistant Advanced User Guide: Version
2.13. Edinburgh, UK: Articulate Instruments Ltd.
Articulate Instruments Ltd 2008. Ultrasound Stabilisation Headset Users
Manual: Revision 1.4. Edinburgh, UK: Articulate Instruments Ltd.
Bressmann, T., Sader, R., Whitehill, T. L. & Samman, N. (2004). Consonant
intelligibility and tongue motility in patients with partial glossectomy. Journal of Oral
and Maxillofacial Surgery, 62, 298-303.
Bressmann, T., Ackloo, E., Heng, C. L. & Irish, J. C. (2007). Quantitative three-
dimensional ultrasound imaging of partially resected tongues. Otolaryngology-Head
Neck Surgery, 136, 799-805.
Buchaillard, S., Brix, M., Perrier, P. & Payan, Y. (2007). Simulations of the
consequences of tongue surgery on tongue mobility: implications for speech
production in post-surgery conditions. International Journal of Medical Robotics and
Computer Assisted Surgery, 3, 252-261.
Bundgaard, T., Tandrup, O. & Elbrønd, O. (1993). A functional evaluation of patients
treated for oral cancer. A prospective study. International Journal of Oral and
Maxillofacial Surgery, 22, 28-34.
DeCarlo, L. T. (1997). On the meaning and use of Kurtosis. Psychological Methods,
2, 292-307.
Dios, P. D., Feijoo, J. F., Ferreiro, M. C. & Alvarez, J. A. (1994). Functional
Consequences of Partial Glossectomy. Journal of Oral and Maxillofacial Surgery, 52,
12-14.
Forrest, K., Weismer, G., Milenkovic, P. & Dougall, R. N. (1988). Statistical analysis
of word-initial voiceless obstruents: preliminary data. Journal of Acoustical Society of
America, 84, 115-123.
Heller, K. S., Levy, J. & Sciubba, J. J. (1991). Speech patterns following partial
glossectomy for small tumors of the tongue. Head & Neck, 13, 340-343.
Jesus, L. M. T. & Shadle, C. H. (2002). A parametric study of the spectral
characteristics of European Portuguese fricatives. Journal of Phonetics, 30, 437-464.
Jones, J. A. & Munhall, K. G. (2003). Learning to produce speech with an altered
vocal tract: the role of auditory feedback. Journal of the Acoustical Society of
America, 113, 532-543.
Kazi, R., Prasad, V. M. N., Kanagalingam, J. Georgalas, C., Venkitaraman, R.,
Nutting, C. M., . . . Harrington, K. J. (2007). Analysis of formant frequencies in
patients with oral or oropharyngeal cancers treated by glossectomy. International
Journal of Language & Communication Disorders, 42, 521-532.
Konstantinovic, V. S. & Dimic, N. D. (1998). Articulatory function and tongue mobility
after surgery followed by radiation therapy for tongue and floor of the mouth cancer
patients. British Journal of Plastic Surgery, 51, 589-593.
Korpijaakko-Huuhka A. M., Söderholm A. L. & Lehtihalmes, M. (1998). Long-lasting
speech and oral-motor deficiencies following oral cancer surgery: a retrospective
study. Logopedics Phoniatrics Vocology, 24, 97-106.
Laaksonen, J. P., Rieger, J., Harris, J. & Seikaly, H. (2011). A longitudinal acoustic
study of the effects of the radial forearm free flap reconstruction on sibilants produced
by tongue cancer patients. Clinical Linguistics & Phonetics, 25, 253-264.
Ligier, K., Belot, A., Launoy, G., Velten, M., Delafosse, P., Guizard, A. V, le réseau
FRANCIM. (2011). Epidémiologie des cancers de la cavité buccale en France.
Revue de Stomatologie et de Chirurgie Maxillo-Faciale, 112, 164-171.
Lisker, L. & Abramson, A. S. (1964). A cross-language study of voicing in initial stops:
acoustical measurement. Word, 20, 384-422.
Meley, M. & Barthelmé, E. (1987). Les cancers de la cavité buccale et de
l'oropharynx, France:Masson.
Ménard, L., Aubin, J., Thibeault, M. & Richard, G. (2012). Measuring Tongue Shapes
and Positions with Ultrasound Imaging: A Validation Experiment Using an Articulatory
Model. Folia Phoniatrica & Logopaedica, 64, 64-72.
Savariaux, C., Perrier, P., Lebeau, J., Magaña, G. & Dorange-Pattoret, C. (2000).
Production de parole après traitements de cancers de la cavité endobuccale.
Proceedings of the XXIIIrd Journées d’Etude de la Parole, 433-436, Aussois, France.
Schliephake, H. Schmelzeisen, R., Schönweiler, R., Schneller, T. & Altenbernd, C.
(1998). Speech, deglutition and life quality after intraoral tumor resection. A
prospective study. International Journal of Oral and Maxillofacial Surgery, 27, 99-105.
Scobbie, J. M., Wrench, A. A. & Van der Linden, M. (2008). Head-probe stabilisation
in ultrasound tongue imaging using a headset to permit natural head movement.
Proceedings of the Eighth International Seminar on Speech Production (ISSP), 373-
376, Strasbourg University, France.
Stevens, K. N. & Klatt, D. H. (1974). Role of formant transitions in the voiced-
voiceless distinction for stops. Journal of the Acoustical Society of America, 55, 653-
659.
Stone, M. & Davis, E. (1995). A head and transducer support system for making
ultrasound images of tongue/jaw movement. Journal of the Acoustical Society of
America, 980, 3107–3112.
Stone M. (2005). A Guide to Analyzing Tongue Motion from Ultrasound Images.
Clinical Linguistics and Phonetics, 19, 455-502.
Whalen, D. H., Iskarous, K., Tiede, M. K., Ostry, D. J., Lehnert-Lehouillier, H.,
Vatikiotis-Bateson E. & Hailey D. S. (2005). The Haskins optically corrected
ultrasound system (HOCUS). Journal of Speech Language and Hearing Research,
48, 543-553.
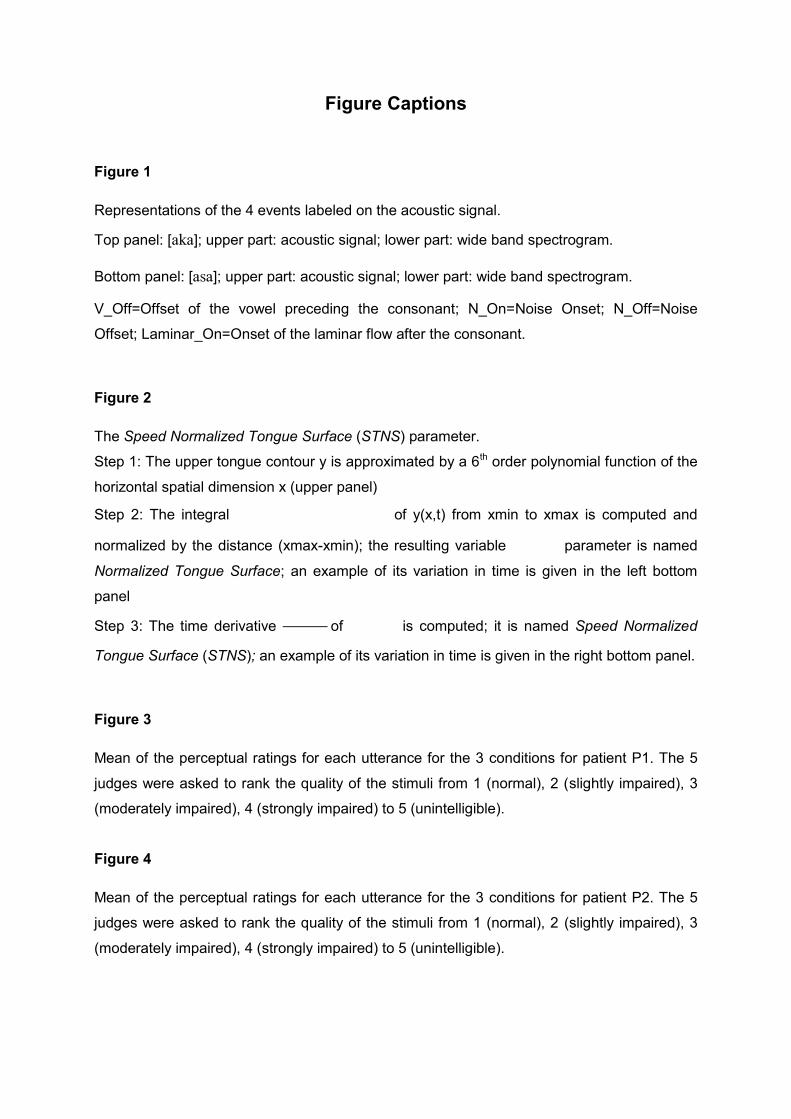
Figure Captions
Figure 1
Representations of the 4 events labeled on the acoustic signal.
Top panel: [aka]; upper part: acoustic signal; lower part: wide band spectrogram.
Bottom panel: [asa]; upper part: acoustic signal; lower part: wide band spectrogram.
V_Off=Offset of the vowel preceding the consonant; N_On=Noise Onset; N_Off=Noise
Offset; Laminar_On=Onset of the laminar flow after the consonant.
Figure 2
The Speed Normalized Tongue Surface (STNS) parameter.
Step 1: The upper tongue contour y is approximated by a 6th order polynomial function of the
horizontal spatial dimension x (upper panel)
Step 2: The integral of y(x,t) from xmin to xmax is computed and
normalized by the distance (xmax-xmin); the resulting variable parameter is named
Normalized Tongue Surface; an example of its variation in time is given in the left bottom
panel
Step 3: The time derivative of is computed; it is named Speed Normalized
Tongue Surface (STNS); an example of its variation in time is given in the right bottom panel.
Figure 3
Mean of the perceptual ratings for each utterance for the 3 conditions for patient P1. The 5
judges were asked to rank the quality of the stimuli from 1 (normal), 2 (slightly impaired), 3
(moderately impaired), 4 (strongly impaired) to 5 (unintelligible).
Figure 4
Mean of the perceptual ratings for each utterance for the 3 conditions for patient P2. The 5
judges were asked to rank the quality of the stimuli from 1 (normal), 2 (slightly impaired), 3
(moderately impaired), 4 (strongly impaired) to 5 (unintelligible).
Figure 5
Mean of the acoustic measurements and perceptual ratings for each sequence for /a-a/ and
/i-i/ contexts pooled for the 3 conditions for patient P1. Values along the Y-axis are either
without dimension (Perception score, Skewness, Kurtosis) or in kHz (COG).
Figure 6
Mean of the acoustic measurements and perceptual ratings for each sequence for /a-a/ and
/i-i/ contexts pooled for the 3 conditions for patient P2. Values along the Y-axis are either
without dimension (Perception score, Skewness, Kurtosis) or in kHz (COG).
Figure 7
Evolution of Klatt VOT during time for consonants /s/ in /a-a/ and /i-i/ contexts pooled for
patient P1 and /t, d, ʒ/ in /a-a/ and /i-i/ contexts pooled for patient P2.
Figure 8
Evolution of the “Speed Normalised Tongue Surface” for /asa/ (top) and /isi/ (bottom)
pronounced by P1.
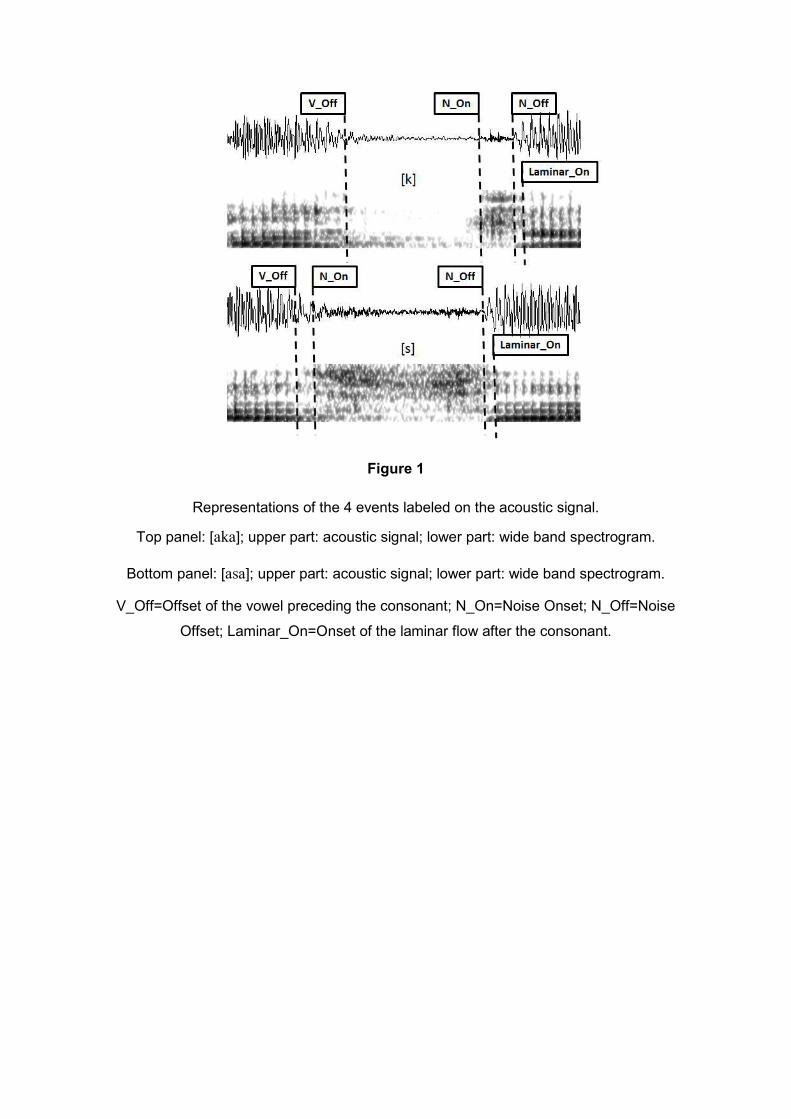
Figure 1
Representations of the 4 events labeled on the acoustic signal.
Top panel: [aka]; upper part: acoustic signal; lower part: wide band spectrogram.
Bottom panel: [asa]; upper part: acoustic signal; lower part: wide band spectrogram.
V_Off=Offset of the vowel preceding the consonant; N_On=Noise Onset; N_Off=Noise
Offset; Laminar_On=Onset of the laminar flow after the consonant.
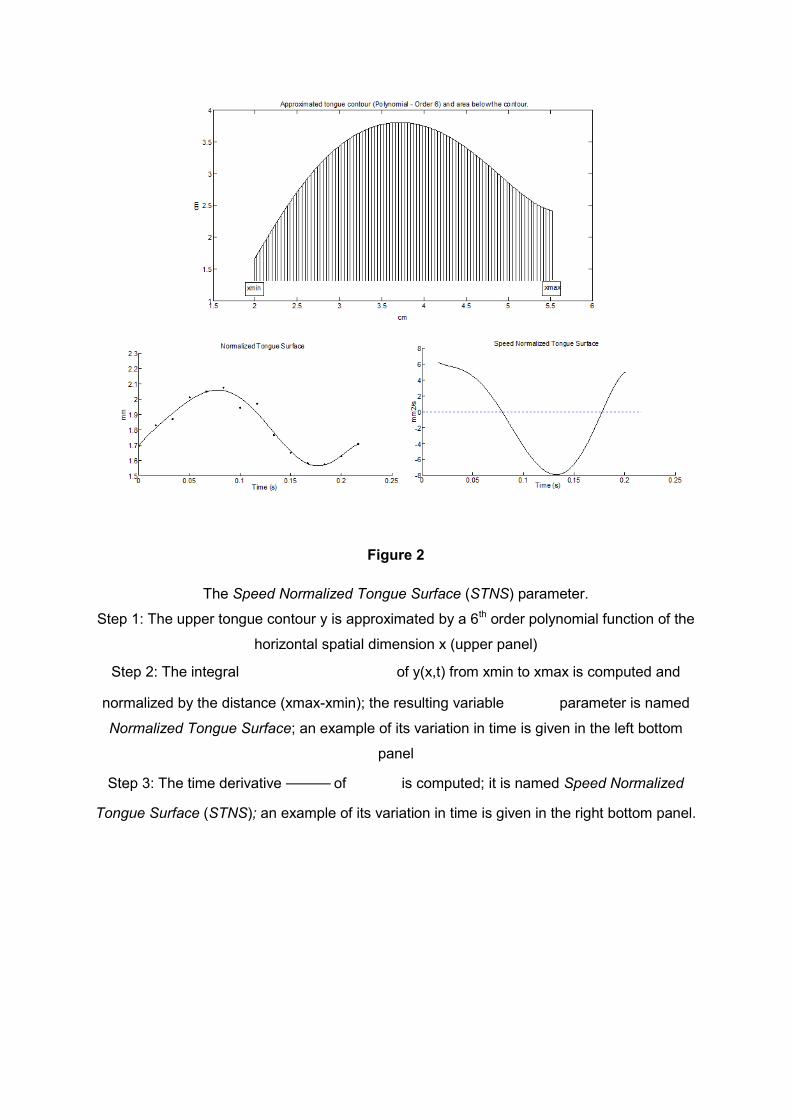
Figure 2
The Speed Normalized Tongue Surface (STNS) parameter.
Step 1: The upper tongue contour y is approximated by a 6th order polynomial function of the
horizontal spatial dimension x (upper panel)
Step 2: The integral of y(x,t) from xmin to xmax is computed and
normalized by the distance (xmax-xmin); the resulting variable parameter is named
Normalized Tongue Surface; an example of its variation in time is given in the left bottom
panel
Step 3: The time derivative of is computed; it is named Speed Normalized
Tongue Surface (STNS); an example of its variation in time is given in the right bottom panel.
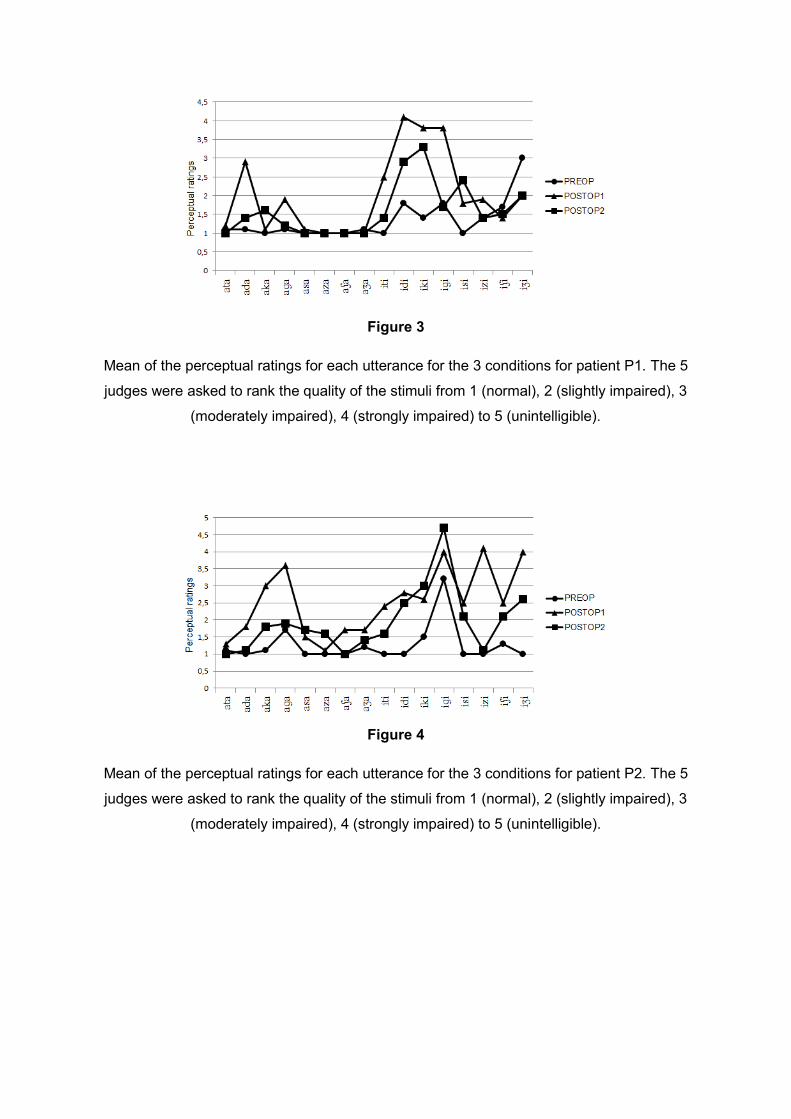
Figure 3
Mean of the perceptual ratings for each utterance for the 3 conditions for patient P1. The 5
judges were asked to rank the quality of the stimuli from 1 (normal), 2 (slightly impaired), 3
(moderately impaired), 4 (strongly impaired) to 5 (unintelligible).
Figure 4
Mean of the perceptual ratings for each utterance for the 3 conditions for patient P2. The 5
judges were asked to rank the quality of the stimuli from 1 (normal), 2 (slightly impaired), 3
(moderately impaired), 4 (strongly impaired) to 5 (unintelligible).
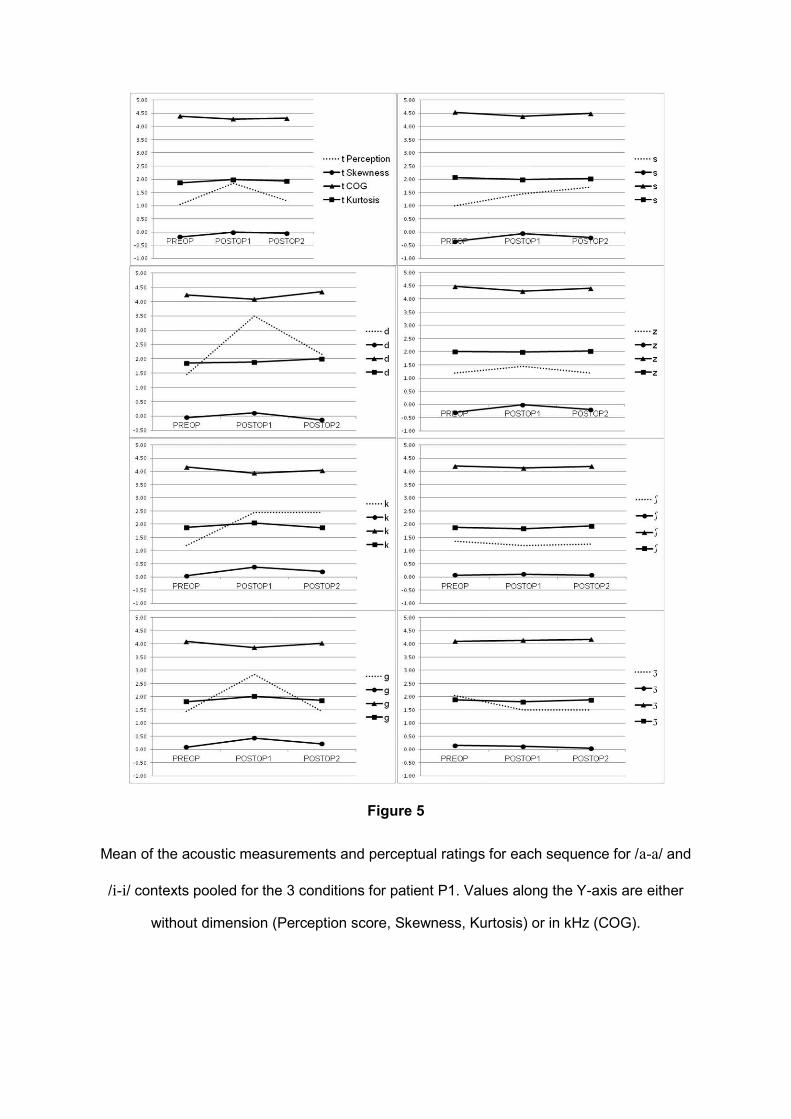
Figure 5
Mean of the acoustic measurements and perceptual ratings for each sequence for /a-a/ and
/i-i/ contexts pooled for the 3 conditions for patient P1. Values along the Y-axis are either
without dimension (Perception score, Skewness, Kurtosis) or in kHz (COG).
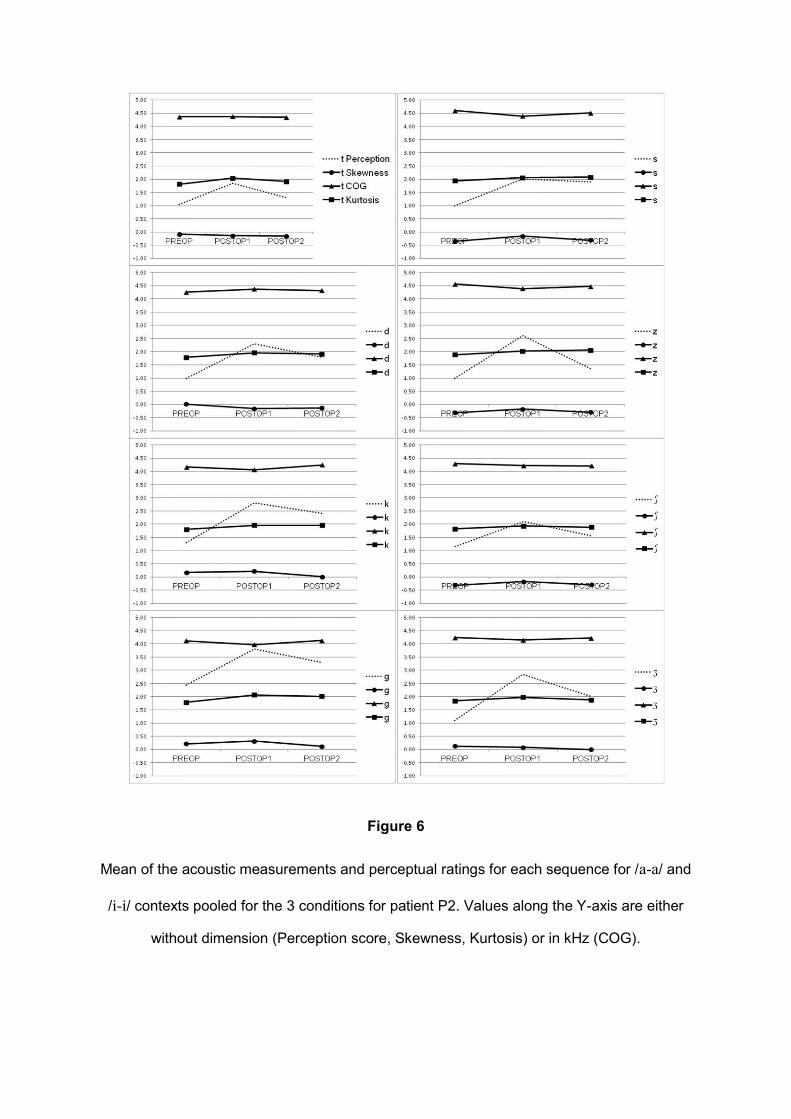
Figure 6
Mean of the acoustic measurements and perceptual ratings for each sequence for /a-a/ and
/i-i/ contexts pooled for the 3 conditions for patient P2. Values along the Y-axis are either
without dimension (Perception score, Skewness, Kurtosis) or in kHz (COG).
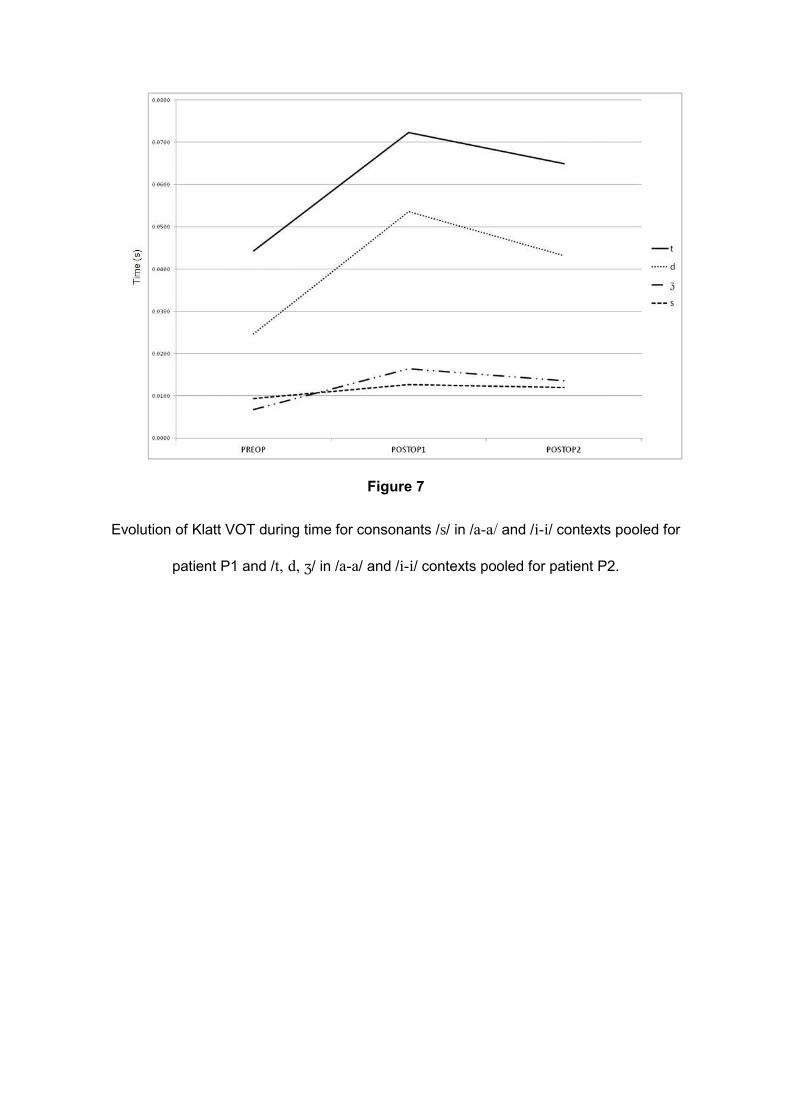
Figure 7
Evolution of Klatt VOT during time for consonants /s/ in /a-a/ and /i-i/ contexts pooled for
patient P1 and /t, d, ʒ/ in /a-a/ and /i-i/ contexts pooled for patient P2.
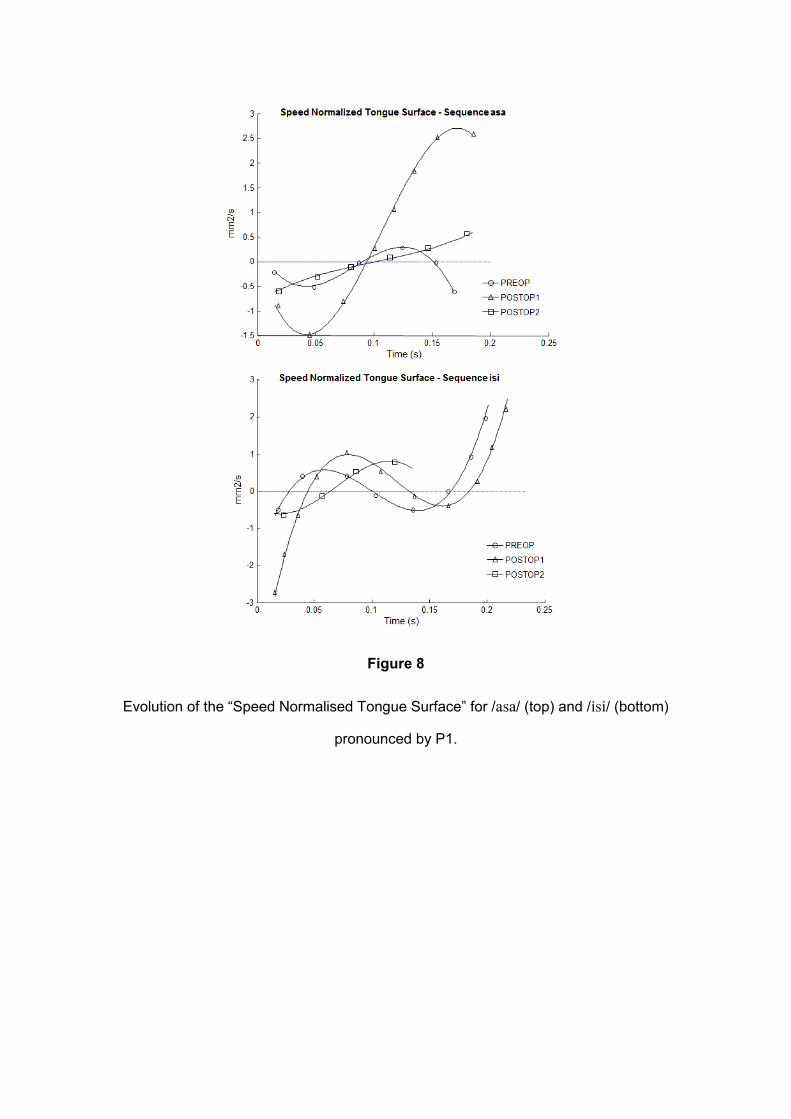
Figure 8
Evolution of the “Speed Normalised Tongue Surface” for /asa/ (top) and /isi/ (bottom)
pronounced by P1.