speech-processing fatigue in children: auditory event ......jslhr research article speech-processing...
TRANSCRIPT

JSLHR
Research Article
aDepartmentWilkerson CeNashville, TNbVanderbilt KNashville, TN
Corresponden
Editor: NancyAssociate Edi
Received FebRevision receAccepted Dechttps://doi.org
Jo2090
Speech-Processing Fatigue in Children:Auditory Event-Related Potential
and Behavioral Measures
Alexandra P. Key,a,b Samantha J. Gustafson,a Lindsey Rentmeester,aBenjamin W. Y. Hornsby,a and Fred H. Bessa
Purpose: Fatigue related to speech processing is anunderstudied area that may have significant negativeeffects, especially in children who spend the majority oftheir school days listening to classroom instruction.Method: This study examined the feasibility of using auditoryP300 responses and behavioral indices (lapses of attentionand self-report) to measure fatigue resulting from sustainedlistening demands in 27 children (M = 9.28 years).Results: Consistent with predictions, increased lapses ofattention, longer reaction times, reduced P300 amplitudes
of Hearing and Speech Sciences, Vanderbilt Billnter, Vanderbilt University School of Medicine,
ennedy Center for Research on Human Development,
ce to Alexandra P. Key: [email protected]
Tye-Murraytor: Suzanne Purdy
ruary 8, 2016ived May 18, 2016ember 5, 2016/10.1044/2016_JSLHR-H-16-0052
urnal of Speech, Language, and Hearing Research • Vol. 60 • 2090–2104
to infrequent target stimuli, and self-report of greaterfatigue were observed after the completion of aseries of demanding listening tasks compared withthe baseline values. The event-related potentialresponses correlated with the behavioral measuresof performance.Conclusion: These findings suggest that neural andbehavioral responses indexing attention and processingresources show promise as effective markers of fatiguein children.
Fatigue is a subjective experience, often defined as amood state, which includes feelings of tiredness,exhaustion, or lack of energy or desire to continue
on a task (Hornsby, Naylor, & Bess, 2016). Fatigue iscommon in our society, and its consequences can be signif-icant and widespread. They frequently include difficultiesin concentration, feelings of anxiety, increased distractibil-ity, and decreases in alertness and mental energy (Boksem& Tops, 2008; Lieberman, 2013). In children, especiallythose with chronic health conditions, fatigue is associatedwith lower life quality, as well as a variety of psycho-educational problems, such as slower educational progress,school absences, limited physical activity, and increasedstress (Berrin et al., 2007; Bess & Hornsby, 2014; Crawley,2014; Hornsby, Werfel, Camarata, & Bess, 2014; McCabe,2009; Stoff, Bacon, & White, 1989). Although the construct
of fatigue in humans has been a topic of scientific interestfor more than 100 years, it remains seldom studied andpoorly understood, particularly in children.
Fatigue resulting from sustained and effortful cogni-tive demands is often associated with slowed informationprocessing and a decreased level of goal-directed attention(Murata, Uetake, & Takasawa, 2005; Uetake & Murata,2000). When people become fatigued, they may report dif-ficulties focusing on the tasks at hand (Bartlett, 1943) anddemonstrate an increase in involuntary shifts of attention(Boksem, Meijman, & Lorist, 2005). In fact, although nota universal finding, decrements in cognitive abilities are com-monly associated with the sustained application of mentaleffort on cognitive tasks and can be used as a marker offatigue (Hornsby et al., 2016). In children, degraded cogni-tive processing abilities would be particularly problematic ina classroom setting, where there is a constant need to focuson the course material and resist distractions.
Increased mental effort can lead to fatigue (VanZomeren, Brouwer, & Deelman, 1984). Adults identifyactivities requiring both mental effort and physical effortas frequent causes of fatigue (Ziino & Ponsford, 2006).Because many classroom environments exhibit higher noiselevels and more reverberation than what is recommendedfor optimal listening (American National Standards Insti-tute, 2010; Sato & Bradley, 2008), active engagement in the
Disclosure: The authors have declared that no competing interests existed at the timeof publication.
• July 2017 • Copyright © 2017 American Speech-Language-Hearing Association

classroom throughout the school day may require substan-tial listening effort and therefore increase risk for fatigue inchildren. Indeed, recent studies demonstrated that both de-graded signal and background noise increase listening effortin school-age children (Howard, Munro, & Plack, 2010;McCreery & Stelmachowicz, 2013). Listening effort refersto the deliberate allocation of attentional and cognitive re-sources toward auditory tasks, such as detecting, decoding,processing, and/or responding to speech or other auditorystimuli (Downs, 1982; Pichora-Fuller et al., 2016). Theexpenditure of these additional cognitive resources requiredto maintain optimal performance with a degraded speechsignal can lead to increased demands on top-down process-ing (Pichora-Fuller, Schneider, & Daneman, 1995). Thereduction in children’s processing abilities due to increasedlistening demands in noisy environments is well documented(Klatte, Hellbrück, Seidel, & Leistner, 2010; Rönnberg, Rudner,Lunner, & Stenfelt, 2014). Although we are unaware of anystudies directly examining the link between sustained effort-ful listening and fatigue in children, adults report greaterfatigue when completing listening-related tasks in envi-ronments with increased background noise (Baselmans,Van Schijndel, & Duisters, 2010).
One of the possible reasons for the paucity of researchon listening fatigue in children is the difficulty of directlyand objectively measuring fatigue because of its subjectiveand temporary nature. Research methods examining fatiguedue to effortful listening in adults have focused primarily onsubjective reports and declines in task performance (Desaiet al., 2012; Hornsby, 2013). In children, self-reports havebeen used (e.g., Pediatric Quality of Life Inventory, Marcuset al., 2009; Varni, Burwinkle, & Szer, 2004) to evaluatephysical and cognitive but not listening-related fatigueand not in conjunction with objective, performance-basedmeasures.
Measures of brain activity, such as event-related po-tentials (ERPs), could provide valuable information aboutthe psychophysiological mechanisms affected by listeningfatigue in children. ERPs are a portion of the ongoing elec-troencephalogram (EEG) that is time-locked to the preciseonset of a stimulus (e.g., speech sound). They reflect thechange in brain activity associated with sensory and higher-order cognitive processing of that stimulus (Wijers, Mulder,Gunter, & Smid, 1996). In addition, many ERP paradigmsdo not require overt behavioral responses by the partici-pant and therefore could be administered to very youngchildren.
Prior ERP studies in adults have examined the ef-fects of cognitive fatigue on attentional processes and iden-tified the centroparietal P300 response, a positive peakoccurring 300–600 ms after stimulus onset, as a promisingcandidate marker (e.g., Murata et al., 2005; Uetake &Murata, 2000). The P300 is most commonly elicited in anoddball paradigm in which a participant is asked to detectrare target stimuli presented among frequent distractors(Polich, 2007). The ERP responses to the target stimuliare expected to have a larger positive peak in the 300- to600-ms range when compared with the ERP responses to
the standard stimuli. The amplitude of the P300 reflectscognitive information processing (or mental workload),and varies with (a) the changes in the perceptual and cog-nitive difficulty of the task (Isreal, Wickens, Chesney, &Donchin, 1980; Ullsperger, Metz, & Gille, 1988), (b) theextent and quality of attention to the stimuli (Overtoomet al., 1998; Strandburg et al., 1996), and (c) the amountof processing resources available (Donchin, Miller, &Farwell, 1986).
In a fatigued state, the amplitude of the P300 responsediminishes, and its latency increases (Murata et al., 2005;Uetake & Murata, 2000). For example, Uetake and Murata(2000) examined a visual P300 response before and afteradults performed a cognitively demanding task (i.e., mentalarithmetic) for 2 hr, resulting in the state of fatigue. Com-pared with the baseline values, a decrease in the P300amplitude and prolongation of the P300 latency were observedimmediately after completion of the fatigue-inducing task.Moreover, the change in the P300 amplitude and latencywas correlated with the change in self-reported ratings ofboth physical and mental fatigue. Similar delays in the la-tency were observed for an auditory P300 response imme-diately after 6 hr of mental arithmetic (Kaseda, Jiang,Kurokawa, Mimori, & Nakamura, 1998). The observedchanges in P300 responses cannot be explained by habitua-tion or greater familiarity with the paradigm, as P300 la-tency values returned to those recorded during the baselinesession after 1 hr of rest (Uetake & Murata, 2000). Thus,the P300 parameters could serve as effective measures of lis-tening-induced fatigue. Although previous fatigue-relatedERP studies focused on adults, P300 responses have alsobeen recorded successfully by using oddball paradigms inchildren (Pearce, Crowell, Tokioka, & Pacheco, 1989;Polich, Ladish, & Burns, 1990).
The purpose of this study was to examine the feasi-bility of using the auditory P300 response and behavioralmeasures (e.g., lapses of attention and self-report) as anindex of listening fatigue in school-age children followinga series of demanding speech processing tasks. To betterapproximate everyday listening situations, we chose topresent the auditory stimuli in the presence of competingbackground noise rather than in quiet conditions. Wehypothesized that when compared with the rested state,children would exhibit increased lapses of attention, pro-longed reaction times, and report greater fatigue after com-pleting these listening tasks and that the auditory P300responses to target stimuli would be characterized by re-duced amplitude and prolonged latency. We also plannedto examine the associations between psychophysiologicaland behavioral measures of fatigue.
MethodThis study was a part of a broader research program
designed to examine the effects of listening effort andfatigue on school-age children with hearing loss (see Bess,Gustafson, & Hornsby, 2014, for an overview). Here, wereport results from a sample of children with normal hearing
Key et al.: Speech-Processing Fatigue 2091

Figure 1. Schematic representation of the test session events.ERP = Event-related potential; PVT = Psychomotor Vigilance Task.
who served as a control group in the larger study. Thisstudy focused on the feasibility of using the auditory P300response, as well as the subjective and objective behavioralmeasures, as indicators of fatigue resulting from the sus-tained speech-processing demands. The study was reviewedand approved by the Vanderbilt University InstitutionalReview Board. All children provided their assent, and par-ents or caregivers provided written informed consent priorto the initiation of any research procedures.
ParticipantsTwenty-seven typically developing children (12 girls,
15 boys), age 6–12.9 years (M = 9.28 years, SD = 2.29),were the final sample. Data for five additional children (allboys, M age = 7.65 years) were not included in the analysisdue to the insufficient number of artifact-free EEG seg-ments in at least one of the two recording sessions. Oneother child (boy, age 6.81 years) was excluded because hedid not complete all of the speech-processing tasks.
Participants had normal hearing as verified by astandard hearing screening at 15 dB HL for octave fre-quencies ranging from 250 to 8000 Hz. All participantshad normal middle ear function verified by tympanometry,as well as unremarkable otoscopic examinations. All chil-dren exhibited average or above-average language abilityas measured by the core language index of the ClinicalEvaluation of Language Fundamentals–Fourth Edition(Semel, Wiig, & Secord, 2003). In addition, participantshad nonverbal intelligence within the average range (Test ofNonverbal Intelligence–Fourth Edition; Brown, Sherbenou,& Johnsen, 2010). Also, all participants were monolingualEnglish speakers.
ProcedureEach child participated in a single 3-hr study visit
(M = 2.97 hr, SD = 0.53 hr), during which he/she com-pleted the baseline ERP and behavioral assessments offatigue, performed three demanding speech-processingtasks that required sustained, effortful listening (speech rec-ognition, dual-task paradigm, and speech vigilance), andthen repeated the assessments of fatigue. Fatigue was eval-uated by using objective (ERP and behavioral performance)and subjective (self-report) measures. Figure 1 shows theorder in which measures of fatigue and speech-processingtasks were completed during each visit.
All study procedures were scheduled on nonschooldays (weekends and school breaks), with comparable num-bers of children completing the visit before or after lunch.There was no significant relationship between the appoint-ment start time and self-reported fatigue (fatigue scale [FS]score; see the following) at baseline, rs = .112, p = .602.
Measures of FatiguePerformance-Based Assessment
The Psychomotor Vigilance Task (PVT; Dinges &Powell, 1985) was used to detect fatigue-related decrements
2092 Journal of Speech, Language, and Hearing Research • Vol. 60 •
in cognitive processing ability. The PVT is a visual-motorreaction time task that requires sustained visual attentionfor optimum performance. Several measures derived fromPVT performance (i.e., lapses in attention and responsespeed) are highly sensitive to variations in fatigue (Lieberman,2013; Lim & Dinges, 2008). The task requires the partici-pant, seated at a desk approximately 20 in. in front of a wide-screen 22-in. computer monitor, to attend to a small (4.5 ×19 cm), gray, rectangular box in the center of the black screen.On occasion and without warning, a millisecond counter ap-pears in the box. The participant is asked to stop the counteras quickly as possible by pressing a keyboard button, thusproviding a measure of visual reaction time (Lim & Dinges,2008). Children in this study completed an abbreviated ver-sion of the PVT that included 50 trials over 5 min. The inter-trial interval varied randomly over the range of 1.4 to 5.4 s.
The PVT was administered in a quiet, sound-treatedbooth prior to and directly following the speech-processingtasks (see Figure 1). All children completed a 1-min-longpractice session prior to the first administration of thePVT. In addition, three full sessions (5 min each) were alsocompleted and occurred before, midway through, and afterfinishing all speech-processing tasks. For this study, onlydata from the initial and final PVT sessions were used inthe analyses. Fatigue effects were quantified as changes inthe child’s median response time and the number of lapsesin attention (reaction time greater than 500 ms; Lim &Dinges, 2008) between PVT administrations occurringbefore and after the speech-processing tasks.
Self-ReportA 5-item FS questionnaire addressing current level
of fatigue was developed for the purpose of this study.The questions were selected on the basis of feedback andsurveys completed by adults with hearing loss, as well asby parents and teachers of children with hearing loss whoare familiar with the behavioral signs and typical complaintsassociated with listening fatigue. The questions and state-ments were then refined to ensure that the vocabulary, lan-guage, and concepts would be age appropriate for school-agechildren. Each fatigue-related statement (i.e., “I feel tired”;“It is easy for me to do these things”; “My head hurts”;
2090–2104 • July 2017
“It’s hard for me to pay attention”; and “I have troublethinking”) was evaluated by using a 5-point Likert responseset, ranging from 0 = not at all to 4 = a lot. A mean fatiguescore was calculated by averaging responses across the fiveitems, with question two being scored in reverse (0 = a lotto 4 = not at all). Similar to the scoring procedures of otherfatigue questionnaires (e.g., Pediatric Quality of Life Inven-tory; Varni et al., 2004), raw scores for each item werelinearly transformed to a 0–100 scale as follows: 0 = 100,1 = 75, 2 = 50, 3 = 25, 4 = 0. Lower total scores indicatedgreater perceived fatigue. Cronbach’s α estimate of reliabil-ity was 0.78, suggesting that the total scores could be usedto examine change over time. Children completed the ques-tionnaire six times during the course of the study visit. Forthe purpose of the current analysis, the fatigue ratingsobtained immediately prior to each of the ERP sessionswere used.
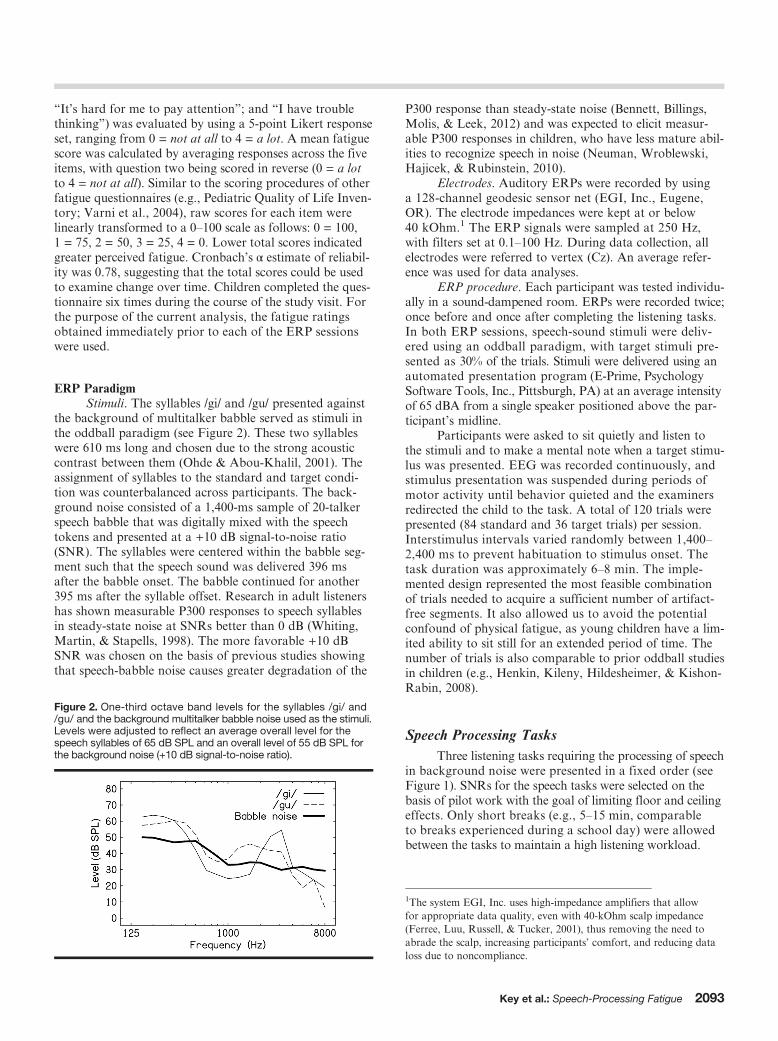
ERP ParadigmStimuli. The syllables /gi/ and /gu/ presented against
the background of multitalker babble served as stimuli inthe oddball paradigm (see Figure 2). These two syllableswere 610 ms long and chosen due to the strong acousticcontrast between them (Ohde & Abou-Khalil, 2001). Theassignment of syllables to the standard and target condi-tion was counterbalanced across participants. The back-ground noise consisted of a 1,400-ms sample of 20-talkerspeech babble that was digitally mixed with the speechtokens and presented at a +10 dB signal-to-noise ratio(SNR). The syllables were centered within the babble seg-ment such that the speech sound was delivered 396 msafter the babble onset. The babble continued for another395 ms after the syllable offset. Research in adult listenershas shown measurable P300 responses to speech syllablesin steady-state noise at SNRs better than 0 dB (Whiting,Martin, & Stapells, 1998). The more favorable +10 dBSNR was chosen on the basis of previous studies showingthat speech-babble noise causes greater degradation of the
Figure 2. One-third octave band levels for the syllables /gi/ and/gu/ and the background multitalker babble noise used as the stimuli.Levels were adjusted to reflect an average overall level for thespeech syllables of 65 dB SPL and an overall level of 55 dB SPL forthe background noise (+10 dB signal-to-noise ratio).
P300 response than steady-state noise (Bennett, Billings,Molis, & Leek, 2012) and was expected to elicit measur-able P300 responses in children, who have less mature abil-ities to recognize speech in noise (Neuman, Wroblewski,Hajicek, & Rubinstein, 2010).
Electrodes. Auditory ERPs were recorded by usinga 128-channel geodesic sensor net (EGI, Inc., Eugene,OR). The electrode impedances were kept at or below40 kOhm.1 The ERP signals were sampled at 250 Hz,with filters set at 0.1–100 Hz. During data collection, allelectrodes were referred to vertex (Cz). An average refer-ence was used for data analyses.
ERP procedure. Each participant was tested individu-ally in a sound-dampened room. ERPs were recorded twice;once before and once after completing the listening tasks.In both ERP sessions, speech-sound stimuli were deliv-ered using an oddball paradigm, with target stimuli pre-sented as 30% of the trials. Stimuli were delivered using anautomated presentation program (E-Prime, PsychologySoftware Tools, Inc., Pittsburgh, PA) at an average intensityof 65 dBA from a single speaker positioned above the par-ticipant’s midline.
Participants were asked to sit quietly and listen tothe stimuli and to make a mental note when a target stimu-lus was presented. EEG was recorded continuously, andstimulus presentation was suspended during periods ofmotor activity until behavior quieted and the examinersredirected the child to the task. A total of 120 trials werepresented (84 standard and 36 target trials) per session.Interstimulus intervals varied randomly between 1,400–2,400 ms to prevent habituation to stimulus onset. Thetask duration was approximately 6–8 min. The imple-mented design represented the most feasible combinationof trials needed to acquire a sufficient number of artifact-free segments. It also allowed us to avoid the potentialconfound of physical fatigue, as young children have a lim-ited ability to sit still for an extended period of time. Thenumber of trials is also comparable to prior oddball studiesin children (e.g., Henkin, Kileny, Hildesheimer, & Kishon-Rabin, 2008).
Speech Processing TasksThree listening tasks requiring the processing of speech
in background noise were presented in a fixed order (seeFigure 1). SNRs for the speech tasks were selected on thebasis of pilot work with the goal of limiting floor and ceilingeffects. Only short breaks (e.g., 5–15 min, comparableto breaks experienced during a school day) were allowedbetween the tasks to maintain a high listening workload.
1The system EGI, Inc. uses high-impedance amplifiers that allowfor appropriate data quality, even with 40-kOhm scalp impedance(Ferree, Luu, Russell, & Tucker, 2001), thus removing the need toabrade the scalp, increasing participants’ comfort, and reducing dataloss due to noncompliance.
Key et al.: Speech-Processing Fatigue 2093
Speech RecognitionWord recognition was assessed by using stimuli from
the Coordinate Response Measure (CRM; Bolia, Nelson,Ericson, & Simpson, 2000) presented in a backgroundnoise of cafeteria babble. The version of the CRM used inthis study did not contain the carrier phrase “Ready.” Inaddition, we used Adobe Audition Version 3.0 (Adobe Sys-tems, Inc., San Jose, CA) to remove the ending word “now”from each CRM message. This reduced time variations be-tween the offset of one CRM message and the onset of thenext message. Thus, all CRM messages had the same struc-ture: [Call sign] go to [color] [number], for example, “Eaglego to blue four.” Testing was conducted in a sound-treatedbooth. The speech and noise were presented from a singleloudspeaker located at ear level and positioned 1 m directlyin front of the child. The speech and noise were presentedat 60 dBA resulting in a 0 dB SNR. Children listened to32 randomly selected CRM messages spoken by a singlemale talker and then selected a call sign, color, and num-ber from a closed set of options presented on a computerscreen. The task was approximately 3 min long.
Dual-Task ParadigmDual-task paradigms have been used previously to
index listening effort in children (Hicks & Tharpe, 2002;McFadden & Pittman, 2008). These paradigms rely on theassumption that because cognitive resources are limited(Kahneman, 1973), an increase in the cognitive demandsof one task leaves fewer resources available for any otherongoing tasks. Thus, the dual-task paradigm consisted ofa primary task presumed to use the majority of mentalcapacity and a secondary task requiring little mental capac-ity. When the difficulty of the primary task is increased,there may be a shift in resource allocation from the second-ary (less important) task to the primary (more important)task, causing a reduction in performance on the secondarytask. Such changes in performance are interpreted to reflectan increase in effort allocated to the primary task. The dual-task paradigm used in this study required children to listento and repeat monosyllabic words presented in noise (pri-mary task) while monitoring a computer screen for thepresence of a brief (125 ms) visual target (24 × 18 cm whiterectangle on a 22-in. gray screen), which required a button-pressing response (secondary task).
Testing was conducted in a reverberation chamber(5.9 × 5.1 × 2.5 m) modified with acoustic blankets tocreate a moderately reverberant condition (average rever-beration time [RT60] of approximately 450 ms). Twentyisophonemic lists of 10 consonant–vowel–consonant wordswere used as test stimuli (Mackersie, Boothroyd, & Minniear,2001) presented from a single loudspeaker located at earlevel and positioned 1.5 m directly in front of the child. Thebackground noise consisted of uncorrelated segments ofmultitalker babble presented from four loudspeakers locatedaround the listener (45°, 135°, 225°, and 315°). The level ofeach background-noise loudspeaker was adjusted to presentan overall noise level of 56 dBA. The level of the speechwas adjusted by the examiner to create three SNRs (−4, 0,
2094 Journal of Speech, Language, and Hearing Research • Vol. 60 •
and +4 dB), resulting in a systematic variation in taskdifficulty.
Following a brief practice (one 10-word list) to intro-duce each task, children completed the primary and second-ary tasks separately. The primary task involved repeatingback the isophonemic words and ignoring the visual tar-gets. A total of nine 10-word lists (90 words total) werepresented (three lists for each SNR) over 15 min. The sec-ondary task required participants to ignore the speech andnoise, remain vigilant for the visual target, and press abutton as quickly as possible when the target appeared onthe computer monitor. Seventy-two visual targets (24 ineach SNR) were randomly presented over approximately10 min.
For the dual task, children had to repeat the wordsin noise, while simultaneously remaining vigilant for thevisual target. When present, the targets could occur before,during, or after the word, with no more than two targetspresented within a single, primary task trial. Nine addi-tional word lists and 108 visual targets (36 in each SNR)were presented in the dual-task condition (15 min). Forthe primary and dual-task conditions, word list order washeld constant, and SNR was counterbalanced across partici-pants to reduce order effects.
Speech Vigilance TaskThis task was patterned after classic vigilance tasks
(e.g., Dinges & Powell, 1985) and required children to lis-ten attentively for an auditory target (a specific CRMnumber), while ignoring irrelevant stimuli (all other num-bers). One hundred twenty, randomly selected, CRM mes-sages were presented in a cafeteria babble (same as theCRM recognition task) every few seconds at a random,variable rate (1–7 s) for a total of 13–15 min. Childrenwere instructed to monitor the messages for a target num-ber identified visually on the computer screen (e.g., “Listenfor the number: 4”). When they heard the target number,they were instructed to select a STOP icon on the com-puter screen and then select the call sign and color fromthe target sentence. Thirty percent of the CRM messages(36 of the 120 messages) contained the target number andthus required a response. The target number changed atrandom intervals during the session. This task was meantto require sustained attention and to be mentally demand-ing. Testing was completed in the same sound-treatedroom used for the CRM recognition task and at the samespeech and noise levels (0 dB SNR).
Data AnalysisPerformance-Based and Subjective Measures of Fatigue
To test the prediction of increased fatigue followingcompletion of the speech-processing tasks, paired-samplest tests were conducted to examine differences in medianresponse times (RTs) and lapses in attention during thePVT task obtained before and after the fatigue-inducingspeech-processing tasks. Due to the ordinal nature of theFS data, the nonparametric Wilcoxon signed-ranks test
2090–2104 • July 2017

was used to assess changes in FS scores following the speech-processing tasks. Effect sizes are reported in Cohen’s d orSpearman rank order correlation.
To examine whether subjective ratings of fatigueusing the FS were related to performance on objective be-havioral assessments of fatigue (PVT), a nonparametriccorrelational approach (Spearman rho) was used. Associa-tions between objective behavioral measures and self-reportedfatigue were examined before and after speech-processingtask time points.
In addition, to examine if the relation between objec-tive and subjective measures persisted when consideringchanges in fatigue caused by the listening tasks, we cal-culated a difference score by using response times andlapses in attention between PVT1 and PVT2 and totalscores from FS1 and FS2. A Bonferroni-adjusted α levelof 0.025 was used to evaluate the significance of thesecorrelations.
ERP dataThe EEG data were filtered offline by using a 30-Hz
lowpass filter. Individual ERPs were derived by segment-ing the ongoing EEG on stimulus onset to include a 496-mspresyllable interval (including the 100-ms prebabble base-line) and an 800-ms postsyllable period. To avoid biasingthe results due to a largely uneven number of standard anddeviant trials presented in an oddball paradigm (Thomas,Grice, Najm-Briscoe, & Williams Miller, 2004), only thestandard trials preceding a deviant stimulus were selectedfor the analysis. All trials contaminated by ocular andmovement artifacts were excluded from further analysisby using an automated screening algorithm in NetStation(Electrical Geodesics, Inc., Eugene, OR), followed by amanual review. The automated screening criteria were setas follows: for the eye channels, voltage in excess of 140 μVwas interpreted as an eye blink, and voltage above 55 μVwas considered to reflect eye movements. Any channelwith voltage exceeding 200 μV was marked as bad. Datafor electrodes with poor signal quality within a trial werereconstructed by using spherical spline interpolation proce-dures. If more than 20% of the electrodes within a trial weredeemed bad, the entire trial was discarded. For a data setto be included in the statistical analyses, individual con-dition averages were based on at least 10 trials. The num-ber of trials retained per condition was comparable acrossgroups and test sessions (before speech-processing tasks:M standard = 15.10, SD = 5.26, M target = 15.1, SD = 6.09;after speech-processing tasks: M standard = 14.00, SD = 4.86,M target = 14.50, SD = 5.04; ps >.36).
Following artifact screening, individual ERPs wereaveraged, re-referenced to an average reference, andbaseline corrected by subtracting the average microvoltvalue across the 100-ms prestimulus interval from thepoststimulus segment. To reduce the number of variablesin the analysis, only data from frontal (Fz), central (Cz),and parietal (Pz) midline electrodes were used in the remain-ing statistical analyses. These locations were selected apriori and reflected scalp regions commonly identified as
relevant to P300 topography in previous oddball studies(see Polich, 2007, for review). To capitalize on the rich dataset allowed by the 128-channel electrode net, we averageddata within electrode clusters corresponding to the Fz, Cz,and Pz locations of the International 10–20 System (seeFigure 3), which provided more reliable data comparedwith that from a single scalp location. Inclusion of the Fzlocation allowed us to differentiate the centroparietal P300indexing voluntary attention to targets from the moreanterior P3a response, reflecting involuntary orienting tounexpected events (Polich, 2007).
Next, mean ERP amplitudes relative to the prebab-ble noise baseline were calculated for the P300 in the stan-dard and target conditions across the 300- to 500-ms window.We selected the mean amplitude metric because it is lesssensitive to high-frequency noise than maximum peakamplitude, can tolerate the peak maximum falling outsideof the analyzed window for some participants, and does notbecome biased when comparing individual means on thebasis of different number of trials (Luck, 2005). Because theP300 response was broad (sustained over time) and did notinclude a single, well-defined maximum, peak latencymeasures were not included in the analyses. To capture pos-sible latency shifts due to fatigue or the presence of babblenoise, mean ERP amplitudes were also calculated for theP300 across the 500- to 800-ms window. The specific timeintervals were selected a priori on the basis of temporalwindows used in previously published ERP studies of audi-tory target detection (e.g., Määttä, Pääkkönen, Saavalainen,& Partanen, 2005; Oades, Dittman-Balcar, & Zerbin, 1997)and confirmed by visual inspection of the grand-averagedwaveforms. The resulting mean amplitude values wereaveraged across the electrodes within the preselectedelectrode clusters (Fz, Cz, Pz) and entered into separaterepeated measures analyses of variance (ANOVAs; onefor each time window) with Gender (2) as the between-participant factor and Time (2: prespeech- and postspeech-processing tasks) × Stimulus (2: standard, target) × ElectrodeCluster (3: Fz, Cz, Pz) within-participant factors withHuynh–Feldt correction. Significant interactions werefurther explored by using planned comparisons and posthoc pairwise t tests with Bonferroni correction. These anal-yses focused only on contrasts relevant to the hypotheses,such as differences between standard and target responseswithin a session and changes in responses across the twotest sessions.
In addition, mean amplitudes of P1, N1, and P2 re-sponses to the initial babble onset were measured withinthe intervals of 50 to 100 ms, 80 to 180 ms, and 180 to 300ms, respectively. These windows were determined on thebasis of the visual inspection of the grand-averaged wave-forms and consistent with the intervals used in prior ERPstudies of auditory processing in children and adults.These auditory ERP responses were examined for frontaland central electrode clusters by using repeated measuresANOVAs as described previously for the purpose of ex-ploring any fatigue-related changes in the early perceptualprocessing of auditory input.
Key et al.: Speech-Processing Fatigue 2095
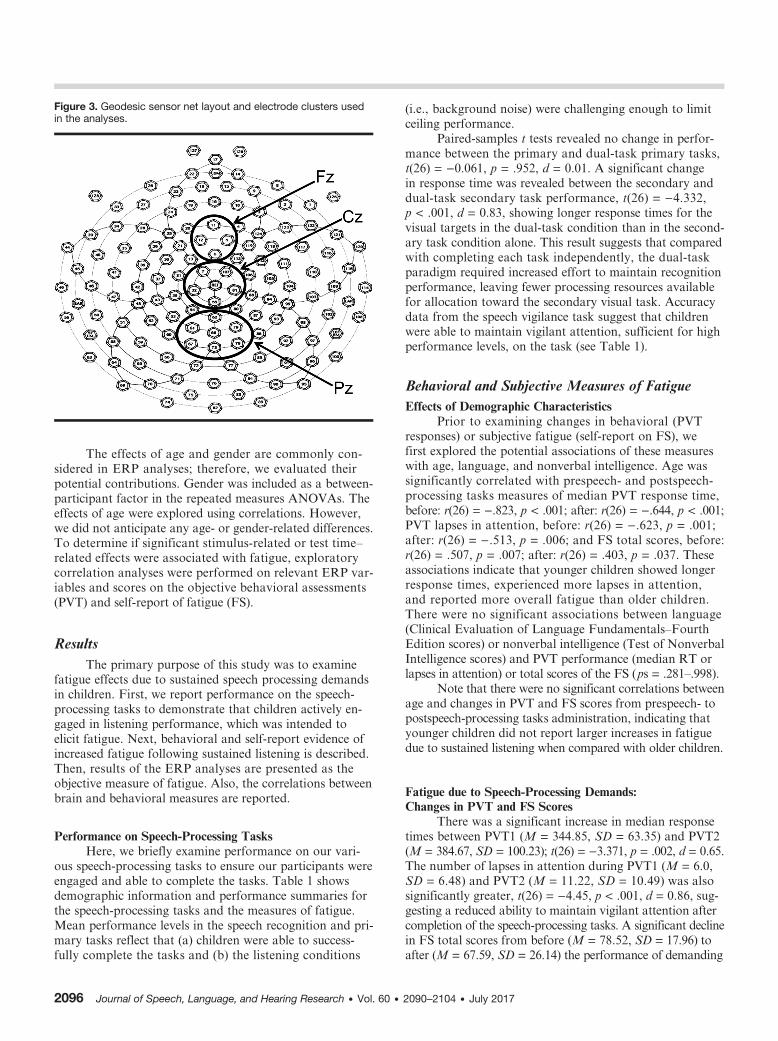
Figure 3. Geodesic sensor net layout and electrode clusters usedin the analyses.
The effects of age and gender are commonly con-sidered in ERP analyses; therefore, we evaluated theirpotential contributions. Gender was included as a between-participant factor in the repeated measures ANOVAs. Theeffects of age were explored using correlations. However,we did not anticipate any age- or gender-related differences.To determine if significant stimulus-related or test time–related effects were associated with fatigue, exploratorycorrelation analyses were performed on relevant ERP var-iables and scores on the objective behavioral assessments(PVT) and self-report of fatigue (FS).
ResultsThe primary purpose of this study was to examine
fatigue effects due to sustained speech processing demandsin children. First, we report performance on the speech-processing tasks to demonstrate that children actively en-gaged in listening performance, which was intended toelicit fatigue. Next, behavioral and self-report evidence ofincreased fatigue following sustained listening is described.Then, results of the ERP analyses are presented as theobjective measure of fatigue. Also, the correlations betweenbrain and behavioral measures are reported.
Performance on Speech-Processing TasksHere, we briefly examine performance on our vari-
ous speech-processing tasks to ensure our participants wereengaged and able to complete the tasks. Table 1 showsdemographic information and performance summaries forthe speech-processing tasks and the measures of fatigue.Mean performance levels in the speech recognition and pri-mary tasks reflect that (a) children were able to success-fully complete the tasks and (b) the listening conditions
2096 Journal of Speech, Language, and Hearing Research • Vol. 60 •
(i.e., background noise) were challenging enough to limitceiling performance.
Paired-samples t tests revealed no change in perfor-mance between the primary and dual-task primary tasks,t(26) = −0.061, p = .952, d = 0.01. A significant changein response time was revealed between the secondary anddual-task secondary task performance, t(26) = −4.332,p < .001, d = 0.83, showing longer response times for thevisual targets in the dual-task condition than in the second-ary task condition alone. This result suggests that comparedwith completing each task independently, the dual-taskparadigm required increased effort to maintain recognitionperformance, leaving fewer processing resources availablefor allocation toward the secondary visual task. Accuracydata from the speech vigilance task suggest that childrenwere able to maintain vigilant attention, sufficient for highperformance levels, on the task (see Table 1).
Behavioral and Subjective Measures of FatigueEffects of Demographic Characteristics
Prior to examining changes in behavioral (PVTresponses) or subjective fatigue (self-report on FS), wefirst explored the potential associations of these measureswith age, language, and nonverbal intelligence. Age wassignificantly correlated with prespeech- and postspeech-processing tasks measures of median PVT response time,before: r(26) = −.823, p < .001; after: r(26) = −.644, p < .001;PVT lapses in attention, before: r(26) = −.623, p = .001;after: r(26) = −.513, p = .006; and FS total scores, before:r(26) = .507, p = .007; after: r(26) = .403, p = .037. Theseassociations indicate that younger children showed longerresponse times, experienced more lapses in attention,and reported more overall fatigue than older children.There were no significant associations between language(Clinical Evaluation of Language Fundamentals–FourthEdition scores) or nonverbal intelligence (Test of NonverbalIntelligence scores) and PVT performance (median RT orlapses in attention) or total scores of the FS (ps = .281–.998).
Note that there were no significant correlations betweenage and changes in PVT and FS scores from prespeech- topostspeech-processing tasks administration, indicating thatyounger children did not report larger increases in fatiguedue to sustained listening when compared with older children.
Fatigue due to Speech-Processing Demands:Changes in PVT and FS Scores
There was a significant increase in median responsetimes between PVT1 (M = 344.85, SD = 63.35) and PVT2(M = 384.67, SD = 100.23); t(26) = −3.371, p = .002, d = 0.65.The number of lapses in attention during PVT1 (M = 6.0,SD = 6.48) and PVT2 (M = 11.22, SD = 10.49) was alsosignificantly greater, t(26) = −4.45, p < .001, d = 0.86, sug-gesting a reduced ability to maintain vigilant attention aftercompletion of the speech-processing tasks. A significant declinein FS total scores from before (M = 78.52, SD = 17.96) toafter (M = 67.59, SD = 26.14) the performance of demanding
2090–2104 • July 2017

Table 1. Mean (1 SD) of demographic information and performance on speech-processing tasks andmeasures of fatigue.
Parameter Value
DemographicsAge (years) 9.33 (2.26)Boys/girls count 15/12Laterality quotient 0.90 (0.33)TONI standard score 110.07 (9.42)CELF core standard score 109.89 (10.35)
Speech-processing tasksCRM recognition performance (percent correct) 84.14 (9.29)Primary task performance (percent correct) 61.44 (12.82)Secondary task median response time (ms) 820.81 (153.11)Dual-task primary task performance (percent correct) 61.52 (11.71)Dual-task secondary task median response time (ms) 902.44 (169.18)Vigilance performance (percent correct) 94.30 (5.83)
Measures of fatigue Before AfterFatigue scale total score 78.52 (17.96) 67.59 (26.14)PVT median response time (ms) 344.65 (63.26) 384.56 (100.25)PVT lapses in attention (count) 6.00 (6.47) 11.22 (10.49)
Note. Laterality quotient tested by the Edinburgh Handedness Inventory by Oldfield (1971). TONI = Testof Nonverbal Intelligence; CELF = Clinical Evaluation of Language Fundamentals–Fourth Edition; CRM =Coordinate Response Measure; PVT = Psychomotor Vigilance Task.
Table 2. Average mean amplitudes and standard deviation valuesfor the event-related potential peaks included in the analyses.
Parameter
Session 1 Session 2
Standard Target Standard Target
M SD M SD M SD M SD
P1, 50–100 msFz 2.82 2.11 2.45 1.90 2.06 1.62 2.89 2.62Cz 2.07 1.66 1.06 1.51 1.23 1.08 1.46 1.56Pz 0.97 1.20 1.03 1.92 0.87 1.82 0.52 1.98
N1, 80–180 msFz 0.03 1.52 −0.48 2.12 −0.59 1.43 −0.22 2.18Cz −0.71 1.40 −1.53 1.80 −1.07 1.23 −1.26 1.54Pz −2.81 1.31 −2.98 1.96 −3.21 1.96 −3.85 2.76
P2, 180–300 msFz 5.43 3.00 5.37 3.12 4.46 2.89 5.48 2.82Cz 4.73 2.63 4.23 1.68 4.89 2.80 4.58 1.95Pz 2.30 2.10 2.59 1.98 2.06 2.67 2.40 1.81
P300, 300–500 msFz −1.44 2.20 −2.54 2.13 −1.86 2.55 −0.88 2.36Cz −1.10 1.96 −1.67 2.33 −0.71 1.81 −1.25 2.64Pz 0.67 2.01 1.67 2.73 0.24 2.16 −0.28 2.92
P300-2, 500–800 msFz −0.09 2.08 −1.60 2.11 −0.89 2.62 −0.46 2.37Cz 0.24 1.46 −0.80 2.07 −0.28 1.70 −0.69 2.01Pz 0.87 2.09 1.85 2.67 −0.24 1.97 0.01 2.86
Note. M = mean; SD = standard deviation.
listening tasks was also observed, Z = 2.73, p = .006, r = .37,reflecting an increased subjective experience of fatigue.
Relation Between Behavioral (PVT Responses)and Subjective Measures of Fatigue
When controlling for the significant effect of age,partial correlation analyses on prespeech- and postspeech-processing tasks performance showed significant associa-tions between FS total scores and median PVT responsetimes, before: r(24) = −.517, p = .007; after: r(24) = −.585,p = .002, and lapses in attention, before: r(24) = −.500,p = .009; after: r(24) = −.702, p < .001. These moderate-to-strong negative associations suggest that children whoreported more fatigue also showed longer response timesand more lapses in attention both before and after complet-ing a series of speech-processing tasks.
When considering the magnitude of change fromprespeech- to postspeech-processing tasks performance,a moderate negative correlation between change in self-reported fatigue and increases in lapses in attention wasalso observed, rs (26) = −.498, p = .008, indicating thatlarger increases in reported fatigue were associated withmore instances of inattention following the demandingspeech-processing tasks. In a similar way, a moderate,negative correlation was observed for changes in medianresponse times, but this association did not reach statisti-cal significance, rs (26) = −.370, p = .057.
ERP ResultsP1, N1, and P2 Responses
Average mean amplitudes and standard deviationvalues for the ERP peaks included in the analyses areshown in Table 2. There were no significant main effects
or interactions involving Time, Stimulus, or Gender factorsfor any of the analyzed time windows. Amplitude of theseERP responses did not correlate with age.
P300 ResponsePrior to the completion of the speech-processing
tasks, 21 of 27 children had a visually detectable parietal
Key et al.: Speech-Processing Fatigue 2097

P300 response with more positive amplitudes for targetthan standard stimuli. The subgroups of children with andwithout the P300 response were not significantly differenton any of the behavioral measures. At the posttest, 13 of27 children had a visually detectable parietal P300 response.Eight of 14 children with no visible parietal P300 responseat posttest showed a frontal P3a response, suggesting achange in auditory attention processes. There were no sig-nificant correlations between age and the amplitude of theP300 response in either of the two time windows includedin the statistical analyses.
300–500 ms. There was a main effect of electrodecluster, F(2, 50) = 15.651, p < .001, ηp
2 = .385, as well asthe interactions of Time × Electrode Cluster, F(2, 50) =6.325, p =.008, ηp
2 = .202, and Time × Stimulus × ElectrodeCluster, F(2, 50) = 5.991, p = .008, ηp
2 = .193. Follow-upanalyses (critical p = .017) indicated that P300 responses hadthe expected scalp distribution with the largest amplitudesobserved at the parietal cluster compared with central,t(26) = 5.161, p < .001, d = 0.99, and frontal locations,t(26) = 4.155, p < .001, d = 0.80. No significant amplitudedifferences were observed between central and frontal sites(p = .125). Furthermore, this topographic distributionpattern was present prior to the performance of speech-processing tasks, Pz versus Cz: t(26) = 7.446, p < .001,d = 1.43; Pz versus Fz: t(26) = 5.343, p < .001, d = 1.03;Fz versus Cz: ns, p = .124), but not for the data recordedafter completing the speech-processing tasks (p = .046–.325).
Planned comparisons focused on the stimulus-specificresponses indicated that at pretest, targets elicited largerP300 responses than standards at Pz, t(26) = 2.335, p = .028,d = 0.45 (see Figure 4), and smaller amplitudes at Fz, t(26) =2.090, p = .047, d = 0.40. Stimulus differences were notsignificant at Cz (p = .158). During the posttest session, therewere no significant stimulus differences at any of the elec-trode clusters (p = .108–.384).
Post hoc analyses (critical p = .013) further revealedthat the lack of posttest stimulus differences was due tothe reduction in the parietal P300 amplitude for targets,Pz: t(26) = 2.941, p = .007, d = 0.57, while responses to thestandard stimulus were not significantly different across testsessions (p = .393). This difference between pretest and post-test for target stimuli but not standard stimuli at the parietallocation is highlighted in Figure 5. There was also an increasein the target P300 amplitude at frontal sites, t(26) = 2.767,p = .010, d = 0.53, during the posttest, with no correspond-ing changes in the response to standards (p = .438).
500–800 ms. There were main effects of time, F(1, 25) =4.482, p = .044, ηp
2 = .152, and electrode cluster, F(2, 50) =5.529, p = .018, ηp
2 = .181, as well as the interactions ofTime × Electrode Cluster, F(2, 50) = 5.616, p = .015,ηp
2 = .183, Time × Electrode Cluster × Gender, F(2, 50) =4.756, p = .026, ηp
2 = .160. There were no significantstimulus-related effects.
Follow-up analyses (critical p = .017) indicated thatwithin the 500- to 800-ms window, the largest ERP amplitudescontinued to be observed at the parietal cluster comparedwith central, t(26) = 3.202, p = .004, d = 0.62, and frontal
2098 Journal of Speech, Language, and Hearing Research • Vol. 60 •
locations, t(26) = 2.512, p = .019, d = 0.48. No significantamplitude differences were observed between central andfrontal sites (p = .254). Furthermore, this topographicdistribution pattern was present before the children com-pleted the speech-processing tasks, Pz versus Cz: t(26) =5.029, p < .001, d = 0.97; Pz versus Fz: t(26) = 3.586,p = .001, d = 0.69; Fz versus Cz: ns, p = .140, but notfor the postspeech-processing recording (p = .374–.624).Only the parietal response showed a change across ses-sions with smaller overall amplitudes recorded at the post-test compared with the pretest, t(26) = 3.242, p = .003,d = 0.62.
Although there were no significant amplitude dif-ferences between male and female participants at anyelectrode cluster or test session, post hoc analyses (criti-cal p = .008) revealed that only boys demonstrated thepattern of greater parietal positivity at pretest, Pz ver-sus Fz: t(14) = 3.432, p = .004, d = 0.89; Pz versus Cz:t(14) = 4.937, p < .001, d = 1.28, and no significant topo-graphic differences at the posttest. They did evidencea reduction in the parietal amplitude at posttest, t(14) =3.346, p = .005, d = 0.86. There were no significant dif-ferences in the topography or pre- versus posttest ampli-tudes in females (ps = .043–.978).
Brain–Behavior CorrelationsTo determine if significant stimulus-related and test
time–related ERP effects were related to behavioral and/or subjective measures of fatigue, as well as to demographiccharacteristics of the participants, brain–behavior correla-tions were examined for the 300- to 500-ms window becauseit was the only interval sensitive to stimulus-related dif-ferences. There were no significant correlations betweenparietal P300 responses and age, handedness, nonverbalintelligence, or language skills in either of the recordingsessions (ps = .069–.957). We then examined associationsbetween the subjective (FS) and behavioral (PVT) fatiguemeasures and the neural measure of cognitive processing(parietal P300 responses). Pretest measures and posttestmeasures were examined separately. Parietal P300 responsesdid not correlate with the performance on PVT or the totalscore on the fatigue self-report measures at pretest, likelydue to the limited range of the behavioral scores prior tocompletion of the speech tasks. At posttest, significant nega-tive correlations were observed between the amplitude ofthe target P300 and the performance on the PVT task, me-dian RT r(25) = −.501, p = .008; lapses of attention r(25) =−.411, p = .033, indicating that lower ERP amplitude (re-duced target detection) was associated with slower RTsand a greater number of inattention instances. There wereno significant correlations between ERPs and the totalscores on the FS, rs (25) = .267, p = .177.
Next, we examined associations between changes insubjective and behavioral fatigue and changes in cognitiveprocessing efficiency as measured by pre- and postchangesin the P300 responses. The change in target P300 amplitudefrom prespeech- to postspeech-processing task sessions
2090–2104 • July 2017
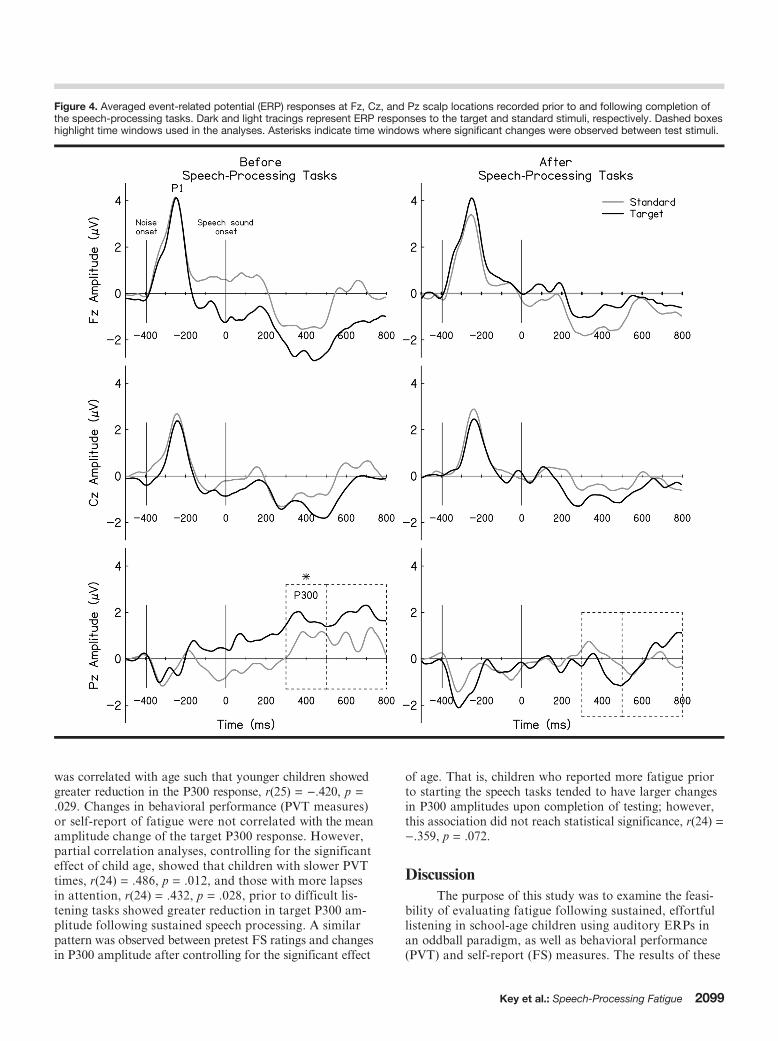
Figure 4. Averaged event-related potential (ERP) responses at Fz, Cz, and Pz scalp locations recorded prior to and following completion ofthe speech-processing tasks. Dark and light tracings represent ERP responses to the target and standard stimuli, respectively. Dashed boxeshighlight time windows used in the analyses. Asterisks indicate time windows where significant changes were observed between test stimuli.
was correlated with age such that younger children showedgreater reduction in the P300 response, r(25) = −.420, p =.029. Changes in behavioral performance (PVT measures)or self-report of fatigue were not correlated with the meanamplitude change of the target P300 response. However,partial correlation analyses, controlling for the significanteffect of child age, showed that children with slower PVTtimes, r(24) = .486, p = .012, and those with more lapsesin attention, r(24) = .432, p = .028, prior to difficult lis-tening tasks showed greater reduction in target P300 am-plitude following sustained speech processing. A similarpattern was observed between pretest FS ratings and changesin P300 amplitude after controlling for the significant effect
of age. That is, children who reported more fatigue priorto starting the speech tasks tended to have larger changesin P300 amplitudes upon completion of testing; however,this association did not reach statistical significance, r(24) =−.359, p = .072.
DiscussionThe purpose of this study was to examine the feasi-
bility of evaluating fatigue following sustained, effortfullistening in school-age children using auditory ERPs inan oddball paradigm, as well as behavioral performance(PVT) and self-report (FS) measures. The results of these
Key et al.: Speech-Processing Fatigue 2099

Figure 5. Averaged event-related potential (ERP) responses at the Pz scalp location recorded before and after completing the listening tasksto the standard (left panel) and target stimuli (right panel). Dark and light tracings represent ERP responses to the prespeech- and postspeech-processing tasks, respectively. Dashed boxes highlight P300 time windows used in the analyses. Asterisks indicate time windows in whichsignificant changes were observed across test sessions.
objective and subjective assessments were consistent withthe predictions: in addition to greater self-reports of fatigue,we observed prolonged reaction times and increased lapsesof attention on the PVT, as well as a reduction in theamplitude of the parietal P300 response to targets follow-ing completion of a series of demanding speech-processingtasks. Furthermore, neural measures of fatigue (smallertarget P300 amplitude responses) were associated with thebehavioral measures of fatigue (slower RT and more lapsesof attention on the PVT task). These results are consistentwith the hypothesis that sustained effortful listening canincrease risk for fatigue.
We attribute the observed auditory ERP results tospeech processing–related fatigue rather than to repeatedexposure because the P300 response characteristics havemoderate-to-high within-session and long-term reliabilityranging from 0.40 to 0.99 (Cassidy, Robertson, & O’Connell,2012; Walhovd & Fjell, 2002). Also, repeated exposure tothe task is typically associated with an increase in the P300amplitude due to learning and greater familiarity with thestimuli, which make the task easier (Hagen, Gatherwright,Lopez, & Polich, 2006; Polich, 1987). On the other hand,we observed a reduction in amplitude during the posttestthat was driven specifically by smaller parietal P300 to tar-gets, reflecting reduced ability to actively detect syllabledifferences, while responses to the standard stimulus remainedunchanged. The concurrent increase in the frontal P300response to targets, often labeled as P3a and considered toreflect involuntary orienting to unexpected rare stimuli(Polich, 2007), suggests that the cognitive resources avail-able after completing speech-processing tasks were suffi-cient to orient to infrequent changes in the stimulus stream(possibly due to increased experience with the speech-in-noisestimuli) but not enough to actively identify the occurrenceof a task-relevant target. This finding is also consistent withreports that the state of fatigue may reduce the ability tofocus on the tasks at hand to a greater extent than the
2100 Journal of Speech, Language, and Hearing Research • Vol. 60 •
involuntary shifting of attention (Boksem et al., 2005). Ex-amination of the P1, N1, and P2 responses to sound onsetfurther indicated that there was no increased habituationto the procedure, as the mean amplitude measures of theseresponses were not affected by the stimuli or test session.Thus, we conclude that an auditory oddball task can beused with children to examine fatigue-related changes inauditory processing following effortful listening.
Similar evidence of a degraded ability to maintain at-tention after a period of demanding listening was observedin the behavioral performance on the PVT. PVT medianreaction times increased significantly, and the number ofattention lapses grew almost twofold following completionof the demanding speech-processing tasks. Research fromdiverse disciplines has shown that vigilant attention isdegraded in a fatigued state (e.g., Lieberman, 2013; Lim &Dinges, 2008). Our findings expand on this literature andare consistent with the hypothesis that sustained effortfullistening, commonly experienced by children and adults withhearing loss, has broad cognitive consequences. Vigilantattention is important for children in complex learning envi-ronments (e.g., busy classrooms), and deficits could affect achild’s ability to learn efficiently and effectively (Douglas,1983; Warner-Rogers, Taylor, Taylor, & Sandberg, 2000).Correlations between indices of fatigue derived from thePVT and our auditory ERP task suggests that the fatigueresulting from sustained listening may affect general cognitivefunctioning rather than being restricted to basic auditoryprocessing abilities.
Our findings also showed that young school-age chil-dren may be more susceptible to speech processing–relatedfatigue compared with older school-age children. This isconsistent with prior evidence that background noise hasgreater detrimental effects on speech understanding abili-ties in younger children than it does in older children(Bradley & Sato, 2008). Our results also provide new insightsinto other child characteristics that may also contribute to
2090–2104 • July 2017

increased risk of speech processing–related fatigue. Regard-less of age, children who had poorer vigilant attention skills,and those who perceived themselves to be more fatigued, ingeneral, appeared to experience greater listening-related fa-tigue. Further research with a larger and more diverse sam-ple of children, including those with hearing loss, willneed to examine whether the measures used in this studycan reliably identify students at increased risk for listening-related fatigue.
Although this study was the first to examine the ef-fects of listening-related fatigue in children and yieldednovel and encouraging results, it also presents with severallimitations. Children were instructed to detect each in-stance of the target sound in the auditory oddball task, butthey were not required to provide an overt behavioral re-sponse, and we did not verify the accuracy of their mentalcount. A number of studies suggest that the amplitude ofthe P300 response is modulated by the task instructions(Polich, 1987; Salisbury, Rutherford, Shenton, & McCarley,2001). These studies observed larger amplitudes, but delayedlatencies, following mental count instruction comparedwith button presses or finger-tapping indication of targetdetection. Our choice of task instructions was motivated bythe desire to keep the procedure as simple as possible so thatit could be used with young children without requiring exten-sive training, which could cause fatigue above and beyondthe listening effort manipulation in this study. The presenceof the P300 response to targets with the parietal maximumduring the baseline assessment suggests that the childrencomplied with the instructions and were actively listeningto the stimuli. Paired with the existing evidence of hightest–retest reliability, we, therefore, attribute the lack ofthe P300 effect in the posttest session to the detrimentaleffects of fatigue induced by sustained listening on thechildren’s ability to attend to the spoken stimuli. We pre-dict that in a more active task with overt behavioral re-sponses, the observed P300 modulation by fatigue mightbe even more pronounced.
Although we observed the expected amplitude decreasefollowing a series of speech-processing tasks, we were unableto examine P300 latency changes. Unlike the results of theprevious studies using P300 responses as a measure of fatiguein adults, our paradigm yielded a sustained P300 responserather than a single, well-defined peak, making it challengingto obtain a reliable measure of latency. The reasons forthis could be the use of speech in noise as stimuli. Prior P300studies in adults noted reduced amplitudes and delayed laten-cies when stimuli were presented in noise (Kaplan-Neeman,Kishon-Rabin, Henkin, & Muchnik, 2006; Whiting et al.,1998), particularly if that noise was speech babble (Bennettet al., 2012). Children’s ability to recognize speech in back-ground noise continues to develop until the teenage years(Neuman et al., 2010; Talarico et al., 2007), which makestheir ability to process auditory information more suscepti-ble to the detrimental effects of noise (Neuman et al., 2010).Thus, the use of the multitalker babble as the backgroundstimulus may have made the syllable discrimination taskmore difficult and increased variability in ERP responses.
However, the +10 dB SNR used in the study is comparableto, or better than, many listening environments experiencedby children during a typical day. Although the AmericanSpeech-Language-Hearing Association recommends an SNRof +15 dB for classrooms (American Speech-Language-Hearing Association, n.d.), classroom SNRs are reported torange from −3 to +16 dB SNR (Larsen & Blair, 2008; Sato& Bradley, 2008). Therefore, our results of diminished P300amplitude represent the lower-bound estimate of the detri-mental effects of listening fatigue on auditory processing inchildren.
Another limitation is that the age range for the studysample was relatively wide, especially for an ERP task. Inchildren, P300 amplitudes increase and latencies decreasein a linear fashion from preschool age through adolescence(Johnstone, Barry, Anderson, & Coyle, 1996). However,in our study, age was not correlated with the P300 ampli-tudes at either of the test sessions. Significant age effectson the P300 in children tend to be observed more frequentlyfor latency than amplitude measures. Prior studies (e.g.,Polich et al., 1990) suggested that in children, age-relateddifferences in P300 amplitudes are more likely to be observedwhen using paradigms with low-probability targets (e.g.,10% rather than 30% used in the current study) and invery large samples. We did observe a greater reduction in theP300 amplitudes following completion of the demanding lis-tening tasks in the younger children, but age did not corre-late with changes in performance on the PVT and self-reportsof fatigue. Future studies will need to examine the associationbetween age and listening-related fatigue in greater detail.
One could argue that a control group is needed torule out alternative interpretations for the observed ERPfindings, such as habitation, familiarity, or motivation dif-ferences. However, as discussed earlier, we believe thesepossibilities are unlikely for several reasons. First, the P300response has good test–retest reliability (e.g., Jirsa, 1992;Martin, Barajas, Fernandez, & Torres, 1988; Williams,Simms, Clark, Paul, Rowe, & Gordon, 2005), suggestingour observed changes are unlikely due to repeated test pre-sentations. Also, the changes we observed in the P300 responsewere in the direction opposite to what would be predictedby familiarity and were present only for the response tothe target stimuli. Furthermore, our results are consistentwith previous studies examining fatigue using the P300 re-sponse without the presence of a control group (Murataet al., 2005; Uetake & Murata, 2000). Nevertheless, futureresearch should examine whether our findings can be repli-cated when using a control group of children who do notperform speech-processing tasks. Closer examination ofindividual differences in ERP responses, including single-trial analyses, could also provide additional valuable insightsinto the nature of fatigue-related changes in the brain.
In conclusion, our preliminary results demonstratethe feasibility of evaluating listening fatigue in childrenusing objective behavioral and neurophysiological mea-sures in addition to the self-report. Correlations betweenactive (PVT) and passive (ERP) measures indicate thatspeech processing–related fatigue, resulting from sustained
Key et al.: Speech-Processing Fatigue 2101

and effortful listening, may have a broad, modality-nonspecific impact on cognitive functioning. Children withdisabilities, including hearing loss, may be required toapply even greater mental effort in common listening situa-tions and thus be at a greater risk for experiencing speechprocessing–related fatigue. The availability of multipleobjective measures of fatigue allows for the evaluation ofsuch experiences at the level most appropriate to the indi-vidual level of functioning. These types of measures area prerequisite for improving our understanding of theunderlying mechanisms of speech processing–related fatigueand, in the long-term, developing interventions to reduce itsnegative effects.
AcknowledgmentsThis work was supported, in part, by Institute of Educa-
tional Sciences Grant R324A110266 to Vanderbilt University(Nashville, TN; awarded to Fred H. Bess) and National Instituteof Child Health & Human Development Grants P30 HD15052 andU54 HD083211 to Vanderbilt Kennedy Center. This research wasalso supported by the Dan and Margaret Maddox Charitable Fund.The content expressed is that of the authors and do not necessarilyrepresent official views of the Institute of Educational Sciences,the U.S. Department of Education, or the National Institutes ofHealth. Data management was supported, in part, by the VanderbiltInstitute for Clinical and Translational Research (UL1 TR000445from National Center for Advancing Translational Services andNational Institutes of Health). We thank Dorita Jones for assis-tance with event-related potential data processing, as well as stu-dents and study staff who assisted in participant recruitment anddata collection, including Nick Bennett, Hilary Davis, AndyDeLong, Caralie Focht, Emily Fustos, Amanda Headley, QuelaRoyster, Amelia Schuster, Elizabeth Suba, and Krystal Werfel.Requests for reprints should be sent to Alexandra P. Key, VanderbiltUniversity, 230 Appleton Place, Peabody Box 74, Nashville, TN37203; e-mail: [email protected].
ReferencesAmerican National Standards Institute. (2010). Acoustical perfor-
mance criteria, design requirements, and guidelines for schools,part 1: Permanent schools (ANSI S12.60-2010). New York,NY: Author.
American Speech-Language-Hearing Association. (n.d.). ClassroomAcoustics (Practice Portal). Retrieved from www.asha.org/Practice-Portal/Professional-Issues/Classroom-Acoustics.
Bartlett, F. C. (1943). Ferrier lecture: Fatigue following highlyskilled work. Proceedings of the Royal Society of London B:Biological Sciences, 131, 247–257.
Baselmans, R., Van Schijndel, N. H., & Duisters, R. P. N. (2010).Measuring the effect of signal-to-noise ratio on listening fatigue(Technical Note PR-TN 2010/00235). Philips Research. Re-trieved from http://citeseerx.ist.psu.edu/viewdoc/download?doi=10.1.1.1025.9928&rep=rep1&type=pdf
Bennett, K. O., Billings, C. J., Molis, M. R., & Leek, M. R. (2012).Neural encoding and perception of speech signals in informa-tional masking. Ear and Hearing, 32, 231–238.
Berrin, S. J., Malcarne, V. L., Varni, J. W., Burwinkle, T. M.,Sherman, S. A., Artavia, K., & Chambers, H. G. (2007). Pain,fatigue, and school functioning in children with cerebral palsy:
2102 Journal of Speech, Language, and Hearing Research • Vol. 60 •
A path-analytic model. Journal of Pediatric Psychology, 32,330–337.
Bess, F. H., Gustafson, S. J., & Hornsby, B. W. (2014). How hardcan it be to listen? Fatigue in school-age children with hearingloss. Journal of Educational Audiology, 20(1), 1–14.
Bess, F. H., & Hornsby, B. W. (2014). Commentary: Listeningcan be exhausting—Fatigue in children and adults with hear-ing loss. Ear and Hearing, 35, 592–599.
Boksem, M. A., Meijman, T. F., & Lorist, M. M. (2005). Effectsof mental fatigue on attention: An ERP study. Cognitive BrainResearch, 25, 107–116.
Boksem, M. A., & Tops, M. (2008). Mental fatigue: Costs andbenefits. Brain Research Reviews, 59, 125–139.
Bolia, R. S., Nelson, W. T., Ericson, M. A., & Simpson, B. D.(2000). A speech corpus for multitalker communicationsresearch. The Journal of the Acoustical Society of America,107, 1065–1066.
Bradley, J. S., & Sato, H. (2008). The intelligibility of speech inelementary school classrooms. The Journal of the AcousticalSociety of America, 123, 2078–2086.
Brown, L., Sherbenou, R. J., & Johnsen, S. K. (2010). Test ofNonverbal Intelligence–Fourth edition. Austin, TX: Pro-Ed.
Cassidy, S. M., Robertson, I. H., & O’Connell, R. G. (2012).Retest reliability of event-related potentials: Evidence froma variety of paradigms. Psychophysiology, 49, 659–664.
Crawley, E. (2014). The epidemiology of chronic fatigue syndrome/myalgic encephalitis in children. Archives of Disease in Child-hood, 99, 171–174.
Desai, C. B., Prajapati, D. L., Gokhale, P. A., Mehta, H. B., Shah,C. J., & Ghuntla, T. P. (2012). Effect of prolonged mental activ-ity on auditory reaction time in young healthy subjects. Interna-tional Journal of Basic and Applied Physiology, 1(1), 159–161.
Dinges, D. F., & Powell, J. W. (1985). Microcomputer analysesof performance on a portable, simple visual RT task duringsustained operations. Behavior Research Methods, Instruments,& Computers, 17, 652–655.
Donchin, E., Miller, G. A., & Farwell, L. A. (1986). The endoge-nous components of the event-related potential—A diagnostictool? Progress in Brain Research, 70(1), 87–102.
Douglas, V. (1983). Attention and cognitive problems. In M. Rutter(Ed.), Developmental neuropsychiatry (pp. 280–330). New York,NY: Guilford Press.
Downs, D. W. (1982). Effects of hearing aid use on speech dis-crimination and listening effort. Journal of Speech and HearingDisorders, 47, 189–193.
Ferree, T. C., Luu, P., Russell, G. S., & Tucker, D. M. (2001).Scalp electrode impedance, infection risk, and EEG dataquality. Clinical Neurophysiology, 112, 536–544.
Hagen, G. F., Gatherwright, J. R., Lopez, B. A., & Polich, J. (2006).P3a from visual stimuli: Task difficulty effects. InternationalJournal of Psychophysiology, 59, 8–14.
Henkin, Y., Kileny, P. R., Hildesheimer, M., & Kishon-Rabin, L.(2008). Phonetic processing in children with cochlear implants:An auditory event-related potentials study. Ear and Hearing,29, 239–249.
Hicks, C. B., & Tharpe, A. M. (2002). Listening effort and fatiguein school-age children with and without hearing loss. Journalof Speech, Language, and Hearing Research, 45, 573–584.
Hornsby, B. W. (2013). The effects of hearing aid use on listeningeffort and mental fatigue associated with sustained speechprocessing demands. Ear and Hearing, 34, 523–534.
Hornsby, B. W., Naylor, G., & Bess, F. H. (2016). A taxonomyof fatigue concepts and their relation to hearing loss. Ear andHearing, 37(Suppl. 1), 136S–144S.
2090–2104 • July 2017

Hornsby, B. W., Werfel, K., Camarata, S., & Bess, F. H. (2014).Subjective fatigue in children with hearing loss: Some prelimi-nary findings. American Journal of Audiology, 23, 129–134.
Howard, C. S., Munro, K. J., & Plack, C. J. (2010). Listeningeffort at signal-to-noise ratios that are typical of the schoolclassroom. International Journal of Audiology, 49, 928–932.
Isreal, J. B., Wickens, C. D., Chesney, G. L., & Donchin, E. (1980).The event-related brain potential as an index of display-monitoring workload. Human Factors: The Journal of theHuman Factors and Ergonomics Society, 22, 211–224.
Jirsa, R. E. (1992). The clinical utility of the P3 AERP in childrenwith auditory processing disorders. Journal of Speech andHearing Research, 35, 903–912.
Johnstone, S. J., Barry, R. J., Anderson, J. W., & Coyle, S. F.(1996). Age-related changes in child and adolescent event-related potential component morphology, amplitude andlatency to standard and target stimuli in an auditory oddballtask. International Journal of Psychophysiology, 24, 223–238.
Kahneman, D. (1973). Attention and effort. Englewood Cliffs, NJ:Prentice Hall.
Kaplan-Neeman, R., Kishon-Rabin, L., Henkin, Y., & Muchnik, C.(2006). Identification of syllables in noise: Electrophysiologicaland behavioral correlates. The Journal of the Acoustical Societyof America, 120, 926–933.
Kaseda, Y., Jiang, C., Kurokawa, K., Mimori, Y., & Nakamura, S.(1998). Objective evaluation of fatigue by event-related poten-tials. Journal of the Neurological Sciences, 158, 96–100.
Klatte, M., Hellbrück, J., Seidel, J., & Leistner, P. (2010). Effectsof classroom acoustics on performance and well-being in elemen-tary school children: A field study. Environment and Behavior,42, 659–692.
Larsen, J. B., & Blair, J. C. (2008). The effect of classroom ampli-fication on the signal-to-noise ratio in classrooms while class isin session. Language, Speech, and Hearing Services in Schools,39, 451–460.
Lieberman, H. R. (2013). Cognitive methods for assessing mentalenergy. Nutritional Neuroscience, 10, 229–242.
Lim, J., & Dinges, D. F. (2008). Sleep deprivation and vigilantattention. Annals of the New York Academy of Sciences,1129(1), 305–322.
Luck, S. J. (2005). An introduction to the event-related potentialtechnique. Cambridge, MA: MIT Press.
Määttä, S., Pääkkönen, A., Saavalainen, P., & Partanen, J. (2005).Selective attention event-related potential effects from auditorynovel stimuli in children and adults. Clinical Neurophysiology,116, 129–141.
Mackersie, C. L., Boothroyd, A., & Minniear, D. (2001). Evalua-tion of the computer-assisted speech perception assessment test(CASPA). Journal of the American Academy of Audiology,12, 390–396.
Marcus, S. B., Strople, J. A., Neighbors, K., Weissberg-Benchell, J.,Nelson, S. P., Limbers, C., . . . Alonso, E. M. (2009). Fatigueand health-related quality of life in pediatric inflammatorybowel disease. Clinical Gastroenterology and Hepatology,7, 554–561.
Martin, L., Barajas, J. J., Fernandez, R., & Torres, E. (1988).Auditory event-related potentials in well-characterized groupsof children. Electroencephalography and Clinical Neurophysiol-ogy, 71, 375–381.
McCabe, M. (2009). Fatigue in children with long-term condi-tions: an evolutionary concept analysis. Journal of AdvancedNursing, 65, 1735–1745.
McCreery, R. W., & Stelmachowicz, P. G. (2013). The effectsof limited bandwidth and noise on verbal processing time
and word recall in normal-hearing children. Ear and Hear-ing, 34, 585–591.
McFadden, B., & Pittman, A. (2008). Effect of minimal hearingloss on children’s ability to multitask in quiet and in noise.Language, Speech, and Hearing Services in Schools, 39,342–351.
Murata, A., Uetake, A., & Takasawa, Y. (2005). Evaluation ofmental fatigue using feature parameter extracted from event-related potential. International Journal of Industrial Ergonom-ics, 35, 761–770.
Neuman, A. C., Wroblewski, M., Hajicek, J., & Rubinstein, A.(2010). Combined effects of noise and reverberation on speechrecognition performance of normal-hearing children and adults.Ear and Hearing, 31, 336–344.
Oades, R. D., Dittman-Balcar, A., & Zerbin, D. (1997). Develop-ment and topography of auditory event-related potentials(ERPs): Mismatch and processing negativity in individuals8–22 years of age. Psychophysiology, 34, 677–693.
Ohde, R. N., & Abou-Khalil, R. (2001). Age differences for stop-consonant and vowel perception in adults. The Journal of theAcoustical Society of America, 110, 2156–2166.
Oldfield, R. C. (1971). The assessment and analysis of handed-ness: The Edinburgh inventory. Neuropsychologia, 9(1),97–113.
Overtoom, C. C., Verbaten, M. N., Kemner, C., Kenemans, J. L.,van Engeland, H., Buitelaar, J. K., . . . Koelega, H. S. (1998).Associations between event-related potentials and measuresof attention and inhibition in the Continuous PerformanceTask in children with ADHD and normal controls. Journalof the American Academy of Child & Adolescent Psychiatry,37, 977–985.
Pearce, J. W., Crowell, D. H., Tokioka, A., & Pacheco, G. P.(1989). Childhood developmental changes in the auditoryP300. Journal of Child Neurology, 4, 100–106.
Pichora-Fuller, M. K., Kramer, S. E., Eckert, M. A., Edwards, B.,Hornsby, B. W., Humes, L. E., . . . Mackersie, C. L. (2016).Hearing impairment and cognitive energy: The Framework forUnderstanding Effortful Listening (FUEL). Ear and Hearing,37(Suppl. 1), 5S–27S.
Pichora-Fuller, M. K., Schneider, B. A., & Daneman, M. (1995). Howyoung and old adults listen to and remember speech in noise.The Journal of the Acoustical Society of America, 97, 593–608.
Polich, J. (1987). Task difficulty, probability, and inter-stimulusinterval as determinants of P300 from auditory stimuli. Elec-troencephalography and Clinical Neurophysiology, 68, 311–320.
Polich, J. (2007). Updating P300: An integrative theory of P3aand P3b. Clinical Neurophysiology, 118, 2128–2148.
Polich, J., Ladish, C., & Burns, T. (1990). Normal variation ofP300 in children: Age, memory span, and head size. Interna-tional Journal of Psychophysiology, 9, 237–248.
Rönnberg, N., Rudner, M., Lunner, T., & Stenfelt, S. (2014).Assessing listening effort by measuring short-term memorystorage and processing of speech in noise. Speech, Languageand Hearing, 17, 123–132.
Salisbury, D. F., Rutherford, B., Shenton, M. E., & McCarley, R. W.(2001). Button-pressing affects P300 amplitude and scalptopography. Clinical Neurophysiology, 112, 1676–1684.
Sato, H., & Bradley, J. S. (2008). Evaluation of acoustical condi-tions for speech communication in working elementary schoolclassrooms. The Journal of the Acoustical Society of America,123, 2064–2077.
Semel, E., Wiig, E., & Secord, W. (2003). Clinical Evaluation ofLanguage Fundamentals–Fourth edition. Marrickville: HarcourtAssessment.
Key et al.: Speech-Processing Fatigue 2103

Stoff, E., Bacon, M. C., & White, P. H. (1989). The effects offatigue, distractibility, and absenteeism on school achievementin children with rheumatic diseases. Arthritis & Rheumatism,2, 49–53.
Strandburg, R. J., Marsh, J. T., Brown, W. S., Asarnow, R. F.,Higa, J., Harper, R., & Guthrie, D. (1996). Continuous-processing-related event-related potentials in children withattention deficit hyperactivity disorder. Biological Psychia-try, 40, 964–980.
Talarico, M., Abdilla, G., Aliferis, M., Balazic, I., Giaprakis, I.,Stefanakis, T., . . . Paolini, A. G. (2007). Effect of age andcognition on childhood speech in noise perception abilities.Audiology and Neuro-Otology, 12, 13–19.
Thomas, D. G., Grice, J. W., Najm-Briscoe, R. G., & Williams Miller,J. (2004). The influence of unequal numbers of trials on com-parisons of average event-related potentials. DevelopmentalNeuropsychology, 26, 753–774.
Uetake, A., & Murata, A. (2000). Assessment of mental fatigueduring VDT task using event-related potential (P300). In Pro-ceedings of the 9th IEEE International Workshop on Robotand Human Interactive Communication (pp. 235–240). Osaka,Japan: IEEE.
Ullsperger, P., Metz, A.-M., & Gille, H.-G. (1988). The P300component of the event-related brain potential and mentaleffort. Ergonomics, 31, 1127–1137.
Van Zomeren, A. H., Brouwer, W. H., & Deelman, B. G. (1984).Attentional deficits: The riddles of selectivity, speed and alert-ness. In N. Brooks (Ed.), Closed head injury: Psychological,
2104 Journal of Speech, Language, and Hearing Research • Vol. 60 •
social, and family consequences (pp. 74–107). New York, NY:Oxford University Press.
Varni, J. W., Burwinkle, T. M., & Szer, I. S. (2004). The PedsQLMultidimensional Fatigue Scale in pediatric rheumatology:Reliability and validity. The Journal of Rheumatology, 31,2494–2500.
Walhovd, K. B., & Fjell, A. M. (2002). One-year test–retest reli-ability of auditory ERPs in young and old adults. InternationalJournal of Psychophysiology, 46, 29–40.
Warner-Rogers, J., Taylor, A., Taylor, E., & Sandberg, S. (2000).Inattentive behavior in childhood epidemiology and impli-cations for development. Journal of Learning Disabilities,33, 520–536.
Whiting, K. A., Martin, B. A., & Stapells, D. R. (1998). The ef-fects of broadband noise masking on cortical event-relatedpotentials to speech sounds /ba/ and /da/. Ear and Hearing,19, 218–231.
Wijers, A. A., Mulder, G., Gunter, T. C., & Smid, H. (1996).Brain potential analysis of selective attention. Handbook ofPerception and Action, 3(1), 333–387.
Williams, L. M., Simms, E., Clark, C. R., Paul, R. H., Rowe, D.,& Gordon, E. (2005). The test-retest reliability of a standard-ized neurocognitive and neurophysiological test battery:“Neuromarker.” International Journal of Neuroscience, 115,1605–1630.
Ziino, C., & Ponsford, J. (2006). Selective attention deficits andsubjective fatigue following traumatic brain injury. Neuro-psychology, 20, 383.
2090–2104 • July 2017