spectrum pricing: what it is and ocp in australia · spectrum pricing: what it is and ocp in...
TRANSCRIPT

Spectrum pricing:What it is and OCP in Australia
Ben Freyens
Faculty of BGL, University of CanberraCenter of Law & Economics, Australian National University
Asia-Pacific Regional ITU Workshop on "Managing Spectrum in the age of wireless communication"Bangkok, Thailand 3 - 4 May 2017
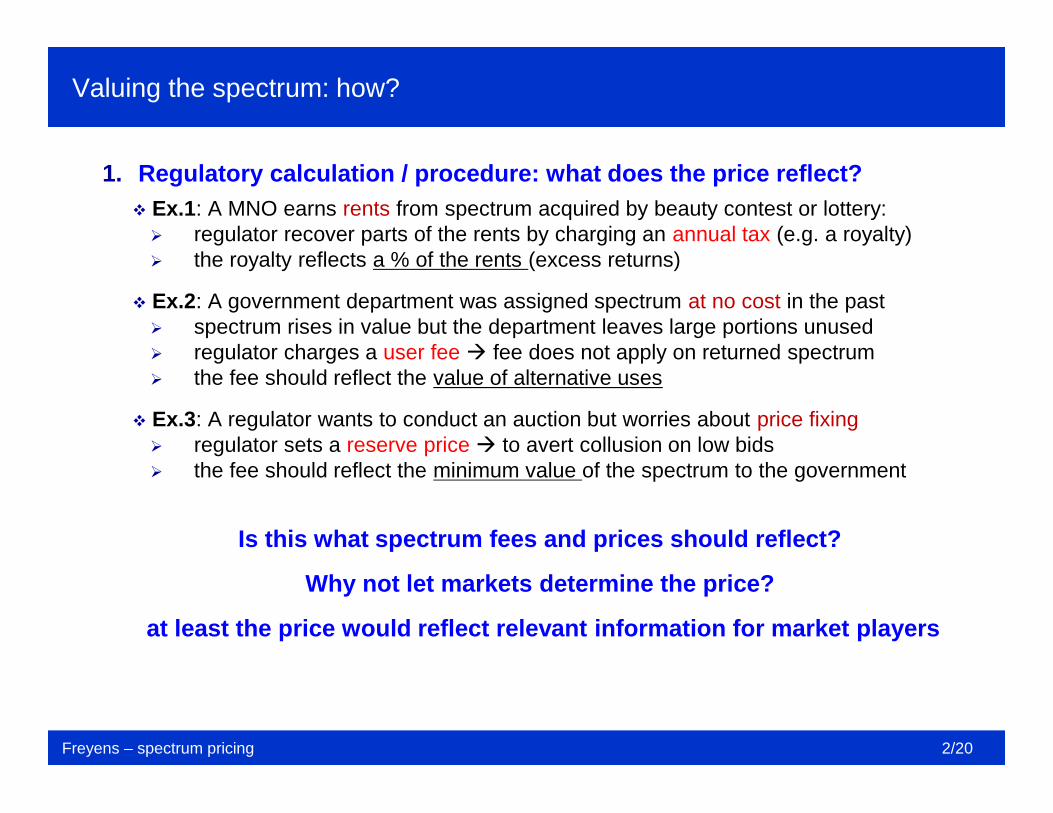
1. Regulatory calculation / procedure: what does the price reflect? Ex.1: A MNO earns rents from spectrum acquired by beauty contest or lottery: regulator recover parts of the rents by charging an annual tax (e.g. a royalty) the royalty reflects a % of the rents (excess returns)
Ex.2: A government department was assigned spectrum at no cost in the past spectrum rises in value but the department leaves large portions unused regulator charges a user fee fee does not apply on returned spectrum the fee should reflect the value of alternative uses
Ex.3: A regulator wants to conduct an auction but worries about price fixing regulator sets a reserve price to avert collusion on low bids the fee should reflect the minimum value of the spectrum to the government
Is this what spectrum fees and prices should reflect?
Why not let markets determine the price?
at least the price would reflect relevant information for market players
Valuing the spectrum: how?
Freyens – spectrum pricing 2/20
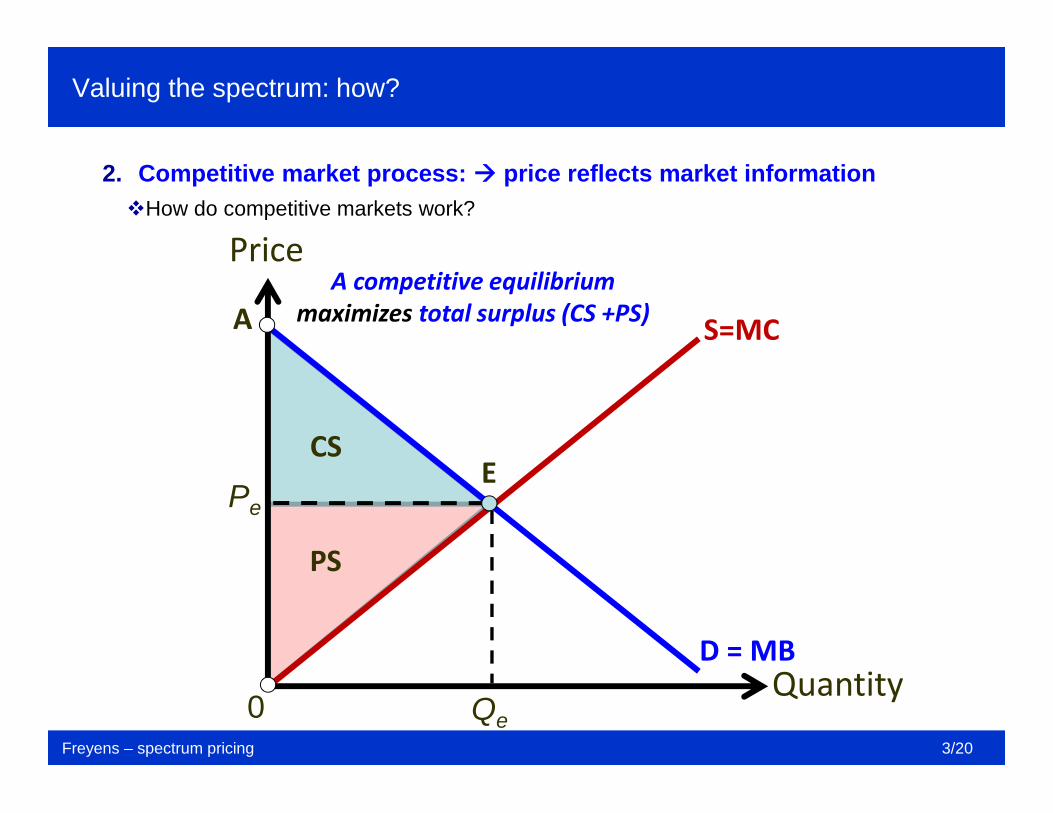
2. Competitive market process: price reflects market informationHow do competitive markets work?
Valuing the spectrum: how?
Freyens – spectrum pricing 3/20
Price
0Quantity
PeE
Qe
D = MB
A competitive equilibriummaximizes total surplus (CS +PS)
CS
S=MC
PS
A
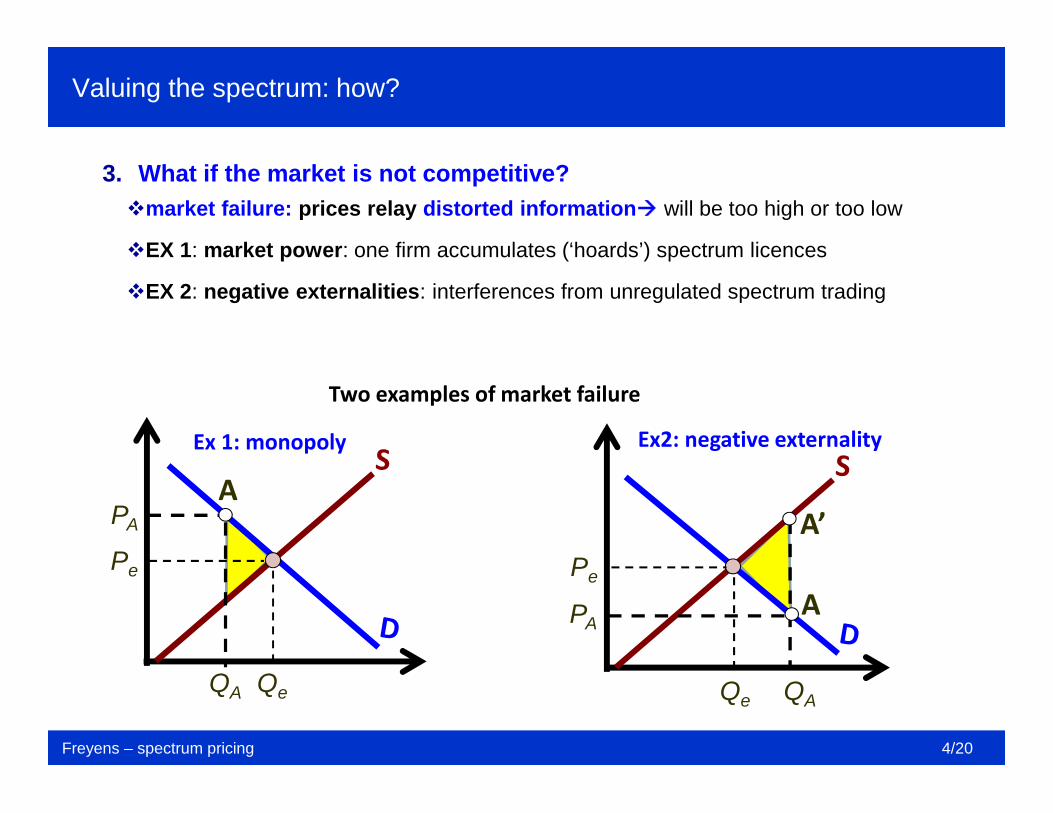
3. What if the market is not competitive?market failure: prices relay distorted information will be too high or too low
EX 1: market power: one firm accumulates (‘hoards’) spectrum licences
EX 2: negative externalities: interferences from unregulated spectrum trading
Valuing the spectrum: how?
Freyens – spectrum pricing 4/20
QeQA
A
Pe
PA
Qe QA
APe
PA
Two examples of market failure
Ex 1: monopoly Ex2: negative externality
A’
● Externalities are a salient feature of spectrum use● Market power as well (more recent)● historical practice of regulating usage rights and charging license fees
generally unconcerned with capturing economic or scarcity value of spectrum consisted of an application fee and a regulatory fee (US), or ‘recovery fee’ (AUS)
● What was the aim of cost-recovery pricing (CRP)? discourage frivolous applications recover the cost of regulating
Historical practice
Freyens – spectrum pricing 5/20
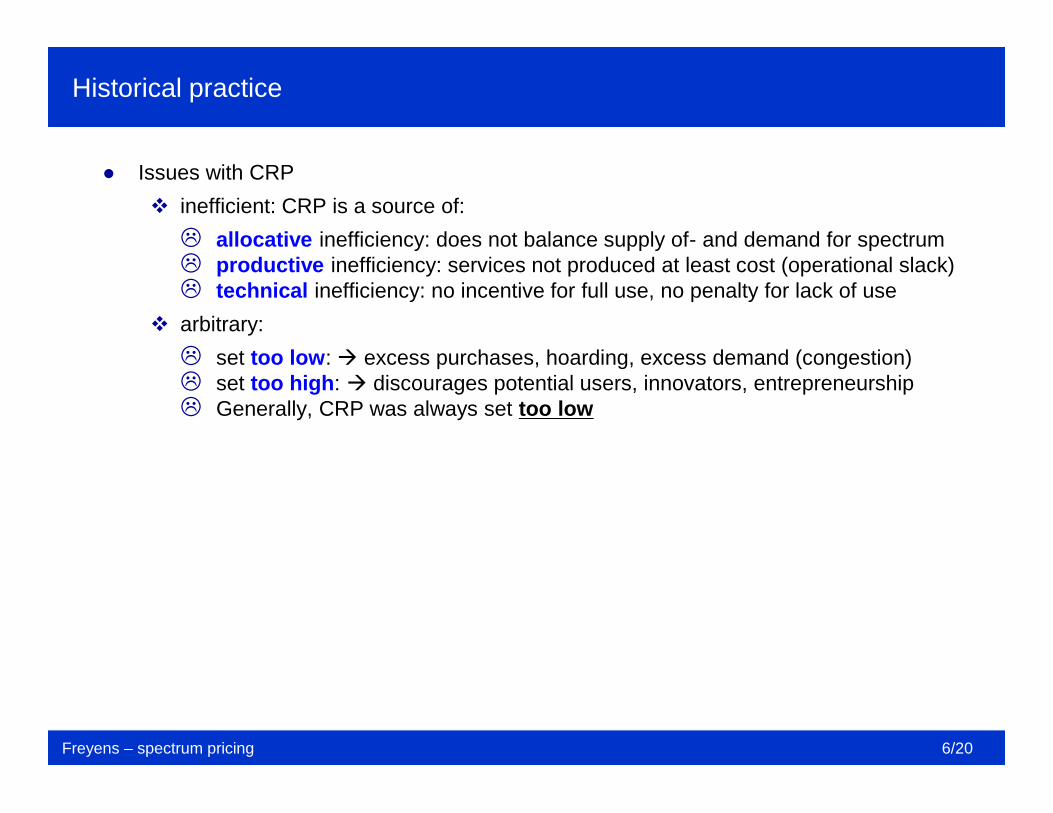
● Issues with CRP inefficient: CRP is a source of: allocative inefficiency: does not balance supply of- and demand for spectrum productive inefficiency: services not produced at least cost (operational slack) technical inefficiency: no incentive for full use, no penalty for lack of use
arbitrary: set too low: excess purchases, hoarding, excess demand (congestion) set too high: discourages potential users, innovators, entrepreneurship Generally, CRP was always set too low
Historical practice
Freyens – spectrum pricing 6/20
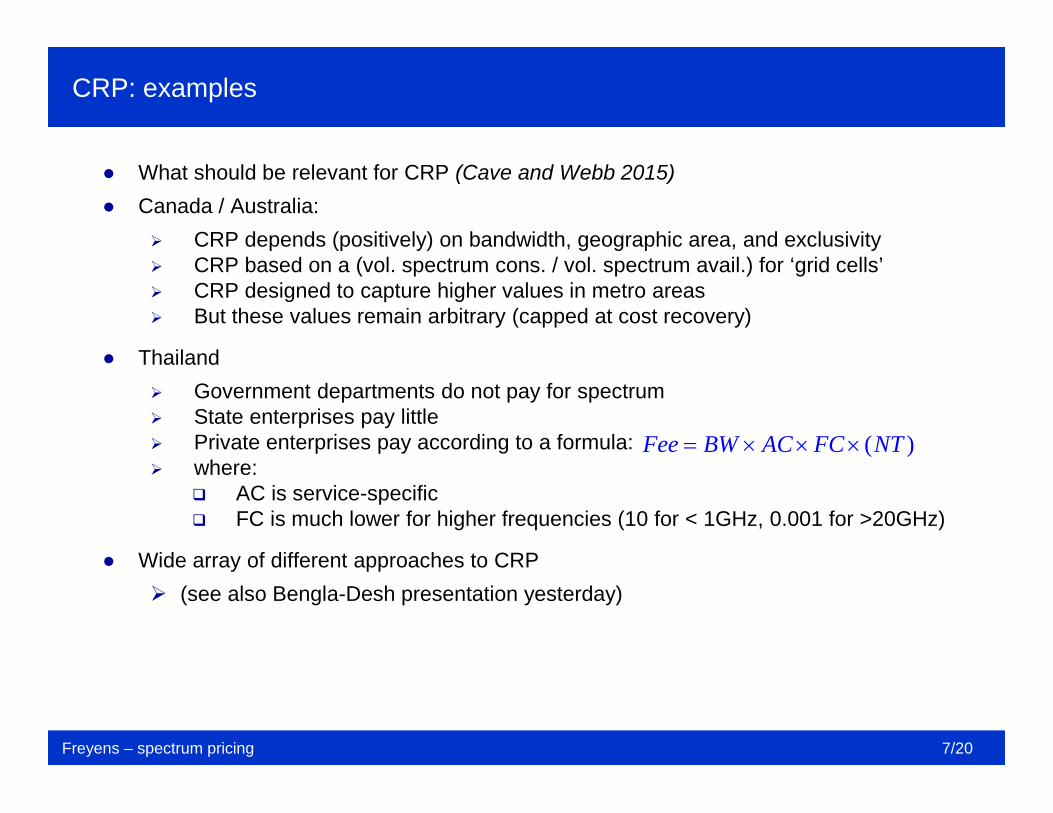
● What should be relevant for CRP (Cave and Webb 2015)● Canada / Australia:
CRP depends (positively) on bandwidth, geographic area, and exclusivity CRP based on a (vol. spectrum cons. / vol. spectrum avail.) for ‘grid cells’ CRP designed to capture higher values in metro areas But these values remain arbitrary (capped at cost recovery)
● Thailand Government departments do not pay for spectrum State enterprises pay little Private enterprises pay according to a formula: where:
AC is service-specific FC is much lower for higher frequencies (10 for < 1GHz, 0.001 for >20GHz)
● Wide array of different approaches to CRP (see also Bengla-Desh presentation yesterday)
CRP: examples
Freyens – spectrum pricing 7/20
( )Fee BW AC FC NT
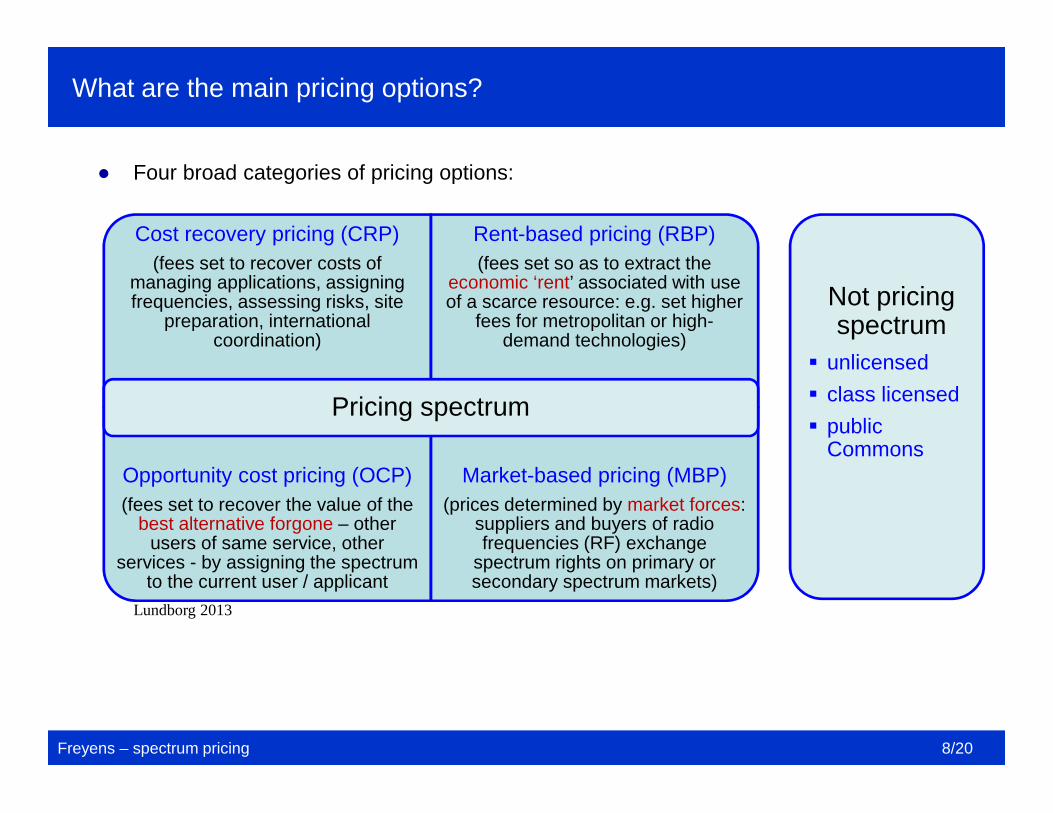
● Four broad categories of pricing options:
What are the main pricing options?
Freyens – spectrum pricing 8/20
Cost recovery pricing (CRP)(fees set to recover costs of
managing applications, assigningfrequencies, assessing risks, site
preparation, internationalcoordination)
Rent-based pricing (RBP)(fees set so as to extract the
economic ‘rent’ associated with useof a scarce resource: e.g. set higher
fees for metropolitan or high-demand technologies)
Opportunity cost pricing (OCP)(fees set to recover the value of the
best alternative forgone – otherusers of same service, other
services - by assigning the spectrumto the current user / applicant
Market-based pricing (MBP)(prices determined by market forces:
suppliers and buyers of radiofrequencies (RF) exchange
spectrum rights on primary orsecondary spectrum markets)
Pricing spectrum
Lundborg 2013
Not pricingspectrum
unlicensed class licensed public
Commons
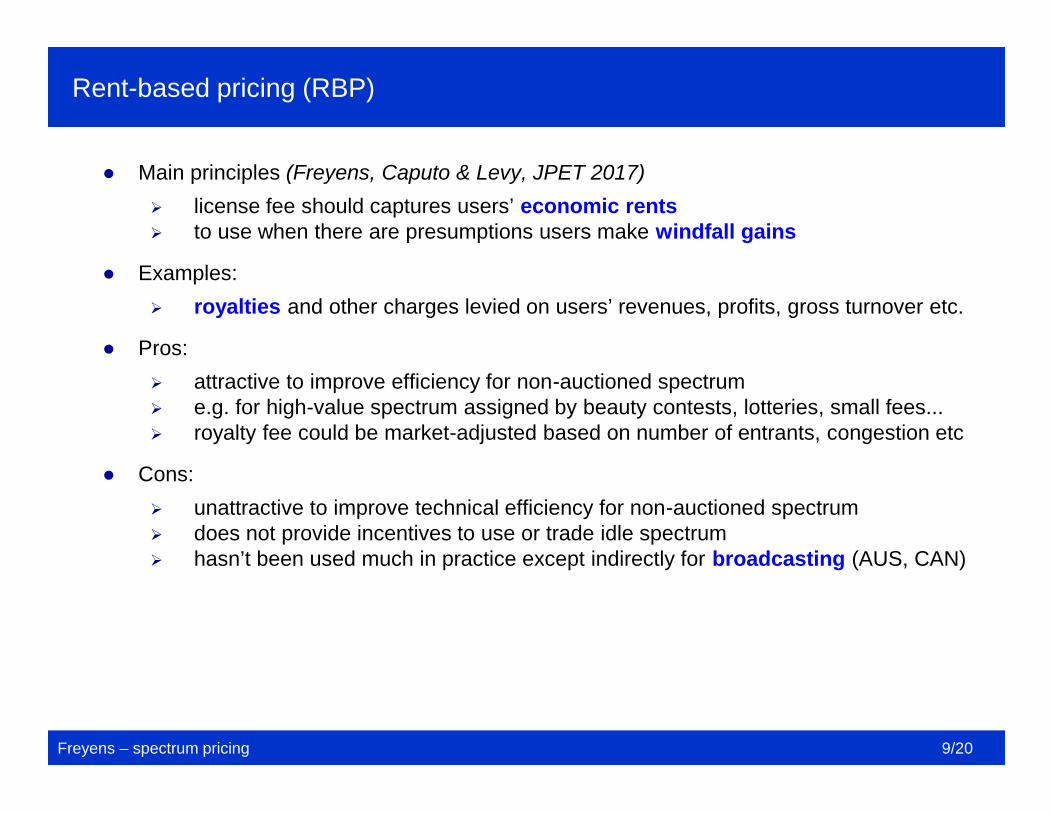
● Main principles (Freyens, Caputo & Levy, JPET 2017) license fee should captures users’ economic rents to use when there are presumptions users make windfall gains
● Examples: royalties and other charges levied on users’ revenues, profits, gross turnover etc.
● Pros: attractive to improve efficiency for non-auctioned spectrum e.g. for high-value spectrum assigned by beauty contests, lotteries, small fees... royalty fee could be market-adjusted based on number of entrants, congestion etc
● Cons: unattractive to improve technical efficiency for non-auctioned spectrum does not provide incentives to use or trade idle spectrum hasn’t been used much in practice except indirectly for broadcasting (AUS, CAN)
Rent-based pricing (RBP)
Freyens – spectrum pricing 9/20
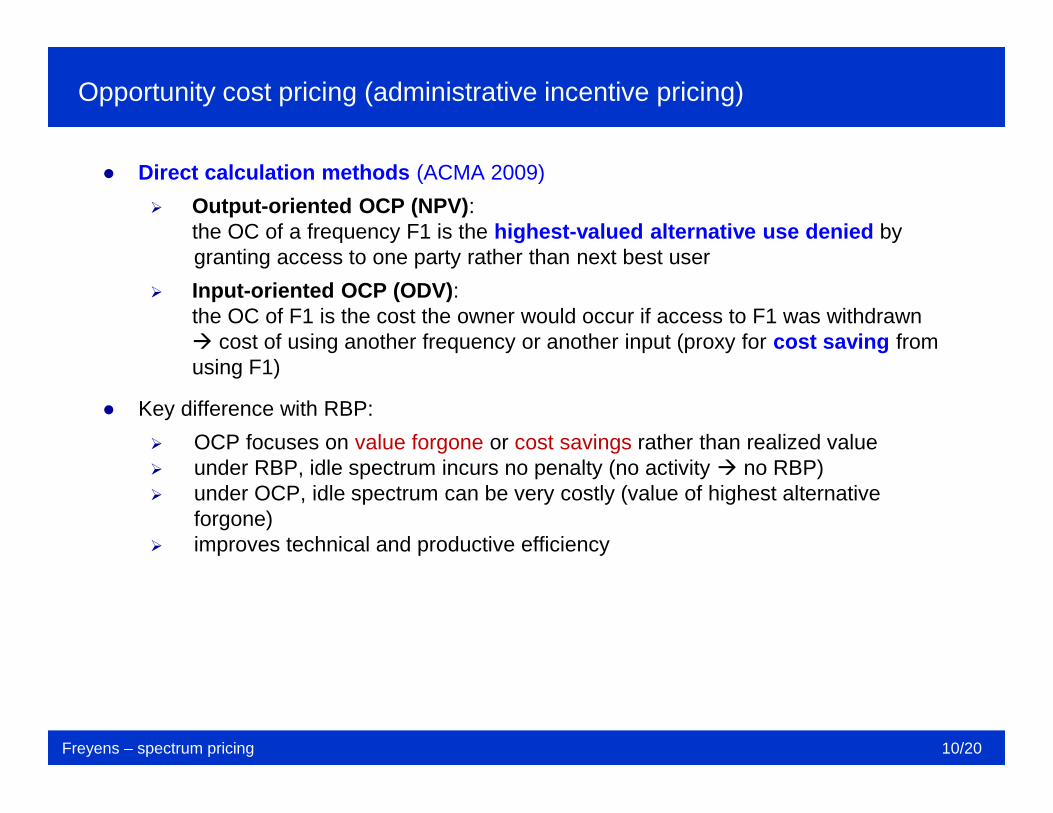
● Direct calculation methods (ACMA 2009) Output-oriented OCP (NPV):
the OC of a frequency F1 is the highest-valued alternative use denied bygranting access to one party rather than next best user
Input-oriented OCP (ODV):the OC of F1 is the cost the owner would occur if access to F1 was withdrawn cost of using another frequency or another input (proxy for cost saving fromusing F1)
● Key difference with RBP: OCP focuses on value forgone or cost savings rather than realized value under RBP, idle spectrum incurs no penalty (no activity no RBP) under OCP, idle spectrum can be very costly (value of highest alternative
forgone) improves technical and productive efficiency
Opportunity cost pricing (administrative incentive pricing)
Freyens – spectrum pricing 10/20
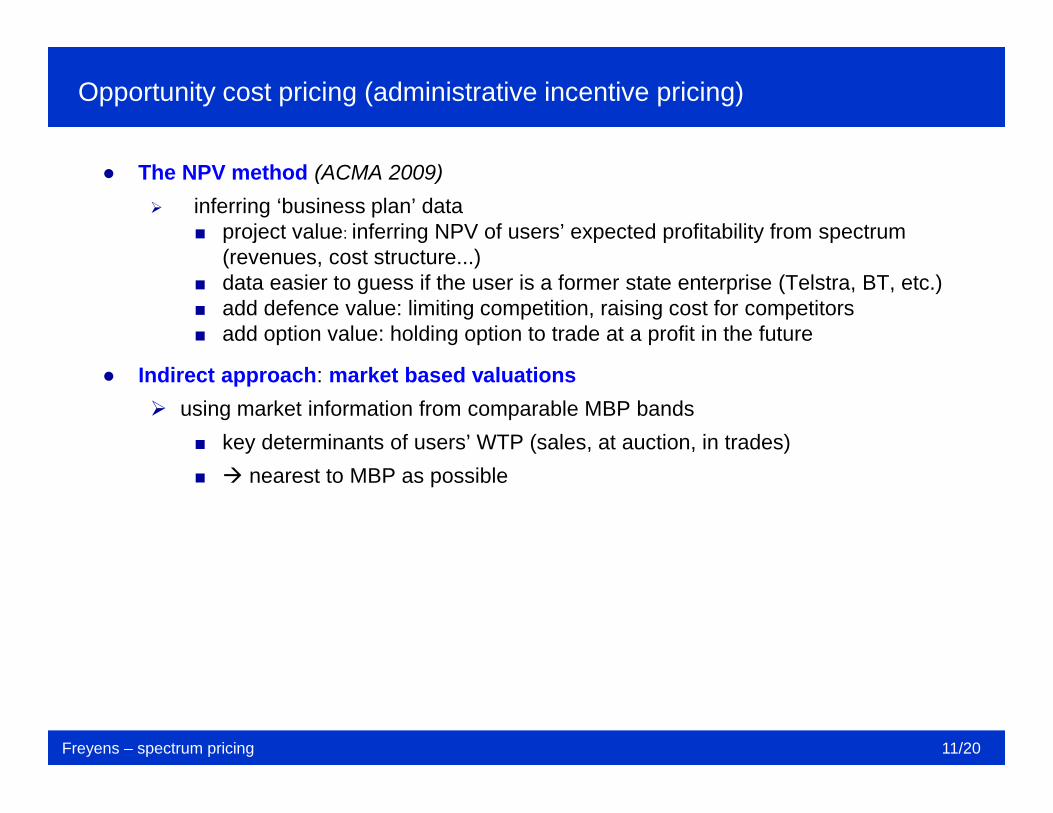
● The NPV method (ACMA 2009) inferring ‘business plan’ data
project value: inferring NPV of users’ expected profitability from spectrum(revenues, cost structure...)
data easier to guess if the user is a former state enterprise (Telstra, BT, etc.) add defence value: limiting competition, raising cost for competitors add option value: holding option to trade at a profit in the future
● Indirect approach: market based valuations using market information from comparable MBP bands
key determinants of users’ WTP (sales, at auction, in trades) nearest to MBP as possible
Opportunity cost pricing (administrative incentive pricing)
Freyens – spectrum pricing 11/20
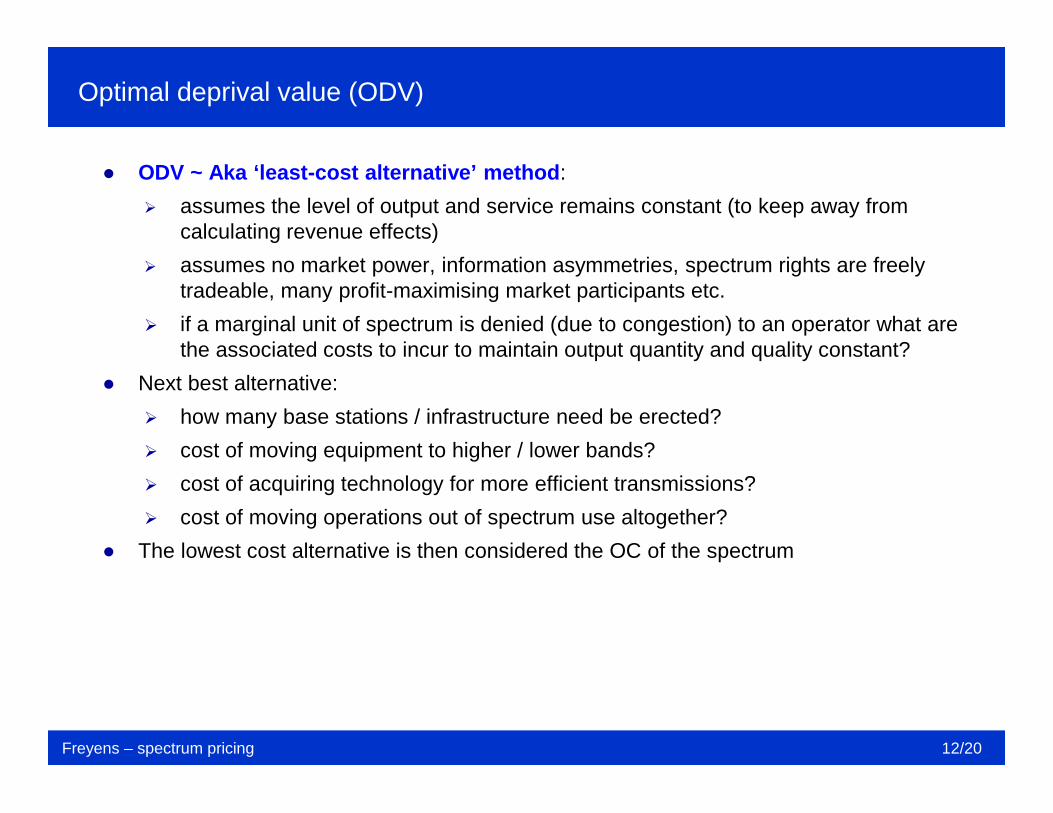
● ODV ~ Aka ‘least-cost alternative’ method: assumes the level of output and service remains constant (to keep away from
calculating revenue effects) assumes no market power, information asymmetries, spectrum rights are freely
tradeable, many profit-maximising market participants etc. if a marginal unit of spectrum is denied (due to congestion) to an operator what are
the associated costs to incur to maintain output quantity and quality constant?● Next best alternative:
how many base stations / infrastructure need be erected? cost of moving equipment to higher / lower bands? cost of acquiring technology for more efficient transmissions? cost of moving operations out of spectrum use altogether?
● The lowest cost alternative is then considered the OC of the spectrum
Optimal deprival value (ODV)
Freyens – spectrum pricing 12/20
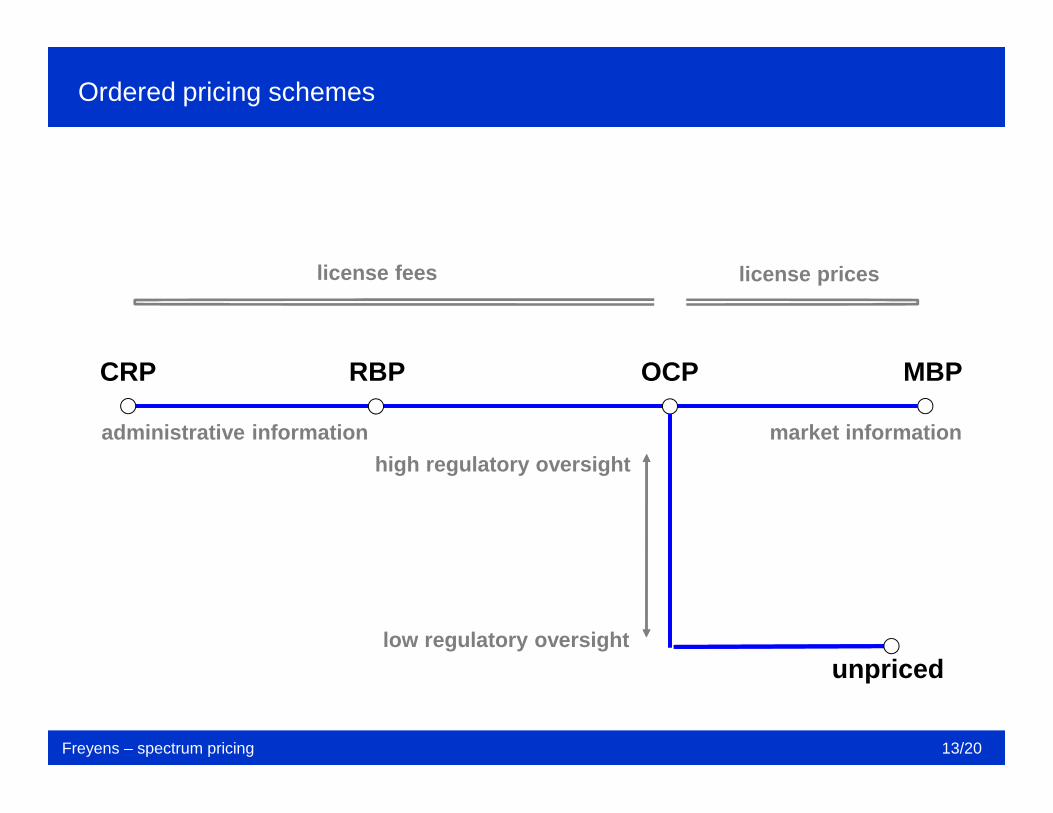
Ordered pricing schemes
Freyens – spectrum pricing 13/20
CRP RBP OCP MBP
market informationadministrative information
license fees license prices
high regulatory oversight
low regulatory oversightunpriced
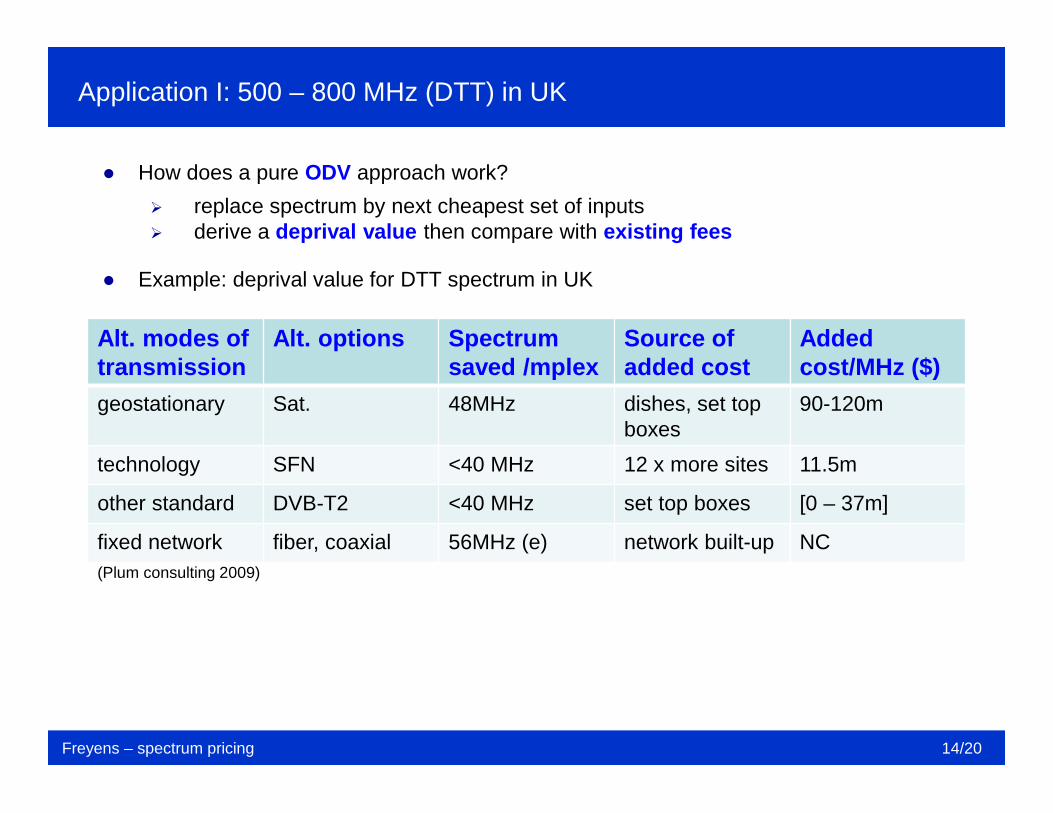
● How does a pure ODV approach work? replace spectrum by next cheapest set of inputs derive a deprival value then compare with existing fees
● Example: deprival value for DTT spectrum in UK
Application I: 500 – 800 MHz (DTT) in UK
Freyens – spectrum pricing 14/20
Alt. modes oftransmission
Alt. options Spectrumsaved /mplex
Source ofadded cost
Addedcost/MHz ($)
geostationary Sat. 48MHz dishes, set topboxes
90-120m
technology SFN <40 MHz 12 x more sites 11.5m
other standard DVB-T2 <40 MHz set top boxes [0 – 37m]
fixed network fiber, coaxial 56MHz (e) network built-up NC(Plum consulting 2009)
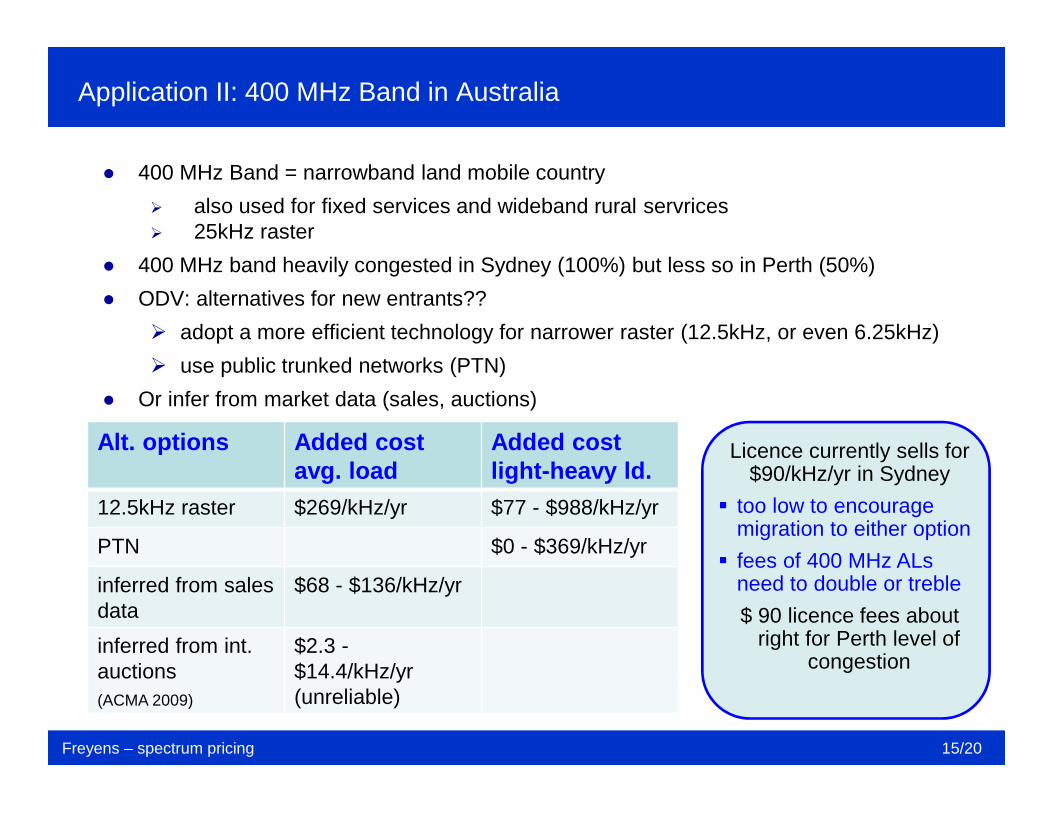
● 400 MHz Band = narrowband land mobile country also used for fixed services and wideband rural servrices 25kHz raster
● 400 MHz band heavily congested in Sydney (100%) but less so in Perth (50%)● ODV: alternatives for new entrants??
adopt a more efficient technology for narrower raster (12.5kHz, or even 6.25kHz) use public trunked networks (PTN)
● Or infer from market data (sales, auctions)● Alternatives for new entrants??
Application II: 400 MHz Band in Australia
Freyens – spectrum pricing 15/20
Alt. options Added costavg. load
Added costlight-heavy ld.
12.5kHz raster $269/kHz/yr $77 - $988/kHz/yr
PTN $0 - $369/kHz/yr
inferred from salesdata
$68 - $136/kHz/yr
inferred from int.auctions
$2.3 -$14.4/kHz/yr(unreliable)(ACMA 2009)
Licence currently sells for$90/kHz/yr in Sydney
too low to encouragemigration to either option fees of 400 MHz ALs
need to double or treble$ 90 licence fees about
right for Perth level ofcongestion
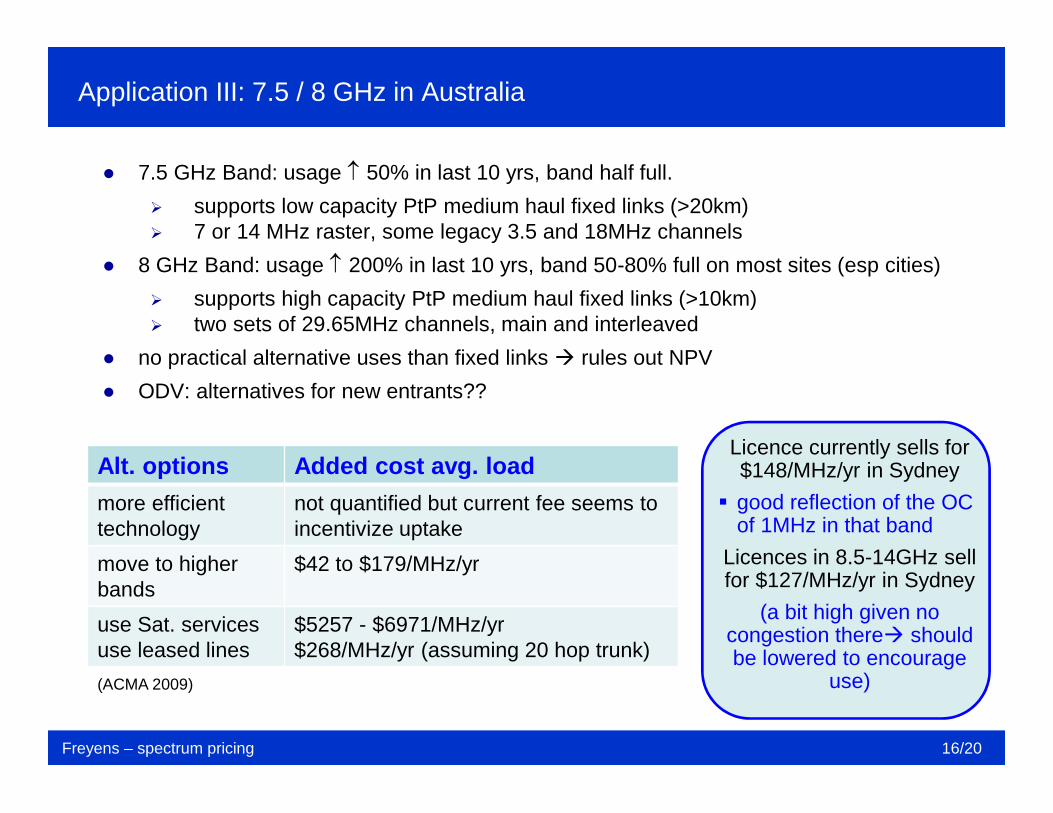
● 7.5 GHz Band: usage 50% in last 10 yrs, band half full. supports low capacity PtP medium haul fixed links (>20km) 7 or 14 MHz raster, some legacy 3.5 and 18MHz channels
● 8 GHz Band: usage 200% in last 10 yrs, band 50-80% full on most sites (esp cities) supports high capacity PtP medium haul fixed links (>10km) two sets of 29.65MHz channels, main and interleaved
● no practical alternative uses than fixed links rules out NPV● ODV: alternatives for new entrants??
Application III: 7.5 / 8 GHz in Australia
Freyens – spectrum pricing 16/20
Alt. options Added cost avg. loadmore efficienttechnology
not quantified but current fee seems toincentivize uptake
move to higherbands
$42 to $179/MHz/yr
use Sat. servicesuse leased lines
$5257 - $6971/MHz/yr$268/MHz/yr (assuming 20 hop trunk)
(ACMA 2009)
Licence currently sells for$148/MHz/yr in Sydney
good reflection of the OCof 1MHz in that band
Licences in 8.5-14GHz sellfor $127/MHz/yr in Sydney
(a bit high given nocongestion there shouldbe lowered to encourage
use)
● ODV well suited for: marginal changes in spectrum (marginal changes don’t affect revenues much) when downstream service can be supplied with various alternatives to the
spectrum (e.g. cellular) bands where spectrum is used for private applications and for which demand is
hard to forecast● NPV well-suited for:
services where marginal changes cannot be considered (e.g. Broadcasting) bands used by publicly-provided services (or formerly so) when there are no viable spectrum or non-spectrum alternatives to the used
spectrum
Suitability of OCP methods for different services
Freyens – spectrum pricing 17/20
● International regulatory constraints: International coordination of band planning global management regime OCP promotes the idea of multiple potential uses within bands If ITU restricts use within a band restricts OCP values as well
● Domestic regulatory constraints: in Australia, the BCS Act 1992 specifies a BLF based on income rather than OC no room for OCP (but some AIP through AL taxes punishing non-use)
● Technology constraints: spectrum generally non-fungible except for UHF
Constraints to OCP
Freyens – spectrum pricing 18/20
o Spectrum pricing is work in progress it is possible in practice to set ‘incentive’ prices using OCP these estimates are far from perfect and can do damage if estimated too high unclear if OCP can change the way public service users view spectrum usage
● Trading in primary and secondary markets remains the best way forward If spectrum markets are competitive and well-functioning
Conclusion
Freyens – spectrum pricing 19/20
Spectrum pricing
Freyens – spectrum pricing 20/20
THANK YOU