special issue on co injection for eor & geological sequestration files/co2_all papers.pdf ·...
TRANSCRIPT
INDIAN GEOPHYSICAL UNION
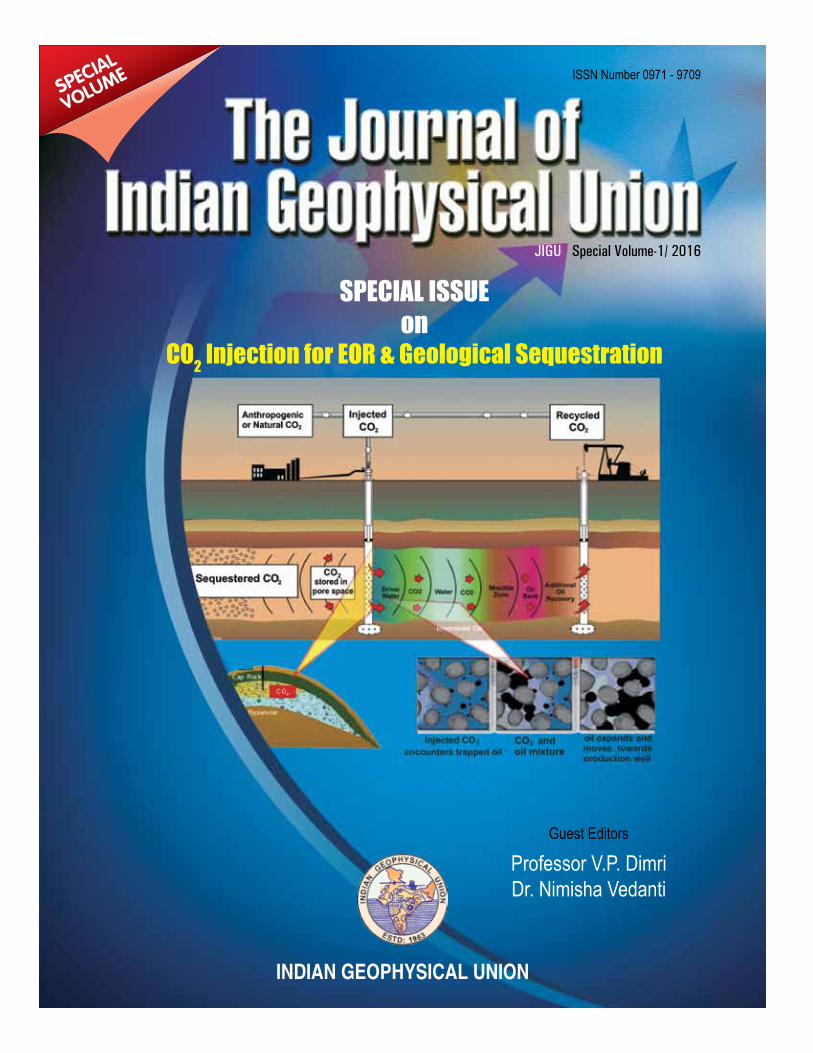
SPECIAL ISSUEon
CO2 Injection for EOR & Geological Sequestration
Guest Editors
Professor V.P. DimriDr. Nimisha Vedanti
SPECIAL
VOLUME
JIGU Special Volume-1/ 2016
ISSN Number 0971 - 9709
Journal of Indian Geophysical UnionEditorial Board
Indian Geophysical Union Executive Council
Chief Editor P.R. Reddy (Geosciences), Hyderabad
PatronHarsh K. Gupta, Panikkar Fellow, Hyderabad
Executive EditorsT.R.K. Chetty (Geology), Hyderabad
Rajiv Nigam (Marine Geology), Goa
Kalachand Sain (Geophysics), Hyderabad
PresidentShailesh Nayak, Distinguished Scientist, MOES, New Delhi
Vice- PresidentsS.W.A. Naqvi, CSIR-NIO, Goa
Y.J. Bhaskar Rao, CSIR-NGRI, Hyderabad
V.K. Dadhwal, NRSC, Hyderabad
S.C. Shenoi, INCOIS, Hyderabad
Assistant EditorM.R.K. Prabhakara Rao (Ground Water Sciences), Hyderabad
Editorial BoardD.N. Avasthi (Petroleum Geophysics), New Delhi
Archana Bhattacharya (Space Sciences), Mumbai
Umesh Kulshrestha (Atmospheric Sciences), New Delhi
T.M. Mahadevan (Deep Continental Studies), Ernakulam
Prantik Mandal (Seismology), Hyderabad
Ajay Manglik (Geodynamics), Hyderabad
O.P. Mishra (Seismology& Disaster Management), MoES, New Delhi
Walter D Mooney (Seismology & Natural Hazards), USA
Ranadhir Mukhopadhyay (Marine Geology), Goa
Malay Mukul (Mathematical Geology), Mumbai
S.V.S. Murty (Planetary Sciences), Ahmedabad
B.V.S. Murthy (Mineral Exploration), Hyderabad
Nandini Nagarajan (Geomagnetism), Hyderabad
P. Rajendra Prasad (Hydrology), Visakhapatnam
M.V. Ramana (Marine Geophysics), Goa D.P. Rao (Space Application), Hyderabad N.V. Chalapathi Rao (Geochemistry & Geochronology), Varanasi
P. Sanjeeva Rao (Agrometeorology & Climatology), New Delhi
Y.J. Bhaskar Rao (Geochronology), Hyderabad
S.P. Sharma (Geophysics), Kharaghpur
Surjalal Sharma (Atmospheric Sciences), USA
B.G. Siddharth (Planetary Sciences), Hyderabad
R.N. Singh (Theoretical & Environmental Geophysics), Hyderabad
R.P. Singh (Atmospheric Sciences), USA
Manik Talwani (Marine Geosciences), USA
Honorary SecretaryKalachand Sain, CSIR-NGRI, Hyderabad
Organizing SecretaryA.S.S.S.R.S. Prasad, CSIR-NGRI, Hyderabad
Joint SecretaryO.P. Mishra, MoES, New Delhi
TreasurerMohd. Rafique Attar, CSIR-NGRI, Hyderabad
Executive MembersA.K. Chaturvedi, AMD/DAE, Hyderabad
P. Sanjeeva Rao, DST, Delhi
Pushpendra Kumar, ONGC, Dehradun
S. Rajan, NCAOR, Goa
B. Madhusudhan Rao, OU, Hyderabad
Ashok P. Dimri, JNU, New Delhi
S.K. Subramanian, NRSC (Rtd), Hyderabad
Sanjay K. Jha, Omni Infoword Pvt. Ltd., Noida
S.S. Teotia, KU, Kurukshetra
D. Srinivasa Sarma, CSIR-NGRI, Hyderabad
B. Veenadhari, IIG, Mumbai
Rima Chatterjee, ISM, Dhanbad
P. Rama Rao, AU, Visakhapatanam
R.K. Mall, BHU, Varanasi
P. Sivasubramanian, Electrotek International, Chennai
V. Ramamurty, GSI, Hyderabad
Subrata Borgohain, DU, Dibrurgarh
Nimisha Vedanti, CSIR-NGRI, Hyderabad
EDITORIAL OFFICEIndian Geophysical Union, NGRI Campus, Uppal Road,
Hyderabad- 500 007Telephone: +91 -40-27012799; 23434631;
Telefax:+91-04-27171564E. mail: [email protected], website: www.j-igu.in
Ex- Officio MemberP. Koteswara Rao, CSIR-NGRI, Hyderabad
The Open Access Journal with four issues in a year publishes articles covering Solid Earth Geosciences; Marine Geosciences; and Atmospheric, Space and Planetary Sciences.
Annual SubscriptionIndividual Rs. 1000 per issue and Institutional Rs. 3500 for four issuesPayments should be sent by DD drawn in favour of “The Treasurer, Indian Geophysical Union”, payable at Hyderabad. For correspondence, please contact, Hon. Secretary, Indian Geophysical Union, NGRI Campus, Uppal Road, Hyderabad - 500 007, India; Email: [email protected]; Ph: 040 27012799
CONTENTS
Preface . . . . . . . . . . . . . . . . . . . . . . . . . . . . . . . . . . . . . . . . . . . . . . . . . . . . . . . . . . . . . . . . . . . . . . . . . . . . . 3
1. Carbon Dioxide Sequestration During Enhanced Oil Recovery: Operational and Economical Aspects G.P. Karmakar . . . . . . . . . . . . . . . . . . . . . . . . . . . . . . . . . . . . . . . . . . . . . . . . . . . . . . . . . . . . . . . . . . . . . . 5
2. Monitoring Microseismicity in Oil Boreholes J. R. Kayal . . . . . . . . . . . . . . . . . . . . . . . . . . . . . . . . . . . . . . . . . . . . . . . . . . . . . . . . . . . . . . . . . . . . . . . . . 13
3. Possibility of CO2 Sequestration in Basalt and Sub-Basalt Sediments in and Around
Peninsular India
K.S. Misra, A. Shukla and S. Niyogi . . . . . . . . . . . . . . . . . . . . . . . . . . . . . . . . . . . . . . . . . . . . . . . . . . . . . 16
4. Some Insights into Possible CO2 Sequestration in Subsurface Formations beneath Deccan Volcanic Province of India O.P. Pandey, N. Vedanti and S.S. Ganguli . . . . . . . . . . . . . . . . . . . . . . . . . . . . . . . . . . . . . . . . . . . . . . . . . 20
5. Investigation of Geomechanical and Rock Physics Aspects Related to Underground Storage and Monitoring of CO2
P. Cerasi, R. M. Holt, A. Lavrov, J. F. Stenebråten. . . . . . . . . . . . . . . . . . . . . . . . . . . . . . . . . . . . . . . . . . . 26
6. Visualizing Uncertainty in CO2 Plume Migration During SequestrationS. Srinivasan and H. Jeong . . . . . . . . . . . . . . . . . . . . . . . . . . . . . . . . . . . . . . . . . . . . . . . . . . . . . . . . . . . . 30
7. Coal Bed Methane Exploration and Possibility for CO2 Sequestration in Jharia Coalfield, IndiaR. Chatterjee and S. Paul . . . . . . . . . . . . . . . . . . . . . . . . . . . . . . . . . . . . . . . . . . . . . . . . . . . . . . . . . . . . . 37
8. Geochemical Modeling and Experimental Studies on Mineral Carbonation of Primary Silicates for Long-term Immobilization of CO2 in Basalt from the Eastern Deccan Volcanic ProvinceJ. P. Shrivastava, N. Rani and V. Pathak . . . . . . . . . . . . . . . . . . . . . . . . . . . . . . . . . . . . . . . . . . . . . . . . . . 42
9. Monte – Carlo Simulations: Permeability Variation with Fractal and Pore Structural Parameters U. Vadapali . . . . . . . . . . . . . . . . . . . . . . . . . . . . . . . . . . . . . . . . . . . . . . . . . . . . . . . . . . . . . . . . . . . . . . . . 59
10. Emerging Considerations about the Sustainability of CCS for EOR and other Downstream Applications: A Policy Perspective
R. Gopichandran. . . . . . . . . . . . . . . . . . . . . . . . . . . . . . . . . . . . . . . . . . . . . . . . . . . . . . . . . . . . . . . . . . . . 64
This is an open access Journal. One can freely DOWNLOAD contents from www.j-igu.in

We are pleased to present a special issue
of the Journal of the Indian Geophysical
Union entitled “CO2 injection for EOR
& Geological Sequestration”. This issue is based
on the papers presented at the Indo-Norwegian
conference on “CO2 Injection for EOR & Geological
Sequestration” held during November 26-28, 2013
at CSIR-National Geophysical Research Institute,
Hyderabad, India. The conference was jointly
organized by the CSIR-NGRI, Hyderabad and the
SINTEF Petroleum Research, Trondheim, Norway
under the aegis of the Norwegian Embassy in India.
CO2 injection for EOR has received a great attention
due to multifold benefits such as enhancing oil
recovery, possibility of CO2 sequestration in the
hydrocarbon reservoir and high tax savings in some
countries by earning carbon credits. In this method,
supercritical CO2 is injected into a reservoir through
injection wells ideally at a pressure equal to or above
the minimum miscibility pressure (MMP), so that
the CO2 and oil mix together to form a liquid that
flows easily to the production well. CO2 can also be
injected at a pressure below the MMP to swell the
oil and make it mobile, this method is known as
immiscible injection.
Global data shows that the CO2–EOR techniques
have a potential to increase the yield of depleting or
heavy oil fields, but in India this method has not been
applied to any oil field for commercial production
because of several operational reasons. Laboratory
studies carried out by the Oil & Natural Gas
Corporation Limited (ONGC Ltd.), India, indicated
that the recovery from depleting Ankleshwar oil field
situated in Cambay basin of India could be increased
by immiscible CO2 injection as miscible injection
required high MMP. Thus, a research project was
formulated by CSIR-NGRI in collaboration with the
SINTEF Petroleum Research, Trondheim, Norway to
Preface
estimate the CO2-EOR potential of the Ankleshwar
field with due support from the ONGC Ltd., India.
The project was sponsored by the Norwegian
Embassy, India and the Council of Scientific and
Industrial Research (CSIR), India. Major outcomes
of this project were two PhDs; one from Academy of
Scientific and Industrial Research (AcSIR) (Ganguli,
2016) and other from Osmania University (Vadapalli,
2016 (a)), a text book (Dimri et al., 2012) published
by Elsevier and many papers in scientific journals
(Vadapalli et al., 2014; Ganguli et al., 2016; Pandey
et al., 2016; Vadapalli, 2016 (b)).
The conference was organized by the project team to
disseminate the knowledge gained in this research
project. Total 32 papers from industry and academia
were presented during the conference; however,
10 full manuscripts, mainly from academia were
submitted for the publication. These 10 manuscripts
were initially reviewed by the conference organizing
committee and later by external experts, hence it
took a little longer than expected to bring out the
special issue. In this regard, we sincerely appreciate
the authors for contributing their work to this special
issue and for patiently revising the manuscripts to
meet the suggestions of the referees. We also thank
our learned reviewers for their valuable time.
Since the theme of the conference was based on
CO2 injection, most of the papers published in this
volume are related to the technical aspect of CO2
sequestration and CO2 Enhanced Oil Recovery;
however, one paper is based on the policy related
aspects of Carbon Capture and Storage (CCS). The
topics covered in this special issue include basic
concepts of CO2 injection, injection related micro-
seismicity, CO2 sequestration in Deccan volcanics,
study of leakage risks associated with the CO2
sequestration and estimation of uncertainty in the
migration of the CO2 plume in the reservoir. We
4
have made an attempt to bring together some of the
insightful papers, covering most of the aspects of the
CO2 injection.
During the United Nations Climate Change
Conference held in Paris in 2015, Government of
India committed to reduce green-house gas emissions
to 33-35% per cent of 2005 levels by 2030. This
implies that in near future, there is ample scope of
research in this field. We hope that this special issue
of the Journal of Indian Geophysical Union entitled
“CO2 Injection for EOR & Geological Sequestration”
will make a good reference material on this topic and
be of great use for Geophysicists.
We acknowledge the Norwegian Embassy in India
and our parent organization CSIR for financial
support, ONGC Ltd. for data, our project team that
includes Idar Akervoll, Per Bergmo, Szczepan Polak,
Ravi Prakash Srivastava, Biswajit Mandal, Ranjana
Ghosh, Pallavi Banerjee, Uma Vadapalli and Shib
Ganguli, for their scientific contributions and our
support staff P. Nagarjuna, Deepak Kumar and
Ahmad for their assistance. Our special thanks are
due to Dr. P.R. Reddy, who critically reviewed the
final version of the manuscripts. We also thank Prof.
Reddy (CEFL), Dr. MRKP Rao and Dr. O.P. Pandey for
their suggestions. We are grateful to the then director
Professor Mrinal K. Sen for his support.
V.P. Dimri,
Nimisha Vedanti
REFERENCES:
Chattopadhyay, P. B., & Vedanti, N., 2016. Fractal Characters of
Porous Media and Flow Analysis. In Fractal Solutions for
Understanding Complex Systems in Earth Sciences (pp.
67-77). Springer International Publishing.
Dimri, V.P., Srivastava, R. P., & Vedanti, N., 2012. Fractal models
in exploration geophysics: applications to hydrocarbon
reservoirs (Vol. 41). Elsevier.
Ganguli, S.S., 2016. Integrated reservoir studies to understand CO2-
enhanced oil recovery and sequestration process in a mature
oil field, Cambay basin, India (Doctoral dissertation), 2016.
Ganguli, S.S., Vedanti, N., Akervoll, I., and Dimri, V.P., 2016.
Assessing the Feasibility of CO2-Enhanced Oil Recovery and
Storage in Mature Oil Field: A Case Study from Cambay
Basin.Journal of Geological Society of India.
Ghosh, R., Sen, M. K., & Vedanti, N., 2015. Quantitative
interpretation of CO2 plume from Sleipner (North Sea), using
post-stack inversion and rock physics modeling. International
Journal of Greenhouse Gas Control, 32, 147-158.
Pandey, O.P., Vedanti, N., Ganguli, S.S., 2016. Some Insights
into Possible CO2 Sequestration in Subsurface Formations
beneath Deccan Volcanic Province of India. Journal of Indian
Geophysical Union, Current Issue, 20-25.
Srivastava, R. P., Vedanti, N., Akervoll, I., Bergmo, P., Yerramilli,
R. C., Yerramilli, S. S., & Dimri, V. P., 2015. Study of CO2
EOR in a Sector Model from Mature Oil Field, Cambay
Basin, India. In Petroleum Geosciences: Indian Contexts
(pp. 87-98). Springer International Publishing.
Vadapalli, U., 2016 a. Fractal based permeability modeling and
time – lapse seismic response evaluation using well log data
for reservoir characterization and CO2–EOR study (Doctoral
dissertation).
Vadapalli, U., 2016 b. Monte – Carlo simulations: Permeability
variation with fractal and pore structural parameters. Journal
of Indian Geophysical Union, Current Issue, 59-63.
Vadapalli, U., Srivastava, R. P., Vedanti, N., & Dimri, V. P., 2014.
Estimation of permeability of a sandstone reservoir by a
fractal and Monte Carlo simulation approach: a case study.
Nonlinear Processes in Geophysics, 21(1), 9-18.
Carbon Dioxide Sequestration During Enhanced Oil Recovery: Operational and Economical Aspects
5
Carbon Dioxide Sequestration During Enhanced Oil Recovery: Operational and Economical Aspects
G.P. Karmakar Department of Mining Engineering, Indian Institute of Technology, Kharagpur – 721302, INDIA.
E-mail: [email protected]
ABSTRACTRising oil prices coupled with continuously declining conventional oil production has led to significant use of Enhanced Oil Recovery (EOR) methods. Extensive laboratory studies, pilot projects and real field evaluations of the potential EOR methods have proved that the upcoming carbon dioxide flooding is one of the most promising recovery methods, which is being used on a large scale in many countries including the U.S., Canada and U.A.E. Carbon dioxide injection is being done in different modes: in miscible, near miscible or immiscible forms after water flooding as an EOR method, as a secondary displacement method, for producing well stimulation and for carbonated water flooding. During the CO2 sequestration, CO2 is retained in the reservoir by increasing its physical trapping or solubility in reservoir fluids, whereas during CO2 - EOR process, oil recovery is maximized with a minimum amount of retention of CO2 in the reservoir.
This paper presents a comprehensive review on the current status of CO2 flooding processes with a critical analysis of latest CO2 flooding projects featuring recent developments and operational problems and their solutions associated with those processes.
INTRODUCTION
The use of carbon dioxide as an oil-displacing agent has been investigated for many years and used for recovering oil from hydrocarbon reservoirs during 1920-1930 (Mangalsingh and Jagai, 1996). Extensive laboratory studies, pilot projects and field studies have further confirmed the efficacy of the technique in enhanced recovery of oil (Holm and Josendal, 1974). In 1945, Poettmann and Katz discussed the phase behavior of CO2 and paraffin systems. Their studies indicated that for heavier crude, the increase in oil volume is normally between 10-22% and the viscosity reduction is up to less than 0.1 of the original value. The high solubility of CO2 in oil and resultant reduction in viscosity attracted the investigators to study this process in laboratory. The investigations included fluid injection processes using continuous CO2 or a single slug of CO2 followed by water or carbonated water (Holm, 1987). The first successful process was carried out in 1958 at Oklahama (Khatib et al., 1981). In the 1950’s and 60’s, the application of CO2 was primarily as a miscible displacing fluid and certain limitations in the process were realized. These limitations led to concerted investigations on CO2, for immiscible displacement . Field applications of immiscible CO2 were carried out in the 1970s. Due to certain deficiencies in continuous CO2 process, the water alternating gas (WAG) process was introduced in the 1980s. A comprehensive review of the immiscible process in heavy and light oil reservoirs was done by earlier researchers (Khatib et al., 1981). Recently, enhanced oil recovery using carbon dioxide has become one of the most popular investigations among the researchers and the oil producers.
MOST COMMON TYPES OF CO2 FLOODING
Elaborated studies of phase behavior and CO2 flood performance in laboratories and fields have brought into light certain mechanisms by which CO2 displaces oil. These mechanisms in general are related to the phase behavior of CO2-crude oil mixes.
These are: (1) immiscible CO2 drive, (2) hydrocarbon-CO2 miscible drive, (3) hydrocarbon vaporization, (4) direct miscible CO2 drive and, (5) multiple contact dynamic miscible drive.
HOT CO2 FLOODING
A new CO2 - EOR technique “Hot CO2 Flooding” is being worked out these days in Bati Raman heavy oil field in Turkey. This technique (Picha, 2007; Issever et al., 1993) is a combination of thermal and solvent techniques, wherein the hot CO2 heats the reservoir and reduces oil viscosity. This enables partial miscibility with the oil, thus leading to improvement in oil mobility and recovery factor. The operating temperature of hot CO2 is decided according to the reservoir temperature and oil property and is kept above the critical point in CO2 phase diagram. Hot CO2 can similarly be injected in different ways such as continuous injection, alternating with water injection or followed by steam injection. According to the theoretical calculations, the ultimate recovery increased from 10% in case of conventional CO2 flooding to 13% in case of hot CO2 flooding, due to marginal reduction in oil viscosity and increase in swelling factor.
J. Ind. Geophys. Union (January 2016)Special Volume-1/ 2016 pp: 5-12
G.P. Karmakar
6
WATER-ALTERNATING-GAS (WAG) PROCESS
Water-alternating-gas (WAG) process is a combination of two traditional techniques of improved hydrocarbon recovery: water flooding and gas injection, which can be defined as a short-cycle alteration of definite ratios of water and CO2. The first field application of WAG is attributed to the North Pembina field in Alberta, Canada, by Mobil in 1957. Laboratory models (Rogers and Grigg, 2001) developed early in the history of flooding showed that simultaneous water/gas injection had sweep efficiency as high as 90% compared to 60% for gas alone. The displacement mechanism caused by the WAG process occurs in a three phase regime; the cyclic nature of the process creates a combination of imbibition and drainage (Christensen et al., 2001). Optimum conditions of oil displacement are achieved if the gas and water have equal velocity in the reservoir. Important technical factors affecting WAG performance that have been identified are heterogeneity, wettability, fluid properties, miscibility conditions, injection techniques, WAG parameters, physical dispersion, and flow geometry (Surguchev et al., 1992).
OTHER METHODS
Another method was introduced where mobility control could be achieved by adding one or more of certain surface active chemicals to carbon dioxide, which is either in a liquid or supercritical state, before it is injected into wells (Heller et al., 1983). The surface active chemicals have sufficient solubility in dense carbon dioxide to cause water that is already present in the oil reservoir to emulsify with the carbon dioxide. The emulsion decreases the mobility of the injected carbon dioxide. Upon continued injection of carbon dioxide, flow is diverted to other less permeable zones of the reservoir or away from the top of the reservoir thereby improving the vertical conformance of the carbon dioxide flood and substantially increasing the oil recovered by the flooding process. In some cases carbon dioxide flooding is carried out with a premixed transition zone of carbon dioxide and crude oil components. This method consists of injecting into the formation a premixed transition zone slug comprising carbon dioxide and said crude oil components at said critical concentrations, formation temperature and said selected pressure; and injecting a drive fluid into the formation after the premixed transition zone slug (Heller et al., 1982).
In order to identify a potential reservoir for CO2
flooding, a screening criteria based on technical as well as economic factors may be helpful. The reservoirs are screened for economic feasibility according to capital costs, operation expenses, availability of CO2 and then ranked based on the economics, namely ratio of derived revenue based on day to day international market rates
and production costs. Prior to proceeding with the pilot production operations, appropriate coring, core analyses, and logging operations were carried out to evaluate certain parameters, which were compared with the performance of a pilot field test.
LATEST CO2 FLOODING PROJECTS
It has been reported that the total number of CO2 projects in operation so far has increased in the U. S. and worldwide (Moritis, 1996). Recently, the promising results of two gas injection pilot initiatives of a full field non-miscible gas injection schemes, implemented in a carbonate reservoir in Abu Dhabi, U. A. E., have been reported (Shedid et al., 2007). The study stressed the importance of a detailed reservoir characterization and maximum flexibility in the development design and close monitoring of the reservoir response. Of the four immiscible CO2 pilot floods conducted in Trinidad from 1973 to 2003 (Mohammed-Singh and Singhal, 2004), one project with a large throughput of CO2, indicates incremental oil recovery between 2-8% of the OOIP with predicted ultimate recoveries of 4-9% of the original-oil-in-place (OOIP). The projects were conducted in a gravity stable mode after primary, secondary and tertiary production (after natural gas and water injection). Cumulative CO2 utilizations improved with efficient production practices and ranged from 3-11 MCF/bbl till 2003. In this field, oil recovery improved as more production wells were added downstream of the injection wells. In some of the projects, production increase was observed even after discontinuation of CO2 injection (supply interruptions) aided by water influx and gravity stabilization. It was concluded that immiscible gas injection projects should be implemented with special attention to GOR control at the producers, and also the gas injection rates should be selected such that oil contributions from CO2 injection as well as water influx are optimized. Evaluation of the application of CO2 injection into a Norwegian oil reservoir showed that this application produced 63 % of initial-oil-in-place (IOIP) while water injection recovered 43 % IOIP (Lindeberg and Holt, 1994). The increment in oil recovery by miscible flooding was attributed to improvement in displacement efficiency and reduction in oil viscosity. A review of twenty-five CO2 projects as a maturing EOR process indicated that the application of CO2 floods provided good increments in oil recovery (Grigg and Schechter, 1997). The study presented some concerns about high mobility of CO2 and its early breakthrough. The study also indicated that most of the newer floods and some older floods increased CO2 slug size, injected CO2 continuously till CO2 breakthrough, and then converted to water-alternating-gas (WAG) process. It has been observed that miscible CO2 flooding might recover up to 8 % to 16 % of the OOIP depending on the
Carbon Dioxide Sequestration During Enhanced Oil Recovery: Operational and Economical Aspects
7
reservoir depth and other peculiarities of the reservoir and the crude oil characteristics. The study also indicated that maximum CO2 flood recovery could be plus 10 % of OOIP after matured water flooding recovery (Jeschke et al., 2000). A case study of the Dulang field in Malaysia was carried out to evaluate the CO2 injection. The study included phase behavior studies, vaporization test and core displacement tests. The results indicated that 15 % of the initial stock oil in place was produced using CO2 flooding at the initial reservoir pressure of 1800 psig. The study also showed that the application was capable of extracting components heavier than heptanes (Zain et al., 2001). Using recombined fluid in a slim tube to determine the Minimum Miscibility Pressure (MMP) under different gas-oil ratio (GOR) and CO2 concentrations proved that the main factors to enhance the oil recovery in CO2 flooding were the oil swelling and the viscosity reduction (Yongmao et al., 2004). In the Neuquén Basin in west-central Argentina, with no prior CO2 injection, viability and prospects of immiscible CO2 flooding process in the Avile reservoir were found to be favorable with the results of core flood evaluation, compositional simulation and evaluation of facility requirements (Brush et al., 2000). This project was innovative in the sense that it assessed the feasibility of extracting previously vented CO2 and injecting it again to recover additional oil and at the same time reduce green house gas emissions .The estimated increase in oil recovery was 4% of OOIP and the potential greenhouse gas emission reduction ranges from 185,000 to 714,000 carbon equivalent metric tons. Asghari et al., (2006) designed a model to predict the performance of CO2 flooding in this field based on the data obtained from past water flooding performance and CO2 rate injection by developing a correlation. It is estimated that implementation of CO2
flood would extend the economical life of the field more than 25 years, with an incremental recovery prediction of 13% to 19%. The limitation in applying this correlation is that it can be applied only to existing CO2 flood area, since the two correlations developed require some post-CO2 flood data to develop constants. These correlations provide a very fast and practical method for determining the expansion area of an existing CO2 flood operation. A recent example of the significance of this process can be seen in the Spraberry Trend area of West Texas (Montgomery et al., 2000), once known as the "largest uneconomical field in the world," which contains as much as 10 billion bbl of original oil in place. Despite five decades of production, including several large-scalewater flood projects, recovery from the Spraberry rarely exceeded 8-12%. A significant new effort has been launched to correct this situation and to evaluate the efficiency and economics of using CO2 flooding to enhance recovery from Spraberry reservoirs. Laboratory study of
CO2 gravity drainage in Spraberry core suggests that significant additional oil can be recovered in this manner. Recently, a new approach (Liu et al., 2004) of studying the progress of carbon dioxide in reservoirs using ultrasound has been introduced. This may lead to unique monitoring the position of carbon dioxide, as well as visualizing the reality of the oil producing area. The problem of identifying the position and location of the immiscible or miscible layer is a critical issue in the method of carbon dioxide injection for oil producing bodies. Accurate knowledge of the position could lead to an ability to control the position of the carbon dioxide front affecting production, efficiency, economy, and in the end profitability. Some measures of digital signal processing are introduced to obtain position information of interfaces in porous medium and improve the resolution and accuracy of the location. Ultrasound has many advantages as a tool in underground probing, such as small size, low power consumption and safety.
CO2 - EOR has been used by the oil and gas industry for over 40 years, but only recently has its potential as a carbon sequestration method been realized and investigated.
Currently, CO2 - EOR comprises approximately more than 37 percent of all EOR being performed in the United States and it has been a leader in developing and using technologies for CO2 - EOR by performing approximately 96 percent of worldwide CO2 - EOR.
OPERATIONAL PROBLEMS IN THE FIELD
CORROSION
Carbon dioxide in the presence of water forms carbonic acid ,which produces corrosive environment. The corrosion can be minimized by having a separate injection facility for both these fluids, by using corrosion inhibitors and by using stainless steel wellheads and downhole equipments. The carbon dioxide should also be dehydrated at the source before it is compressed and transported (IPCC, 2005).
ASPHALTENE DEPOSITION IN CO2 FLOODS
Asphaltenes are believed to exist as colloidal suspension in oil, stabilized by resins present and are in equilibrium with oil at reservoir condition. This equilibrium gets disturbed during production mainly due to pressure and temperature reductions and introduction of miscible gases and solvents, thus leading to loss in production and failures of Electrical Submersible Pumps (ESP), safety valves and other downhole equipment. In general, as more gas dissolves into the crude oil, the asphaltenes problem increases (Tin and Yen, 2000). In order to curb this problem several chemical inhibitors were introduced.
G.P. Karmakar
8
HANDLING OF THE PRODUCED CARBON DIOXIDE
The best solution to this is re-injection of CO2 in the reservoirs to reduce the volume of CO2 to be procured (Necmettin, 1991). It can be injected without processing or after separating it from associated gases. Finally all such proposals may be considered only after the economics of the processes are studied thoroughly.
SCIENCE AND ENGINEERING REQUIREMENTS FOR GEOLOGICAL CO2 SEQUESTRATION
CO2 sequestration in geological formations requires proper site selection, effective monitoring, and remediation options should a CO2 release occur. Much information about subsurface reservoirs has been obtained from oil and gas fields, natural CO2 reservoirs, and subsurface storage facilities for natural gas and other fluids. The knowledge from these geologic storage examples is extremely valuable (Friedmann, 2007). However, they need to be complemented with additional information, specific to CO2 properties, to ensure the selection and monitoring of a safe storage site.
Wells for CO2 sequestration need more demanding specifications 1. Temperature and pressure may be higher under the
bottom hole conditions2. Routine maintenance and repair or replacement of
the well equipment may be less acceptable, so, higher integrity in designs expected
3. Well service lives may be longer4. Leak tolerance during well servicing should be
minimum;5. Integrity should be maintained in every stage of well
design and construction, operation, monitoring, work over, suspension and abandonment.
Some areas for additional studies are1. Geochemical and Petrophysical Studies of the CO2-
Fluid-Rock System2. Geomechanical Aspects of Injections3. Basin-Scale Modeling of CO2 Distribution4. Isotropic Tagging of Injected CO2
5. Geophysical methods will play a key role in the monitoring. Developing sensitive and cost effective methods for long-term monitoring is an important part of sequestration.In Salah Project in Algeria and the Sleipner Project
in Norway, the CO2 that was removed from a natural gas sales stream was being injected into saline aquifers, rather than being vented to the atmosphere. CO2 enhanced oil recovery in Weyburn project in Canada captured CO2
from a gasification plant. The West Texas Permian Basin projects relied upon naturally occurring CO2 from reservoirs (Herzog, 2010; NETL, 2014).
ECONOMIC DECISIONS DEPEND PRIMARILY ON
i. Price of oilii. Cost of capital (interest rates) and capital infrastructure
construction (drilling, gas processing, pipelines)iii. Cost of carbon emission taxes, or conversely, the value
of carbon sequestration creditsiv. Cost of carbon dioxide capture from anthropogenic
sourcesv. Pilot project results andvi. Speed of technology advancement and dissemination
PROPOSED PETROLEUM R&D PROGRAM
i. To Evaluate and enhance carbon dioxide flooding through sweep improvement.
ii. Improve CO2 flooding sweep using CO2 gels. iii. Conduct CO2 injection tests to improve the reliability
of computer simulations of oil fields from CO2-EOR and calculations of sequestration capacity.
iv. Determine the economic and technical feasibility of using CO2 miscible flooding to recover oil in a selected oilfield.
v. Employ molecular modeling and experiments to design inexpensive, environmentally benign, CO2-soluble compounds that can decrease the mobility of CO2 at reservoir conditions.
vi. Develop a neural network model for CO2 - EOR.vii. Develop a novel, low cost method to install geophones
for CO2 monitoring.
MARKET AND PRICE FOR CO2
CO2 - EOR production is linked to the price of oil; and rising oil prices have increased the demand for CO2. The price of CO2, strongly influenced by regional constraints in supplying CO2, also increased with rising demand during this period. In the United States alone, the oil and gas industry operates over 13,000 CO2 - EOR wells, over 3,500 miles of high pressure CO2 pipelines, has injected over 600 million tons of CO2 (11 trillion standard cubic feet) and produces about 245,000 barrels of oil per day from CO2 - EOR projects (Hargrove, 2006).
According to The Energy Information Administration (EIA) (2012) and International Energy Agency (IEA) (2011a),as oil prices will continue to increase over the next decade there will be increasing demand for CO2 leading to increased CO2 supplies. In the US the supply of CO2 is expected to increase by 50 per cent by 2015 relative to
Carbon Dioxide Sequestration During Enhanced Oil Recovery: Operational and Economical Aspects
9
2010 production levels, and could potentially double by 2020 (EIA 2012). More than half this growth will come from A-CO2 ,which will become increasingly important during the following decade.
The average rate of use of CO2 in the US is estimated to be 0.5 tonnes of CO2/barrel of oil in 2011. This is an increase from 0.3–0.4 t CO2/barrel of oil for some projects as described by earlier studies (Global CCS Institute, 2012). With increasing pipeline investments to relieve supply constraints, together with additional A-CO2 supply sources being developed, it is expected that over the medium term CO2 prices will be set by these low-cost anthropogenic sources.
ECONOMIC SUMMARY
Capex: 8% of oil price per barrel;CO2 cost: 2.5% of oil price per MCF;Pay out: 5 years;IRR: 20%
Cost of CO2 injection, in general ranging from $60 per ton to higher values based on 2008 data (Jahangiri and Zhang, 2011), depending upon capture process applied, volume of CO2, distance from source to sink and some other site-specific characteristics.“Next generation” CO2 - EOR technologies, primarily focused on increasing oil production, could create between 165 and 366 Gt of CO2 storage capacity, while producing 705 to 1,576 billion barrels of incremental oil. Assuming emissions of 6.2 million metric tons/year over 40 years of operation per plant could result in storing the emissions associated with 2,200 to 4,900 one-GW size coal-fired power. This capacity is sufficient to store 18% to 40% of global energy-related CO2 emissions from 2010 to 2035. “Next generation” CO2 - EOR technology stores 14% to 18% more CO2, and produces 47% to 50% more oil than “state-of-the-art” technology. Recent developments in the Permian Basin indicate that there may be vast, previously unrecognized opportunities for additional oil production from the application of CO2-EOR, besides providing additional capacity for storing CO2 (US DOE/NETL,2010).
This potential exists in residual oil zones (ROZs) below the oil/water contact in traditional oil reservoirs that are widespread and rich in oil saturation. In addition to the traditional main pay portion of depleted oil fields, they represent a second potentially much larger CO2 storage option. Field pilots have shown that applying CO2 - EOR in ROZs appears to be commercially viable. This may result in a two-to-three fold increase in the potential storage capacity associated with the application of CO2 - EOR. Other approaches to increase CO2 storage in conjunction with CO2 - EOR may further increase storage capacities associated with such applications.
CCS ACTIVITIES IN VARIOUS COUNTRIES
AlgeriaA CCS project is in operation (Wright, 2007).
Botswana Initial assessments on role and opportunity for CCS, undertaking preliminary geologic assessment (Seiphemo, 2014).
Brazil A Centre of Excellence in CCS R&D has been established. Completed a Geographic Information System (GIS)-based database of CO2 sources and sinks. Pilot CO2 injection program underway, reviewing and refining Brazilian Carbon Geological Sequestration Map (CARBMAP) program (Brazil, 2014).
ChinaCCS has been adopted as a key GHG mitigation technology in National Climate Change Program. Numerous domestic R&D initiatives and efforts are underway to assess and characterize CO2 storage capacity by Chinese Geological Survey. Several pilot projects for CO2 capture and CO2 - EOR, 11 large-scale integrated demonstration projects in the planning stages. (Seligsohn et al., 2010).
Egypt A study is underway assessing potential for CCS in gas processing and power industry, identifying barriers and environmental impacts( Egypt, 2013).
IndiaIn India, Institute of Reservoir Studies, Oil & Natural Gas Corporation, Ahmedabad, has been carrying out laboratory simulation and pilot scale studies. Western region onland light oilfields have been chosen to be first candidate for the carbon dioxide flooding programme. Under Indo Norwegian collaboration program CSIR-NGRI and SINTEF Petroleum Limited, Norway has carried out reservoir modeling & simulation study for the CO2 - EOR potential of declining Ankleswar Oil Field, with the support of ONGC. (Dimri et al., 2012).
IndonesiaA study is being finalized on potential for CCS as part of South East Asia CCS Scoping Study, including opportunities for deployment, regulatory and economic analysis. After the assessment of current CCS R&D activities and technical capacity of the domestic industry to provide support throughout the CCS chain, developing a CCS Technology Roadmap for preliminary studies on CCS and EOR (Takahashi, 2015).
G.P. Karmakar
10
JordanA study is underway to assess the potential for CCS in oil shale development strategy and to identify and address legal, regulatory, and financial barriers (World Bank. 2012).
KenyaThere is an investigating possibility for high-level storage study.Workshops and training on CCS technology are being conducted (Kenya, 2012).
KosovoA study is completled for preliminary geologic potential and capacity-building assessment including legal and regulatory requirements (Kulichenko,N. and Ereira, E., 2011).
MexicoCCS identified in Special Program on Climate Change and National Energy Strategy 2012–26. Country-level preliminary assessment of CO2 storage potential completed, pilot projects being considered, including for CO2 capture with a focus on EOR (McCoy, 2014).
MaghrebA study is underway to assess the potential for carbon capture on projected and existing power plants in Tunisia, Algeria and Morocco for CO2 geologic storage and transportation at a regional scale (Kulichenko,N. and Ereira, E., 2011).
Malaysia Several CCS workshops were conducted for raising awareness and discussing key issues. A study was completed on the long-term role for CCS, opportunities for near-term deployment, technical and financial feasibility, and next steps for further investigation. Capacity-building program developed and activities being implemented (Kulichenko,N. and Ereira, E., 2011).
NorwaySleipner (Norway) is the world’s first successful demonstration of CCS technology into a deep saline reservoir and remains the only development where the CO2 is both captured and injected offshore. The captured CO2 is compressed and injected (via one injector well on the Sleipner A platform) into the Utsira Formation, a sandstone reservoir 250 metres / 820 feet thick. The reservoir unit is at a depth of 800-1,100 metres / 2,625-3,610 feet below the seabed. The seal to the reservoir is provided by a 700 metre / 2,430 feet thick gas-tight caprock above the Utsira Formation (Kulichenko,N. and Ereira, E., 2011).
Philippines A Study is being finalized on potential for CCS as part of South East Asia CCS Scoping Study, including opportunities
for deployment, regulatory and economic analysis (Asian Development Bank, 2013).
Saudi ArabiaHas identified CCS as an appropriate low emission technology, Workshops and roundtable discussions were held and sponsored on CCS, including on monitoring and storage specifically, challenges and opportunities. Working towards a EOR-CCS project (Lui et al., 2012).
South Africa CCS identified as a priority in national White Paper on National Climate Change Response, South African Centre for CCS established, Storage Atlas completed, further basin-specific storage studies underway, scoping study for test injection project being developed. Legal and regulatory review undertaken and further work commenced (Beck et al., 2013).
ThailandA study being finalized on potential for CCS as part of South East Asia CCS Scoping Study, including opportunities for deployment, regulatory and economic analysis( Asian Development Bank, 2013).
Trinidad and TobagoCCS Scoping Study, including Legal and Regulatory Review (Kulichenko,N. and Ereira, E., 2011).
United Arab EmiratesThree industrial CCS projects in the planning stages (in the hydrogen, steel, and aluminum industries) (Havercroft, I. et al., 2011).
VietnamStudy being finalized on potential for CCS as part of South East Asia CCS Scoping Study, including opportunities for deployment and regulatory and economic analysis (Asian Development Bank, 2013).
CONCLUSIONS
1. Carbon dioxide flooding is one of the most attractive processes for enhancing the recovery of oil ,which can also capture part of the carbon dioxide and help in reducing greenhouse gas emission. India should apply this EOR process for its oilfields.
2. Besides laboratory injection studies, investigation of rock and fluid properties of the candidate reservoir with specific studies on wettability, dissolution, precipitation, particle invasion/migration, residual oil saturation on trapped gas saturation, contact time, mass transfer are to be carried out before taking up a pilot project.
Carbon Dioxide Sequestration During Enhanced Oil Recovery: Operational and Economical Aspects
11
3. Finally, the economic viability of any such project should be studied thoroughly before its field application.
ACKNOWLEDGEMENTS
Author expresses his thanks to anonymous reviewer for useful inputs in refining the manuscript.
REFERENCES
Asghari, K., Dong, M., Shire, J., Coleridge, T., Nagrampa, J., and
Grassick, J., 2006. Development of a correlation between
performance of CO2 flooding and the past performance
of water flooding in Weyburn Oil Field. Paper SPE 99789
prepared for presentation at the 2006 SPE/DOE Symposium
on Improved Oil Recovery held in Tulsa, Oklahoma, U.S.A.,
April, 22-26.
Asian Development Bank, 2013. (www.adb.org) Prospects for
carbon capture and storage in Southeast Asia. Mandaluyong
City, Philippines: ISBN 978-92-9254-290-0.
Beck,B., Surridge, T. and Hietkamp,S.2013.The South African
Centre for Carbon Capture and Storage Delivering CCS in
the developing world. Energy Procedia 37 ( 2013 ) pp.6502
– 6507.
Brazil, 2014. Brazilian atlas of CO2 capture and geological storage
[recurso eletrônico] / org. João Marcelo Medina Ketzer ...
[et al.]. –Dados eletrônicos. – Porto Alegre : EDIPUCRS,
2014.66 p.
Brush, R. M., Davitt, H. J., Aimar, O. B., Arguello, J., and
Whiteside, J. M., 2000. Immiscible CO2 flooding for
increased oil recovery and reduced emissions Paper SPE
59328 presented at the SPE/DOE Improved Oil Recovery
Symposium, Tulsa, OK, U.S.A., April, 3-5.
Christensen, J.R., Stenby, E.H., and Skauge, A., 2001. Review
of WAG Field Experience, SPE Reservoir Evaluation &
Engineering Journal, April 2001, v. 4(2), pp: 97-106.
Dimri, V.P., Srivastava, R.P., and Vedanti, N., 2012. Fractal Models
in Exploration Geophysics: Applications to Hydrocarbon
Reservoirs. 1st ed. Elsevier Science 41, ISBN: 978-0-08-
045158-9.
Egypt, 2013. Assessment of CCS potential in Egypt. www.
environics.org/projects/ccs_418.pdf.Friedmann, S. J., 2007. Geological Carbondioxide Sequestration.
Elements , Vol. 3, pp: 179-184.
Global CCS Institute 2012, The Global Status of CCS: 2012,
Canberra, Australia. ISBN 978-0-9871863-1-7.
Grigg, R.B., and Schechter, D.S., 1997. State of the industry in
CO2 floods. Paper SPE 38849 presented at the SPE Annual
Technical Conference and Exhibition, San Antonio, Texas,
USA, October, 5-8.
H. C. de Coninck, M. Loos, and L. A. Meyer (eds.)]. Cambridge
University Press, Cambridge, United Kingdom and New
York, NY, USA, 442 pp.
Hargrove B.,2006. “Upcoming U.S. CO2 - EOR Projects”,
4th Annual EOR Carbon Management Workshop, The
Woodlands Waterway Marriott Hotel and Conference Center,
Houston, Texas, Dec 4 - 5, 2006.
Havercroft, I., Macrory, R.B. and Stewart, R.B. Carbon Capture
and Storage: Emerging Legal and Regulatory Issues. Hart
Publishing Ltd. Oxford, 2011.
Heller, J., Cheng, L., and Kuntamukkula, M., 1982. Foam-like
dispersions for mobility control in CO2 floods. Paper
SPE 11233, presented at the 57th Annual Fall Technical
Conference and Exhibition of the SPE of AIME, New
Orleans, LA, September, 26-29.
Heller, J. P., Dandge, D. K., Card, R. J. and Donarume, L. G.,1983.
Direct thickeners for mobility of CO2 floods. Paper SPE
11789, SPE of AIME, June, 1983.
Holm, W.L., 1987. Evolution of the carbon dioxide flooding
processes, Journal of Petroleum Technology, Vol. 39 (11),
pp: 1337-1342.
Holm, W. L. and Josendal, V.A., 1974. Mechanisms of oil
displacement by carbon dioxide. Journal of Petroleum
Technology, December 1974, pp: 1427-38.
Herzog, H.J., 2010. Scaling up carbon dioxide capture and
storage: From megatons to gigatons, Energy Econ. (2010),
doi:10.1016/j.eneco.2010.11.004.
IPCC, 2005: IPCC Special Report on Carbon Dioxide Capture
and Storage. Prepared by Working Group III of the
Intergovernmental Panel on Climate Change [Metz, B., O.
Davidson,
Issever, K., Pamir, A. N., Tirek, Ali., 1993. Performance of a
Heavy-Oil field under CO2 injection, Bati Raman, Turkey,
SPE Reservoir Engineering, v. 8(4), pp: 256-260.
Jahangiri, H.R., and Zhang, D., 2011. Optimization of the net
present value of carbon dioxide sequestration and
enhanced oil recovery. Paper OTC 21985, presented at the
Offshore Technology Conference, Houston, Texas, USA,
May, 2–5.
Jeschke, P.A., Schoeling, L., and Morgan, K., 2000. CO2 flood
potential of California oil reservoirs and possible CO2
sources, presented at the 2000 SPE/AAPG Western Regional
Meeting, Long Beach, CA. June, 19-23.
Kenya, 2012. www.cslforum.org/publications/documents/SPIR0912.
pdf.
Khatib, Ala K., Earlougher, R.C., and Kantar, K., 1981. CO2
injection as an immiscible application for enhanced recovery
in heavy oil reservoirs. Paper SPE 9928 presented at the
1981 California Regional Meeting in Bakersfield, California,
March 25-26.
Kulichenko,N. and Ereira, E., 2011.Carbon Capture and Storage
in Developing Countries: A Perspective on Barriers to
Deployment, 2011. The World Bank, Washington, DC.
Lindeberg, E., G, B., and Holt, T., 1994. EOR by miscible CO2
injection in the North Sea. Paper SPE/DOE 27767, presented
at the SPE/DOE Ninth Symposium on Improved Oil
Recovery, Tulsa, OK, April, 17-20, pp: 345-360.
Liu,H., Tellez, B. G., Atallah, T. and Barghouty, M. The role of
G.P. Karmakar
12
CO2 capture and storage in Saudi Arabia’s energy future.
International Journal of Greenhouse Gas Control 11 (2012)
pp.163–17.
Liu, N., Paranjape, R., and Asghari, K., 2002. Underground
ultrasound probing for monitoring carbon dioxide flooding
in oil producing reservoirs, Electrical and Computer
Engineering, 2002, IEEE, CCECE, 2002, Canada, v. 1, pp:
510-514.
Mangalsingh, D., and Jagai, T., 1996. A laboratory investigation
of carbon dioxide immiscible process. Paper SPE 36134
presented at the Fourth Latin American and Caribbean
Petroleum Engineering Conference held in Port-of-Spain,
Trinidad & Tobago, April, 23-26.
McCoy,S.,2014. Carbon Capture and Storage: Legal and Regulatory
Review. Edition 4. International Energy Agency, 9 rue de la
Fédération,75739 Paris Cedex 15, France.
Mohammed-Singh, L.J., and Singhal, A.K., Lessons From Trinidad's
CO2 Immiscible Pilot Projects 1973-2003.
Paper SPE/DOE 89364 presented at the 2004 SPE/DOE Symposium
on Enhanced Oil Recovery, Tulsa, April 17-21.
Montgomery, S. L., Schechter, D. S., and Lorenz, J., 2000.
Advanced reservoir characterization to evaluate carbon
dioxide flooding, Spraberry Trend, Midland Basin, Texas,
AAPG Bulletin, September, v. 84(9), pp: 1247-1273.
Moritis, G., 1996. New technology, improved economic boost EOR
hopes, Oil and Gas Journal, April 15, pp: 39-61.
National Energy Technology Laboratory (NETL), 2014. Subsurface
Sources of CO2 in the United States, Volume II: Exploration
of CO2 Systems. [Online] March 2014. http://netl.doe.gov/
research/energy-analysis/publications/details?pub=1dbb77ae-
fb49-486c-8a31-abdd4d904e0f.
Necmettin, M., 1991. An evaluation of carbon dioxide flooding.
Paper SPE 21762 presented at the SPE Western Regional
Meeting held in Long Beach, California, March, 20-22.
Picha, M. S., 2007. Enhanced oil recovery by hot CO2 flooding.
Paper SPE 105425 presented at 15th SPE Middle East Oil
& Gas Show and Conference held in Bahrain International
Exhibition Centre, Kingdom of Bahrain, March, 11-14.
Poettmann, F.H., and Katz, D.L., 1945. Phase Behavior of Binary
Carbon Dioxide-Paraffin Systems, Ind. Eng. Chem. v. 37, pp: 847-853.
Rogers, J. D., and Grigg, R. B., 2001. A literature analysis of the
WAG injectivity abnormalities in the CO2 process, SPE
Reservoir Evaluation & Engineering Journal, v. 5(5) pp: 375.
Seiphemo, O., 2014. CCS Potential Study in Botswana. 6th
International CCS Regulatory Framework Meeting, France,
May 27.
Seligsohn, D., Liu,Y., Forbes,S., Dongjie, Z. and West, L., 2010.
CCS in China: Toward an Environmental, Health, and
Safety Regulatory Framework. World Resource Institute,
August, 2010.
Shedid, S. A., Zekri, A. Y., and Almehaideb, R. A., 2007. Laboratory
investigation of influences of initial oil saturation and oil
viscosity on oil recovery by CO2 miscible flooding. Paper SPE
106958 presented at SPE Europec/EAGE Annual Conference
and Exhibition held in London, U.K., June, 11-14.
Surguchev, L.M., Korbol, R., Haugen, S., and Krakstad,
O.S., 1992. Screening of WAG injection strategies for
heterogeneous reservoirs. Paper SPE 25075 presented at
the SPE European Petroleum Conference, Cannes, France,
November, 16-18.
Takahashi, M. 2015. Indonesia - The Indonesia carbon capture
storage (CCS) capacity building program : CCS for coal-
fired power plants in Indonesia. Washington, D.C. : World
Bank Group. http://documents.worldbank.org/curated/
en/2015/06/24810099/indonesia-indonesia-carbon-capture-
storage-ccs-capacity-building-program-ccs-coal-fired-power-
plants-indonesia.
Tin, Y.R., and Yen, A.T., 2000. Asphaltene deposition and chemical
control in CO2 floods. Paper SPE 59293 presented at the
2000 SPE/DOE Improved Oil Recovery Symposium held in
Tulsa, OK, April, 3-5.
U.S. Department of Energy/National Energy Technology Laboratory,
Storing CO2 and Producing Domestic Crude Oil with
Next Generation CO2-EOR Technology: An Update, report
DOE/NETL-2010/1417 prepared by Advanced Resources
International, April 2010.
World Bank. 2012. Jordan - Carbon Capture and Storage (CCS):
capacity building technical assistance. Washington DC:
World Bank. http://documents.worldbank.org/curated/
en/2012/03/17451084/jordan-carbon-capture-storage-ccs-
capacity-building-technical-assistance.
Wright, I. 2007. CO2Storage at In Salah. Alternative Energy 2nd
International CCS Symposium Paris, October 4th2007.
Yongmao, H., Zenggui, W., Binshan, J., Yueming, C., and Xinjiang,
L., 2004. Laboratory investigation of CO2 flooding. Paper
SPE 88883 presented at the Nigeria Annual International
Conference and Exhibition, Abuja, Nigeria, August, 2-4.
Zain, Z.M., Kechut, N.I., Nadeson, G., Ahmed, N., and Raja,
D.M.A., 2001. Evaluation of CO2 injection for major oil
production fields in Malaysia- Experimental approach case
study: Dulang Field, paper SPE 72106 presented at the SPE
Asia Pacific Improved Oil Recovery Conference held in Kuala
Lumpur, Malaysia, October, 6-9.
Monitoring Microseismicity in Oil Boreholes
13
Monitoring Microseismicity in Oil Boreholes J. R. Kayal
Institute of Seismological Research, Gandhinagar 382009, IndiaE-mail: [email protected]
ABSTRACTMicro seismic events or ultra-micro earthquakes (M -3 to 1.0) are generated from normal production and also by injection activities for early oil recovery (EOR) in oil boreholes. The recorded micro seismicity is associated with the stress and pore pressure changes in and around the reservoir and can be used to continuously monitor the reservoir stress field and related fluid flow dynamics in real time. These ultra-micro earthquakes, when detected with proper instrumentation, allow us to measure fluid movement away from the well locations. Field wide monitoring between the wells is important for optimum reservoir management, and it is achieved by mapping the hydrocarbon fluid pathways in a producing reservoir. Recording and analyzing the passive micro seismic events have the potential for defining the fluid flow patterns and or the reservoir flood fronts. Maps of fluid pathways aid in reservoir management by optimizing development plans and improving the ultimate oil recovery.
INTRODUCTION
Optimization of reservoir management requires the monitoring of fluid dynamics or drainage patterns of reservoir production and injection processes. Modelling studies in a large oil field of Saudi Arabia suggest that conventional monitoring technology like time lapse or 4D seismic technique may not be applicable every where. This is because the sensitivity of change in acoustic impedance or seismic signature in carbonate reservoirs is extremely low, below the delectability of 4D seismic measurements (Dasgupta, 2005). Passive monitoring of micro seismic tremors, has the potential for defining the fluid drainage patterns or the reservoir flood fronts that are invisible to active seismic techniques.
Reservoir rocks react to changes in stress and strain associated with pressure changes in the reservoir and generate microtemors (M -3 to 1.0). These tiny tremors or ultra-micro earthquakes are caused by slippage or tensile deformation on pre-existing fractures/faults. The ambient stress field is perturbed by fluid or CO2 injection and oil extraction. The stress change induces shear slippage along the zones of weakness like fractures and faults. This shear slippage generates micro seismic events. Several successful experiments are made towards monitoring micro seismicity in geothermal boreholes (e.g. Dorbath et al., 2009), and also for EOR in oil boreholes (e.g. Dsagupta and Jervis, 2008; Rutledge et al., 2008); some results are presented here.
FIELD EXPERIMENTS
A network of sensors is made spatially on the surface and at different levels in the oil borehole. The sensors record the arrival times for compressional waves (P-waves) and shear waves (S-waves) of the micro seismic events (Fig.1). These data may be used to determine the hypocenter parameters
by multiple regression analysis (Kayal, 2008), and the epicentral and 3D hypocentral maps could be produced to understand the fluid flow at depth.
The experiment provides an opportunity for a field wide continuous monitoring in real-time as the fluids are produced or extracted from, and injected into the reservoir. Anisotropic fluid flow or directionally uneven flow rates are sometimes associated with reservoir production and injection operations. This information could also be applied in inferring the distribution of reservoir properties such as permeability related to fractures and faults and reservoir connectivity for numerical modelling.
FIELD EXAMPLES
Examples of an epicentral map and a 3D hypocentral map are illustrated here to understand the efficacy of the microearthquake technique in oil producing boreholes.
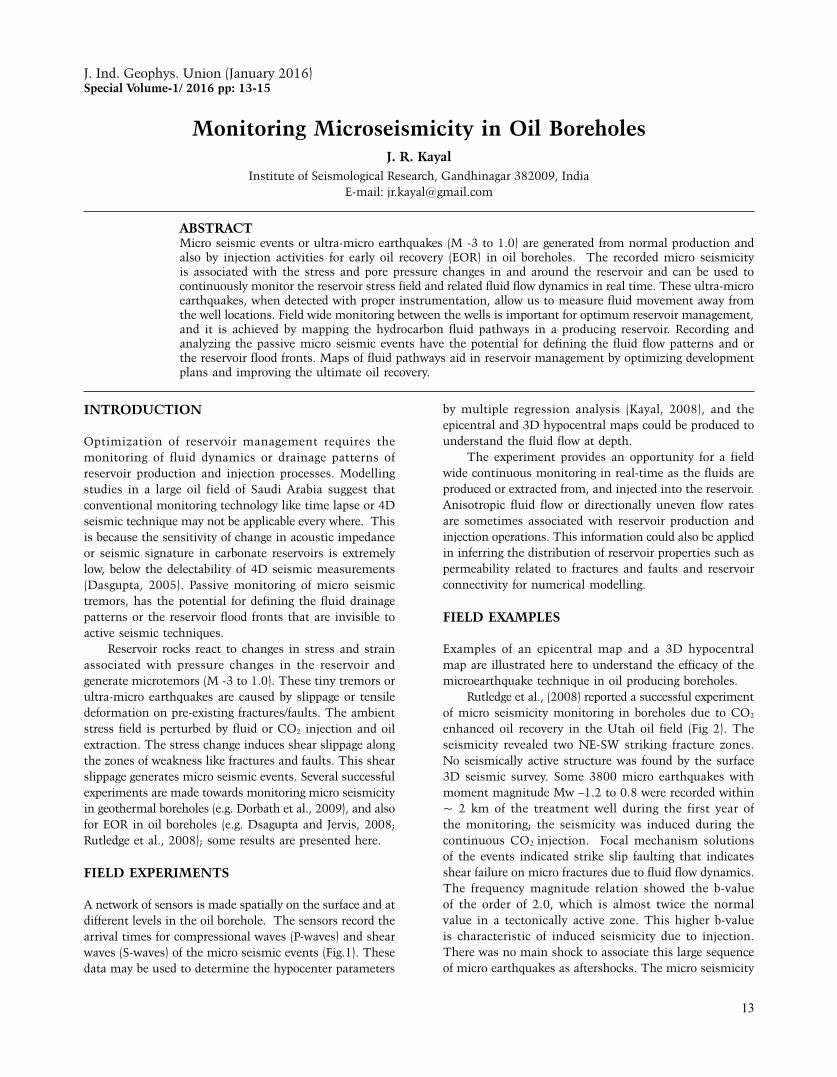
Rutledge et al., (2008) reported a successful experiment of micro seismicity monitoring in boreholes due to CO2 enhanced oil recovery in the Utah oil field (Fig 2). The seismicity revealed two NE-SW striking fracture zones. No seismically active structure was found by the surface 3D seismic survey. Some 3800 micro earthquakes with moment magnitude Mw –1.2 to 0.8 were recorded within ~ 2 km of the treatment well during the first year of the monitoring; the seismicity was induced during the continuous CO2 injection. Focal mechanism solutions of the events indicated strike slip faulting that indicates shear failure on micro fractures due to fluid flow dynamics. The frequency magnitude relation showed the b-value of the order of 2.0, which is almost twice the normal value in a tectonically active zone. This higher b-value is characteristic of induced seismicity due to injection. There was no main shock to associate this large sequence of micro earthquakes as aftershocks. The micro seismicity
J. Ind. Geophys. Union (January 2016)Special Volume-1/ 2016 pp: 13-15
J.R. Kayal
14
trends indicate the fluid flow dynamics in real time. The increase in pore pressure causes micro fractures to generate the micro seismic events.
Dorbath et al., (2009), on the other hand, examined cumulative seismic moment with fluid injection in geothermal boreholes. The temporal evolution of the cumulative seismic moment showed that once the faults/fractures are activated, the seismicity becomes largely independent of the injection parameters. This means that, once a large fault is activated, their behaviour becomes independent of the injection. Their identification and mapping may be challenging for future prospecting.
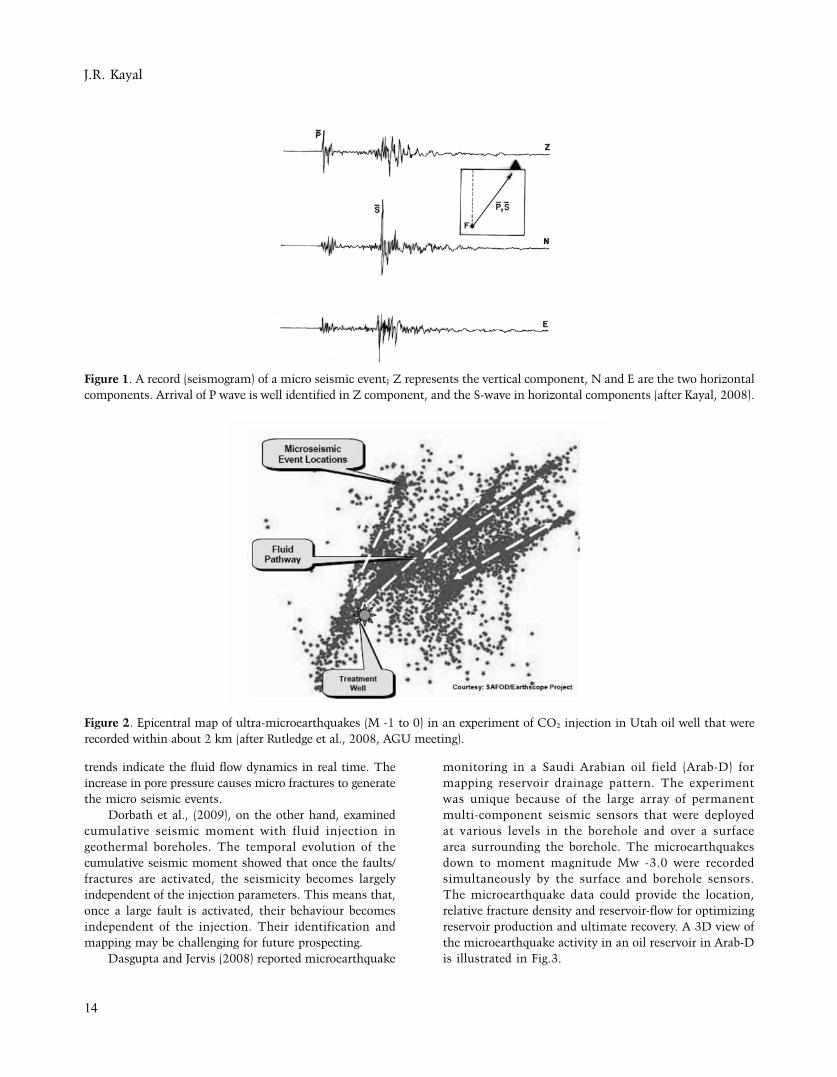
Dasgupta and Jervis (2008) reported microearthquake
monitoring in a Saudi Arabian oil field (Arab-D) for mapping reservoir drainage pattern. The experiment was unique because of the large array of permanent multi-component seismic sensors that were deployed at various levels in the borehole and over a surface area surrounding the borehole. The microearthquakes down to moment magnitude Mw -3.0 were recorded simultaneously by the surface and borehole sensors. The microearthquake data could provide the location, relative fracture density and reservoir-flow for optimizing reservoir production and ultimate recovery. A 3D view of the microearthquake activity in an oil reservoir in Arab-D is illustrated in Fig.3.
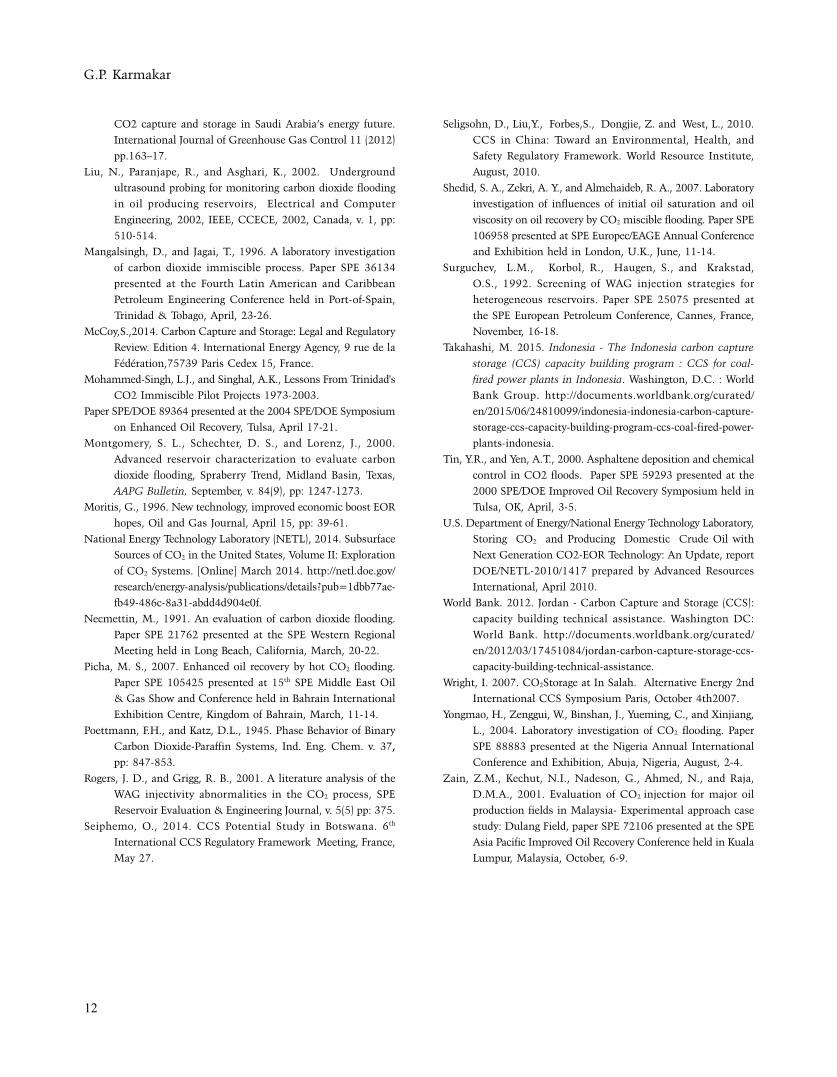
Figure 1. A record (seismogram) of a micro seismic event; Z represents the vertical component, N and E are the two horizontal components. Arrival of P wave is well identified in Z component, and the S-wave in horizontal components (after Kayal, 2008).
Figure 2. Epicentral map of ultra-microearthquakes (M -1 to 0) in an experiment of CO2 injection in Utah oil well that were recorded within about 2 km (after Rutledge et al., 2008, AGU meeting).
Monitoring Microseismicity in Oil Boreholes
15
Figure 3. A 3D view of microearthquake hypocenters following liquid injection at the Arab-D reservoir level, the magnitudes (Mw -3.0 to 1.0) of the events are indicated by size of the balls (after Dasgupta and Jervis, 2008).
CONCLUSIONS
Micro earthquake monitoring techniques provide a method for continuously detecting micro seismic events for monitoring fluid pathways in a hydrocarbon reservoir. By combining surface and down hole sensors the mapping of fluid flow over a reservoir volume between the wells is possible. This information may be applied in inferring the distribution of reservoir properties such as permeability related to fractures and faults and reservoir connectivity for numerical simulation of fluid flow. The results increase the precision in reservoir model descriptions and potentially improved recovery.
ACKNOWLEDGEMENT
This paper is based on a presentation at the Indo-Norwegian Conference on CO2 injection for EOR and geological sequestration, NGRI, Hyderabad, India, November, 26-28, 2012. I am sincerely thankful to Mr S N Dasgupta for his
kind help and cooperation for presenting this paper at the conference, and to the organisers for inviting this paper.
REFERENCES
Dasgupta, S. N., 2005. When 4D Seismic is not Applicable:
Alternative Monitoring Scenarios for the Arab-D Reservoir in
the Ghawar Field, Geophysical Prospecting, v.53, pp: 215-227.
Dasgupta, S. N., and Jrevis M., 2008. Passion for Passive Seismic in
Reservoir Management, Saudi Aramco Jour Tech, pp: 79-86.
Dorbath, L., Cuenot, N., Genter, A., and Frogneux, M., 2009.
Seismic response of the fractured and faulted granite of
Soultz-sous-Forˆets (France) to 5 km deep massive water
injections, Geophys J. Int., 177, pp. 653–675.
Kayal, J. R., 2008. Micro earthquake Seismology and Seismo
tectonics of South Asia, Springer Verlag and Capital
Publishing Company, New Delhi, India, pp: 503.
Rutledge, J., Zhou, R., Huang, L., and McPherson, B., 2008. Micro
seismic monitoring of CO2 injection in the Aneth Oil field,
San Juan County, Utah, AGU Spring meeting, USA.
K.S.Misra, A. Shukla and S. Niyogi
16
Possibility of CO2 Sequestration in Basalt and Sub-Basalt Sediments in and Around Peninsular India
K.S. Misra*, A. Shukla and S. NiyogiUniversity of Petroleum and Energy Studies, Dehradun
*Corresponding Author: [email protected]
ABSTRACTThe present study brings out the recent geological findings concerning Cretaceous volcanism. These findings are very significant, not only for hydrocarbon exploration, but also in CO2 sequestration in vast areas in and around peninsular India. The peninsular India is transected by several rift and grabens extending to offshore areas, which started subsiding since the beginning of Proterozoic times. During Proterozoic period sedimentary rocks were deposited within rift and grabens. This phase was followed by deposition of coal bearing sediments during Gondwana period, when the central parts were down faulted. The Cretaceous volcanism has taken place in pulses along these rift and grabens. These phased depositional episodes are more pronounced in their intersectional areas. The volcanic units are inter-layered with thick marine sediments in offshore regions and inter-trappean beds inland areas. The entire package of volcano-sedimentary rocks is sandwiched between the older Mesozoic and younger Tertiary sediments. This package laterally extends from land to offshore and beyond to the oceanic regions, covering the entire Bay of Bengal and the eastern half of the Arabian Sea.
INTRODUCTION
The Cretaceous volcanism comprises several felsic and mafic units, which are interlayered with sedimentary successions and represent entire ninety million years, from the beginning to the end of Cretaceous. These volcano-sedimentary sequences are invariably present in both producing as well as potential petroliferous basins of peninsular India. The producing basins include Barmer-Cambay, Bombay off-shore, Kaveri, Krishna-Godavari and Mahanadi. The potential basins include Kutch-Saurashtra and their off-shore components, Deccan Volcanic Province (DVP) of Maharashtra and Madhya Pradesh, Kerala, Mannar, Bengal oceanic basins with oceanic ridge components.
Earlier, it was not possible to ascertain the lithological characteristics of volcanic units and underlying sediments. Seismic studies for hydrocarbon exploration followed by drilling contributed significantly to our understanding of lithological characteristics and stratigraphy. Pre-Stacking and Depth Migration (PSDM) and Pre-Stacking and Time Migration (PSTM) processing techniques have facilitated better understanding of sub-basalt stratigraphy. The basaltic units form technical basement, over which uninterrupted Tertiary sequences are deposited on land, offshore and oceanic regions have been noticed in different parts of the globe, including India. The heat coming up along fractures provided environment for hydrocarbon generation. These fractures were later sealed by the flowing lava to provide an ideal trapping mechanism. The primary porosity of vesicles and cavities in basalts and secondary porosity developed due to cooling and fracturing, holds a fairly good amount of
hydrocarbons in them. The space created by extraction of hydrocarbons in the volcano-sedimentary package can best be utilized for CO2 sequestration and enhanced recovery. In the present study all the basins and areas containing Cretaceous volcanic sequences, whether occurring on land, subsurface or oceanic regions, have been taken into account. Attempts have been made to map the lateral continuity along with the underlying and overlying sequences. Drill hole logs available from hydrocarbon exploration, have been utilized to know the thickness and nature of such volcanic units.
C R E TAC E O U S VO L CA N I C S A N D C O 2 SEQUESTRATION
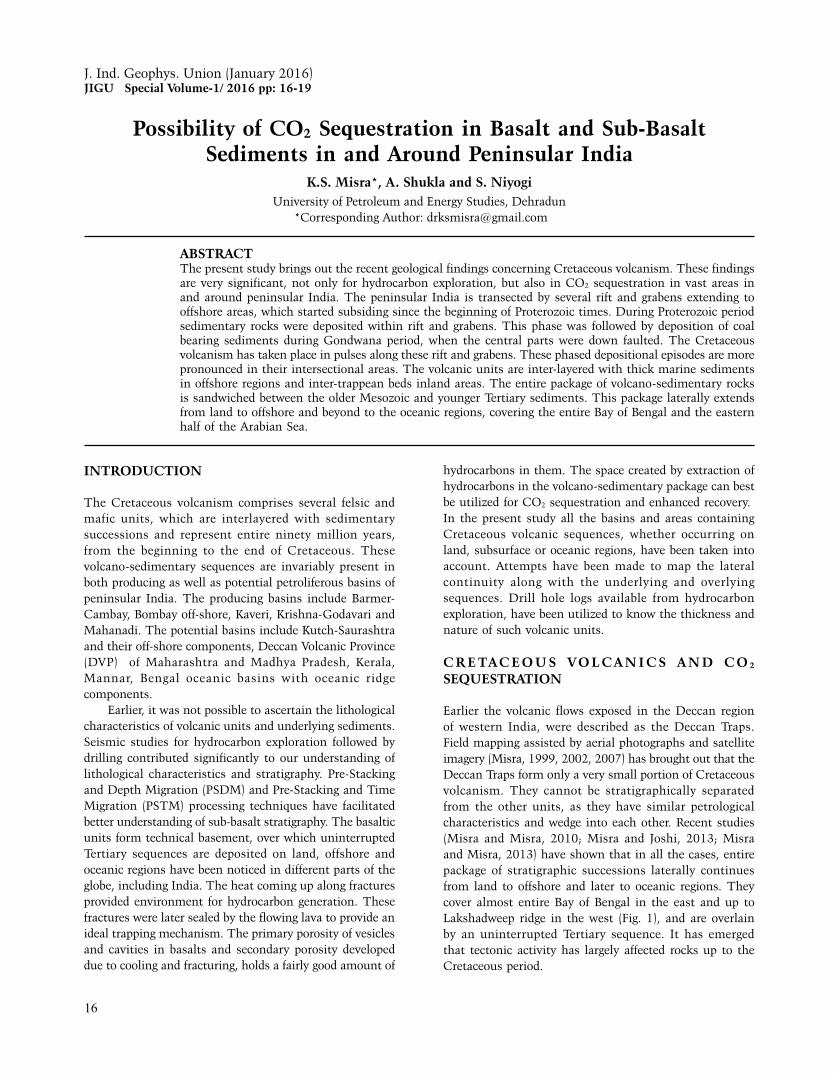
Earlier the volcanic flows exposed in the Deccan region of western India, were described as the Deccan Traps. Field mapping assisted by aerial photographs and satellite imagery (Misra, 1999, 2002, 2007) has brought out that the Deccan Traps form only a very small portion of Cretaceous volcanism. They cannot be stratigraphically separated from the other units, as they have similar petrological characteristics and wedge into each other. Recent studies (Misra and Misra, 2010; Misra and Joshi, 2013; Misra and Misra, 2013) have shown that in all the cases, entire package of stratigraphic successions laterally continues from land to offshore and later to oceanic regions. They cover almost entire Bay of Bengal in the east and up to Lakshadweep ridge in the west (Fig. 1), and are overlain by an uninterrupted Tertiary sequence. It has emerged that tectonic activity has largely affected rocks up to the Cretaceous period.
J. Ind. Geophys. Union (January 2016)JIGU Special Volume-1/ 2016 pp: 16-19
Possibility of CO2 Sequestration in Basalt and Sub-Basalt Sediments in and Around Peninsular India
17
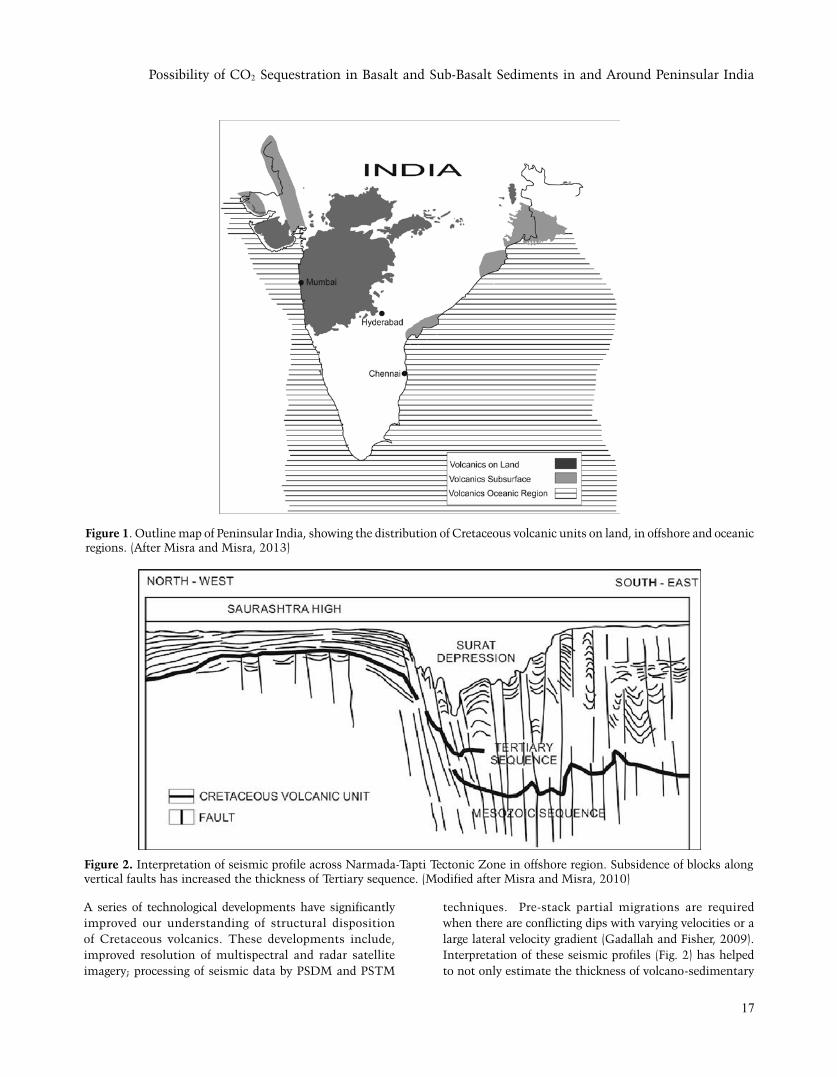
A series of technological developments have significantly improved our understanding of structural disposition of Cretaceous volcanics. These developments include, improved resolution of multispectral and radar satellite imagery; processing of seismic data by PSDM and PSTM
techniques. Pre-stack partial migrations are required when there are conflicting dips with varying velocities or a large lateral velocity gradient (Gadallah and Fisher, 2009). Interpretation of these seismic profiles (Fig. 2) has helped to not only estimate the thickness of volcano-sedimentary
Figure 1. Outline map of Peninsular India, showing the distribution of Cretaceous volcanic units on land, in offshore and oceanic regions. (After Misra and Misra, 2013)
Figure 2. Interpretation of seismic profile across Narmada-Tapti Tectonic Zone in offshore region. Subsidence of blocks along vertical faults has increased the thickness of Tertiary sequence. (Modified after Misra and Misra, 2010)
K.S.Misra, A. Shukla and S. Niyogi
18
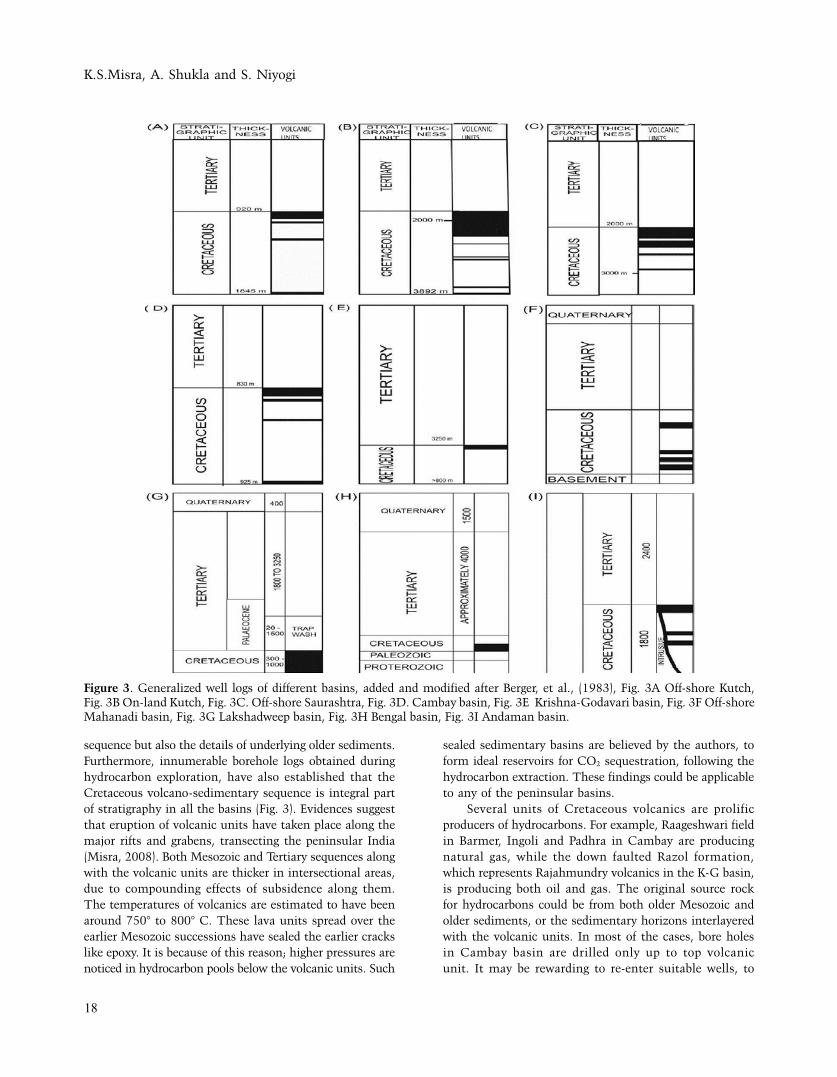
sequence but also the details of underlying older sediments. Furthermore, innumerable borehole logs obtained during hydrocarbon exploration, have also established that the Cretaceous volcano-sedimentary sequence is integral part of stratigraphy in all the basins (Fig. 3). Evidences suggest that eruption of volcanic units have taken place along the major rifts and grabens, transecting the peninsular India (Misra, 2008). Both Mesozoic and Tertiary sequences along with the volcanic units are thicker in intersectional areas, due to compounding effects of subsidence along them. The temperatures of volcanics are estimated to have been around 750° to 800° C. These lava units spread over the earlier Mesozoic successions have sealed the earlier cracks like epoxy. It is because of this reason; higher pressures are noticed in hydrocarbon pools below the volcanic units. Such
sealed sedimentary basins are believed by the authors, to form ideal reservoirs for CO2 sequestration, following the hydrocarbon extraction. These findings could be applicable to any of the peninsular basins.
Several units of Cretaceous volcanics are prolific producers of hydrocarbons. For example, Raageshwari field in Barmer, Ingoli and Padhra in Cambay are producing natural gas, while the down faulted Razol formation, which represents Rajahmundry volcanics in the K-G basin, is producing both oil and gas. The original source rock for hydrocarbons could be from both older Mesozoic and older sediments, or the sedimentary horizons interlayered with the volcanic units. In most of the cases, bore holes in Cambay basin are drilled only up to top volcanic unit. It may be rewarding to re-enter suitable wells, to
Figure 3. Generalized well logs of different basins, added and modified after Berger, et al., (1983), Fig. 3A Off-shore Kutch, Fig. 3B On-land Kutch, Fig. 3C. Off-shore Saurashtra, Fig. 3D. Cambay basin, Fig. 3E Krishna-Godavari basin, Fig. 3F Off-shore Mahanadi basin, Fig. 3G Lakshadweep basin, Fig. 3H Bengal basin, Fig. 3I Andaman basin.
Possibility of CO2 Sequestration in Basalt and Sub-Basalt Sediments in and Around Peninsular India
19
ascertain the hydrocarbon potential of older volcanic units and interlayered sediments for possible use in CO2 sequestration.
CONCLUSIONS
The study has led to the following conclusions.1. Cretaceous volcanic units are invariably associated
with petroliferous basins wherein the magma was generated due to decompression melting and erupted along the subsiding rift and grabens. The volcanism was more pronounced in the intersectional areas. Furthermore, due to the compounding effects in these areas, the sedimentary sequences of older Mesozoic and younger Tertiary are also thicker along with volcanic units.
2. Nearly vertical basinal faults were not only responsible for formation of basins but provided heat for distillation of sediments in early stage while at later stages of volcanism, the lava has sealed the fracture system to form unique trapping mechanism.
3. Data processed by PSDM and PSTM techniques have helped to map structures where hydrocarbons are trapped. Such structures can be utilized for CO2 sequestration and subsequently for hydrocarbon extraction.
4. Sediments below Cretaceous volcano-sedimentary sequence could be favorable for CO2 sequestration. The most ideal will be those, from where the extractions of hydrocarbons are extracted and enhanced recovery is contemplated.
ACKNOWLEDGEMENTS
The authors are indebted to Dr. V.P. Dimri and Professor Mrinal Sen Former Directors, National Geophysical Research Institute (NGRI) for inviting us to present the work in Indo-Norwegian Conference on CO2 Sequestration. We wish to thank Ms. Sujata Venkatraman, Program
Director, GX Technology, Houston, Texas, USA for providing the seismic profiles. Professor S.J. Chopra, Chancellor, University of Petroleum & Energy Studies has kindly provided a research environment where this work was carried out. We also thank anonymous reviewer and Prof. P.R. Reddy chief editor of the journal for very constructive suggestions, which helped to improve the manuscript.
REFERENCES
Berger, P., Cerny, A., Hook, P., Jaffeux, J.C., Kabir, C.S., Kumar,
R., Minne, J.C., Pinnington, D.J., Serra, O., Shukla, S.N.,
Sibbit, and A., Visvanath, S.N., 1983. Petroleum Geology of
India in Schlumberger, Well Evaluation Conference, pp: 1-36.
Gadallah M., Fisher R., 2009. Exploration Geophysics, Springer.
Misra, K.S., 1999. Deccan volcanics in Saurashtra and Kutch,
Gujarat, India. Mem. Geol. Soc. India, v. 43, pp: 352-334.
Misra, K.S., 2002. Arterial system of Lava tubes and channels
within Deccan Volcanics of India. Jour. Geol. Soc. India,
v.59, pp: 115-124.
Misra, K.S., 2007. Tectonic history of major geological structures
of peninsular India and development of petroliferous basins
and eruption of Deccan and associated volcanics, Jour.
Geophysics, v. 27(3), pp: 3-14.
Misra, K.S., 2008. Cretaceous Volcanic Sequences and Development
of Hydrocarbon Pools in and Around Peninsular India.
Petroview, v. 2(3), pp: 3-20.
Misra, K.S.,and Misra, A., 2010. Tectonic Evolution of Sedimentary
Basins and Development of Hydrocarbon pools along
the Offshore and Oceanic Regions of Peninsular India.
Gond.Geol. Maz. Sedimentary Basins of India. v. 12, pp:
165-176.
Misra, K.S., and Joshi, V., 2013. Tectonic Disposition and
Hydrocarbon Potential of 85° East Ridge in Bay of Bengal.,
AAPG, Search and Discovery, Article#10476.
Misra, K.S., and Misra, A., 2013. Hydrocarbon Exploration in
Sub-Basalt Basins around Peninsular India. AAPG, Search
and Discovery, Article#50804.
O.P. Pandey, N. Vedanti and S.S. Ganguli
20
Some Insights into Possible CO2 Sequestration in Subsurface Formations beneath Deccan Volcanic Province of India
O.P. Pandey*, N. Vedanti and S.S. GanguliCSIR-National Geophysical Research Institute, Uppal Road, Hyderabad-500007, India
* Corresponding Author: [email protected]
ABSTRACTThe mid-western part of on-land India and adjoining offshore region are covered with a thick pile of 65 Ma old Deccan volcanics, which are known to be the largest flood basaltic eruptions on the earth’s surface. Extremely rapid eruption and fast cooling of these lavas have severely affected their physical properties like density, porosity and permeability, which have relevance to geologic sequestration of CO2. Since this region is now being considered primarily for such an endeavour, the knowledge of the thickness details along with physical properties and structural disposition, besides what lies above and below these volcanics becomes essential. Based on some previous and our present multi parametric geological and petrophysical studies in a 617 m deep Killari bore hole (KLR-1), drilled in the eastern part of the Deccan Volcanic Province (DVP), we infer that these volcanics appear to be composed of thick columns of alternating layers of both massive and vesicular/amygdaloidal type basalt. Vesicular basalt has low density, low velocity and high porosity. In some areas (including offshore), Deccan volcanics are underlain by thick Mesozoic sediments, followed further by either Jurassic volcanics (like Saurashtra region) or high density, high velocity CO2 rich amphibolite to granulite facies transitional mid-crustal rocks. Based on our findings, we suggest that in comparision to Deccan volcanics, the subsurface thick Mesozoic sediments as well as immediately underlying Mesozoic volcanics, can be seriously considerd as a leading option for geologic CO2 sequestration. At the same time, since the entire DVP is pervasively fractured, faulted and highly deformed, apart from being seismically active since historical times, CO2 sequestration in on-land exposed volcanics should be given least priorty.
INTRODUCTION
In the last 300 Ma, there have been several volcanic episodes on the earth’s surface like, Columbia River, Ethiopian, Deccan Traps, Serra Geral, Karoo and Siberian basalts . The 65 Ma old Deccan volcanics, which cover almost one-sixth of the Indian landmass and extends for over half a million square kilometres on the onshore and offshore near western margin, is considered the largest among them all. These volcanics are composed of a large number of gentle dipping tholeiitic basat flows, having an estimated thickness of more than 2 km at places, resting directly either over the late Archaean crystalline basement or thick Mesozoic sedimentary cover. The main phase of this historic volcanism had an extremely short duration of only about 10,000 years (Courtillot, 1990).
Currently, this large igneous province (Fig. 1) is viewed as a prominent site for the storage and injection of CO2 either directly into Deccan volcanics or underlying sediments to reduce greenhouse warming. Present study aims at discussing various possible options including Deccan volcanic formations for CO2 storage, based on recently acquired geological and geophysical informations.
NEED TO CO2 CAPTURE AND STORAGE
It is no secret today that as much as 22 billion tons of CO2 is getting pumped into atmosphere from man- made or anthropogenic sources (Benson and Surles, 2006). It is
feared that it may cause considerable stress to the climate and thus to the existence of mankind itself. On world wide scale, CO2 injection for enhancing oil recovery , has been considered a major option since 1950’s (Karmarkar, 2014). However , as a remedial measure to global climate change, CO2 capture and sequestration (CCS) in deep geological formations, has emerged as an important option over the past two decades (Torp and Gale, 2002; Benson and Cole, 2008). It started in a big way in 1996 with a Sleipner saline aquifer storage project in the North sea (Torp and Gale, 2002), followed by many such projects like In-Salah gas field project in Algeria in 2004 (which stores CO2 in the flank of a depleting gas field) and Weyburn project in Saskatchewan (Canada), where enhanced oil production and storage of CO2 in the Weyburn oil field happens simultaneously (Moberg et al., 2002; Riddiford et al., 2002). Currently, some of the large scale CCS operations involve storing of around one million tons a year, and encouragingly, several such projects are planned by many other countries like Algeria, Mexico, Saudi Arabia and United Arab Emirated . To have a significant impact on climate, many billion tons of CO2 need to be sequestrated annually and that would require selection of proper depository sites.
BASIC REQUIREMENTS FOR SITE SELECTION
Basic requirement for CO2 sequestration is the site selection and thereafter monitoring. Selecting an appropriate
J. Ind. Geophys. Union (January 2016)Volume-1/ 2016 pp: 20-25
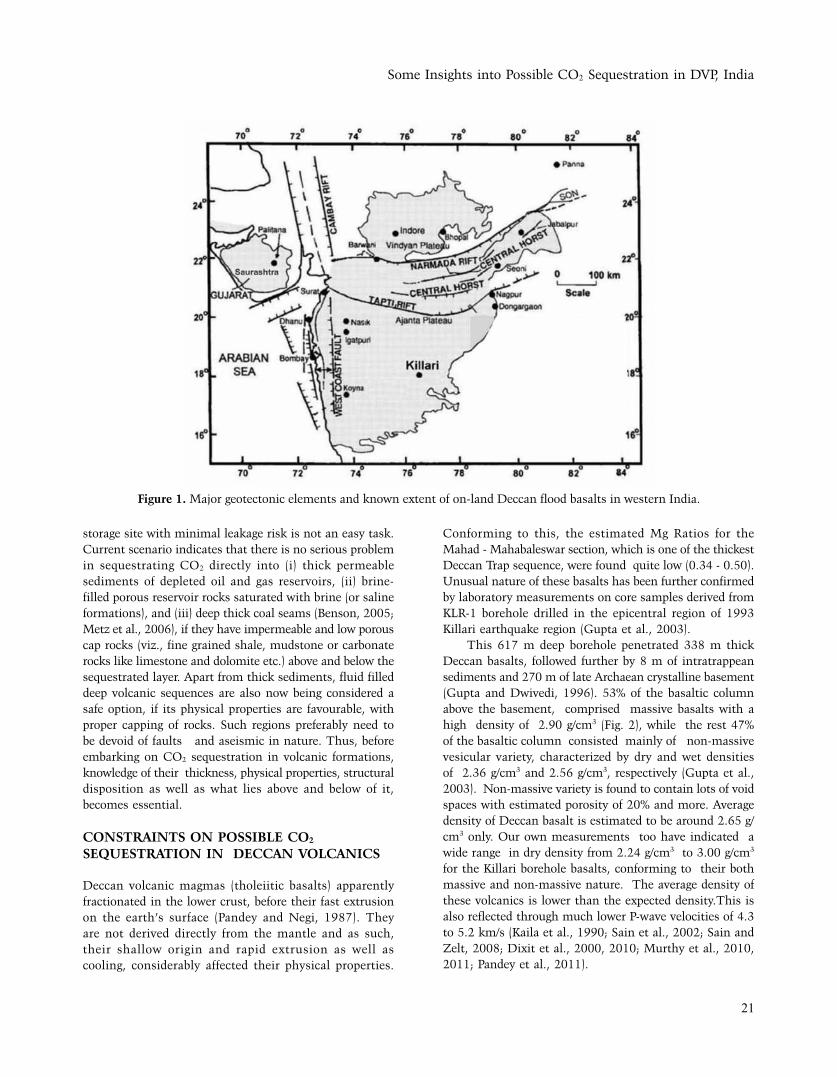
Some Insights into Possible CO2 Sequestration in DVP, India
21
storage site with minimal leakage risk is not an easy task. Current scenario indicates that there is no serious problem in sequestrating CO2 directly into (i) thick permeable sediments of depleted oil and gas reservoirs, (ii) brine-filled porous reservoir rocks saturated with brine (or saline formations), and (iii) deep thick coal seams (Benson, 2005; Metz et al., 2006), if they have impermeable and low porous cap rocks (viz., fine grained shale, mudstone or carbonate rocks like limestone and dolomite etc.) above and below the sequestrated layer. Apart from thick sediments, fluid filled deep volcanic sequences are also now being considered a safe option, if its physical properties are favourable, with proper capping of rocks. Such regions preferably need to be devoid of faults and aseismic in nature. Thus, before embarking on CO2 sequestration in volcanic formations, knowledge of their thickness, physical properties, structural disposition as well as what lies above and below of it, becomes essential.
CONSTRAINTS ON POSSIBLE CO2 SEQUESTRATION IN DECCAN VOLCANICS
Deccan volcanic magmas (tholeiitic basalts) apparently fractionated in the lower crust, before their fast extrusion on the earth’s surface (Pandey and Negi, 1987). They are not derived directly from the mantle and as such, their shallow origin and rapid extrusion as well as cooling, considerably affected their physical properties.
Conforming to this, the estimated Mg Ratios for the Mahad - Mahabaleswar section, which is one of the thickest Deccan Trap sequence, were found quite low (0.34 - 0.50). Unusual nature of these basalts has been further confirmed by laboratory measurements on core samples derived from KLR-1 borehole drilled in the epicentral region of 1993 Killari earthquake region (Gupta et al., 2003).
This 617 m deep borehole penetrated 338 m thick Deccan basalts, followed further by 8 m of intratrappean sediments and 270 m of late Archaean crystalline basement (Gupta and Dwivedi, 1996). 53% of the basaltic column above the basement, comprised massive basalts with a high density of 2.90 g/cm3 (Fig. 2), while the rest 47% of the basaltic column consisted mainly of non-massive vesicular variety, characterized by dry and wet densities of 2.36 g/cm3 and 2.56 g/cm3, respectively (Gupta et al., 2003). Non-massive variety is found to contain lots of void spaces with estimated porosity of 20% and more. Average density of Deccan basalt is estimated to be around 2.65 g/cm3 only. Our own measurements too have indicated a wide range in dry density from 2.24 g/cm3 to 3.00 g/cm3 for the Killari borehole basalts, conforming to their both massive and non-massive nature. The average density of these volcanics is lower than the expected density.This is also reflected through much lower P-wave velocities of 4.3 to 5.2 km/s (Kaila et al., 1990; Sain et al., 2002; Sain and Zelt, 2008; Dixit et al., 2000, 2010; Murthy et al., 2010, 2011; Pandey et al., 2011).
Figure 1. Major geotectonic elements and known extent of on-land Deccan flood basalts in western India.
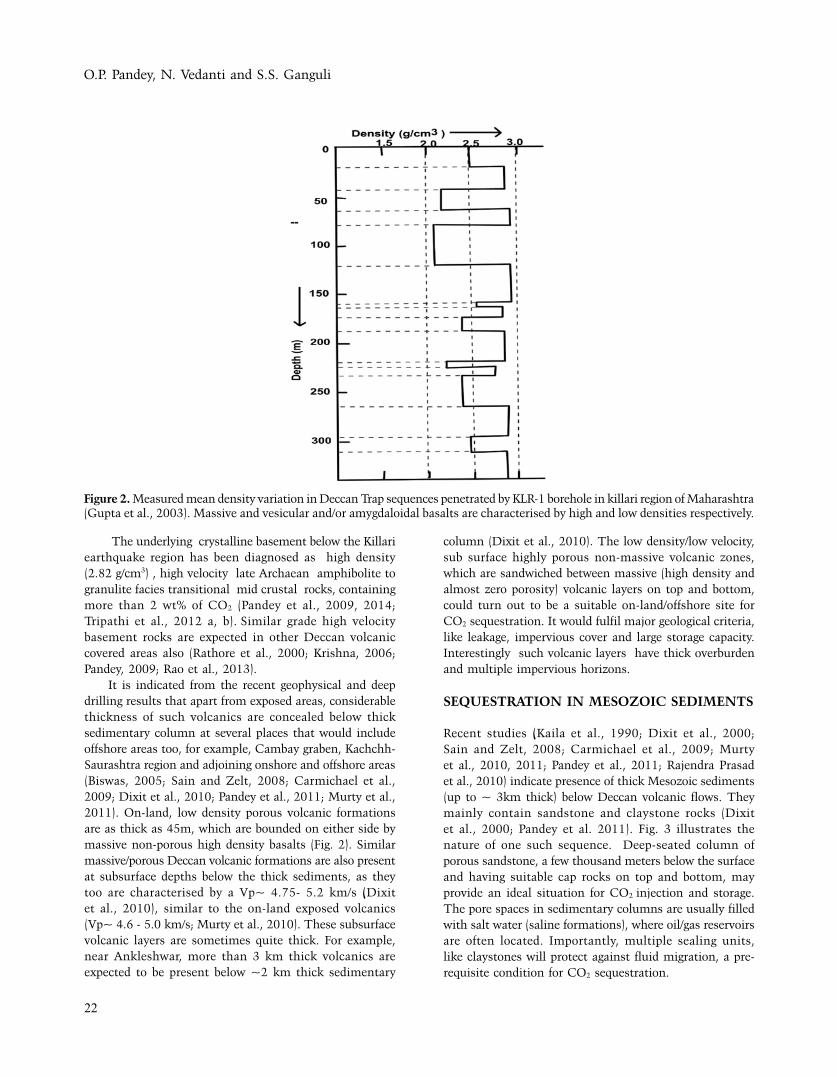
O.P. Pandey, N. Vedanti and S.S. Ganguli
22
The underlying crystalline basement below the Killari earthquake region has been diagnosed as high density (2.82 g/cm3) , high velocity late Archaean amphibolite to granulite facies transitional mid crustal rocks, containing more than 2 wt% of CO2 (Pandey et al., 2009, 2014; Tripathi et al., 2012 a, b). Similar grade high velocity basement rocks are expected in other Deccan volcanic covered areas also (Rathore et al., 2000; Krishna, 2006; Pandey, 2009; Rao et al., 2013).
It is indicated from the recent geophysical and deep drilling results that apart from exposed areas, considerable thickness of such volcanics are concealed below thick sedimentary column at several places that would include offshore areas too, for example, Cambay graben, Kachchh-Saurashtra region and adjoining onshore and offshore areas (Biswas, 2005; Sain and Zelt, 2008; Carmichael et al., 2009; Dixit et al., 2010; Pandey et al., 2011; Murty et al., 2011). On-land, low density porous volcanic formations are as thick as 45m, which are bounded on either side by massive non-porous high density basalts (Fig. 2). Similar massive/porous Deccan volcanic formations are also present at subsurface depths below the thick sediments, as they too are characterised by a Vp~ 4.75- 5.2 km/s (Dixit et al., 2010), similar to the on-land exposed volcanics (Vp~ 4.6 - 5.0 km/s; Murty et al., 2010). These subsurface volcanic layers are sometimes quite thick. For example, near Ankleshwar, more than 3 km thick volcanics are expected to be present below ~2 km thick sedimentary
column (Dixit et al., 2010). The low density/low velocity, sub surface highly porous non-massive volcanic zones, which are sandwiched between massive (high density and almost zero porosity) volcanic layers on top and bottom, could turn out to be a suitable on-land/offshore site for CO2 sequestration. It would fulfil major geological criteria, like leakage, impervious cover and large storage capacity. Interestingly such volcanic layers have thick overburden and multiple impervious horizons.
SEQUESTRATION IN MESOZOIC SEDIMENTS
Recent studies (Kaila et al., 1990; Dixit et al., 2000; Sain and Zelt, 2008; Carmichael et al., 2009; Murty et al., 2010, 2011; Pandey et al., 2011; Rajendra Prasad et al., 2010) indicate presence of thick Mesozoic sediments (up to ~ 3km thick) below Deccan volcanic flows. They mainly contain sandstone and claystone rocks (Dixit et al., 2000; Pandey et al. 2011). Fig. 3 illustrates the nature of one such sequence. Deep-seated column of porous sandstone, a few thousand meters below the surface and having suitable cap rocks on top and bottom, may provide an ideal situation for CO2 injection and storage. The pore spaces in sedimentary columns are usually filled with salt water (saline formations), where oil/gas reservoirs are often located. Importantly, multiple sealing units, like claystones will protect against fluid migration, a pre-requisite condition for CO2 sequestration.
Figure 2. Measured mean density variation in Deccan Trap sequences penetrated by KLR-1 borehole in killari region of Maharashtra (Gupta et al., 2003). Massive and vesicular and/or amygdaloidal basalts are characterised by high and low densities respectively.
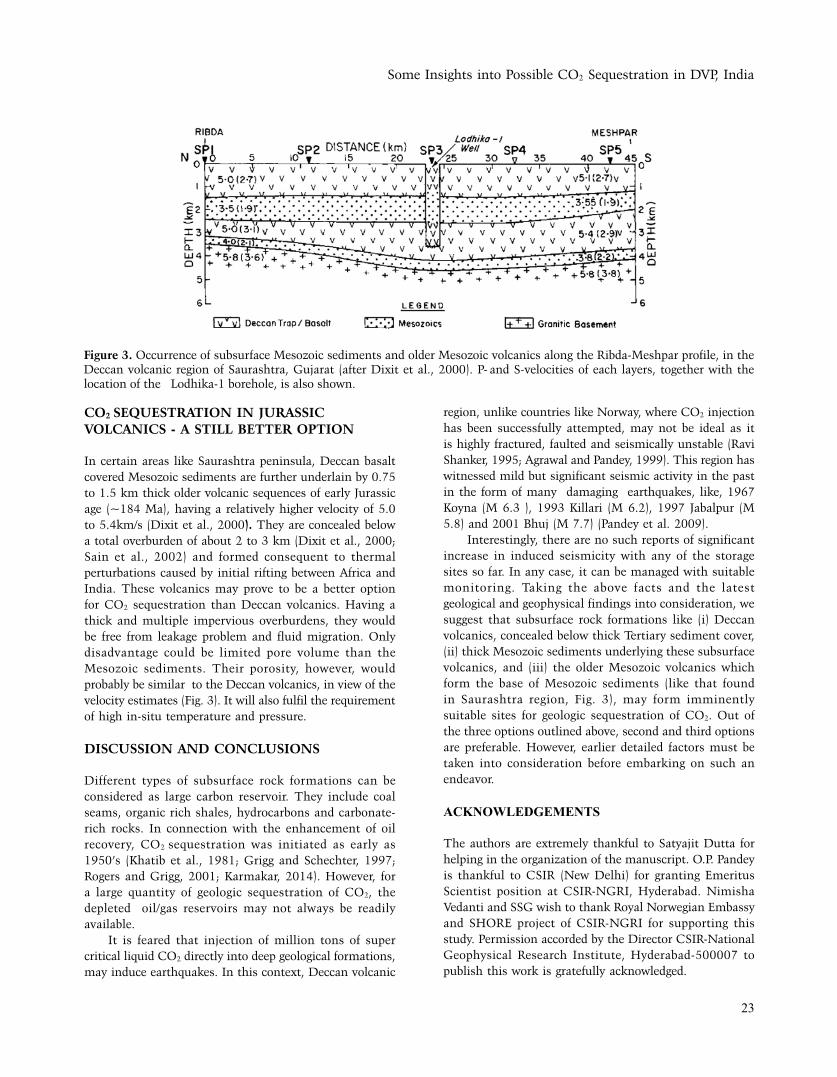
Some Insights into Possible CO2 Sequestration in DVP, India
23
CO2 SEQUESTRATION IN JURASSIC VOLCANICS - A STILL BETTER OPTION
In certain areas like Saurashtra peninsula, Deccan basalt covered Mesozoic sediments are further underlain by 0.75 to 1.5 km thick older volcanic sequences of early Jurassic age (~184 Ma), having a relatively higher velocity of 5.0 to 5.4km/s (Dixit et al., 2000). They are concealed below a total overburden of about 2 to 3 km (Dixit et al., 2000; Sain et al., 2002) and formed consequent to thermal perturbations caused by initial rifting between Africa and India. These volcanics may prove to be a better option for CO2 sequestration than Deccan volcanics. Having a thick and multiple impervious overburdens, they would be free from leakage problem and fluid migration. Only disadvantage could be limited pore volume than the Mesozoic sediments. Their porosity, however, would probably be similar to the Deccan volcanics, in view of the velocity estimates (Fig. 3). It will also fulfil the requirement of high in-situ temperature and pressure.
DISCUSSION AND CONCLUSIONS
Different types of subsurface rock formations can be considered as large carbon reservoir. They include coal seams, organic rich shales, hydrocarbons and carbonate-rich rocks. In connection with the enhancement of oil recovery, CO2 sequestration was initiated as early as 1950’s (Khatib et al., 1981; Grigg and Schechter, 1997; Rogers and Grigg, 2001; Karmakar, 2014). However, for a large quantity of geologic sequestration of CO2, the depleted oil/gas reservoirs may not always be readily available.
It is feared that injection of million tons of super critical liquid CO2 directly into deep geological formations, may induce earthquakes. In this context, Deccan volcanic
region, unlike countries like Norway, where CO2 injection has been successfully attempted, may not be ideal as it is highly fractured, faulted and seismically unstable (Ravi Shanker, 1995; Agrawal and Pandey, 1999). This region has witnessed mild but significant seismic activity in the past in the form of many damaging earthquakes, like, 1967 Koyna (M 6.3 ), 1993 Killari (M 6.2), 1997 Jabalpur (M 5.8) and 2001 Bhuj (M 7.7) (Pandey et al. 2009).
Interestingly, there are no such reports of significant increase in induced seismicity with any of the storage sites so far. In any case, it can be managed with suitable monitoring. Taking the above facts and the latest geological and geophysical findings into consideration, we suggest that subsurface rock formations like (i) Deccan volcanics, concealed below thick Tertiary sediment cover, (ii) thick Mesozoic sediments underlying these subsurface volcanics, and (iii) the older Mesozoic volcanics which form the base of Mesozoic sediments (like that found in Saurashtra region, Fig. 3), may form imminently suitable sites for geologic sequestration of CO2. Out of the three options outlined above, second and third options are preferable. However, earlier detailed factors must be taken into consideration before embarking on such an endeavor.
ACKNOWLEDGEMENTS
The authors are extremely thankful to Satyajit Dutta for helping in the organization of the manuscript. O.P. Pandey is thankful to CSIR (New Delhi) for granting Emeritus Scientist position at CSIR-NGRI, Hyderabad. Nimisha Vedanti and SSG wish to thank Royal Norwegian Embassy and SHORE project of CSIR-NGRI for supporting this study. Permission accorded by the Director CSIR-National Geophysical Research Institute, Hyderabad-500007 to publish this work is gratefully acknowledged.
Figure 3. Occurrence of subsurface Mesozoic sediments and older Mesozoic volcanics along the Ribda-Meshpar profile, in the Deccan volcanic region of Saurashtra, Gujarat (after Dixit et al., 2000). P- and S-velocities of each layers, together with the location of the Lodhika-1 borehole, is also shown.
O.P. Pandey, N. Vedanti and S.S. Ganguli
24
REFERENCES
Agrawal, P.K., and Pandey, O.P., 1999. Relevance of hot underlying
asthenosphere to the occurrence of Latur earthquake and
Indian peninsular shield seismicity, J. Geodynamics, v. 28,
pp: 301-316.
Bensom, S.M., 2005. Carbon dioxide capture for storage in deep
geological formations- Results from the CO2 capture project,
Oxford, U.K. Elsevier, 2005. v. 2, Geologic storage of carbon
dioxide with monitoring and verification.
Benson, S.M., and Surles, T., 2006. Carbon dioxide capture and
storage: An overview with emphasis on capture and storage
in deep geological formations, Proc. IEEE, v. 94, pp: 1795-
1804.
Benson, S.N., and Coal, D.R., 2008. CO2 sequestration in deep
sedimentary formations, Elements, v. 4, pp: 325-331.
Biswas, S.K., 2005. A review of structure and tectonics of Kutch
basin, western India, with special reference to earthquakes,
Curr. Sci., v. 88(10), pp: 1592-1600.
Carmichael, S.M., Akhter, S., Bennett, J.K., Fatimi, M.A., Hosein,
K., Jones, R.W., Longacre, M.B., Osborne, M.J., and Tozer,
R.S.J., 2009. Geology and hydrocarbon potential of the
offshore Indus basin, Pakistan, Petroleum Geoscience, v.
15, pp: 107–116.
Courtillot, V., 1990. Deccan volcanism at the Cretaceous-Tertiary
boundary: past climatic crises as a key to the future,
Paleogeogr. Paleoclimatol. Palaeoecol., v.189, pp: 291-299.
Dixit, M.M., Satya Vani, N., Sarkar, D., Khare, P., Reddy, P.R.,
2000. Velocity inversion in the Lodhika area, Saurashtra
peninsula, Western India, First break, v. 18, pp: 499-504.
Dixit, M.M., Tewari, H.C., and Rao, C.V., 2010. Two-dimensional
velocity model of the crust beneath the south Cambay
basin, India from refraction and wide-angle reflection data,
Geophys. J. Int., v. 182, pp: 635-652.
Grigg, R.B., and Schechter, D.S., 1997. State of the industry in
CO2 floods. paper SPE 38849 presented at the SPE annual
technical conference and exhibition , San Antonio, TX, 5-8
october, 1997., pp: 81-87.
Gupta, H.K., and Dwivedi, K.K., 1996. Drilling at Latur earthquake
region exposes a peninsular gneiss basement. Journal of
Geological Society of India, v. 47, pp: 129–131.
Gupta, H.K., Srinivasan, R., Rao, R.U.M., Rao, G.V., Reddy,
G.K., Roy, S., Jafri, S. H., Dayal, A.M., Zachariah, J., and
Parthasarathy, G., 2003. Borehole investigations in the
surface rupture zone of the 1993 Latur SCR earthquake,
Maharashtra, India: overview of results. Memoir Geological
Society of India, v.54, pp: 1–22.
Kaila, K.L., Tewari, H.C., Krishna, V.G., Dixit, M.M., Sarkar, D.,
and Reddy, M.S., 1990. Deep seismic sounding studies in
the north Cambay and Sanchor basins, India, Geophys. J.
Int., v.103, pp: 621-637.
Karmakar, G.P., 2016. Carbon Dioxide sequestration during
enhanced oil recovery: Operational and economical aspects.
J. Indian Geophys Un. This issue, pp: 47-54.
Khatib, A.K., Earlougher, R.C., and Kantar, K., 1981. CO2 injection
as an immiscible application for enhanced recovery in
heavy oil reservoirs., paper SPE 9928 presented at 1981
Californea regional meeting in Bakersfield, Californea,
March 25-26, 1981.
Krishna, V.G., 2006. INVSP gathers of local earthquake
seismograms: an approach for modeling the upper crustal P
and S velocity structure. Geophysical Journal International,
v. 166, pp: 148–154.
Metz, B., Davidson, O., Coninch H.de., Loos, and M., Meyer, L.
(Eds), 2006. Special report on carbon dioxide capture and
storage, Cambridge, U.K., Cambridge Univ. Press.
Moberg, R., Stewart, D.B., and Stachniak, D., 2002. The IEA
Weyburn CO2 monitoring and storage project. In: Gale,
J., Kaya, Y. (Eds). Proc. 6th Int. Conf. on Greenhouse Gas
Control Technologies, pp: 219-224.
Murty, A.S.N., Rajendra Prasad, B., Koteswara Rao, P., Raju, S.,
and Sateesh, T., 2010. Delineation of Subtrappean Mesozoic
Sediments in Deccan Syneclise, India, Using Travel-Time
Inversion of Seismic Refraction and Wide-Angle Reflection
Data, Pure Appl. Geophys., v.167, pp: 233–251.
Murty, A.S.N., Koteswara Rao, P., Dixit, M.M., Kesava Rao, G.,
Reddy, M.S., Prasad, B.R., and Sarkar, D., 2011. Basement
configuration of the Jhagadia–Rajpipla profile in the western
part of Deccan syneclise, India from travel-time inversion
of seismic refraction and wide-angle reflection data, J. Asian
Earth Sciences, v. 40. pp: 40–51.
Pandey, D.K., Pandey, A., and Rajan, S., 2011. Offshore Extension
of Deccan Traps in Kachchh, Central Western India:
Implications for Geological Sequestration Studies, Natural
Resources Research, v.20, No. 1, pp:33-43. DOI: 10.1007/
s11053-010-9133-x.
Pandey, O.P., 2009. Shallowing of mafic crust and seismic
instability in the high velocity Indian shield, J. Geol. Soc.
India, v.74, pp: 615-624.
Pandey, O.P., and Negi, J.G., 1987. A new theory of the origin
and evolution of the Deccan traps (India), Tectonophysics,
v. 142, pp: 329-335.
Pandey, O.P., Chandrakala, K., Parthasarathy, G., Reddy, P.R., and
Koti Reddy, G., 2009. Upwarped high velocity mafic crust,
subsurface tectonics and causes of intraplate Latur-Killari (M
6.2) and Koyna (M 6.3) earthquakes, India – A comparative
study, J. Asian Earth Sciences., v. 34, pp: 781-795.
Pandey, O.P., Tripathi, P., Parthasarathy, G., Rajagopalan, V.,
and Sreedhar, B., 2014. Geochemical and mineralogical
studies of chlorine-rich amphibole and biotite from the
2.5 Ga mid-crustal basement beneath the 1993 Killari
earthquake region, Maharashtra, India: Evidence for mantle
metasomatism beneath the Deccan Trap, J. Geol. Soc. India, v. 83, pp: 599-612.
Rajendra Prasad, B., Venkateswarlu, N., Prasad, A.S.S.S.R.S.,
Murthy, A.S.N., and Sateesh, T., 2010. Basement
configuration of on-land Kutch basin from seismic refraction
studies and modeling of first arrival travel time skips, J.
Some Insights into Possible CO2 Sequestration in DVP, India
25
Asian Earth Sciences, v. 39, pp: 460-469.
Rao, N.P., Roy, S., and Arora, K., 2013. Deep scientific drilling
in Koyna, India- brain storming workshop on geological
investigations, 19-20 March, 2013. J. Geol. Soc. India, v.
81, pp: 722-723.
Rathore, S.S., Vijan, A.R., Singh, M.P., Prabhu, B.N., and
Misra, K.N., 2000. Rb–Sr and K–Ar isotopic evidences for
Neoproterozoic (Pan-African) granulite metamorphism from
the basement of Mumbai offshore basin, India. J. Geol. Soc.
India, v. 56, pp: 365–372.
Riddiford, F.A., Tourqui, A., Bishop, C.D., Taylor, B., and Smith,
M., 2002. A cleaner development: The in Salah gas project,
Algeria. In: Gale, J., Kaya, Y. (Eds). Proc. 6th Int. Conf. on
Greenhouse Gas Control Technologies, pp: 601-606.
Rogers , J.D., and Grigg, R.B., 2001. A literature analysis of the
WAG injectivity abnormalities in the CO2 process, SPE
reservoir evaluation and engineering journal, October, 2001.
Sain, K., and Zelt, C.A., 2008. Velocity Structure of Sub-Basalt
Mesozoics around the Lodhika Well in Saurashtra Peninsula
from Traveltime Inversion of Wide-Angle Seismic Data,
7th Int. conf. and exposition on petroleum geophysics,
Hyderabad, P-602, pp: 1-3.
Sain, K., Zelt, C.A., and Reddy, P.R., 2002. Imaging of subvolcanic
Mesozoics in the Saurashtra peninsula of India using travel
time inversion of wide-angle seismic data, Geophys. J. Int.,
v. 150, pp: 820-826.
Ravi Shanker, 1995. Fragmented Indian shield and recent
earthquakes. Geol. Survey India spl. Publ., v. 27, pp: 41-48.
Torp, T.A., and Gale, J., 2002. Demonstrating storage of CO2 in
geological reservoirs: The Sleipner and SACS projects. In:
Gale, J., Kaya, Y. (Eds). Proc. 6th Int. Conf. on Greenhouse
Gas Control Technologies. Pergamon, Amsterdam, pp:
311-316.
Tripathi, P., Pandey, O.P., Rao, M.V.M.S., and Koti Reddy, G.,
2012a. Elastic properties of amphibolite and granulite facies
mid-crustal basement rocks of the Deccan volcanic covered
1993 Latur-Killari earthquake region, Maharashtra (India)
and mantle metasomatism, Tectonophysics, v. 554-557,
pp: 159-168.
Tripathi, P., Parthasarathy, G., Ahmad, S.M., and Pandey, O.P.,
2012b. Mantle derived fluids in the basement of the Deccan
traps: Evidence from stable carbon and oxygen isotopes of
carbonates from the Killari borehole basement, Maharashtra,
India, Int. J. Earth Sci.,v. 101, pp: 1385-1395.
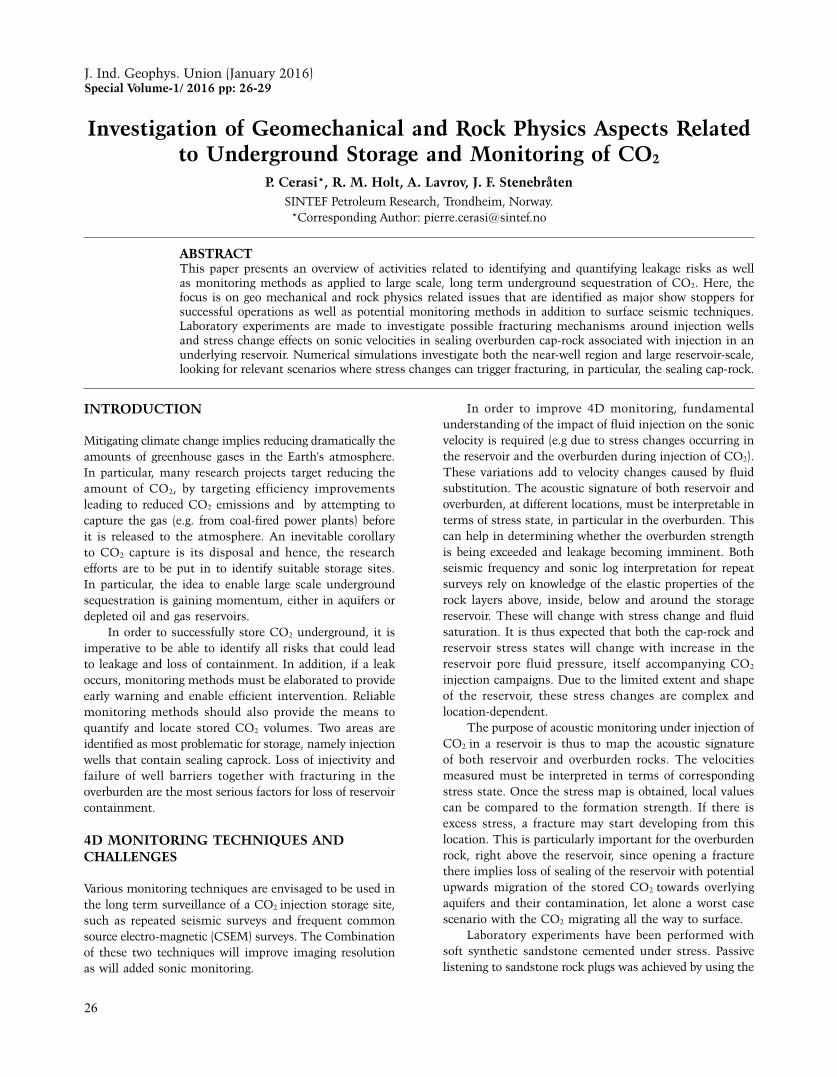
P. Cerasi, R. M. Holt, A. Lavrov, J. F. Stenebråten
26
Investigation of Geomechanical and Rock Physics Aspects Related to Underground Storage and Monitoring of CO2
P. Cerasi*, R. M. Holt, A. Lavrov, J. F. Stenebråten SINTEF Petroleum Research, Trondheim, Norway.
*Corresponding Author: [email protected]
ABSTRACTThis paper presents an overview of activities related to identifying and quantifying leakage risks as well as monitoring methods as applied to large scale, long term underground sequestration of CO2. Here, the focus is on geo mechanical and rock physics related issues that are identified as major show stoppers for successful operations as well as potential monitoring methods in addition to surface seismic techniques. Laboratory experiments are made to investigate possible fracturing mechanisms around injection wells and stress change effects on sonic velocities in sealing overburden cap-rock associated with injection in an underlying reservoir. Numerical simulations investigate both the near-well region and large reservoir-scale, looking for relevant scenarios where stress changes can trigger fracturing, in particular, the sealing cap-rock.
INTRODUCTION
Mitigating climate change implies reducing dramatically the amounts of greenhouse gases in the Earth's atmosphere. In particular, many research projects target reducing the amount of CO2, by targeting efficiency improvements leading to reduced CO2 emissions and by attempting to capture the gas (e.g. from coal-fired power plants) before it is released to the atmosphere. An inevitable corollary to CO2 capture is its disposal and hence, the research efforts are to be put in to identify suitable storage sites. In particular, the idea to enable large scale underground sequestration is gaining momentum, either in aquifers or depleted oil and gas reservoirs.
In order to successfully store CO2 underground, it is imperative to be able to identify all risks that could lead to leakage and loss of containment. In addition, if a leak occurs, monitoring methods must be elaborated to provide early warning and enable efficient intervention. Reliable monitoring methods should also provide the means to quantify and locate stored CO2 volumes. Two areas are identified as most problematic for storage, namely injection wells that contain sealing caprock. Loss of injectivity and failure of well barriers together with fracturing in the overburden are the most serious factors for loss of reservoir containment.
4D MONITORING TECHNIQUES AND CHALLENGES
Various monitoring techniques are envisaged to be used in the long term surveillance of a CO2 injection storage site, such as repeated seismic surveys and frequent common source electro-magnetic (CSEM) surveys. The Combination of these two techniques will improve imaging resolution as will added sonic monitoring.
In order to improve 4D monitoring, fundamental understanding of the impact of fluid injection on the sonic velocity is required (e.g due to stress changes occurring in the reservoir and the overburden during injection of CO2). These variations add to velocity changes caused by fluid substitution. The acoustic signature of both reservoir and overburden, at different locations, must be interpretable in terms of stress state, in particular in the overburden. This can help in determining whether the overburden strength is being exceeded and leakage becoming imminent. Both seismic frequency and sonic log interpretation for repeat surveys rely on knowledge of the elastic properties of the rock layers above, inside, below and around the storage reservoir. These will change with stress change and fluid saturation. It is thus expected that both the cap-rock and reservoir stress states will change with increase in the reservoir pore fluid pressure, itself accompanying CO2 injection campaigns. Due to the limited extent and shape of the reservoir, these stress changes are complex and location-dependent.
The purpose of acoustic monitoring under injection of CO2 in a reservoir is thus to map the acoustic signature of both reservoir and overburden rocks. The velocities measured must be interpreted in terms of corresponding stress state. Once the stress map is obtained, local values can be compared to the formation strength. If there is excess stress, a fracture may start developing from this location. This is particularly important for the overburden rock, right above the reservoir, since opening a fracture there implies loss of sealing of the reservoir with potential upwards migration of the stored CO2 towards overlying aquifers and their contamination, let alone a worst case scenario with the CO2 migrating all the way to surface.
Laboratory experiments have been performed with soft synthetic sandstone cemented under stress. Passive listening to sandstone rock plugs was achieved by using the
J. Ind. Geophys. Union (January 2016)Special Volume-1/ 2016 pp: 26-29
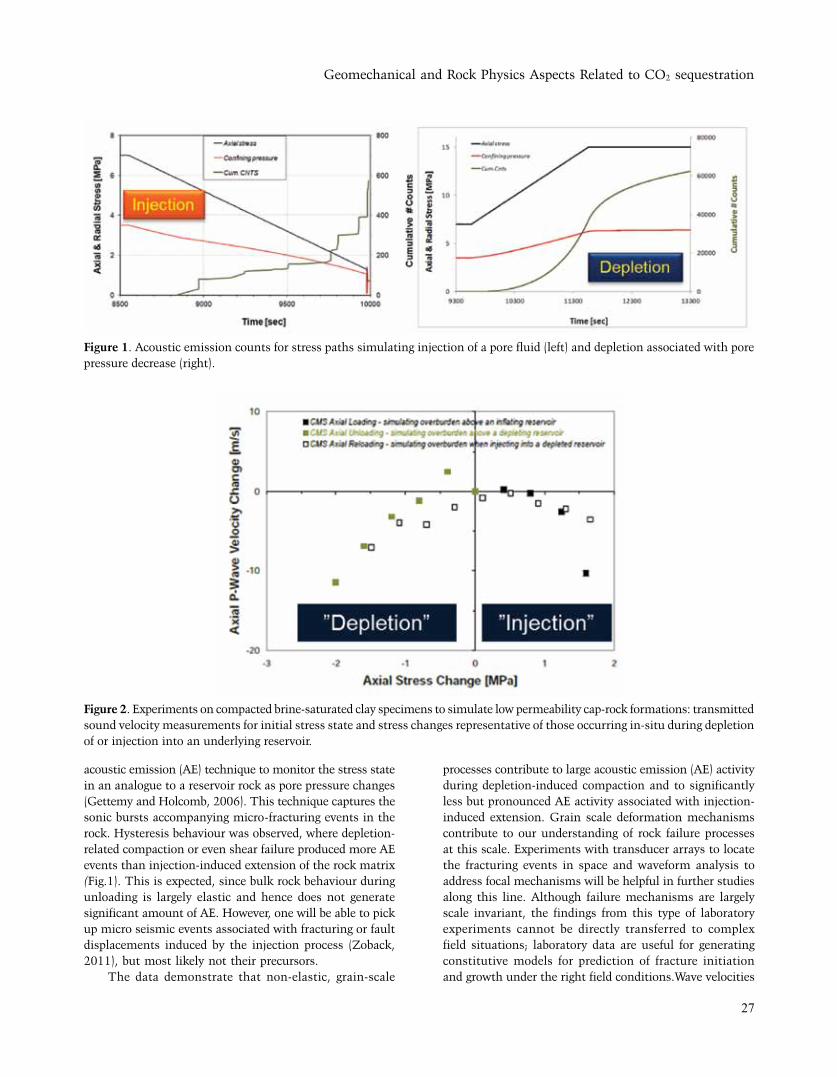
Geomechanical and Rock Physics Aspects Related to CO2 sequestration
27
acoustic emission (AE) technique to monitor the stress state in an analogue to a reservoir rock as pore pressure changes (Gettemy and Holcomb, 2006). This technique captures the sonic bursts accompanying micro-fracturing events in the rock. Hysteresis behaviour was observed, where depletion-related compaction or even shear failure produced more AE events than injection-induced extension of the rock matrix (Fig.1). This is expected, since bulk rock behaviour during unloading is largely elastic and hence does not generate significant amount of AE. However, one will be able to pick up micro seismic events associated with fracturing or fault displacements induced by the injection process (Zoback, 2011), but most likely not their precursors.
The data demonstrate that non-elastic, grain-scale
processes contribute to large acoustic emission (AE) activity during depletion-induced compaction and to significantly less but pronounced AE activity associated with injection-induced extension. Grain scale deformation mechanisms contribute to our understanding of rock failure processes at this scale. Experiments with transducer arrays to locate the fracturing events in space and waveform analysis to address focal mechanisms will be helpful in further studies along this line. Although failure mechanisms are largely scale invariant, the findings from this type of laboratory experiments cannot be directly transferred to complex field situations; laboratory data are useful for generating constitutive models for prediction of fracture initiation and growth under the right field conditions.Wave velocities
Figure 1. Acoustic emission counts for stress paths simulating injection of a pore fluid (left) and depletion associated with pore pressure decrease (right).
Figure 2. Experiments on compacted brine-saturated clay specimens to simulate low permeability cap-rock formations: transmitted sound velocity measurements for initial stress state and stress changes representative of those occurring in-situ during depletion of or injection into an underlying reservoir.
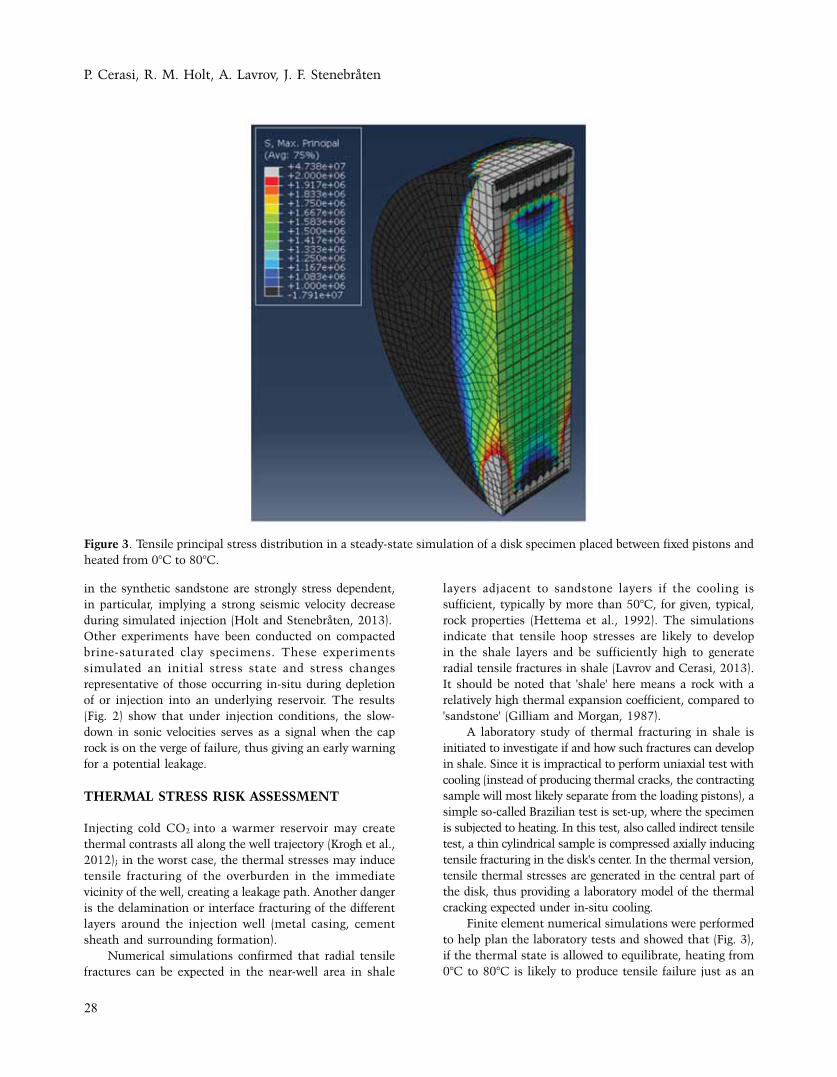
P. Cerasi, R. M. Holt, A. Lavrov, J. F. Stenebråten
28
in the synthetic sandstone are strongly stress dependent, in particular, implying a strong seismic velocity decrease during simulated injection (Holt and Stenebråten, 2013).Other experiments have been conducted on compacted brine-saturated clay specimens. These experiments simulated an initial stress state and stress changes representative of those occurring in-situ during depletion of or injection into an underlying reservoir. The results (Fig. 2) show that under injection conditions, the slow-down in sonic velocities serves as a signal when the cap rock is on the verge of failure, thus giving an early warning for a potential leakage.
THERMAL STRESS RISK ASSESSMENT
Injecting cold CO2 into a warmer reservoir may create thermal contrasts all along the well trajectory (Krogh et al., 2012); in the worst case, the thermal stresses may induce tensile fracturing of the overburden in the immediate vicinity of the well, creating a leakage path. Another danger is the delamination or interface fracturing of the different layers around the injection well (metal casing, cement sheath and surrounding formation).
Numerical simulations confirmed that radial tensile fractures can be expected in the near-well area in shale
layers adjacent to sandstone layers if the cooling is sufficient, typically by more than 50°C, for given, typical, rock properties (Hettema et al., 1992). The simulations indicate that tensile hoop stresses are likely to develop in the shale layers and be sufficiently high to generate radial tensile fractures in shale (Lavrov and Cerasi, 2013). It should be noted that 'shale' here means a rock with a relatively high thermal expansion coefficient, compared to 'sandstone' (Gilliam and Morgan, 1987).
A laboratory study of thermal fracturing in shale is initiated to investigate if and how such fractures can develop in shale. Since it is impractical to perform uniaxial test with cooling (instead of producing thermal cracks, the contracting sample will most likely separate from the loading pistons), a simple so-called Brazilian test is set-up, where the specimen is subjected to heating. In this test, also called indirect tensile test, a thin cylindrical sample is compressed axially inducing tensile fracturing in the disk's center. In the thermal version, tensile thermal stresses are generated in the central part of the disk, thus providing a laboratory model of the thermal cracking expected under in-situ cooling.
Finite element numerical simulations were performed to help plan the laboratory tests and showed that (Fig. 3), if the thermal state is allowed to equilibrate, heating from 0°C to 80°C is likely to produce tensile failure just as an
Figure 3. Tensile principal stress distribution in a steady-state simulation of a disk specimen placed between fixed pistons and heated from 0°C to 80°C.
Geomechanical and Rock Physics Aspects Related to CO2 sequestration
29
ordinary (purely mechanical) Brazilian test would. The remaining question is whether such fracturing in shale would propagate far enough to be of concern in terms of initiating a leakage out of a storage site. These simulations show that thermal stresses are of concern for liquid CO2 injection, but probably not relevant for injection of a gas, although this conclusion depends on tensile strength and thermal property variations.
CONCLUSION
The importance of sound geo mechanical analysis is getting more and more recognized. A certified CO2 storage site in terms of sufficient capacity may still not be satisfactory due to concerns of fracturing risk and leakage. SINTEF is involved in research on several fronts concerning monitoring and qualification of storage sites. This includes laboratory work addressing fracturing and 4D rock physics aspects. Ongoing research activities include simulation work supplementing laboratory findings, and upscaling to field conditions. Near-well integrity issues and reservoir scale fracture risks are at the centre of both laboratory and simulation efforts.
ACKNOWLEDGEMENTS
This publication has been produced with support from the BIGCCS Centre, performed under the Norwegian research program Centres for Environment-friendly Energy Research (FME). The authors acknowledge the following partners for their contributions: Aker Solutions, ConocoPhillips,
Gassco, Shell, Statoil, TOTAL, GDF SUEZ and the Research Council of Norway (193816/S60).
REFERENCES
Gettemy, G. and Holcomb, D.J., 2006. Investigation of the
compaction localization process in high porosity, fluid
saturated sandstone using Acoustic Emission focal
mechanisms. ARMA/USRMS 06-966; pp: 10.
Zoback, M., 2011. Achieving global CO2 emissions reductions
utilizing unconventional natural gas instead of large-scale
carbon sequestration. Keynote, ARMA Symposium, San
Francisco.
Holt, R.M., and Stenebråten, J.F., 2013. Controlled laboratory
experiments to assess the geo mechanical influence of
subsurface injection and depletion processes on 4D seismic
responses. Geophysical Prospecting.doi: 10.1111/1365-
2478.12040.
Krogh, E., Nilsen, and R., Henningsen, R., 2012. Liquefied CO2
injection modelling. Energy Procedia, v.23, pp: 527-555.
Hettema, M., Wolf, K.H.A.A., De Pater, C.J., and Van H. R., 1992.
In: Rock Characterization: ISRM Symposium, Eurock '92.
Ed. J.A.Hudson. London, Thomas Telford.
Lavrov, A., and Cerasi, P., 2013. Numerical modeling of tensile
thermal stressesin rock around a cased well caused by
injection of a cold fluid. Paper ARMA 13-306. In: Proc. 47th
US Rock Mechanics / Geomechanics Symposium to be held
in San Francisco, CA, USA, 23-26 June 2013.
Gilliam, T.M., and Morgan, I.L., 1987. Shale: Measurement of
Thermal Properties. Oak Ridge National Laboratory report
ORNL/TM-10499. pp: 139.
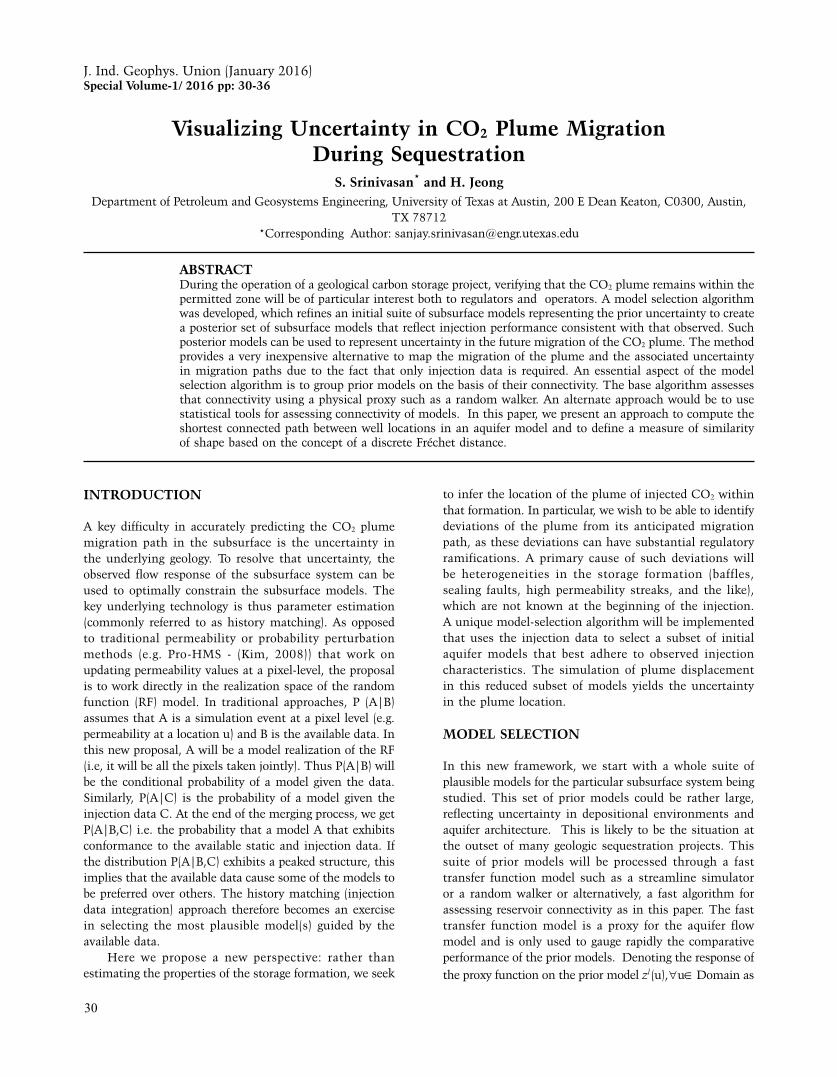
30
S. Srinivasan and H. Jeong
Visualizing Uncertainty in CO2 Plume Migration During Sequestration
S. Srinivasan* and H. JeongDepartment of Petroleum and Geosystems Engineering, University of Texas at Austin, 200 E Dean Keaton, C0300, Austin,
TX 78712*Corresponding Author: [email protected]
ABSTRACTDuring the operation of a geological carbon storage project, verifying that the CO2 plume remains within the permitted zone will be of particular interest both to regulators and operators. A model selection algorithm was developed, which refines an initial suite of subsurface models representing the prior uncertainty to create a posterior set of subsurface models that reflect injection performance consistent with that observed. Such posterior models can be used to represent uncertainty in the future migration of the CO2 plume. The method provides a very inexpensive alternative to map the migration of the plume and the associated uncertainty in migration paths due to the fact that only injection data is required. An essential aspect of the model selection algorithm is to group prior models on the basis of their connectivity. The base algorithm assesses that connectivity using a physical proxy such as a random walker. An alternate approach would be to use statistical tools for assessing connectivity of models. In this paper, we present an approach to compute the shortest connected path between well locations in an aquifer model and to define a measure of similarity of shape based on the concept of a discrete Fréchet distance.
INTRODUCTION
A key difficulty in accurately predicting the CO2 plume migration path in the subsurface is the uncertainty in the underlying geology. To resolve that uncertainty, the observed flow response of the subsurface system can be used to optimally constrain the subsurface models. The key underlying technology is thus parameter estimation (commonly referred to as history matching). As opposed to traditional permeability or probability perturbation methods (e.g. Pro-HMS - (Kim, 2008)) that work on updating permeability values at a pixel-level, the proposal is to work directly in the realization space of the random function (RF) model. In traditional approaches, P (A|B) assumes that A is a simulation event at a pixel level (e.g. permeability at a location u) and B is the available data. In this new proposal, A will be a model realization of the RF (i.e, it will be all the pixels taken jointly). Thus P(A|B) will be the conditional probability of a model given the data. Similarly, P(A|C) is the probability of a model given the injection data C. At the end of the merging process, we get P(A|B,C) i.e. the probability that a model A that exhibits conformance to the available static and injection data. If the distribution P(A|B,C) exhibits a peaked structure, this implies that the available data cause some of the models to be preferred over others. The history matching (injection data integration) approach therefore becomes an exercise in selecting the most plausible model(s) guided by the available data.
Here we propose a new perspective: rather than estimating the properties of the storage formation, we seek
to infer the location of the plume of injected CO2 within that formation. In particular, we wish to be able to identify deviations of the plume from its anticipated migration path, as these deviations can have substantial regulatory ramifications. A primary cause of such deviations will be heterogeneities in the storage formation (baffles, sealing faults, high permeability streaks, and the like), which are not known at the beginning of the injection. A unique model-selection algorithm will be implemented that uses the injection data to select a subset of initial aquifer models that best adhere to observed injection characteristics. The simulation of plume displacement in this reduced subset of models yields the uncertainty in the plume location.
MODEL SELECTION
In this new framework, we start with a whole suite of plausible models for the particular subsurface system being studied. This set of prior models could be rather large, reflecting uncertainty in depositional environments and aquifer architecture. This is likely to be the situation at the outset of many geologic sequestration projects. This suite of prior models will be processed through a fast transfer function model such as a streamline simulator or a random walker or alternatively, a fast algorithm for assessing reservoir connectivity as in this paper. The fast transfer function model is a proxy for the aquifer flow model and is only used to gauge rapidly the comparative performance of the prior models. Denoting the response of the proxy function on the prior model zl (u), "u∈ Domain as
J. Ind. Geophys. Union (January 2016)Special Volume-1/ 2016 pp: 30-36
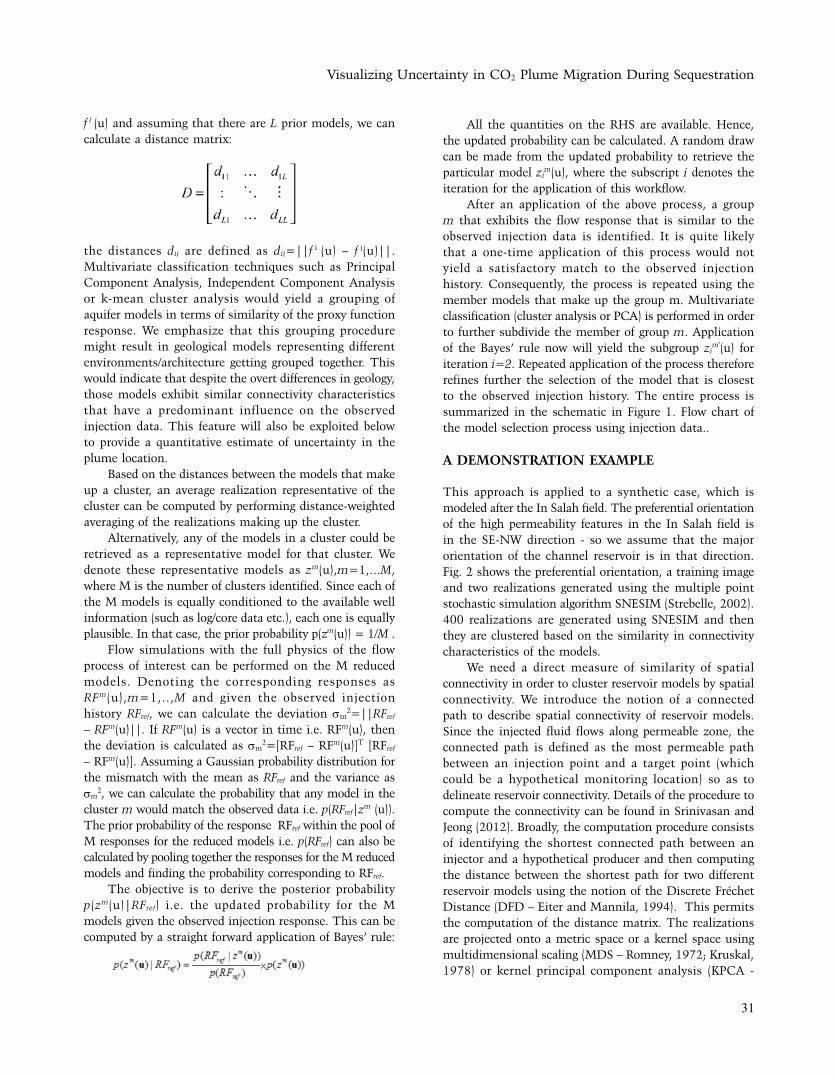
31
Visualizing Uncertainty in CO2 Plume Migration During Sequestration
All the quantities on the RHS are available. Hence, the updated probability can be calculated. A random draw can be made from the updated probability to retrieve the particular model zi
m(u), where the subscript i denotes the iteration for the application of this workflow.
After an application of the above process, a group m that exhibits the flow response that is similar to the observed injection data is identified. It is quite likely that a one-time application of this process would not yield a satisfactory match to the observed injection history. Consequently, the process is repeated using the member models that make up the group m. Multivariate classification (cluster analysis or PCA) is performed in order to further subdivide the member of group m. Application of the Bayes’ rule now will yield the subgroup zi
m'(u) for
iteration i=2. Repeated application of the process therefore refines further the selection of the model that is closest to the observed injection history. The entire process is summarized in the schematic in Figure 1. Flow chart of the model selection process using injection data..
A DEMONSTRATION EXAMPLE
This approach is applied to a synthetic case, which is modeled after the In Salah field. The preferential orientation of the high permeability features in the In Salah field is in the SE-NW direction - so we assume that the major orientation of the channel reservoir is in that direction. Fig. 2 shows the preferential orientation, a training image and two realizations generated using the multiple point stochastic simulation algorithm SNESIM (Strebelle, 2002). 400 realizations are generated using SNESIM and then they are clustered based on the similarity in connectivity characteristics of the models.
We need a direct measure of similarity of spatial connectivity in order to cluster reservoir models by spatial connectivity. We introduce the notion of a connected path to describe spatial connectivity of reservoir models. Since the injected fluid flows along permeable zone, the connected path is defined as the most permeable path between an injection point and a target point (which could be a hypothetical monitoring location) so as to delineate reservoir connectivity. Details of the procedure to compute the connectivity can be found in Srinivasan and Jeong (2012). Broadly, the computation procedure consists of identifying the shortest connected path between an injector and a hypothetical producer and then computing the distance between the shortest path for two different reservoir models using the notion of the Discrete Fréchet Distance (DFD – Eiter and Mannila, 1994). This permits the computation of the distance matrix. The realizations are projected onto a metric space or a kernel space using multidimensional scaling (MDS – Romney, 1972; Kruskal, 1978) or kernel principal component analysis (KPCA -
f l (u) and assuming that there are L prior models, we can
calculate a distance matrix:
the distances dij are defined as dij=||f i (u) – f
j(u)||. Multivariate classification techniques such as Principal Component Analysis, Independent Component Analysis or k-mean cluster analysis would yield a grouping of aquifer models in terms of similarity of the proxy function response. We emphasize that this grouping procedure might result in geological models representing different environments/architecture getting grouped together. This would indicate that despite the overt differences in geology, those models exhibit similar connectivity characteristics that have a predominant influence on the observed injection data. This feature will also be exploited below to provide a quantitative estimate of uncertainty in the plume location.
Based on the distances between the models that make up a cluster, an average realization representative of the cluster can be computed by performing distance-weighted averaging of the realizations making up the cluster.
Alternatively, any of the models in a cluster could be retrieved as a representative model for that cluster. We denote these representative models as zm(u),m=1,...M, where M is the number of clusters identified. Since each of the M models is equally conditioned to the available well information (such as log/core data etc.), each one is equally plausible. In that case, the prior probability p(zm(u)) = 1/M .
Flow simulations with the full physics of the flow process of interest can be performed on the M reduced models. Denoting the corresponding responses as RFm(u),m=1,..,M and given the observed injection history RFref, we can calculate the deviation sm
2=||RFref – RFm(u)||. If RFm(u) is a vector in time i.e. RFm(u), then the deviation is calculated as sm
2=[RFref – RFm(u)]T [RFref – RFm(u)]. Assuming a Gaussian probability distribution for the mismatch with the mean as RFref and the variance as sm
2, we can calculate the probability that any model in the cluster m would match the observed data i.e. p(RFref|zm (u)). The prior probability of the response RFref within the pool of M responses for the reduced models i.e. p(RFref) can also be calculated by pooling together the responses for the M reduced models and finding the probability corresponding to RFref.
The objective is to derive the posterior probability p(zm(u)|RFref) i.e. the updated probability for the M models given the observed injection response. This can be computed by a straight forward application of Bayes’ rule:
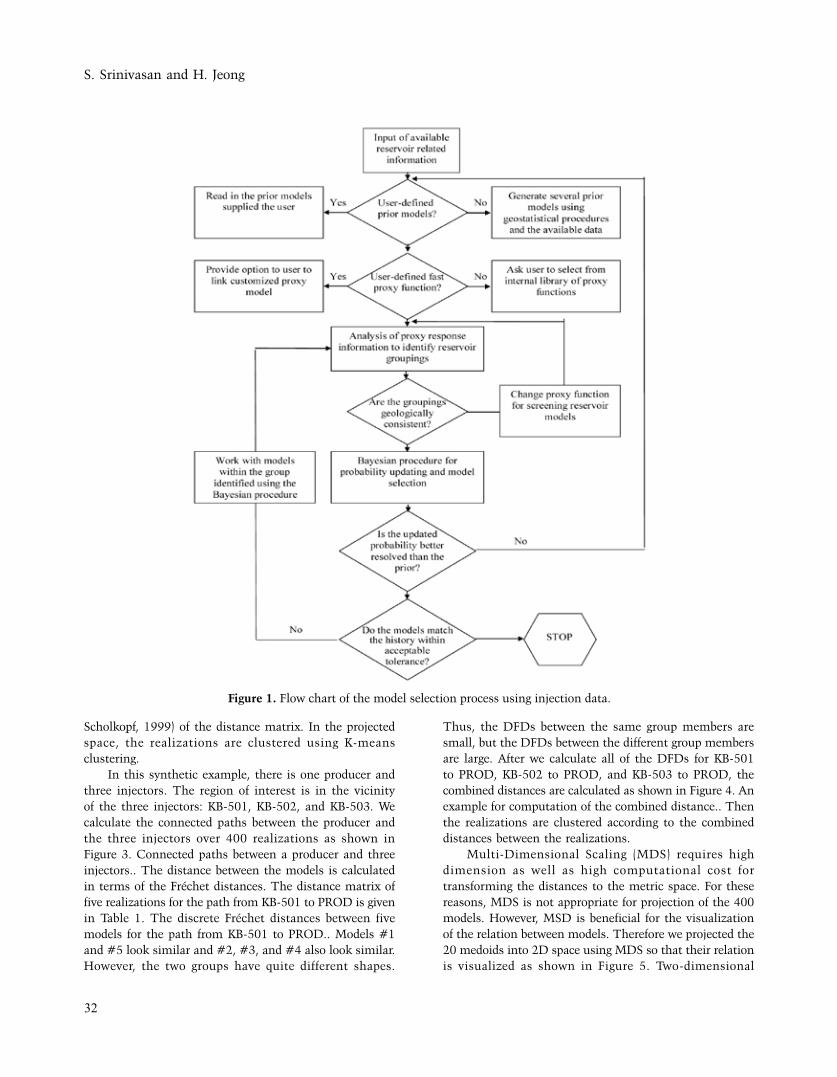
32
S. Srinivasan and H. Jeong
Scholkopf, 1999) of the distance matrix. In the projected space, the realizations are clustered using K-means clustering.
In this synthetic example, there is one producer and three injectors. The region of interest is in the vicinity of the three injectors: KB-501, KB-502, and KB-503. We calculate the connected paths between the producer and the three injectors over 400 realizations as shown in Figure 3. Connected paths between a producer and three injectors.. The distance between the models is calculated in terms of the Fréchet distances. The distance matrix of five realizations for the path from KB-501 to PROD is given in Table 1. The discrete Fréchet distances between five models for the path from KB-501 to PROD.. Models #1 and #5 look similar and #2, #3, and #4 also look similar. However, the two groups have quite different shapes.
Thus, the DFDs between the same group members are small, but the DFDs between the different group members are large. After we calculate all of the DFDs for KB-501 to PROD, KB-502 to PROD, and KB-503 to PROD, the combined distances are calculated as shown in Figure 4. An example for computation of the combined distance.. Then the realizations are clustered according to the combined distances between the realizations.
Multi-Dimensional Scaling (MDS) requires high dimension as well as high computational cost for transforming the distances to the metric space. For these reasons, MDS is not appropriate for projection of the 400 models. However, MSD is beneficial for the visualization of the relation between models. Therefore we projected the 20 medoids into 2D space using MDS so that their relation is visualized as shown in Figure 5. Two-dimensional
Figure 1. Flow chart of the model selection process using injection data.
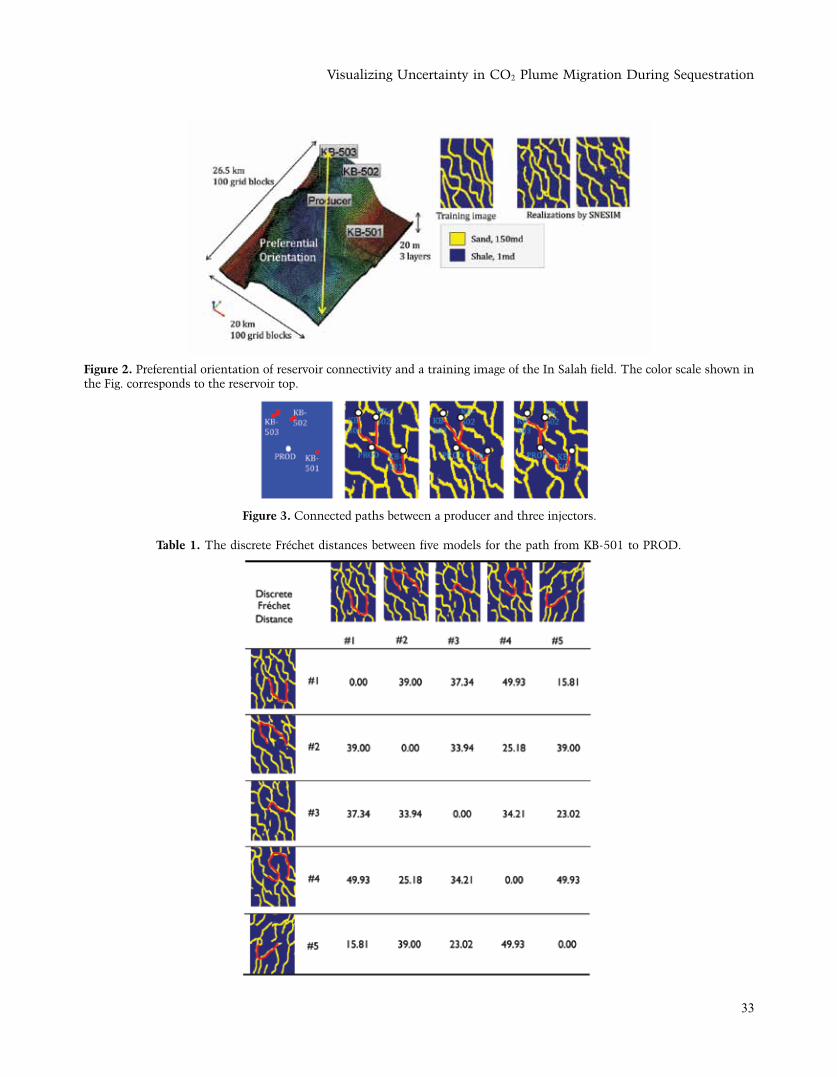
33
Visualizing Uncertainty in CO2 Plume Migration During Sequestration
Figure 2. Preferential orientation of reservoir connectivity and a training image of the In Salah field. The color scale shown in the Fig. corresponds to the reservoir top.
Figure 3. Connected paths between a producer and three injectors.
Table 1. The discrete Fréchet distances between five models for the path from KB-501 to PROD.
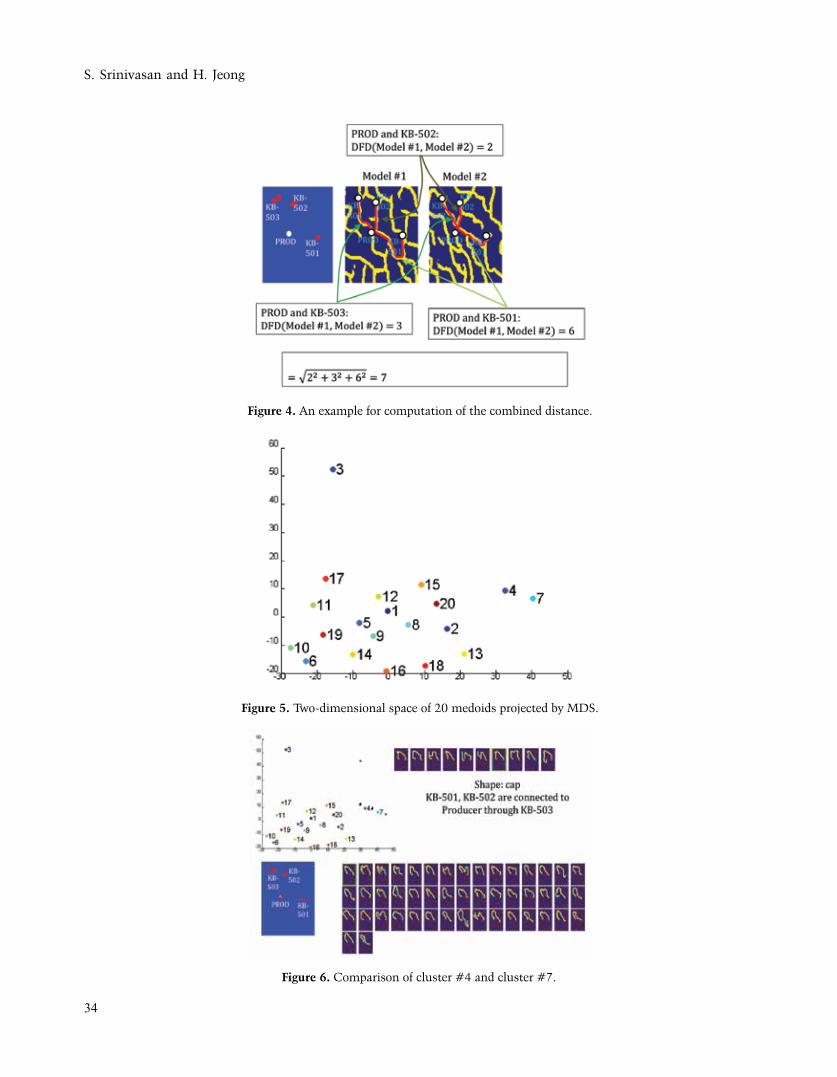
34
S. Srinivasan and H. Jeong
Figure 4. An example for computation of the combined distance.
Figure 5. Two-dimensional space of 20 medoids projected by MDS.
Figure 6. Comparison of cluster #4 and cluster #7.
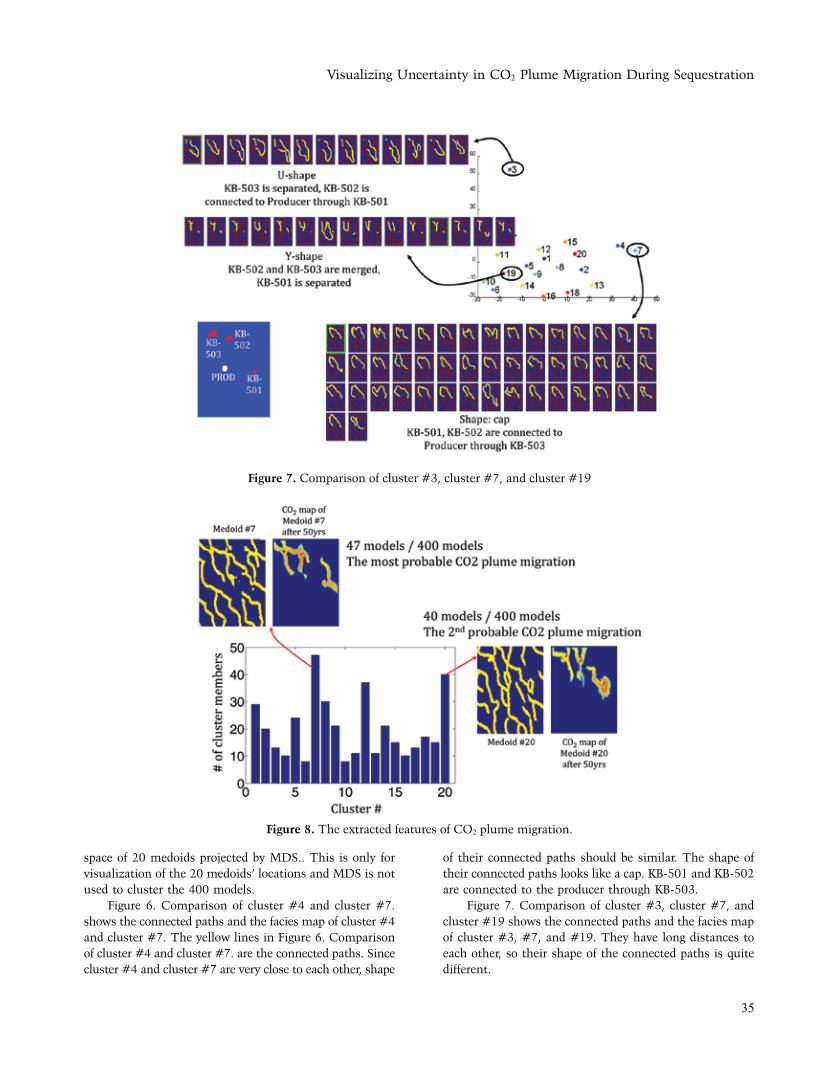
35
Visualizing Uncertainty in CO2 Plume Migration During Sequestration
space of 20 medoids projected by MDS.. This is only for visualization of the 20 medoids’ locations and MDS is not used to cluster the 400 models.
Figure 6. Comparison of cluster #4 and cluster #7. shows the connected paths and the facies map of cluster #4 and cluster #7. The yellow lines in Figure 6. Comparison of cluster #4 and cluster #7. are the connected paths. Since cluster #4 and cluster #7 are very close to each other, shape
of their connected paths should be similar. The shape of their connected paths looks like a cap. KB-501 and KB-502 are connected to the producer through KB-503.
Figure 7. Comparison of cluster #3, cluster #7, and cluster #19 shows the connected paths and the facies map of cluster #3, #7, and #19. They have long distances to each other, so their shape of the connected paths is quite different.
Figure 7. Comparison of cluster #3, cluster #7, and cluster #19
Figure 8. The extracted features of CO2 plume migration.
36
S. Srinivasan and H. Jeong
Since we assume the connected paths are similar to CO2 plume migration paths, we do not need to run a simulator to quantify uncertainty of the CO2 plume migration. We cluster the models based on the shape of the connected paths instead of the simulation results of CO2 plume migration to quantify the uncertainty of CO2 plume migration. Once we cluster the models, we are able to extract the features CO2 plume migration by simulating the representative models instead of all the models. Figure 8. The extracted features of CO2 plume migration. shows the two extracted features of CO2 plume migration. In Figure 8. The extracted features of CO2 plume migration., the histogram shows the number of cluster members for each cluster. Since cluster #7 has the most number of cluster members, the CO2 map of cluster #7 can be considered as the most probable CO2 plume migration. Likewise, the CO2 map of cluster #20 can be considered as the second probable CO2 plume migration.
CONCLUSIONS
The paper presents a novel approach to classify prior geologic models on the basis of connectivity of flow paths within the reservoir. Dissimilarity between prior models is computed on the basis of the differences in the characteristics of the shortest connected path between well pairs. The concept of discrete Frechet distance is used for this computation. The dissimilarity measures are grouped using k-medoid clustering. Flow simulation on models belonging to any cluster reveals similarity in CO2 swept regions in all models belonging to a cluster. However, the current approach has two problems in quantifying the uncertainty of CO2 plume migration. The first problem is that CO2 may migrate along disconnected paths, in other words local flow and transport gradients may cause the CO2 plume to bridge permeability discontinuities. The current
approach compares only connected paths. We therefore should measure path similarity regardless of connection between points of interest. The second problem is that the current approach can be applied to only convection-dominant models such as channel, fractured reservoir models. Thus, development of a similarity measure applicable to general geologic models is necessary.
REFERRENCES
Eiter, T., and Mannila, H., 1994. Computing discrete Fréchet
distance. Technische Universitat Wien Technical Report
CD-TR, v. 94, pp: 64.
Srinivasan, S. and Jeong, H., 2012. Modeling the Uncertainty in
CO2 Plume Migration During Sequestration Using a Model
Selection Approach. Proceedings of the Ninth Conference on
Geostatistics for Environmental Applications, geoENV2012,
Valencia, Spain, September 19–21.
Kim, Y.H., Srinivasan, S., and Bryant, S.L., 2008. Efficient
Region Decomposition for Parallel Simulation Accounting
for Uncertainty in the Reservoir Model. SPE 116752, SPE
Annual Technical Conference and Exhibition, Denver.
Kruskal, J. B., and Wish, M., 1978. Multidimensional Scaling.
Sage University Paper series on Quantitative Applications
in the Social Sciences, Sage Publications, Newbury Park,
CA, pp: 07-011.
Romney, A. K., Shepard, R. N., and Nerlove, S. B., 1972.
Multidimensional Scaling - Theory and Applications in the
Behavioral Sciences. Seminar Press., New York v.2.
Scholkopf, B., Smola, A., and Muller, K.R., 1999. Kernel Principal
Component Analysis. In B. Scholkopf, C. J. C. Burges, and
A. J. Smola, editors, Advances in Kernel Methods–Support
Vector Learning, MIT Press, Cambridge, MA, pp: 327-352.
Strebelle, S., 2002. Conditional Simulation of Complex Geological
Structures Using Multiple-Point Statistics, Mathematical
Geology, v.34, 1.
Coal Bed Methane Exploration and Possibility for CO2 Sequestration in Jharia Coalfield, India
37
Coal Bed Methane Exploration and Possibility for CO2 Sequestration in Jharia Coalfield, India
R. Chatterjee1* and S. Paul2
1 Department of Applied Geophysics, Indian School of Mines, Dhanbad - 8260042 Department of Petroleum Engineering, All Habeeb College of Engineering and Technology, Hyderabad - 501503
*Corresponding Author: [email protected]
ABSTRACTCoal proximate parameters, petrography and permeability are key parameters for evaluating the economic production of natural gas from coal seams of Jharia coalfield. Coal quality parameters, including maceral composition, grade and rank, have a significant impact on the source rock and reservoir characteristics of coal. Coal proximate parameters such as ash content, volatile matter and moisture content of these coal seams vary between 17.45% to 33.75%, 15.45% to 25.84% and 0.68% to 1.21% respectively. Coal petrographic analysis, carried out for a selected 16 coal core samples shows that vitrinite reflectance of coal samples varies from 1.21% to 1.75%. Gas content values, calculated from available empirical equation vary from 11.11 cc/gm to 11.91 cc/gm. Considering the actually available experimental data, coals rich in vitrinitemacerals is promising for the exploitation of CBM. The injection of CO2 into coal beds and simultaneous production of CBM combines gas production (enhanced CBM recovery) with CO2 sequestration results in cleaner energy production. The present work would be useful for CO2 sequestration while producing CBM from the Jharia coalfield in near future.
INTRODUCTION
Exploration in coal bed methane (CBM) in Jharia coalfield has been going on vigorously for some 15 years. Methane from coal represents an emerging energy resource that has considerable long-term potential for discovery and development. During the formation and maturation of coal, considerable amount of hydrocarbons, mainly methane, is generated by both biogenic and thermogenic processes which in turn are controlled by burial history, maceral composition, and basin hydrodynamics (Scott and Kaiser, 1996). Coal quality parameters, including maceral composition, grade, and rank, have a significant impact on the source rock and reservoir characteristics of coal (Scott and Kaiser, 1996).
There are several case studies which focus on the relationship of coal quality to gas sorption and to quantify the CO2 sequestration capacity of CBM reservoirs in USA and Canada (White et al., 2005; Gentzis, 2000). Gas content of the recovered coal samples were determined by carrying out canister desorption tests at reservoir temperature at well sites by using the modified direct method of the United States of Bureau of Mines (USBM) (Diamond and Levine, 1981). The other available techniques of estimating gas content from well log mainly uses the density log for determination of ash content and other proximate parameters for the estimation of gas content.
Coal reservoir parameters such as gas content, coal seam permeability, coal seam thickness, critical desorption pressure, reservoir pressure generally affect the CBM production, among which permeability is the main factor
to the migration and flow of gas in CBM reservoir and thus controls CBM production (Paul and Chatterjee, 2011a; Paul and Chatterjee, 2011b). Recent studies of cleat orientation patterns and fracture style in Jharia coalfield yielded insight into coal permeability and CBM production (Paul and Chatterjee, 2011b). Prior information about opening mode fracture/face cleat orientation pattern in a coal field is another requirement to plan well locations or horizontal drilling for any CBM project development including CO2 sequestration.
To assess the coal seam for its CBM potentiality and for future enhanced CBM recovery, coal properties are to be known. The objectives of this paper are (a) to obtain coal chemical properties from proximate analysis of core samples, (b) estimation of coal bed permeability from well log and (c) to assess the possibility for CO2 sequestration. Although the focus of this work has been on potentiality of coal beds as CBM reservoir, it will also serve as a basis for future assessments of the coal beds for other use such as sites for sequestration of CO2 with simultaneous recovery of CBM.
STUDY AREA
The Jharia coal field located in Jharkhand state, India is roughly sickle shaped, its longer axis running northwest-southeast. The dip of the Formation in general is southerly (10°). The stratigraphic units of the Jharia coalfield are marked by the presence of two coal-bearing horizons: the Barakar Formation and the Raniganj Formation. Present study area, consisting of Singra, Kapuria, Barki, Dumarda
J. Ind. Geophys. Union (January 2016)Special Volume-1/ 2016 pp: 37-41
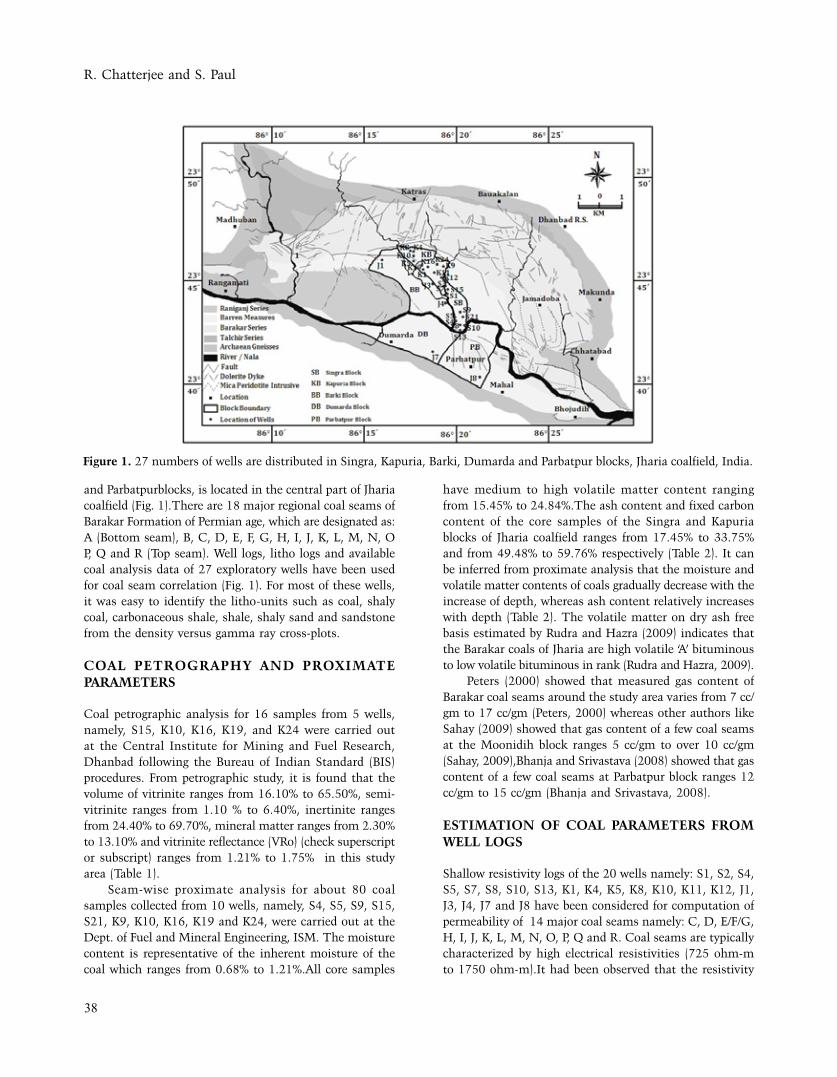
R. Chatterjee and S. Paul
38
and Parbatpurblocks, is located in the central part of Jharia coalfield (Fig. 1).There are 18 major regional coal seams of Barakar Formation of Permian age, which are designated as: A (Bottom seam), B, C, D, E, F, G, H, I, J, K, L, M, N, O P, Q and R (Top seam). Well logs, litho logs and available coal analysis data of 27 exploratory wells have been used for coal seam correlation (Fig. 1). For most of these wells, it was easy to identify the litho-units such as coal, shaly coal, carbonaceous shale, shale, shaly sand and sandstone from the density versus gamma ray cross-plots.
COAL PETROGRAPHY AND PROXIMATE PARAMETERS
Coal petrographic analysis for 16 samples from 5 wells, namely, S15, K10, K16, K19, and K24 were carried out at the Central Institute for Mining and Fuel Research, Dhanbad following the Bureau of Indian Standard (BIS) procedures. From petrographic study, it is found that the volume of vitrinite ranges from 16.10% to 65.50%, semi-vitrinite ranges from 1.10 % to 6.40%, inertinite ranges from 24.40% to 69.70%, mineral matter ranges from 2.30% to 13.10% and vitrinite reflectance (VRo) (check superscript or subscript) ranges from 1.21% to 1.75% in this study area (Table 1).
Seam-wise proximate analysis for about 80 coal samples collected from 10 wells, namely, S4, S5, S9, S15, S21, K9, K10, K16, K19 and K24, were carried out at the Dept. of Fuel and Mineral Engineering, ISM. The moisture content is representative of the inherent moisture of the coal which ranges from 0.68% to 1.21%.All core samples
have medium to high volatile matter content ranging from 15.45% to 24.84%.The ash content and fixed carbon content of the core samples of the Singra and Kapuria blocks of Jharia coalfield ranges from 17.45% to 33.75% and from 49.48% to 59.76% respectively (Table 2). It can be inferred from proximate analysis that the moisture and volatile matter contents of coals gradually decrease with the increase of depth, whereas ash content relatively increases with depth (Table 2). The volatile matter on dry ash free basis estimated by Rudra and Hazra (2009) indicates that the Barakar coals of Jharia are high volatile ‘A’ bituminous to low volatile bituminous in rank (Rudra and Hazra, 2009).
Peters (2000) showed that measured gas content of Barakar coal seams around the study area varies from 7 cc/gm to 17 cc/gm (Peters, 2000) whereas other authors like Sahay (2009) showed that gas content of a few coal seams at the Moonidih block ranges 5 cc/gm to over 10 cc/gm (Sahay, 2009),Bhanja and Srivastava (2008) showed that gas content of a few coal seams at Parbatpur block ranges 12 cc/gm to 15 cc/gm (Bhanja and Srivastava, 2008).
ESTIMATION OF COAL PARAMETERS FROM WELL LOGS
Shallow resistivity logs of the 20 wells namely: S1, S2, S4, S5, S7, S8, S10, S13, K1, K4, K5, K8, K10, K11, K12, J1, J3, J4, J7 and J8 have been considered for computation of permeability of 14 major coal seams namely: C, D, E/F/G, H, I, J, K, L, M, N, O, P, Q and R. Coal seams are typically characterized by high electrical resistivities (725 ohm-m to 1750 ohm-m).It had been observed that the resistivity
Figure 1. 27 numbers of wells are distributed in Singra, Kapuria, Barki, Dumarda and Parbatpur blocks, Jharia coalfield, India.
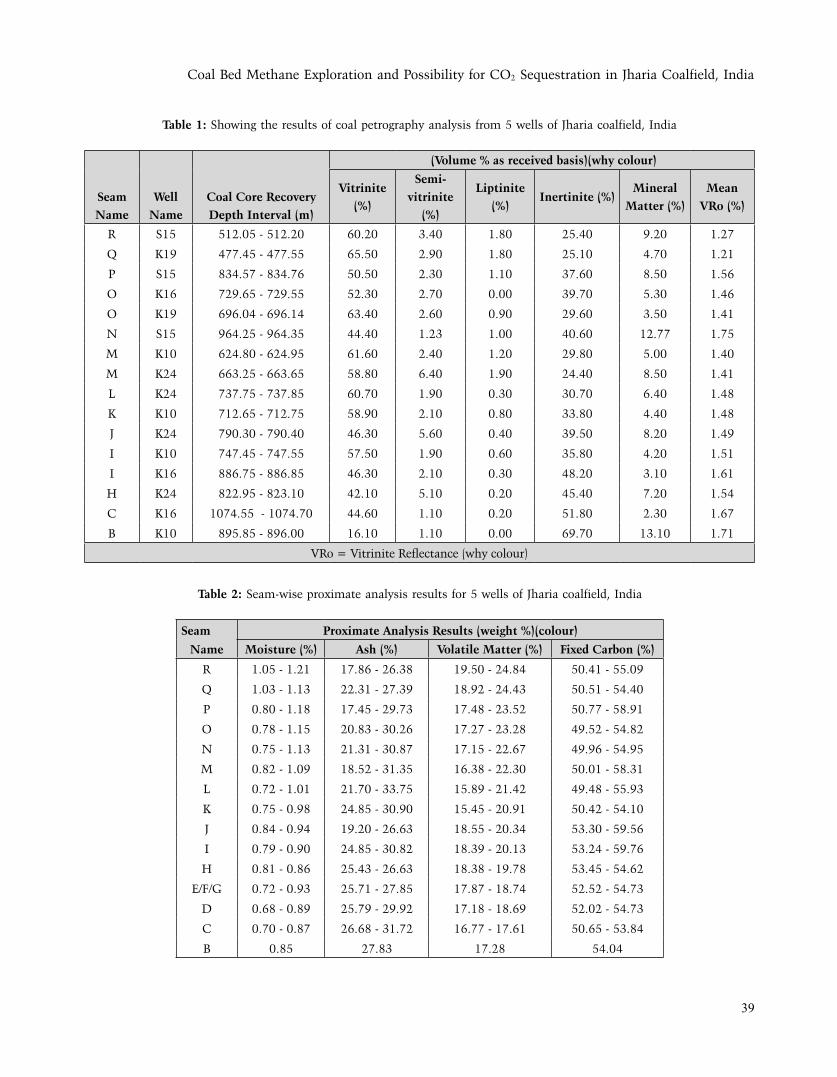
Coal Bed Methane Exploration and Possibility for CO2 Sequestration in Jharia Coalfield, India
39
Table 1: Showing the results of coal petrography analysis from 5 wells of Jharia coalfield, India
(Volume % as received basis)(why colour)
Seam Name
Well Name
Coal Core Recovery Depth Interval (m)
Vitrinite (%)
Semi-vitrinite
(%)
Liptinite (%)
Inertinite (%)Mineral
Matter (%)Mean
VRo (%)
R S15 512.05 - 512.20 60.20 3.40 1.80 25.40 9.20 1.27
Q K19 477.45 - 477.55 65.50 2.90 1.80 25.10 4.70 1.21
P S15 834.57 - 834.76 50.50 2.30 1.10 37.60 8.50 1.56
O K16 729.65 - 729.55 52.30 2.70 0.00 39.70 5.30 1.46
O K19 696.04 - 696.14 63.40 2.60 0.90 29.60 3.50 1.41
N S15 964.25 - 964.35 44.40 1.23 1.00 40.60 12.77 1.75
M K10 624.80 - 624.95 61.60 2.40 1.20 29.80 5.00 1.40
M K24 663.25 - 663.65 58.80 6.40 1.90 24.40 8.50 1.41
L K24 737.75 - 737.85 60.70 1.90 0.30 30.70 6.40 1.48
K K10 712.65 - 712.75 58.90 2.10 0.80 33.80 4.40 1.48
J K24 790.30 - 790.40 46.30 5.60 0.40 39.50 8.20 1.49
I K10 747.45 - 747.55 57.50 1.90 0.60 35.80 4.20 1.51
I K16 886.75 - 886.85 46.30 2.10 0.30 48.20 3.10 1.61
H K24 822.95 - 823.10 42.10 5.10 0.20 45.40 7.20 1.54
C K16 1074.55 - 1074.70 44.60 1.10 0.20 51.80 2.30 1.67
B K10 895.85 - 896.00 16.10 1.10 0.00 69.70 13.10 1.71
VRo = Vitrinite Reflectance (why colour)
Table 2: Seam-wise proximate analysis results for 5 wells of Jharia coalfield, India
Seam Proximate Analysis Results (weight %)(colour)
Name Moisture (%) Ash (%) Volatile Matter (%) Fixed Carbon (%)
R 1.05 - 1.21 17.86 - 26.38 19.50 - 24.84 50.41 - 55.09
Q 1.03 - 1.13 22.31 - 27.39 18.92 - 24.43 50.51 - 54.40
P 0.80 - 1.18 17.45 - 29.73 17.48 - 23.52 50.77 - 58.91
O 0.78 - 1.15 20.83 - 30.26 17.27 - 23.28 49.52 - 54.82
N 0.75 - 1.13 21.31 - 30.87 17.15 - 22.67 49.96 - 54.95
M 0.82 - 1.09 18.52 - 31.35 16.38 - 22.30 50.01 - 58.31
L 0.72 - 1.01 21.70 - 33.75 15.89 - 21.42 49.48 - 55.93
K 0.75 - 0.98 24.85 - 30.90 15.45 - 20.91 50.42 - 54.10
J 0.84 - 0.94 19.20 - 26.63 18.55 - 20.34 53.30 - 59.56
I 0.79 - 0.90 24.85 - 30.82 18.39 - 20.13 53.24 - 59.76
H 0.81 - 0.86 25.43 - 26.63 18.38 - 19.78 53.45 - 54.62
E/F/G 0.72 - 0.93 25.71 - 27.85 17.87 - 18.74 52.52 - 54.73
D 0.68 - 0.89 25.79 - 29.92 17.18 - 18.69 52.02 - 54.73
C 0.70 - 0.87 26.68 - 31.72 16.77 - 17.61 50.65 - 53.84
B 0.85 27.83 17.28 54.04
R. Chatterjee and S. Paul
40
measured by shallow resistivity logging tool across the coal seam decreases substantially in wellbores filled with high salinity fluids compared to wells with low salinity fluids (Yang et al., 2006). This indicated that the borehole fluid had replaced pore fluid in the cleats (invasion zone). The cleat volume / porosity of cleated coal is given by the previous authors (Paul and Chatterjee, 2011a) as,
Cleat volume or Porosity (F)=100 x (0.65/Resistivity) 0.6 … (1)
Using the matchstick model of cleating, initial porosity and initial permeability of coal in the Jharia Coalfield area can be expressed as a function of cleat spacing and aperture (Harpalani and Chen, 1995).
Porosity (F)=2b/s and Permeability (K)=b3/12s … (2)
where, b is cleat aperture and s is cleat spacing.
Cleat spacing of 20 mm as observed previously at the underground mines and opencast mines of Jharia coalfield (Paul and Chatterjee, 2011a; Paul and Chatterjee, 2011b) has been used for computation of permeability. Coal seam permeability value ranges from 0.60 md to 1.25 md. There is a significant variation of permeability within the same seam.
POSSIBILITY FOR CO2 SEQUESTRATION
The recent technology of CO2 sequestration offers an approach to redirect CO2 emissions into sinks (e.g., depleted oil/gas fields with enhanced oil recovery, deep saline aquifers, gas rich shales, salt caverns, oceans, and other geological formations) and stabilize future atmospheric CO2 levels (Gentzis, 2000; White et al., 2005). Coal seams have the ability to store significant amount of gases by adsorbing them. The CO2 storing capacity within coal seams is much greater than CH4 storing capacity. The net ratio of injected CO2 to recovered CH4 varies from 2:1 to as high as 10:1 (Nelson, 2003; Carroll and Pashin, 2003). This storage mechanism occurs naturally and is well documented, suggesting that a gas, particularly CO2, can be reliably stored in coal seams. Unmineable coal seams are among the types of geological formations that are being considered by industry and government agencies for use as sites for geological CO2 sequestration (White et al., 2005). Unmineable coal seams at a depth of around 700 m to 1500 m are suitable for CO2 sequestration. Many of these coal deposits occur at depths greater than 700 m, which renders them uneconomical for recovery by surface mining or underground mining, and, thus, potentially viable targets for CO2 sequestration. CO2 sequestration in unmineable coal seams would most likely only be conducted in areas where natural gas recovery would provide a value-added
revenue stream to partially offset the cost of the CO2
capture and sequestration processes (White et al., 2005).It is not anticipated that all coalbed gas reservoirs
are suitable candidates for CO2 (subscript) sequestration or application of Enhanced Coal Bed Methane (ECBM) technology. Carbon capture, CO2 sequestration and CO2 related ECBM have been conducted in several regions of the United States, Canada, Europe, Japan, Austraila, Poland and China (e.g. Nelson, 2000; Carroll and Pashin, 2003, Damen et al., 2005; Yu et al., 2007, Gurba et al., 2009 and Pinetown, 2013). These laboratory research and field projects have been focused on bituminous or sub-bituminous coals, and their results, although relevant, are not entirely applicable to the lignite coals of the Williston Basin. Permeability and gas sorption capacity are two key characteristics of coal that are known to vary significantly according to coal rank. The results of the Colorado, Alberta, and Alabama projects, therefore, have limited applicability to lignite coals. With this in mind, permeability and sorption isotherm tests are needed to be conducted in order to determine if CO2 injection into a coalbed would be feasible and would enhance CH4recovery from a coalbed reservoir.
Considering the actually available experimental data, coals rich in vitrinitemacerals (> 50%) are promising for the exploitation of CBM. Production of CBM by injecting CO2 in coal beds is one of the popular methods of enhanced recovery of CBM (ECBM).The coal seams occurring at a depth of more than 700 m, thickness of more than 1 m and permeability of about 1 md with gas content more than 10 cc/gmmay be considered for planning of any ECBM project. The present work may be useful for CO2sequestration while producing CBM from the Jharia coalfield in near future. Though it is beyond the scope of the present work, it is suggested to conduct adsorption isotherm study in future before going for CO2sequestration.
CONCLUSIONS
The Barakar coal seams under the study area, as revealed from the proximate and petrographic analysis, are of medium volatile to high volatile bituminous “A” in rank, ash content ranging from 17.4% to 33.7%, VRo% ranging from 1.21% to 1.75%, reflecting the maturation of coal and prospecting for CBM exploration/exploitation. Permeability of the 14 major coal seams of the study area has been estimated by using well logs. As significant variation of permeability is observed within the same seam, it may be used as a guide to locate potential CBM areas for exploration. Predicted coal seam permeability values ranging 0.65 md to 1.25 md are in good match with the well test permeability data (Peters, 2000; Sahay, 2009) adjacent to the study area. The findings summarized here, are useful for CO2 sequestration and ECBM studies.
Coal Bed Methane Exploration and Possibility for CO2 Sequestration in Jharia Coalfield, India
41
ACKNOWLEDGEMENT
The authors express their sincere gratitude to Coal India Limited (CIL) and Central Mine Planning and Design Institute Limited (CMPDIL), Ranchi for the financial assistance under its R&D scheme.
REFERENCES
Bhanja, A.K. and Srivastava, O.P., 2008.A New Approach to
Estimate CBM Gas Content from Well Logs. SPE Asia Pacific
Oil and Gas Conference and Exhibition, Perth, Australia,
October 20-22, Paper No. SPE 115563.
Carroll, R.E. andPashin, J.C., 2003. Relationship of sorption
capacity to coal quality - CO2 sequestration potential of
coalbed methane reservoirs in the Black Warrior Basin.
In the proceeding of International Coalbed Methane
Symposium, University of Alabama, Tuscaloosa, Alabama,
May 5–9, pp:11 , Paper Id. 0317.
Damen, K., Faaij, A., Van Bergen F., Gale J. andLysen, E., 2005.
Identification of early opportunities for CO2 sequestration—
worldwide screening for CO2-EOR and CO2-ECBM projects,
Energy, v. 30, pp: 1931–1952.
Diamond, W.P., and Levine, J.R., 1981.Direct Method Determination
of the Gas Content of Coal: Procedures and Results. US
Bureau of Mines Report of Investigations, RI 8515.
Gentzis, T., 2000. Subsurface sequestration of carbon dioxide —
an overview from an Alberta (Canada) perspective, Int. J.
Coal Geol., v. 43, pp: 287-305.
Harpalani, S., and Chen, G., 1995.Estimation of changes in
fracture porosity of coal with gas emission. Fuel, v. 74(10),
pp: 1491-1498.
Nelson, C.R., 2000.Coalbed methane potential of the U.S. Rocky
Mountain region: Gas TIPS, v. 6(3), Chicago, Illinois, Gas
Technology Institute, pp: 4–12.
Nelson, C.R., 2003. Coalbed methane resources of North America,
past, present, and future. In the proceeding of International
Low-Rank Fuels Symposium, 18th, Billings, Montana, June
24–26, pp: 10.
Paul, S., andChatterjee, R.,2011a.Determination of in-situ stress
direction from cleat orientation mapping for coal bed
methane exploration in south-eastern part of Jharia coalfield.
India. Int. J. Coal Geol.,v. 87, pp: 87-96.
Paul, S., andChatterjee, R.,2011b.Mapping of cleats and fractures
as an indicator of in-situ stress orientation, Jharia Coalfield,
India. Int. J. Coal Geol., v. 88, pp: 113-122.
Peters, J., 2000. Evaluation of coalbed methane potential of Jharia
basin, India. SPE Asia Pacific Oil and Gas Conference and
Exhibition, Brisbane, Australia, October 16-18, Paper No.
SPE 64457.
Pinetown, K. L., 2013. Assessment of the CO2 (subscript)
sequestration potential of coal seams in the Hunter
Coalfield, Sydney Basin, Australian Journal of Earth
Sciences, v. 60, pp:141-156.
Rudra, M., and Hazra, P.N., 2009. Isotopic composition of
coalbed methane desorbed from Barakar coals of Damodar
valley Gondwana coalfields and its implication. Proc. of
PETROTECH, New Delhi, India, January 11-15.
Sahay, A.N., 2009. CMM Demonstration Project at Moonidih: A
path finder for CMM development in Indian Geo-mining
Scenario. MineTech, v. 30(4), pp: 11-17.
Scott, A.R., and Kaiser, W.R., 1996. Factors affecting gas-content
distribution in coal beds: a review (exp. abs.). Expanded
abstracts volume, Rocky Mountain Section Meeting: AAPG,
pp: 101–106.
White, C.M., Smith, D.H., Jones, K.L., Goodman, A.L., Jikich,
S.A., LaCount, R.B., DuBose, S. B., Ozdemir, E., Morsi,
B. I., and Schroeder, K. T. , 2005. Sequestration of Carbon
Dioxide in Coal with Enhanced Coalbed Methane Recovery
– A Review. Energy and Fuels, v.19(3), pp: 659-724.
Yang, Y., Peters, M., Cloud, T.A., and Van Kirk, C.W., 2006.
Gas productivity related to cleat volumes derived from
focused resistivity tools in Coalbed Methane (CBM) Fields.
Petrophysics, v. 47(3), pp: 250-257.
Yu H., Zhou, G., Fan, W.,and Ye, J., 2007.Predicted CO2 enhanced
coalbedmethane recovery and CO2 (subscript) sequestration
in China, International Journal of Coal Geology, v. 71, pp:
345–357.
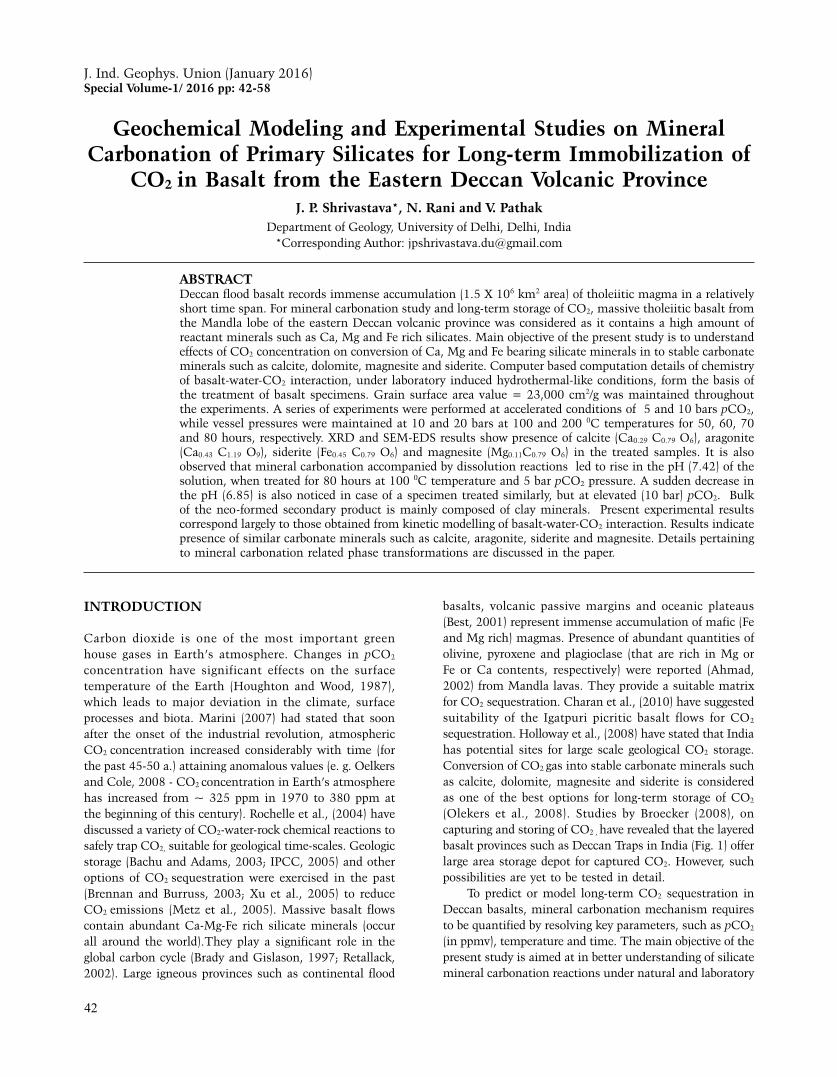
J. P. Shrivastava, N. Rani and V. Pathak
42
Geochemical Modeling and Experimental Studies on Mineral Carbonation of Primary Silicates for Long-term Immobilization of
CO2 in Basalt from the Eastern Deccan Volcanic ProvinceJ. P. Shrivastava*, N. Rani and V. Pathak
Department of Geology, University of Delhi, Delhi, India*Corresponding Author: [email protected]
ABSTRACTDeccan flood basalt records immense accumulation (1.5 X 10⁶ km2 area) of tholeiitic magma in a relatively short time span. For mineral carbonation study and long-term storage of CO2, massive tholeiitic basalt from the Mandla lobe of the eastern Deccan volcanic province was considered as it contains a high amount of reactant minerals such as Ca, Mg and Fe rich silicates. Main objective of the present study is to understand effects of CO2 concentration on conversion of Ca, Mg and Fe bearing silicate minerals in to stable carbonate minerals such as calcite, dolomite, magnesite and siderite. Computer based computation details of chemistry of basalt-water-CO2 interaction, under laboratory induced hydrothermal-like conditions, form the basis of the treatment of basalt specimens. Grain surface area value = 23,000 cm2/g was maintained throughout the experiments. A series of experiments were performed at accelerated conditions of 5 and 10 bars pCO2, while vessel pressures were maintained at 10 and 20 bars at 100 and 200 0C temperatures for 50, 60, 70 and 80 hours, respectively. XRD and SEM-EDS results show presence of calcite (Ca0.29 C0.79 O6), aragonite (Ca0.43 C1.19 O9), siderite (Fe0.45 C0.79 O6) and magnesite (Mg0.11C0.79 O6) in the treated samples. It is also observed that mineral carbonation accompanied by dissolution reactions led to rise in the pH (7.42) of the solution, when treated for 80 hours at 100 0C temperature and 5 bar pCO2 pressure. A sudden decrease in the pH (6.85) is also noticed in case of a specimen treated similarly, but at elevated (10 bar) pCO2. Bulk of the neo-formed secondary product is mainly composed of clay minerals. Present experimental results correspond largely to those obtained from kinetic modelling of basalt-water-CO2 interaction. Results indicate presence of similar carbonate minerals such as calcite, aragonite, siderite and magnesite. Details pertaining to mineral carbonation related phase transformations are discussed in the paper.
INTRODUCTION
Carbon dioxide is one of the most important green house gases in Earth’s atmosphere. Changes in pCO2 concentration have significant effects on the surface temperature of the Earth (Houghton and Wood, 1987), which leads to major deviation in the climate, surface processes and biota. Marini (2007) had stated that soon after the onset of the industrial revolution, atmospheric CO2 concentration increased considerably with time (for the past 45-50 a.) attaining anomalous values (e. g. Oelkers and Cole, 2008 - CO2 concentration in Earth’s atmosphere has increased from ~ 325 ppm in 1970 to 380 ppm at the beginning of this century). Rochelle et al., (2004) have discussed a variety of CO2-water-rock chemical reactions to safely trap CO2, suitable for geological time-scales. Geologic storage (Bachu and Adams, 2003; IPCC, 2005) and other options of CO2 sequestration were exercised in the past (Brennan and Burruss, 2003; Xu et al., 2005) to reduce CO2 emissions (Metz et al., 2005). Massive basalt flows contain abundant Ca-Mg-Fe rich silicate minerals (occur all around the world).They play a significant role in the global carbon cycle (Brady and Gislason, 1997; Retallack, 2002). Large igneous provinces such as continental flood
basalts, volcanic passive margins and oceanic plateaus (Best, 2001) represent immense accumulation of mafic (Fe and Mg rich) magmas. Presence of abundant quantities of olivine, pyroxene and plagioclase (that are rich in Mg or Fe or Ca contents, respectively) were reported (Ahmad, 2002) from Mandla lavas. They provide a suitable matrix for CO2 sequestration. Charan et al., (2010) have suggested suitability of the Igatpuri picritic basalt flows for CO2
sequestration. Holloway et al., (2008) have stated that India has potential sites for large scale geological CO2 storage. Conversion of CO2 gas into stable carbonate minerals such as calcite, dolomite, magnesite and siderite is considered as one of the best options for long-term storage of CO2 (Olekers et al., 2008). Studies by Broecker (2008), on capturing and storing of CO2 , have revealed that the layered basalt provinces such as Deccan Traps in India (Fig. 1) offer large area storage depot for captured CO2. However, such possibilities are yet to be tested in detail.
To predict or model long-term CO2 sequestration in Deccan basalts, mineral carbonation mechanism requires to be quantified by resolving key parameters, such as pCO2 (in ppmv), temperature and time. The main objective of the present study is aimed at in better understanding of silicate mineral carbonation reactions under natural and laboratory
J. Ind. Geophys. Union (January 2016)Special Volume-1/ 2016 pp: 42-58
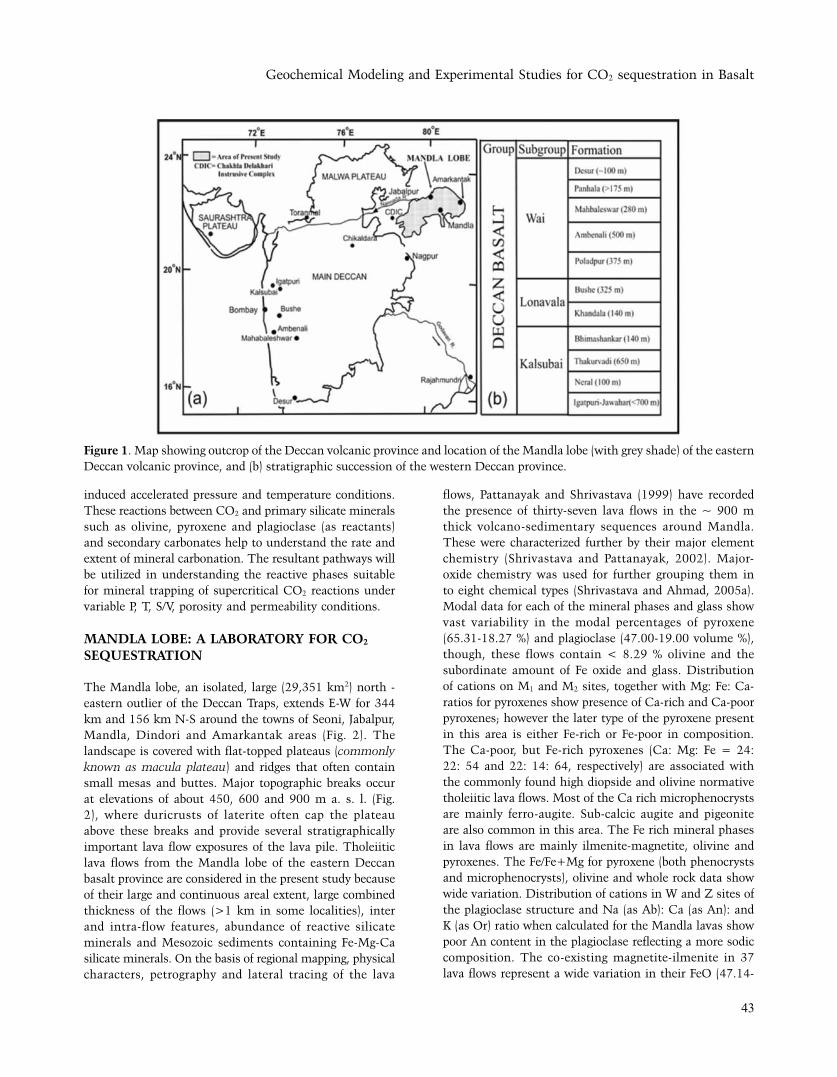
Geochemical Modeling and Experimental Studies for CO2 sequestration in Basalt
43
induced accelerated pressure and temperature conditions. These reactions between CO2 and primary silicate minerals such as olivine, pyroxene and plagioclase (as reactants) and secondary carbonates help to understand the rate and extent of mineral carbonation. The resultant pathways will be utilized in understanding the reactive phases suitable for mineral trapping of supercritical CO2 reactions under variable P, T, S/V, porosity and permeability conditions.
MANDLA LOBE: A LABORATORY FOR CO2 SEQUESTRATION
The Mandla lobe, an isolated, large (29,351 km2) north - eastern outlier of the Deccan Traps, extends E-W for 344 km and 156 km N-S around the towns of Seoni, Jabalpur, Mandla, Dindori and Amarkantak areas (Fig. 2). The landscape is covered with flat-topped plateaus (commonly known as macula plateau) and ridges that often contain small mesas and buttes. Major topographic breaks occur at elevations of about 450, 600 and 900 m a. s. l. (Fig. 2), where duricrusts of laterite often cap the plateau above these breaks and provide several stratigraphically important lava flow exposures of the lava pile. Tholeiitic lava flows from the Mandla lobe of the eastern Deccan basalt province are considered in the present study because of their large and continuous areal extent, large combined thickness of the flows (>1 km in some localities), inter and intra-flow features, abundance of reactive silicate minerals and Mesozoic sediments containing Fe-Mg-Ca silicate minerals. On the basis of regional mapping, physical characters, petrography and lateral tracing of the lava
flows, Pattanayak and Shrivastava (1999) have recorded the presence of thirty-seven lava flows in the ~ 900 m thick volcano-sedimentary sequences around Mandla. These were characterized further by their major element chemistry (Shrivastava and Pattanayak, 2002). Major-oxide chemistry was used for further grouping them in to eight chemical types (Shrivastava and Ahmad, 2005a). Modal data for each of the mineral phases and glass show vast variability in the modal percentages of pyroxene (65.31-18.27 %) and plagioclase (47.00-19.00 volume %), though, these flows contain < 8.29 % olivine and the subordinate amount of Fe oxide and glass. Distribution of cations on M1 and M2 sites, together with Mg: Fe: Ca-ratios for pyroxenes show presence of Ca-rich and Ca-poor pyroxenes; however the later type of the pyroxene present in this area is either Fe-rich or Fe-poor in composition. The Ca-poor, but Fe-rich pyroxenes (Ca: Mg: Fe = 24: 22: 54 and 22: 14: 64, respectively) are associated with the commonly found high diopside and olivine normative tholeiitic lava flows. Most of the Ca rich microphenocrysts are mainly ferro-augite. Sub-calcic augite and pigeonite are also common in this area. The Fe rich mineral phases in lava flows are mainly ilmenite-magnetite, olivine and pyroxenes. The Fe/Fe+Mg for pyroxene (both phenocrysts and microphenocrysts), olivine and whole rock data show wide variation. Distribution of cations in W and Z sites of the plagioclase structure and Na (as Ab): Ca (as An): and K (as Or) ratio when calculated for the Mandla lavas show poor An content in the plagioclase reflecting a more sodic composition. The co-existing magnetite-ilmenite in 37 lava flows represent a wide variation in their FeO (47.14-
Figure 1. Map showing outcrop of the Deccan volcanic province and location of the Mandla lobe (with grey shade) of the eastern Deccan volcanic province, and (b) stratigraphic succession of the western Deccan province.
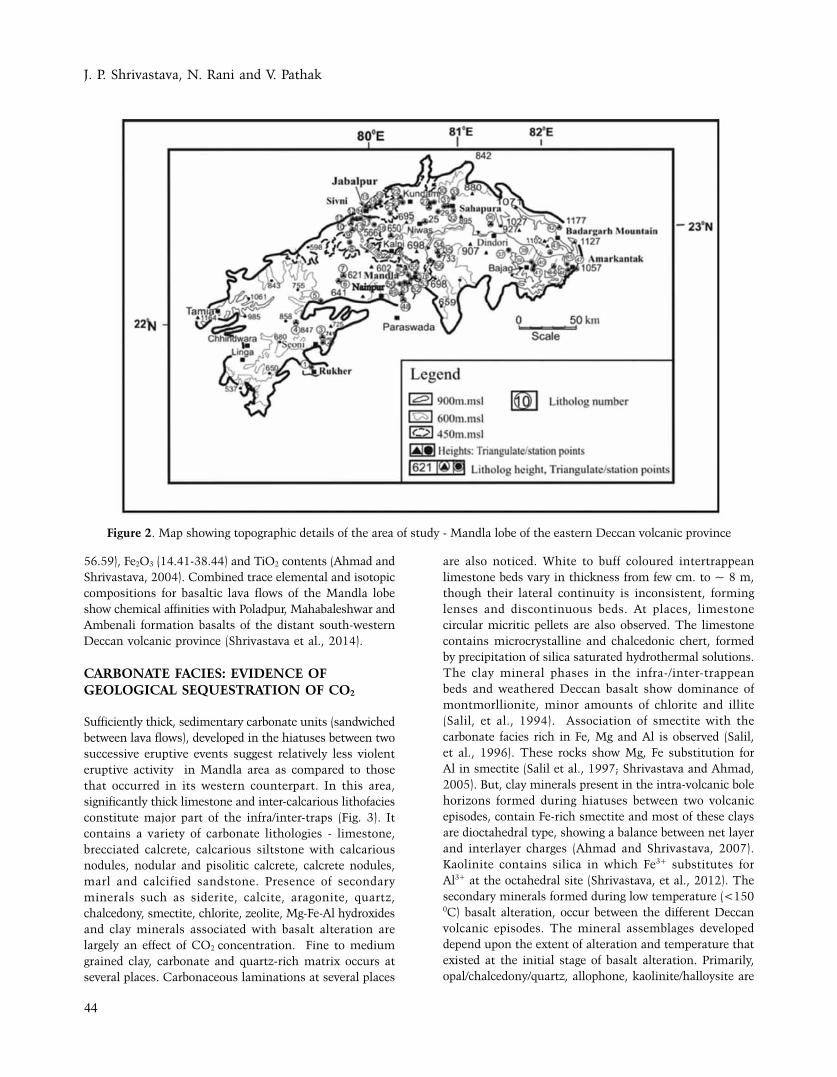
J. P. Shrivastava, N. Rani and V. Pathak
44
Figure 2. Map showing topographic details of the area of study - Mandla lobe of the eastern Deccan volcanic province
56.59), Fe2O3 (14.41-38.44) and TiO2 contents (Ahmad and Shrivastava, 2004). Combined trace elemental and isotopic compositions for basaltic lava flows of the Mandla lobe show chemical affinities with Poladpur, Mahabaleshwar and Ambenali formation basalts of the distant south-western Deccan volcanic province (Shrivastava et al., 2014).
CARBONATE FACIES: EVIDENCE OF GEOLOGICAL SEQUESTRATION OF CO2
Sufficiently thick, sedimentary carbonate units (sandwiched between lava flows), developed in the hiatuses between two successive eruptive events suggest relatively less violent eruptive activity in Mandla area as compared to those that occurred in its western counterpart. In this area, significantly thick limestone and inter-calcarious lithofacies constitute major part of the infra/inter-traps (Fig. 3). It contains a variety of carbonate lithologies - limestone, brecciated calcrete, calcarious siltstone with calcarious nodules, nodular and pisolitic calcrete, calcrete nodules, marl and calcified sandstone. Presence of secondary minerals such as siderite, calcite, aragonite, quartz, chalcedony, smectite, chlorite, zeolite, Mg-Fe-Al hydroxides and clay minerals associated with basalt alteration are largely an effect of CO2 concentration. Fine to medium grained clay, carbonate and quartz-rich matrix occurs at several places. Carbonaceous laminations at several places
are also noticed. White to buff coloured intertrappean limestone beds vary in thickness from few cm. to ~ 8 m, though their lateral continuity is inconsistent, forming lenses and discontinuous beds. At places, limestone circular micritic pellets are also observed. The limestone contains microcrystalline and chalcedonic chert, formed by precipitation of silica saturated hydrothermal solutions. The clay mineral phases in the infra-/inter-trappean beds and weathered Deccan basalt show dominance of montmorllionite, minor amounts of chlorite and illite (Salil, et al., 1994). Association of smectite with the carbonate facies rich in Fe, Mg and Al is observed (Salil, et al., 1996). These rocks show Mg, Fe substitution for Al in smectite (Salil et al., 1997; Shrivastava and Ahmad, 2005). But, clay minerals present in the intra-volcanic bole horizons formed during hiatuses between two volcanic episodes, contain Fe-rich smectite and most of these clays are dioctahedral type, showing a balance between net layer and interlayer charges (Ahmad and Shrivastava, 2007). Kaolinite contains silica in which Fe3+ substitutes for Al3+ at the octahedral site (Shrivastava, et al., 2012). The secondary minerals formed during low temperature (<150 0C) basalt alteration, occur between the different Deccan volcanic episodes. The mineral assemblages developed depend upon the extent of alteration and temperature that existed at the initial stage of basalt alteration. Primarily, opal/chalcedony/quartz, allophone, kaolinite/halloysite are
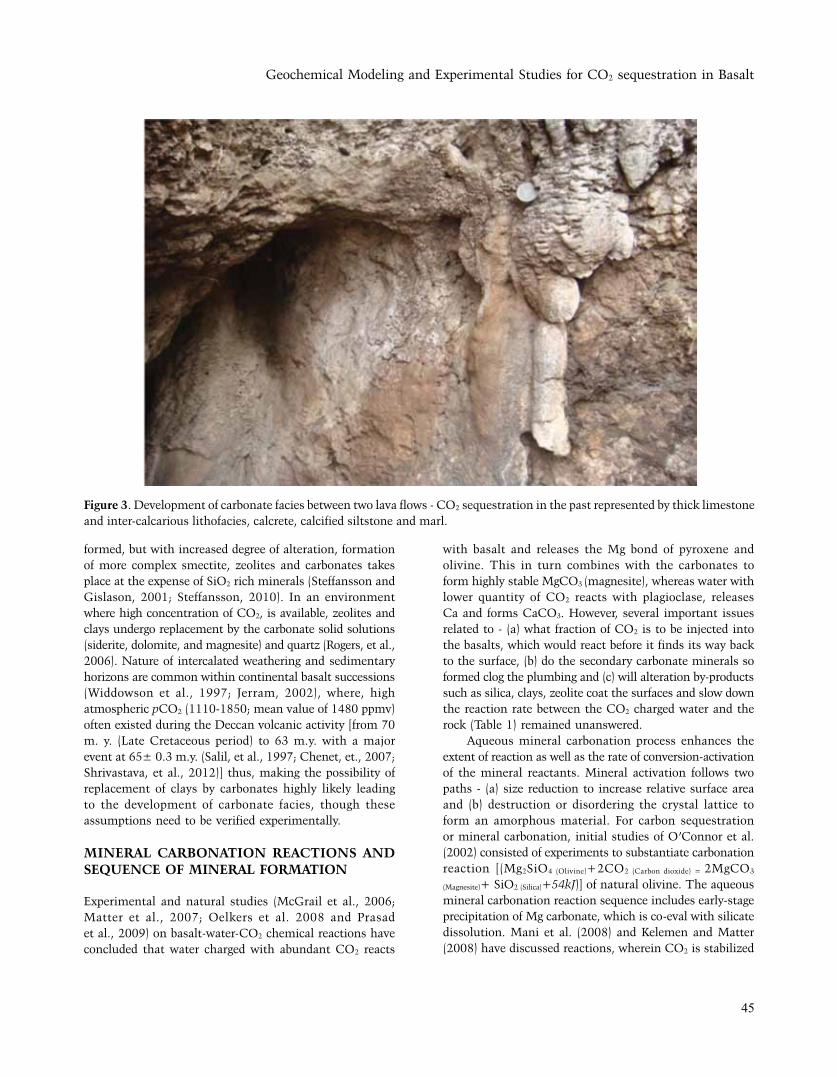
Geochemical Modeling and Experimental Studies for CO2 sequestration in Basalt
45
formed, but with increased degree of alteration, formation of more complex smectite, zeolites and carbonates takes place at the expense of SiO2 rich minerals (Steffansson and Gislason, 2001; Steffansson, 2010). In an environment where high concentration of CO2, is available, zeolites and clays undergo replacement by the carbonate solid solutions (siderite, dolomite, and magnesite) and quartz (Rogers, et al., 2006). Nature of intercalated weathering and sedimentary horizons are common within continental basalt successions (Widdowson et al., 1997; Jerram, 2002), where, high atmospheric pCO2 (1110-1850; mean value of 1480 ppmv) often existed during the Deccan volcanic activity [from 70 m. y. (Late Cretaceous period) to 63 m.y. with a major event at 65± 0.3 m.y. (Salil, et al., 1997; Chenet, et., 2007; Shrivastava, et al., 2012)] thus, making the possibility of replacement of clays by carbonates highly likely leading to the development of carbonate facies, though these assumptions need to be verified experimentally.
MINERAL CARBONATION REACTIONS AND SEQUENCE OF MINERAL FORMATION
Experimental and natural studies (McGrail et al., 2006; Matter et al., 2007; Oelkers et al. 2008 and Prasad et al., 2009) on basalt-water-CO2 chemical reactions have concluded that water charged with abundant CO2 reacts
with basalt and releases the Mg bond of pyroxene and olivine. This in turn combines with the carbonates to form highly stable MgCO3 (magnesite), whereas water with lower quantity of CO2 reacts with plagioclase, releases Ca and forms CaCO3. However, several important issues related to - (a) what fraction of CO2 is to be injected into the basalts, which would react before it finds its way back to the surface, (b) do the secondary carbonate minerals so formed clog the plumbing and (c) will alteration by-products such as silica, clays, zeolite coat the surfaces and slow down the reaction rate between the CO2 charged water and the rock (Table 1) remained unanswered.
Aqueous mineral carbonation process enhances the extent of reaction as well as the rate of conversion-activation of the mineral reactants. Mineral activation follows two paths - (a) size reduction to increase relative surface area and (b) destruction or disordering the crystal lattice to form an amorphous material. For carbon sequestration or mineral carbonation, initial studies of O’Connor et al. (2002) consisted of experiments to substantiate carbonation reaction [(Mg2SiO4 (Olivine)+2CO2 (Carbon dioxide) =
2MgCO3
(Magnesite)+ SiO2 (Silica)+54kJ)] of natural olivine. The aqueous mineral carbonation reaction sequence includes early-stage precipitation of Mg carbonate, which is co-eval with silicate dissolution. Mani et al. (2008) and Kelemen and Matter (2008) have discussed reactions, wherein CO2 is stabilized
Figure 3. Development of carbonate facies between two lava flows - CO2 sequestration in the past represented by thick limestone and inter-calcarious lithofacies, calcrete, calcified siltstone and marl.
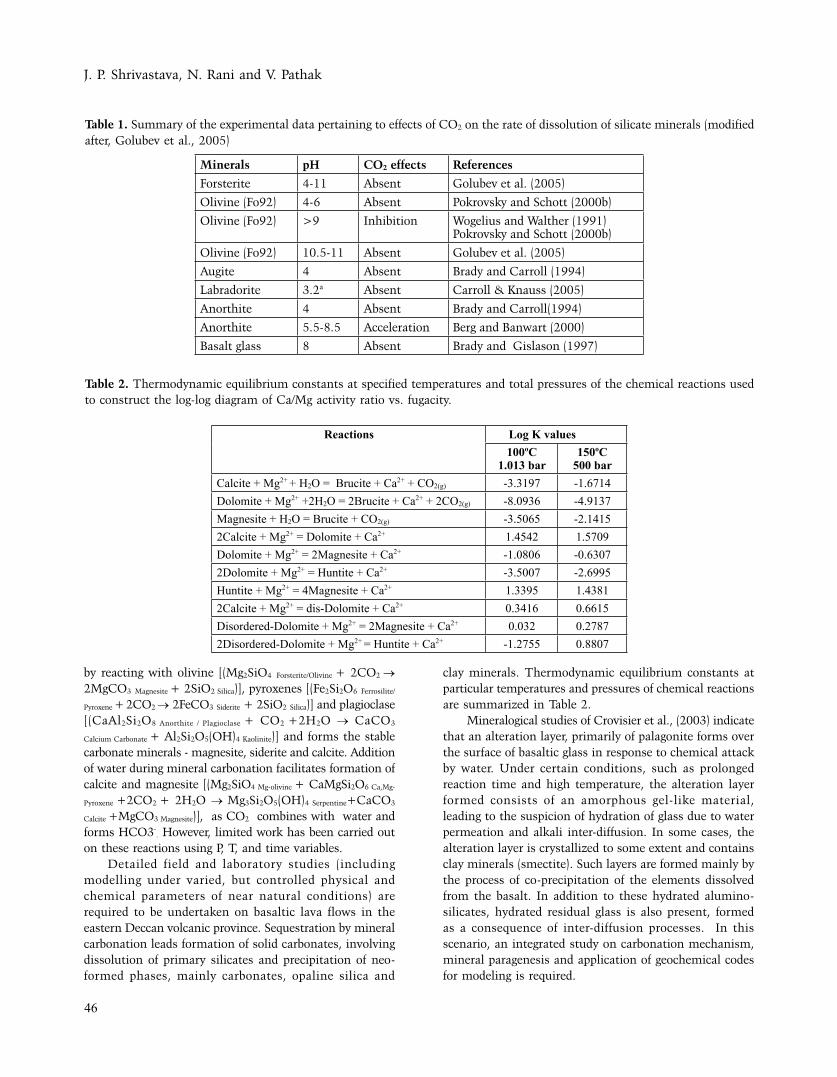
J. P. Shrivastava, N. Rani and V. Pathak
46
by reacting with olivine [(Mg2SiO4 Forsterite/Olivine + 2CO2 → 2MgCO3 Magnesite + 2SiO2 Silica)], pyroxenes [(Fe2Si2O6 Ferrosilite/
Pyroxene + 2CO2 → 2FeCO3 Siderite + 2SiO2 Silica)] and plagioclase [(CaAl2Si2O8 Anorthite / Plagioclase + CO2 +2H2O → CaCO3
Calcium Carbonate + Al2Si2O5(OH)4 Kaolinite)] and forms the stable carbonate minerals - magnesite, siderite and calcite. Addition of water during mineral carbonation facilitates formation of calcite and magnesite [(Mg2SiO4 Mg-olivine + CaMgSi2O6 Ca,Mg-
Pyroxene +2CO2 + 2H2O → Mg3Si2O5(OH)4 Serpentine+CaCO3
Calcite +MgCO3 Magnesite)], as CO2 combines with water and forms HCO3-
. However, limited work has been carried out on these reactions using P, T, and time variables.
Detailed field and laboratory studies (including modelling under varied, but controlled physical and chemical parameters of near natural conditions) are required to be undertaken on basaltic lava flows in the eastern Deccan volcanic province. Sequestration by mineral carbonation leads formation of solid carbonates, involving dissolution of primary silicates and precipitation of neo-formed phases, mainly carbonates, opaline silica and
clay minerals. Thermodynamic equilibrium constants at particular temperatures and pressures of chemical reactions are summarized in Table 2.
Mineralogical studies of Crovisier et al., (2003) indicate that an alteration layer, primarily of palagonite forms over the surface of basaltic glass in response to chemical attack by water. Under certain conditions, such as prolonged reaction time and high temperature, the alteration layer formed consists of an amorphous gel-like material, leading to the suspicion of hydration of glass due to water permeation and alkali inter-diffusion. In some cases, the alteration layer is crystallized to some extent and contains clay minerals (smectite). Such layers are formed mainly by the process of co-precipitation of the elements dissolved from the basalt. In addition to these hydrated alumino-silicates, hydrated residual glass is also present, formed as a consequence of inter-diffusion processes. In this scenario, an integrated study on carbonation mechanism, mineral paragenesis and application of geochemical codes for modeling is required.
Table 1. Summary of the experimental data pertaining to effects of CO2 on the rate of dissolution of silicate minerals (modified after, Golubev et al., 2005)
Minerals pH CO2 effects References
Forsterite 4-11 Absent Golubev et al. (2005)
Olivine (Fo92) 4-6 Absent Pokrovsky and Schott (2000b)
Olivine (Fo92) >9 Inhibition Wogelius and Walther (1991)Pokrovsky and Schott (2000b)
Olivine (Fo92) 10.5-11 Absent Golubev et al. (2005)
Augite 4 Absent Brady and Carroll (1994)
Labradorite 3.2a Absent Carroll & Knauss (2005)
Anorthite 4 Absent Brady and Carroll(1994)
Anorthite 5.5-8.5 Acceleration Berg and Banwart (2000)
Basalt glass 8 Absent Brady and Gislason (1997)
Table 2. Thermodynamic equilibrium constants at specified temperatures and total pressures of the chemical reactions used to construct the log-log diagram of Ca/Mg activity ratio vs. fugacity.
Reactions Log K values 100oC
1.013 bar150oC
500 barCalcite + Mg2+ + H2O = Brucite + Ca2+ + CO2(g) -3.3197 -1.6714Dolomite + Mg2+ +2H2O = 2Brucite + Ca2+ + 2CO2(g) -8.0936 -4.9137Magnesite + H2O = Brucite + CO2(g) -3.5065 -2.14152Calcite + Mg2+ = Dolomite + Ca2+ 1.4542 1.5709Dolomite + Mg2+ = 2Magnesite + Ca2+ -1.0806 -0.63072Dolomite + Mg2+ = Huntite + Ca2+ -3.5007 -2.6995Huntite + Mg2+ = 4Magnesite + Ca2+ 1.3395 1.43812Calcite + Mg2+ = dis-Dolomite + Ca2+ 0.3416 0.6615Disordered-Dolomite + Mg2+ = 2Magnesite + Ca2+ 0.032 0.27872Disordered-Dolomite + Mg2+ = Huntite + Ca2+ -1.2755 0.8807
Geochemical Modeling and Experimental Studies for CO2 sequestration in Basalt
47
GEOCHEMICAL CODES AND THEIR APPLICATION
Quantification of basalt carbonation and analysis of macro-chemical processes require application of geochemical reaction codes that help in simulation of the mineral carbonation products formed during CO2 sequestration reaction with basalt. A geochemical code is defined as the integration of mathematical expressions, describing theoretical concepts and the thermodynamic relations on which aqueous speciation, oxidation-reduction, precipitation-dissolution, and adsorption-desorption calculations are based. These codes are considered efficient when they encompass all the requisite sub-models and the imperative aqueous complexes, solids and gases for significant elements of preference to interpret a provided data-set adequately. Extensive databases of thermodynamic property values and kinetic rate constants are required for these codes.
Geochemical codes (Cited Table 5.1; Allison et al., 1991) used for speciation and solubility calculations are more pertinent to such work and include- MINTEQA2 (Allison et al., 1991), EQ3/6 (Wolery, 1992), PHREEQC (Parkhurst and Appelo, 1995), REACT (Bethke and Torgersen, 1998) and KINDIS. These chemical reaction codes are divided into two main groups such as (a) aqueous speciation solubility codes and (b) reaction path codes. The former group of codes such as WATEQ, REDEQL, GEOCHEM, MINEQL, MINTEQ, and their later versions have used in the calculation of aqueous speciation/complexation and the degree of saturation of the speciated composition of the aqueous solution with respect to the solids in the code’s thermodynamic database. They have also capabilities to calculate mass transfer between a single initial and final state that results from mineral precipitation/dissolution and adsorption/desorption reactions. Besides the above mentioned features, the reaction path codes, such as PHREEQE, PATHCALC, and the EQ3/EQ6 series of codes also permit simulation of mass transfer due to mineral precipitation as a function of reaction progress. Typical applications include modeling of chemical changes associated with the interaction of minerals and groundwater (Delany et al., 1985) as a function of time. At each step of reaction progress, the code calculates the changes or path of mineral and gaseous solubility equilibrium, the masses of minerals precipitated or dissolved to attain equilibrium and the resulting composition of the aqueous solution. The application of geochemical code for modeling of silicate mineral carbonation mechanism is summarized (Fig. 4). The EQ3/6 release 3230B software package is a set of computer programmes and supporting data files / databases - used in the modeling of complex geochemical processes that take place when aqueous solution reacts with basalt silicates and CO2, due to which new carbonate
minerals are formed. The code PHREEQC (version 2) written in C programming language has been designed to perform a wide variety of low-temperature aqueous geochemical calculations. PHREEQC is based on an ion-association aqueous model. The MINTEQA2 code is used in combination with a thermodynamic database to calculate complex chemical equilibrium among aqueous species, gases & solids and between dissolved and adsorbed states. Theoretically, this code has four sub-models - (a) aqueous speciation, (b) solubility, (c) precipitation/dissolution, and (d) adsorption. It also incorporates a Newton-Raphson iteration scheme to solve the set of mass-action and mass-balance expressions. The geochemical code REACT is a set of software for manipulating chemical reactions, calculating stability diagrams and the equilibrium states of natural waters, tracing reaction processes, modeling reactive transport in one and two dimensions and plotting the results of these calculations. It can integrate kinetic rate, kinetic rate law and simulate the fractionation of stable isotope in a reacting system. The reactive transport model is a groundwater flow transport model coupled to a chemical reaction model. The KINDIS (version 1) programme is used to calculate speciation of the aqueous species and to simulate the irreversible dissolution of minerals and reversible precipitation of secondary phases.
To understand thermodynamics, kinetics and reaction path of minerals formed, parameters such as solubility constant, saturation index, log activity and thermodynamic properties of minerals (Gibbs free energy, enthalpy and entropy) are required to be considered. Geochemical reaction models require thermodynamic data to calculate geochemical reactions associated with CO2 sequestration. This is an important data requirement for successful application of geochemical reaction modeling for CO2 sequestration (Marini 2007). The availability of thermodynamic data for CO2 and carbonate aqueous species and minerals is in the database files used in geochemical reaction models. It is focused on issues related to computer modeling of geochemical reactions associated with CO2 sequestration in basic igneous rocks such as basalt and peridotite. These codes differ in their ease of use, but can accurately solve the equilibrium assemblage of mineral solubility, within the limits of thermodynamic databases. The quality of the result of each of these codes is directly related to the quality of these databases. These databases facilitate creation of phase diagrams, describing stability of mineral phases as a function of temperature and pressure. The utility of thermodynamic database leads to their incorporation into “user friendly” chemical speciation, reactive path, and reactive transport using computer codes, such as EQ3/6(Wolery 1983), PHREEQC (Parkthurst and Appelo 1999), and CHESS (Vanderlee et al., 2002). These codes allow rapid calculations of mineral solubility and solute speciation in a variety of geochemical systems. The
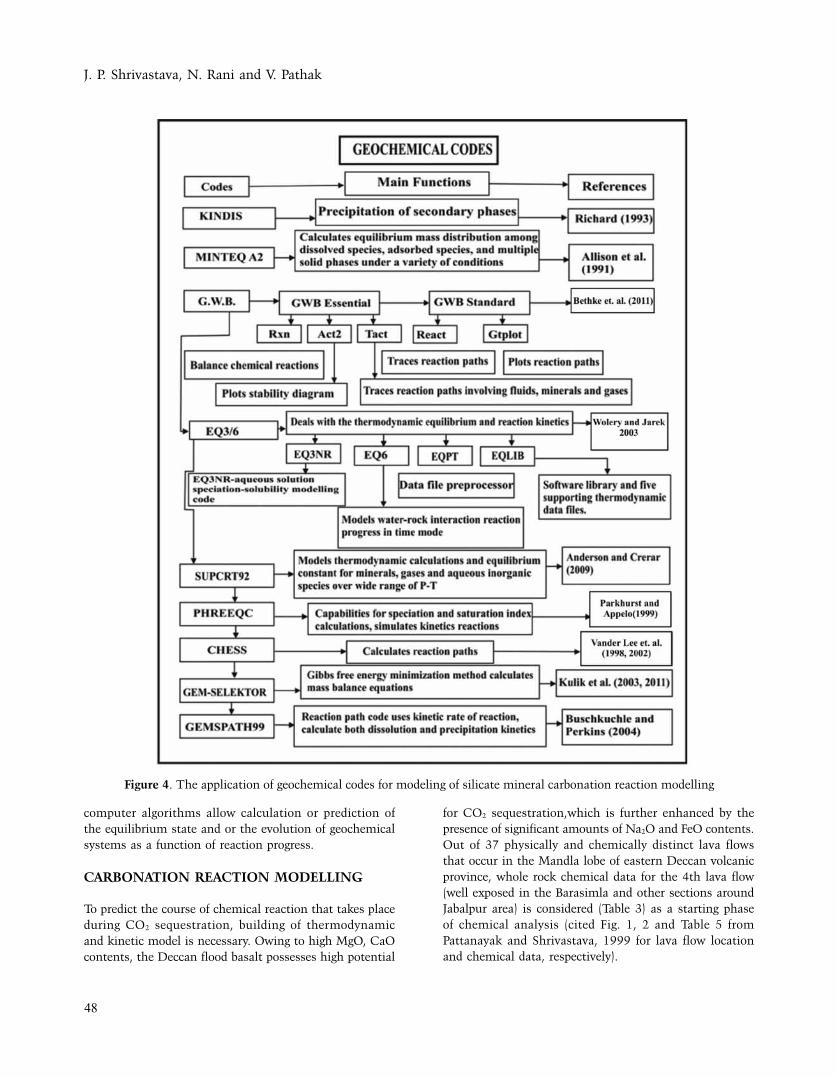
J. P. Shrivastava, N. Rani and V. Pathak
48
computer algorithms allow calculation or prediction of the equilibrium state and or the evolution of geochemical systems as a function of reaction progress.
CARBONATION REACTION MODELLING
To predict the course of chemical reaction that takes place during CO2 sequestration, building of thermodynamic and kinetic model is necessary. Owing to high MgO, CaO contents, the Deccan flood basalt possesses high potential
for CO2 sequestration,which is further enhanced by the presence of significant amounts of Na2O and FeO contents. Out of 37 physically and chemically distinct lava flows that occur in the Mandla lobe of eastern Deccan volcanic province, whole rock chemical data for the 4th lava flow (well exposed in the Barasimla and other sections around Jabalpur area) is considered (Table 3) as a starting phase of chemical analysis (cited Fig. 1, 2 and Table 5 from Pattanayak and Shrivastava, 1999 for lava flow location and chemical data, respectively).
Figure 4. The application of geochemical codes for modeling of silicate mineral carbonation reaction modelling
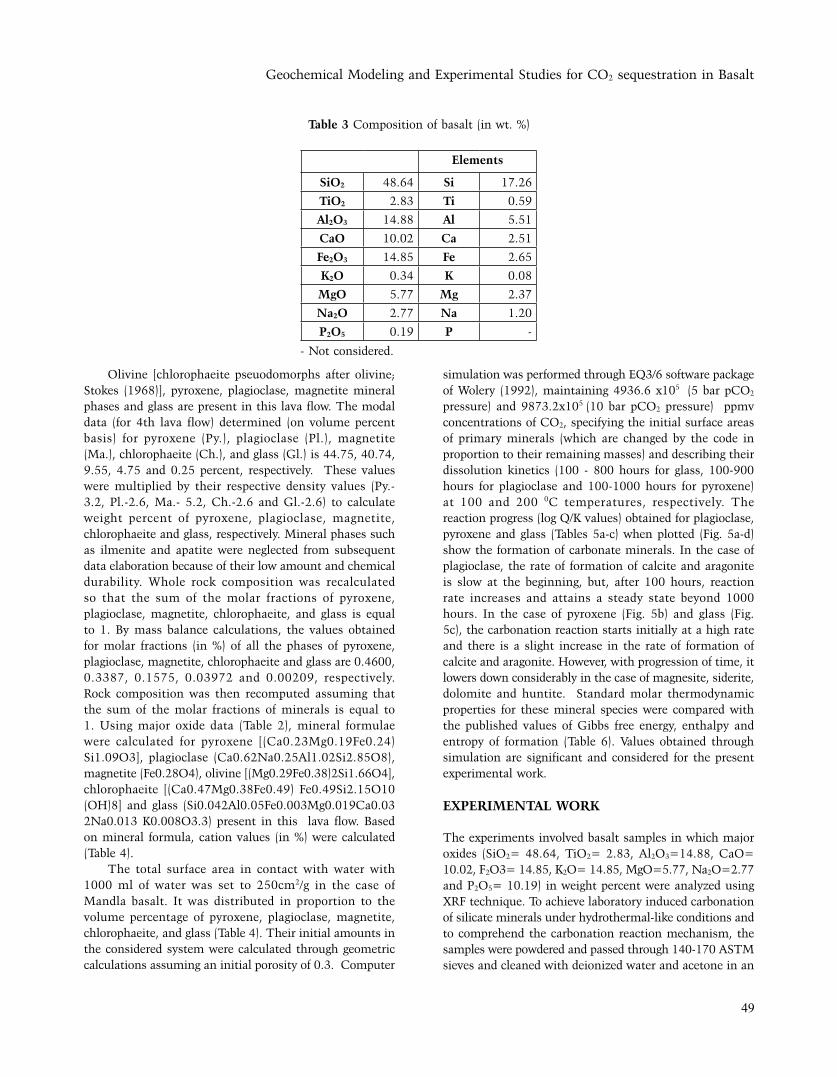
Geochemical Modeling and Experimental Studies for CO2 sequestration in Basalt
49
Olivine [chlorophaeite pseuodomorphs after olivine; Stokes (1968)], pyroxene, plagioclase, magnetite mineral phases and glass are present in this lava flow. The modal data (for 4th lava flow) determined (on volume percent basis) for pyroxene (Py.), plagioclase (Pl.), magnetite (Ma.), chlorophaeite (Ch.), and glass (Gl.) is 44.75, 40.74, 9.55, 4.75 and 0.25 percent, respectively. These values were multiplied by their respective density values (Py.-3.2, Pl.-2.6, Ma.- 5.2, Ch.-2.6 and Gl.-2.6) to calculate weight percent of pyroxene, plagioclase, magnetite, chlorophaeite and glass, respectively. Mineral phases such as ilmenite and apatite were neglected from subsequent data elaboration because of their low amount and chemical durability. Whole rock composition was recalculated so that the sum of the molar fractions of pyroxene, plagioclase, magnetite, chlorophaeite, and glass is equal to 1. By mass balance calculations, the values obtained for molar fractions (in %) of all the phases of pyroxene, plagioclase, magnetite, chlorophaeite and glass are 0.4600, 0.3387, 0.1575, 0.03972 and 0.00209, respectively. Rock composition was then recomputed assuming that the sum of the molar fractions of minerals is equal to 1. Using major oxide data (Table 2), mineral formulae were calculated for pyroxene [(Ca0.23Mg0.19Fe0.24) Si1.09O3], plagioclase (Ca0.62Na0.25Al1.02Si2.85O8), magnetite (Fe0.28O4), olivine [(Mg0.29Fe0.38)2Si1.66O4], chlorophaeite [(Ca0.47Mg0.38Fe0.49) Fe0.49Si2.15O10 (OH)8] and glass (Si0.042Al0.05Fe0.003Mg0.019Ca0.032Na0.013 K0.008O3.3) present in this lava flow. Based on mineral formula, cation values (in %) were calculated (Table 4).
The total surface area in contact with water with 1000 ml of water was set to 250cm2/g in the case of Mandla basalt. It was distributed in proportion to the volume percentage of pyroxene, plagioclase, magnetite, chlorophaeite, and glass (Table 4). Their initial amounts in the considered system were calculated through geometric calculations assuming an initial porosity of 0.3. Computer
simulation was performed through EQ3/6 software package of Wolery (1992), maintaining 4936.6 x105 (5 bar pCO2 pressure) and 9873.2x105 (10 bar pCO2 pressure) ppmv concentrations of CO2, specifying the initial surface areas of primary minerals (which are changed by the code in proportion to their remaining masses) and describing their dissolution kinetics (100 - 800 hours for glass, 100-900 hours for plagioclase and 100-1000 hours for pyroxene) at 100 and 200 0C temperatures, respectively. The reaction progress (log Q/K values) obtained for plagioclase, pyroxene and glass (Tables 5a-c) when plotted (Fig. 5a-d) show the formation of carbonate minerals. In the case of plagioclase, the rate of formation of calcite and aragonite is slow at the beginning, but, after 100 hours, reaction rate increases and attains a steady state beyond 1000 hours. In the case of pyroxene (Fig. 5b) and glass (Fig. 5c), the carbonation reaction starts initially at a high rate and there is a slight increase in the rate of formation of calcite and aragonite. However, with progression of time, it lowers down considerably in the case of magnesite, siderite, dolomite and huntite. Standard molar thermodynamic properties for these mineral species were compared with the published values of Gibbs free energy, enthalpy and entropy of formation (Table 6). Values obtained through simulation are significant and considered for the present experimental work.
EXPERIMENTAL WORK
The experiments involved basalt samples in which major oxides (SiO2= 48.64, TiO2= 2.83, Al2O3=14.88, CaO= 10.02, F2O3= 14.85, K2O= 14.85, MgO=5.77, Na2O=2.77 and P2O5= 10.19) in weight percent were analyzed using XRF technique. To achieve laboratory induced carbonation of silicate minerals under hydrothermal-like conditions and to comprehend the carbonation reaction mechanism, the samples were powdered and passed through 140-170 ASTM sieves and cleaned with deionized water and acetone in an
Table 3 Composition of basalt (in wt. %)
Elements
SiO2 48.64 Si 17.26
TiO2 2.83 Ti 0.59
Al2O3 14.88 Al 5.51
CaO 10.02 Ca 2.51
Fe2O3 14.85 Fe 2.65
K2O 0.34 K 0.08
MgO 5.77 Mg 2.37
Na2O 2.77 Na 1.20
P2O5 0.19 P -
- Not considered.
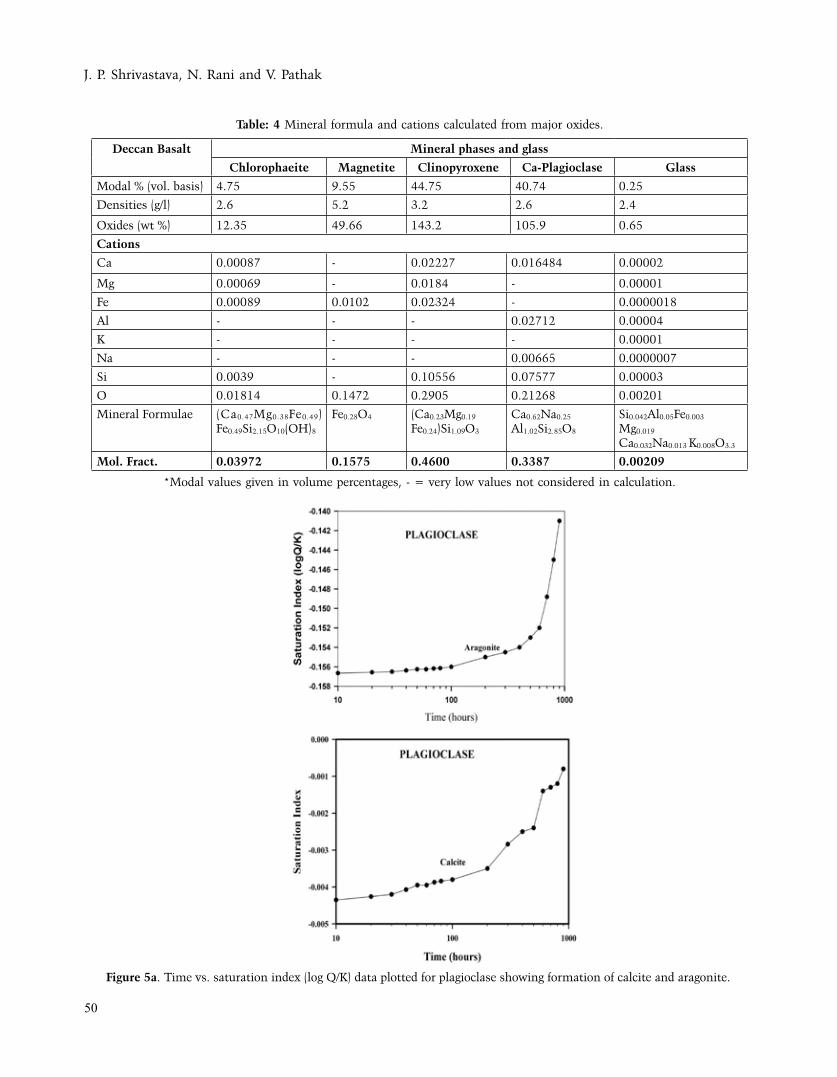
J. P. Shrivastava, N. Rani and V. Pathak
50
Table: 4 Mineral formula and cations calculated from major oxides.
Deccan Basalt Mineral phases and glass
Chlorophaeite Magnetite Clinopyroxene Ca-Plagioclase Glass
Modal % (vol. basis) 4.75 9.55 44.75 40.74 0.25
Densities (g/l) 2.6 5.2 3.2 2.6 2.4
Oxides (wt %) 12.35 49.66 143.2 105.9 0.65
Cations
Ca 0.00087 - 0.02227 0.016484 0.00002
Mg 0.00069 - 0.0184 - 0.00001
Fe 0.00089 0.0102 0.02324 - 0.0000018
Al - - - 0.02712 0.00004
K - - - - 0.00001
Na - - - 0.00665 0.0000007
Si 0.0039 - 0.10556 0.07577 0.00003
O 0.01814 0.1472 0.2905 0.21268 0.00201
Mineral Formulae (Ca0.47Mg0.38Fe0.49) Fe0.49Si2.15O10(OH)8
Fe0.28O4 (Ca0.23Mg0.19
Fe0.24)Si1.09O3
Ca0.62Na0.25
Al1.02Si2.85O8
Si0.042Al0.05Fe0.003
Mg0.019
Ca0.032Na0.013 K0.008O3.3
Mol. Fract. 0.03972 0.1575 0.4600 0.3387 0.00209
*Modal values given in volume percentages, - = very low values not considered in calculation.
Figure 5a. Time vs. saturation index (log Q/K) data plotted for plagioclase showing formation of calcite and aragonite.
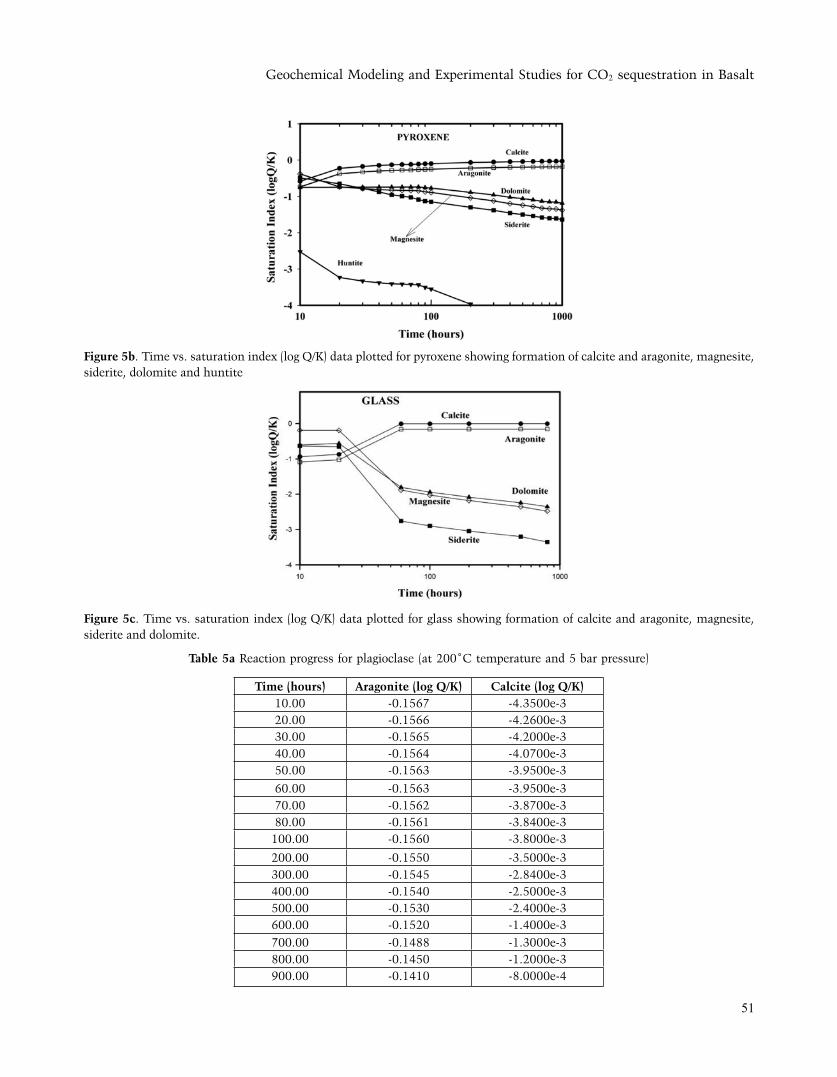
Geochemical Modeling and Experimental Studies for CO2 sequestration in Basalt
51
Figure 5b. Time vs. saturation index (log Q/K) data plotted for pyroxene showing formation of calcite and aragonite, magnesite, siderite, dolomite and huntite
Figure 5c. Time vs. saturation index (log Q/K) data plotted for glass showing formation of calcite and aragonite, magnesite, siderite and dolomite.
Table 5a Reaction progress for plagioclase (at 200˚C temperature and 5 bar pressure)
Time (hours) Aragonite (log Q/K) Calcite (log Q/K) 10.00 -0.1567 -4.3500e-3 20.00 -0.1566 -4.2600e-3 30.00 -0.1565 -4.2000e-3 40.00 -0.1564 -4.0700e-3 50.00 -0.1563 -3.9500e-3
60.00 -0.1563 -3.9500e-3 70.00 -0.1562 -3.8700e-3 80.00 -0.1561 -3.8400e-3 100.00 -0.1560 -3.8000e-3
200.00 -0.1550 -3.5000e-3 300.00 -0.1545 -2.8400e-3 400.00 -0.1540 -2.5000e-3 500.00 -0.1530 -2.4000e-3 600.00 -0.1520 -1.4000e-3 700.00 -0.1488 -1.3000e-3 800.00 -0.1450 -1.2000e-3 900.00 -0.1410 -8.0000e-4
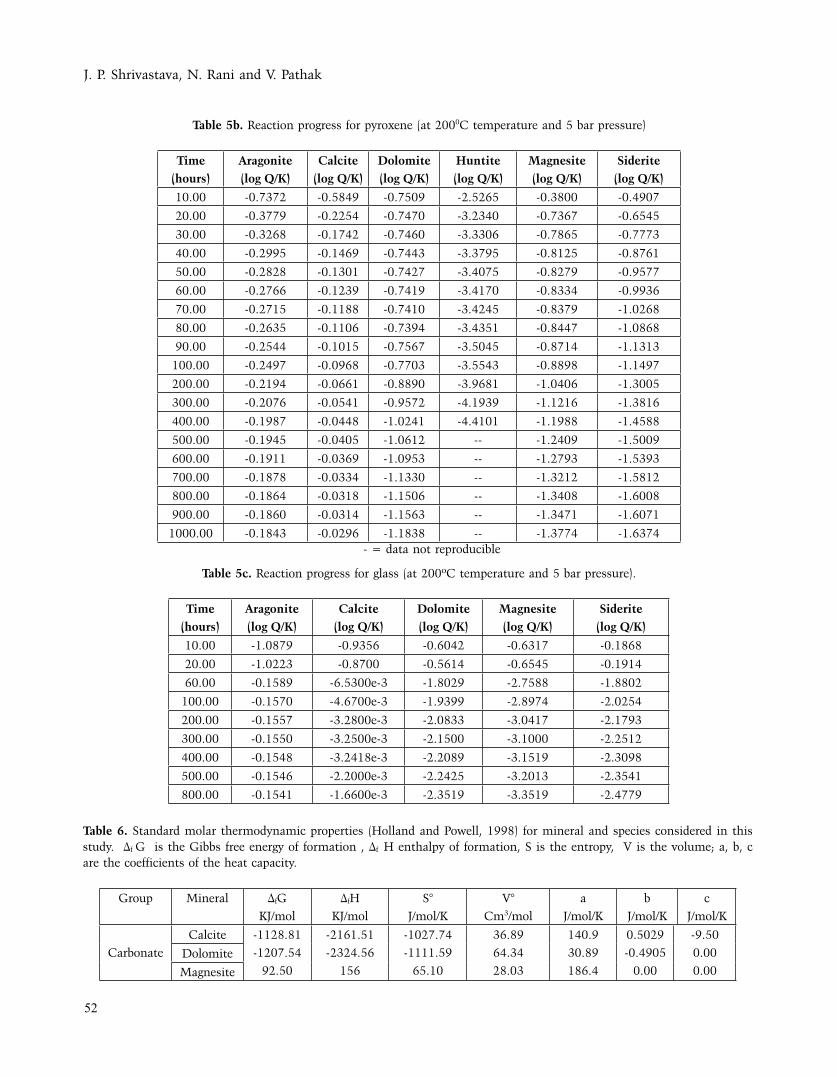
J. P. Shrivastava, N. Rani and V. Pathak
52
Table 5b. Reaction progress for pyroxene (at 2000C temperature and 5 bar pressure)
Time (hours)
Aragonite (log Q/K)
Calcite (log Q/K)
Dolomite (log Q/K)
Huntite (log Q/K)
Magnesite (log Q/K)
Siderite (log Q/K)
10.00 -0.7372 -0.5849 -0.7509 -2.5265 -0.3800 -0.4907
20.00 -0.3779 -0.2254 -0.7470 -3.2340 -0.7367 -0.6545
30.00 -0.3268 -0.1742 -0.7460 -3.3306 -0.7865 -0.7773
40.00 -0.2995 -0.1469 -0.7443 -3.3795 -0.8125 -0.8761
50.00 -0.2828 -0.1301 -0.7427 -3.4075 -0.8279 -0.9577
60.00 -0.2766 -0.1239 -0.7419 -3.4170 -0.8334 -0.9936
70.00 -0.2715 -0.1188 -0.7410 -3.4245 -0.8379 -1.0268
80.00 -0.2635 -0.1106 -0.7394 -3.4351 -0.8447 -1.0868
90.00 -0.2544 -0.1015 -0.7567 -3.5045 -0.8714 -1.1313
100.00 -0.2497 -0.0968 -0.7703 -3.5543 -0.8898 -1.1497
200.00 -0.2194 -0.0661 -0.8890 -3.9681 -1.0406 -1.3005
300.00 -0.2076 -0.0541 -0.9572 -4.1939 -1.1216 -1.3816
400.00 -0.1987 -0.0448 -1.0241 -4.4101 -1.1988 -1.4588
500.00 -0.1945 -0.0405 -1.0612 -- -1.2409 -1.5009
600.00 -0.1911 -0.0369 -1.0953 -- -1.2793 -1.5393
700.00 -0.1878 -0.0334 -1.1330 -- -1.3212 -1.5812
800.00 -0.1864 -0.0318 -1.1506 -- -1.3408 -1.6008
900.00 -0.1860 -0.0314 -1.1563 -- -1.3471 -1.6071
1000.00 -0.1843 -0.0296 -1.1838 -- -1.3774 -1.6374 - = data not reproducible
Table 5c. Reaction progress for glass (at 200ºC temperature and 5 bar pressure).
Time (hours)
Aragonite (log Q/K)
Calcite (log Q/K)
Dolomite (log Q/K)
Magnesite (log Q/K)
Siderite (log Q/K)
10.00 -1.0879 -0.9356 -0.6042 -0.6317 -0.1868
20.00 -1.0223 -0.8700 -0.5614 -0.6545 -0.1914
60.00 -0.1589 -6.5300e-3 -1.8029 -2.7588 -1.8802
100.00 -0.1570 -4.6700e-3 -1.9399 -2.8974 -2.0254
200.00 -0.1557 -3.2800e-3 -2.0833 -3.0417 -2.1793
300.00 -0.1550 -3.2500e-3 -2.1500 -3.1000 -2.2512
400.00 -0.1548 -3.2418e-3 -2.2089 -3.1519 -2.3098
500.00 -0.1546 -2.2000e-3 -2.2425 -3.2013 -2.3541
800.00 -0.1541 -1.6600e-3 -2.3519 -3.3519 -2.4779
Table 6. Standard molar thermodynamic properties (Holland and Powell, 1998) for mineral and species considered in this study. ∆f G is the Gibbs free energy of formation , ∆f H enthalpy of formation, S is the entropy, V is the volume; a, b, c are the coefficients of the heat capacity.
Group Mineral ∆fG
KJ/mol
∆fH
KJ/mol
S°
J/mol/K
V°
Cm3/mol
a
J/mol/K
b
J/mol/K
c
J/mol/K
Carbonate
Calcite -1128.81
-1207.54
92.50
-2161.51
-2324.56
156
-1027.74
-1111.59
65.10
36.89
64.34
28.03
140.9
30.89
186.4
0.5029
-0.4905
0.00
-9.50
0.00
0.00Dolomite
Magnesite
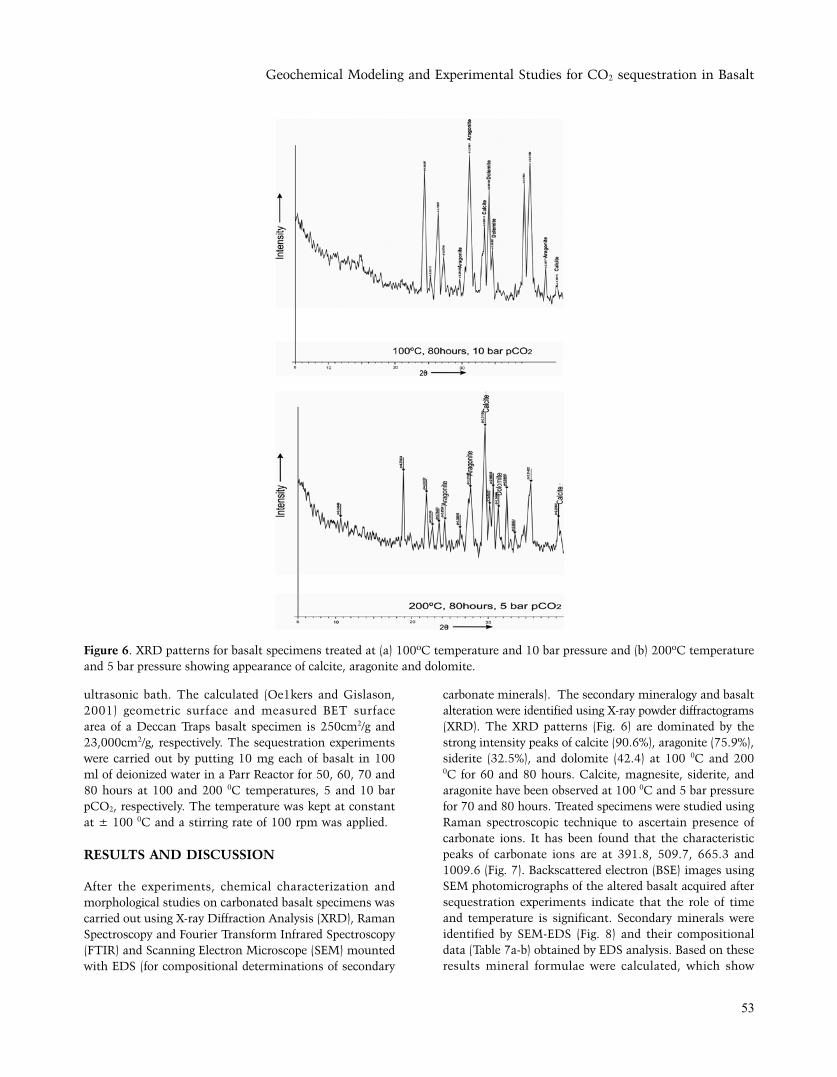
Geochemical Modeling and Experimental Studies for CO2 sequestration in Basalt
53
ultrasonic bath. The calculated (Oe1kers and Gislason, 2001) geometric surface and measured BET surface area of a Deccan Traps basalt specimen is 250cm2/g and 23,000cm2/g, respectively. The sequestration experiments were carried out by putting 10 mg each of basalt in 100 ml of deionized water in a Parr Reactor for 50, 60, 70 and 80 hours at 100 and 200 0C temperatures, 5 and 10 bar pCO2, respectively. The temperature was kept at constant at ± 100 0C and a stirring rate of 100 rpm was applied.
RESULTS AND DISCUSSION
After the experiments, chemical characterization and morphological studies on carbonated basalt specimens was carried out using X-ray Diffraction Analysis (XRD), Raman Spectroscopy and Fourier Transform Infrared Spectroscopy (FTIR) and Scanning Electron Microscope (SEM) mounted with EDS (for compositional determinations of secondary
carbonate minerals). The secondary mineralogy and basalt alteration were identified using X-ray powder diffractograms (XRD). The XRD patterns (Fig. 6) are dominated by the strong intensity peaks of calcite (90.6%), aragonite (75.9%), siderite (32.5%), and dolomite (42.4) at 100 0C and 200 0C for 60 and 80 hours. Calcite, magnesite, siderite, and aragonite have been observed at 100 0C and 5 bar pressure for 70 and 80 hours. Treated specimens were studied using Raman spectroscopic technique to ascertain presence of carbonate ions. It has been found that the characteristic peaks of carbonate ions are at 391.8, 509.7, 665.3 and 1009.6 (Fig. 7). Backscattered electron (BSE) images using SEM photomicrographs of the altered basalt acquired after sequestration experiments indicate that the role of time and temperature is significant. Secondary minerals were identified by SEM-EDS (Fig. 8) and their compositional data (Table 7a-b) obtained by EDS analysis. Based on these results mineral formulae were calculated, which show
Figure 6. XRD patterns for basalt specimens treated at (a) 100ºC temperature and 10 bar pressure and (b) 200ºC temperature and 5 bar pressure showing appearance of calcite, aragonite and dolomite.
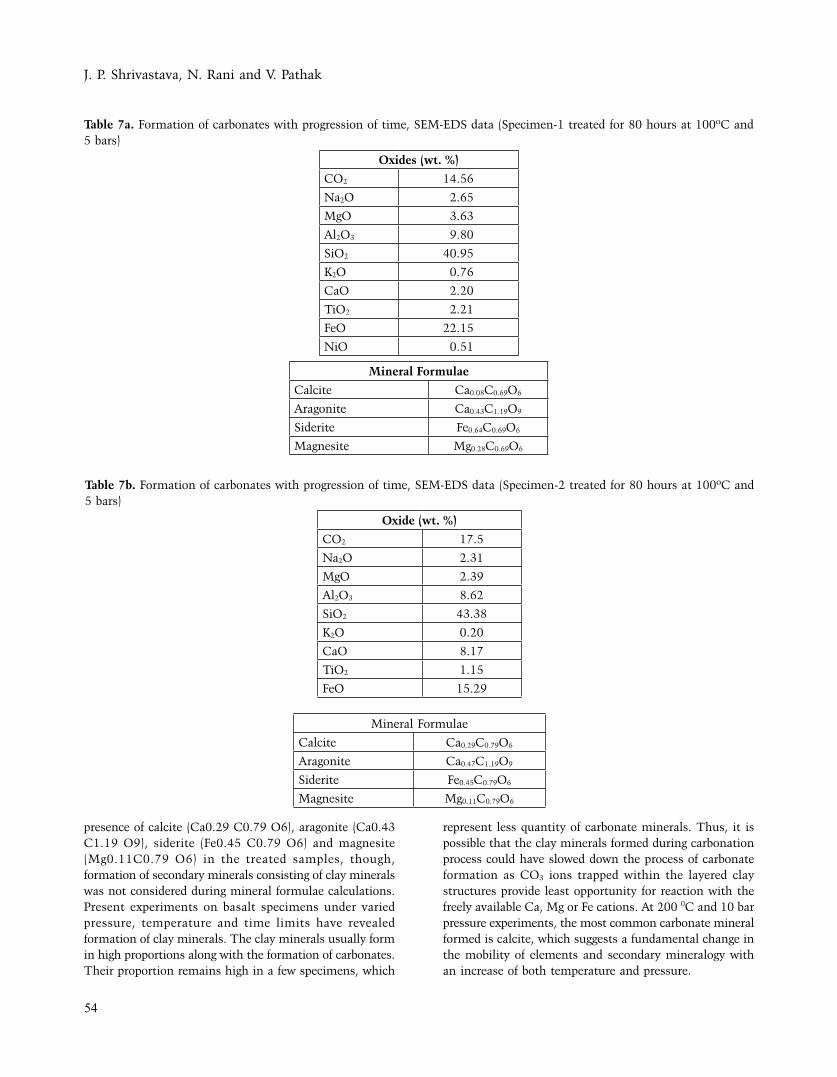
J. P. Shrivastava, N. Rani and V. Pathak
54
presence of calcite (Ca0.29 C0.79 O6), aragonite (Ca0.43 C1.19 O9), siderite (Fe0.45 C0.79 O6) and magnesite (Mg0.11C0.79 O6) in the treated samples, though, formation of secondary minerals consisting of clay minerals was not considered during mineral formulae calculations. Present experiments on basalt specimens under varied pressure, temperature and time limits have revealed formation of clay minerals. The clay minerals usually form in high proportions along with the formation of carbonates. Their proportion remains high in a few specimens, which
represent less quantity of carbonate minerals. Thus, it is possible that the clay minerals formed during carbonation process could have slowed down the process of carbonate formation as CO3 ions trapped within the layered clay structures provide least opportunity for reaction with the freely available Ca, Mg or Fe cations. At 200 0C and 10 bar pressure experiments, the most common carbonate mineral formed is calcite, which suggests a fundamental change in the mobility of elements and secondary mineralogy with an increase of both temperature and pressure.
Table 7a. Formation of carbonates with progression of time, SEM-EDS data (Specimen-1 treated for 80 hours at 100ºC and 5 bars)
Oxides (wt. %)
CO2 14.56
Na2O 2.65
MgO 3.63
Al2O3 9.80
SiO2 40.95
K2O 0.76
CaO 2.20
TiO2 2.21
FeO 22.15
NiO 0.51
Mineral Formulae
Calcite Ca0.08C0.69O6
Aragonite Ca0.43C1.19O9
Siderite Fe0.64C0.69O6
Magnesite Mg0.28C0.69O6
Table 7b. Formation of carbonates with progression of time, SEM-EDS data (Specimen-2 treated for 80 hours at 100ºC and 5 bars)
Oxide (wt. %)
CO2 17.5
Na2O 2.31
MgO 2.39
Al2O3 8.62
SiO2 43.38
K2O 0.20
CaO 8.17
TiO2 1.15
FeO 15.29
Mineral Formulae
Calcite Ca0.29C0.79O6
Aragonite Ca0.47C1.19O9
Siderite Fe0.45C0.79O6
Magnesite Mg0.11C0.79O6
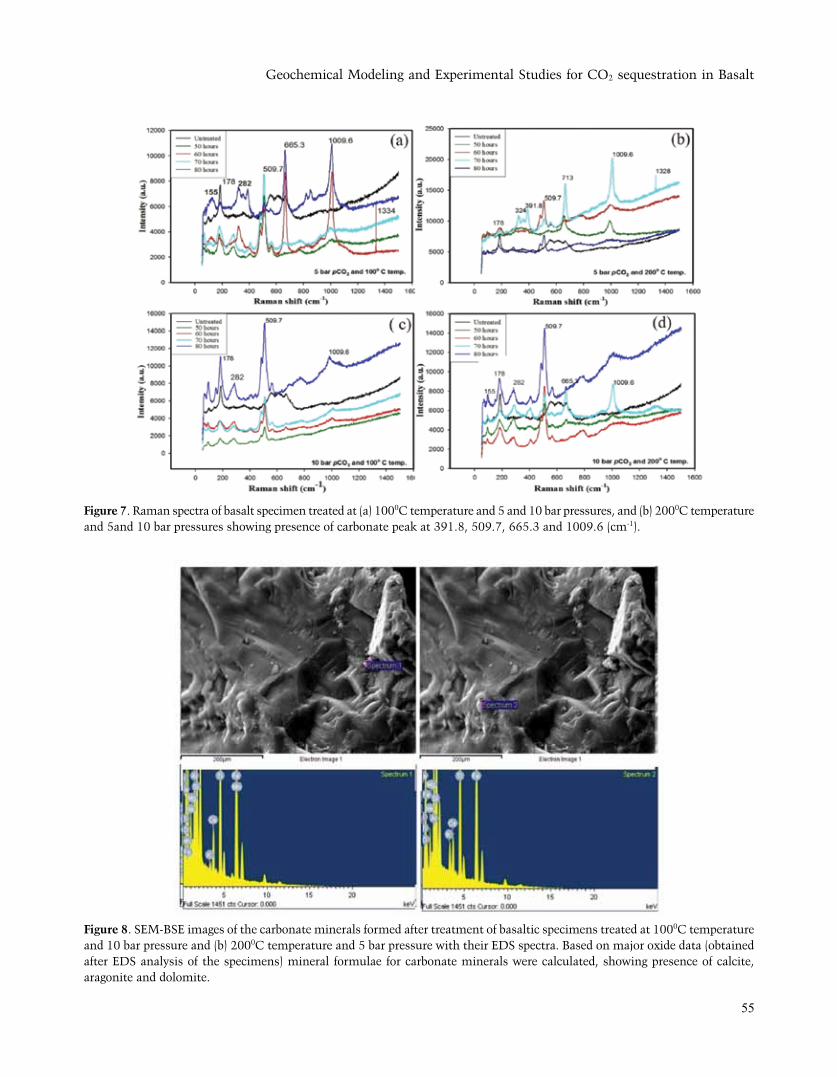
Geochemical Modeling and Experimental Studies for CO2 sequestration in Basalt
55
Figure 7. Raman spectra of basalt specimen treated at (a) 1000C temperature and 5 and 10 bar pressures, and (b) 2000C temperature and 5and 10 bar pressures showing presence of carbonate peak at 391.8, 509.7, 665.3 and 1009.6 (cm-1).
Figure 8. SEM-BSE images of the carbonate minerals formed after treatment of basaltic specimens treated at 1000C temperature and 10 bar pressure and (b) 2000C temperature and 5 bar pressure with their EDS spectra. Based on major oxide data (obtained after EDS analysis of the specimens) mineral formulae for carbonate minerals were calculated, showing presence of calcite, aragonite and dolomite.
J. P. Shrivastava, N. Rani and V. Pathak
56
CONCLUSION
The CO2-water-basalt interaction is studied at 25 – 200 °C as a function of time to evaluate the effects of temperature and extent of reaction during basalt carbonation. Temperature and reaction time, affecting the reaction process is reflected in mineral assemblages, formed in compositional ranges of the basalt and secondary minerals. At 150 – 200 °C, calcite was the only carbonate formed and shows changes with temperature on elemental mobility and secondary mineralogy. Changes with temperature at elevated pCO2 are reflected in dissolution rate and mechanism, at 200 °C. Dissolution rate is fast and primarily driven by secondary mineral replacement reactions and growth. Formation of the carbonate minerals - calcite, dolomite, aragonite, and siderite takes place largely due to the breakdown of pyroxene, feldspar and glass. However, the discrepancy is evident between thermodynamically calculated mineral species and the experimentally formed carbonate minerals.
ACKNOWLEDGEMENTS
For financial support towards this work, we acknowledge DST Project Grant [No. IS-STAC/CO2-SR-79/10(G)]. Nishi Rani thanks CSIR for financial support in the form of Research Associateship.
REFERENCES
Ahmad, M., 2002, Mineralogy and petrogenesis of basalts from
Mandla lobe of eastern Deccan volcanic province, India:
Unpublished M.Phil Dissertation, University of Delhi,
110 p.
Ahmad, M. and Shrivastava, J.P. 2008, Compositional studies on
clays associated with the intra-volcanic bole horizons from
the eastern Deccan volcanic province: palaeo environmental
implications. Memoir Geological Society, India, v.74, pp
299-321.
Ahmad, M. and Shrivastava, J.P., 2004, Iron-titanium oxide
geothermometery and petrogenesis of lava flows and dyke
from Mandla lobe of Eastern Deccan volcanic province,
India: Gondwana Research, v.2, pp 563-577.
Allison, J. D., Brown, D.S. and Novo-Gradac, K.J., 1991
MINTEQA2/ PRODEFA2, a geochemical assessment model
for environmental systems: version 3.0 user’s manual. U.S.
EPA, Athens, GA
Anderson, M.S. and Crerar, D.A., 2009, Thermodynamics in
Geochemistry, the equibrium model. New York, Oxford
University Press, 588p
Bachu, S. and Adams, J.J., 2003, Sequestration of CO2 in geological
media in response to climate change-capacity of deep saline
aquifers to sequester CO2 in solution: Energy Conversion
and Management, v. 44, pp 3151–3175.
Berg, A. and Banwart, S.A., 2000, Carbon dioxide mediated
dissolution of Ca-feldspar: Chemical Geology v. 163, pp
25-42
Bethke, C.M. and Torgersen, T., 1998, Controls on the distribution
and isotopic composition of helium in deep ground-water
flows: Geology, v. 26, pp 291-294
Bethke, C.M., Sanford, R.A., Kirk, M.F, Jin, Q. and Flynn, T.M.,
2011, The thermodynamic ladder in geomicrobiology:
American Journal of Science, v. 311, pp 183-210
Brady, P. V. and Gislason S. R., 1997, Seafloor weathering controls
on atmospheric CO2 and global climate, Geochimica et
Cosmochimica Acta, v. 61, pp 965-973.
Brady, P.V. and Carroll, S.A., 1994, Direct effects of CO2 and
temperature on silicate weathering: possible implications
for climate control: Geochimica et Cosmochimica Acta,v.
58, pp 1853-1856.
Brennan, S. T. and Burruss R. C., 2003, Specific sequestration
volumes; a useful tool for CO2 storage capacity assessment:
Open-File Report 03-452 U.S. Geological Survey, Reston,
Virginia 20192, 12p.
Broecker (2008) CO2 capture and storage: Possibilities and
perspectives. Elements 4: pp 295-297
Buschkuehle, B.E. and Perkins, E.H. , 2004, Mineralogy and
Geochemical Trapping of Acid Gas in the Edmonton area
of Central Alberta, Canada: 7th International Conference
on Greenhouse Gas Control Technologies, Elsevier Limited,
United Kingdom
Carroll, S.A. and Knauss, K.G., 2005, Dependence of labradorite
dissolution kinetics: Chemical Geology, v. 217, pp213-225
Charan, S.N., Prasad, P.S.R., Sarma, D.S., Archana, K.B., Chavan,
C.D. (2010) Evaluation of Deccan continental flood basalts,
India for geological sequestration of CO2 Jour. of
Applied Geochemistry v. 13, pp.560-565
Chenet, A. L., Quidelleur, X., Fluteau, F., Courtillot, V., 2007, 40K/39Ar dating of the main Deccan Large Igneous Province:
Further Evidence of KTB Age and short duration. EPSL, v.
263, pp 1-15.
Crovisier, J.L., Advocat, T. and Dussossoy, J.L., 2003, Nature
and role of natural alteration gels formed on the surface
of ancient volcanic glasses (natural analogs of waste
containment glasses): Journal of Nuclear Materials v. 321,
pp 91-109
Delany, J.M., Puigdomenech, I. and Wolery, T.J., 1985, Precipitation
kinetics option for the EQ6 geochemical reaction path
code: Lawrence Livermore National Laboratory, Livermore,
California, UCRL-53642, 44 p.
Golubev, S.V., Pokrovsky, O.S. and Schott, J., 2005, Experimental
determination of the effect of dissolved CO2 on the
dissolution kinetics of Mg and Ca silicates at 25 1C:
Chemical Geology v. 217, pp 227–238.
Gysi, A.P. and Stefánsson A. (2012) Experiments and geochemical
modeling of CO2 sequestration during hydrothermal basalt
alteration: Chemical Geology, v. 306-307, pp10-28.
Holland, T.J.B. and Powell, R (1998) Internally consistent
thermodynamic data set for phases of petrological interest
Geochemical Modeling and Experimental Studies for CO2 sequestration in Basalt
57
J. Metamorph Geol. 16: 309-344
Holloway, S., Garg, A., Kapshe, M., Deshpande, A., Pracha, A.S.,
Khan, S.R., Mahmood, M.A., Singh, T.N., Kirk, K.L., and
Gale, J., 2008, An assessment of the CO2 storage potential
of the Indian subcontinent: Energy Procedia 1(1). pp
2607-2613.
Houghton, R. A. and Wood, G.M., 1987, Global climate change.
Sci. Am. v. 260, pp 36-44
Lawrence Livermore National Laboratory, Livermore,
California
INTERA (INTERA Environmental Consultants, Inc.). 1983,
Geochemical Models Suitable for Performance Assessment
of Nuclear Waste Storage: Comparison of PHREEQE
and EQ3/EQ6. ONWI-473, INTERA Environmental
Consultants, Inc., Houston, Texas.
IPCC, 2005, IPCC Special Report on Carbon Dioxide Capture
and Storage. Prepared by Working Group III of the
Intergovernmental Panel on Climate Change [Metz, B.,
Davidson, O., de Coninck, H.C., Loos, M., Meyer, L.A.
(Eds.). Cambridge University Press, Cambridge, United
Kingdom, New York, NY, USA, 442 p]
Jerram, D.A., 2002, The volcanology and facies architecture of
flood basalts (In press, GSA special publication, Volcanic
Rifted Margins).
Kashyap, M. (2010) Measurements and computation of dispersion
and mass transfer coefficients in fluidized beds. Unpublished
doctoral dissertation Chicago: Illinois Institute of Technology.
Kelemen, P. and Matter, J.M., 2008. In situ carbonation of
peridotite for CO2 storage: Proceedings of the National
Academy of Sciences (in press).
Kulik, D.A., Wagner T., Dmytrieva S.V., Kosakowski G.,
Hingerl F.F., Chudnenko K.V., Berner U., 2011, GEM-
Selektor geochemical modeling package: revised algorithm
and GEMS3K numerical kernel for coupled simulation
codes: Computational Geosciences v. 17, pp 1-24.
Kulik, D., Berner, U., Curti. E., 2003, Modelling chemical
equilibrium partitioning with the GEMS-PSI code. In: PSI
Scientific Report 2003/ v. 4, Nuclear Energy and Safety
(editied by B. Smith and B. Gschwend), PSI, Villigen,
Switzerland, pp. 109-122, 2004
Mani, D., Charan, N.S., Kumar, B., 2008, Assessment of carbon
dioxide sequestration potential of ultramafic rocks in the
greenstone belts of southern India: Current Science, v. 94,
pp 5-60.
Marini, L. 2007, Geological Sequestration of Carbon Dioxide:
Thermodynamics, Kinetics, and Reaction Path Modeling:
Elsevier, Amsterdam, 470 p.
Matter, J.M., Takahashi, T. and Goldberg, D., 2007, Experimental
evaluation of in situ CO2-water-rock reactions during CO2
injection in basaltic rocks. Implications for geological CO2
sequestration: Geochemistry, Geophysics, Geosystems 8:
doi 10.1029/2006GC001427
McGrail, B.P., Schaef, H.T., Ho, A.M., Chien, Y.J., Dooley, J.J.
and Davidson, C.L., 2006, Potential for carbon dioxide
sequestration in flood basalts: Journal of Geophysical
Research 111: B12201.
Metz, B., Davidson, O., de Coninck H., Loos, M. and Meyer L.,
2005, IPCC Special Report on Carbon Dioxide Capture and
Storage: Cambridge University Press, New York,
O’Connor, W.K., Dahlin, D.C., Nilsen, D.N., Gerdemann, S.J.,
Rush, G.E.,Penner, L.R., Walters, R.P., Turner, P.C., 2002,
Continuing studies on direct aqueous mineral carbonation
for CO2 sequestration: The Proceedings of the 27th
International Technical Conference on Coal
Oe1kers, E. H. and Gislason, S.R., 2001, Mechanism, rates,
and consequences of basaltic glass dissolution: II. An
experimental study of the dissolution rates of basaltic
glass as a function of pH and temperature: Geochimica et
Cosmochimica Acta, v. 67, pp 3817–3832,
Oelkers, E.H., Cole, D.R., 2008, Carbon dioxide sequestration:
A solution to a global problem. Elements, v. 4: pp 305-310
Oelkers, E.H., Gislason, S.R. and Matter, J., 2008, Mineral
Carbonation of CO2: Elements, v. 4, pp 331-335.
Parkhurst, D.L., 1995, User's guide to PHREEQC A computer
program for speciation, reaction-path, advective-transport,
and inverse geochemical calculations: U.S. Geological Survey
Water-Resources Investigations Report 95-4227, 143 p
Parkthurst, D. L., Appelo, C.A.J., 1999, User’s guide to PHREEQC
(Version 2) - A computer programme for speciation, batch
reaction, one dimensional transport and inverse geochemical
conditions. U.S. Geological Survey Water-resources
Investigation Report 99 - 4259, 312 p.
Pattanayak, S.K., Shrivastava, J.P., 1999, Petrography and major-
oxide geochemistry of basalts from the Eastern Deccan
Volcanic Province, India: West Volume. Geological Society
of India, Memoir, v. 43 (1), pp 233-270.
Pokrovsky, O.S. and Schott, J., 2000b, Kinetics and mechanism
of Forsterite dissolution at 25oC and pH from 1-12:
Geochimica et Cosmochimica Acta, v. 64, pp 3313-3325.
Prasad, P. S. R., Srinivasa Sarma D., Sudhakar, L. Basavaraju, U.,
Singh, R. S., Zahida Begum,
Archana, K. B., Chavan C. D. and Charan S. N. (2009)
Geological sequestration of carbon dioxide in Deccan
basalts: preliminary laboratory study. Current Science, v.96,
pp.288-291
Retallack, G. J. (2002) Carbon dioxide and climate over the past
300 Myr: Philosophical Transactions of the Royal Society
of London, v. 360, pp 659–674.
Rochelle, C.A., Czernichowski-Lauriol, I., and Milodowski, A.E.,
2004, The impact of chemical reactions on CO2 storage in
geological formations: a brief review. in: Geological Storage
of Carbon Dioxide, S.J. Baines and R.H. Worden eds.,
Special Publication of the Geological Society of London v.
233, pp. 87-106.
Rogers, K.L., Neuhoff P.S., Pedersen A.K. and Bird D.K., 2006,
CO2 metasomatism in a basalt-hosted petroleum reservoir,
Nuussuaq, West Greenland. Lithos v. 92, pp 55-82.
Salil, M.S., Pattanayak, S.K., Shrivastava, J.P. and Tandon, S.K.,
J. P. Shrivastava, N. Rani and V. Pathak
58
1994, X-Ray diffraction studies on the clay mineralogy of
infra (Lameta)/ inter-trappean sediments and weathered
Deccan basalt from Jabalpur, M.P. implication for the age
of Deccan volcanism: Journal Geological Society India, v.
44, pp 335-337.
Salil, M.S., Pattanayak, S.K., Shrivastava, J.P., 1996, Composition
of smectites in the Lameta sediments of central India:
implications for the commencement of Deccan volcanism:
Journal of the Geological Society of India v. 47, pp 555–560
Salil, M.S., Shrivastava, J.P., Pattanayak, S.K., 1997, Similarities
in the mineralogical and geochemical attributes of detrital
clays of Maastrichtian Lameta beds and weathered Deccan
basalt, central India: Chemical Geology v. 136, pp 25-32.
Shrivastava, J. P. and Pattanayak S.K., 2002, Basalt of the Deccan
volcanic province, India: Gondwana Research, v.5, 3, pp
649-665
Shrivastava, J. P. Mansoor Ahmad and Surabhi Srivastava,
2012, Microstructures and compositional variation in the
intra-volcanic bole clays from the eastern Deccan volcanic
province: palaeoenvironmental implications and duration
of volcanism: Journal Geological Society of India v. 80, pp
177-188
Shrivastava, J.P. and Ahmad, M., 2005, A review of research on
Late Cretaceous volcanic sedimentary sequences of the
Mandla lobe: implications for Deccan volcanism and the
Cretaceous/Palaeogene boundary: Cretaceous Research, v.
26, pp 145-156
Shrivastava, J.P. and Ahmad, M., 2005a, A review research on
late cretaceous volcanic sedimentary sequences of the
Mandala lobe: Implications for Deccan volcanism and the
Cretaceous/Palaeogene boundary: Cretaceous Research, v.
26, pp 145-156
Shrivastava, J. P., Mahoney J. J., and Kashyap, M. R. (2014) Trace
elemental and Nd-Sr-Pb isotopic compositional variation in
37 lava flows of the Mandla lobe and their chemical relation
to the western Deccan stratigraphic succession, India Miner.
Petrol., (DOI 10.1007/s00710-014-0337-3) pp 1-17
Steffansson, A. and Gislason S. R., 2001, Chemical weathering of
basalts, SW Iceland: Effect of rock crystallinity and secondary
minerals on chemical fluxes to the ocean: American Journal
Science v. 301, pp 513–556.
Steffansson, A., 2010, Low-temperature alteration of basalts –
the effects of temperature, acids and extent of reaction
on mineralization and water chemistry. Jokull v. 60, pp
165-184
Stokes, W.L., 1968, Relation of fault trends and mineralization,
eastern Great Basin, Utah: Economic Geology v. 63, pp
741-759.
Van der Lee, J., 1998, Thermodynamic and mathematical concepts
of CHESS, Ecole des Mines de Paris - Centre d'Informatique
Géologique - LHM/RD/98/39: Fontainebleau.
Van der Lee, J., De Windt, L., Lagneau, V., Goblet, P., 2002,
Module-oriented modeling of reactive transport with
HYTEC: Computational Geoscience, V. 29, pp 265–275.
van der Lee, S., and Frederiksen, A., 2005, Surface wave
tomography applied to the North American upper mantle, in
Levander, A., and Nolet, G., eds., Seismic data analysis and
imaging with global and local arrays: American Geophysical
Union Geophysical Monograph v. 157, pp 67–80.
Widdowson, M., Walsh, J.N. and Subbarao, K.V., 1997, The
Geochemistry of Indian bole horizons: Palaeoenvironmental
implication of Deccan Intra-volcanic Palaeosurfce: Geological
Society London, v. 120, pp 269-281.
Wogelius, R.A. and Walther, J.V., 1991, Olivine dissolution at
25C: Effects oh pH, CO2 and organic acids: Geochimica et
Cosmochimica Acta, v. 55, pp 943-954.
Wolery, T. J., 1983, EQ3NR, a Computer Program for Geochemical
Aqueous Speciation-Solubility Calculations: User’s Guide
and Documentation.UCRL-53414. Lawrence Livermore
National Laboratory
Wolery, T. and Jarek, R.L., 2003, Software user ’s manual,
EQ3/6, Version 8.0, 10813-UM-8.0-00, Sandia National
Laboratories, Albuquerque, New Mexico.
Wolery, T.J.,1992, EQ3/6, A Software Package for Geochemical
Modeling of Aqueous Systems (Version 7.0). Lawrence
Livermore Laboratory, Work Report UCRL-MA-110662
PT 1-4.
Xu, T., Apps J. A. and Pruess K., 2004, Numerical simulation of
CO2 disposal by mineral trapping in deep aquifers. Applied
Geochemistry, v. 19, pp 917-936.
59
Monte - Carlo Simulations: Permeability Variation with Fractal and Pore Structural Parameters
Monte – Carlo Simulations: Permeability Variation with Fractal and Pore Structural Parameters
U. Vadapalli CSIR-National Geophysical Research Institute, Hyderabad
E-mail: [email protected]
ABSTRACTOften permeability is measured on rock samples in the laboratory or during well tests; however, such data is very sparse and takes a long time to generate. Permeability estimation from readily available porosity logs is an easier alternative approach. This paper proposes a new method of permeability estimation. The method relies on fractal theory and Monte – Carlo Simulations. Monte – Carlo simulations are performed to infer the dependence of permeability on pore size distribution. Unlike the empirical relations used to obtain permeability, present method generates random pore size distribution of the porous medium, which explains the fact that permeability depends on pore size distribution. Variation of permeability with pore-area fractal dimension, tortuosity fractal dimension and cluster mean size has been analyzed. The analysis infers that permeability is more sensitive to variations in cluster mean size compared to that of fractal dimensions. An attempt is made to define physical significance of fractal dimension of pore-area using fractal analysis of pore size distribution.
INTRODUCTION
Permeability is a key parameter for the production and management of hydrocarbon reservoirs as well as aquifers. Though the fluid content in the rock is proportional to porosity, the fluid flow depends on permeability, which is mostly predicted from effective porosity. However, even for a given effective porosity, permeability will be different for different rock types. This is because in addition to porosity other textural parameters like grain size, grain shape, sorting of grains also control permeability. These textural parameters affect tortuous nature of capillary pathways and arrangement of pores in the porous medium thereby making it complex to understand. In the past many authors related permeability to porosity in terms of empirical equations (Carman, 1956; Kozeney, 1927; Pape et al., 1999), which explain the results in terms of correlation coefficients. However, they do not explain the real physical situation existing in the porous medium. Fractal theory is applied to various complicated problems in earth sciences (Dimri, 2000b; Dimri, 2005; Dimri et al., 2005; Turcotte, 1997). Fractal theory is also found useful to explain complex nature of porous medium (Katz and Thompson, 1985; Dimri, 2000a; Dimri et al., 2012, Uma et al., 2014; Wheat craft and Tyler, 1988).
Monte – Carlo simulations for permeability of fractal porous media are formulated by Yu et al., 2005. According to them permeability is a function of cluster mean radius, relative particle size and fractal dimensions of pore area and tortuosity. In order to calculate permeability it is mandatory to select appropriate fractal dimensions of pore area and tortuous stream tubes and also cluster size, in the absence of measured information. In the present study permeability
variation with respect to these parameters is analyzed to understand its behavior with variation in these parameters.
THEORY
A porous medium consists of tortuous capillary pathways. The tortuous length of the capillary (Lt) in terms of pore diameter (λ) and the representative length (L0) is given by Yu and Chen (2002).
Where, DT is the tortuosity fractal dimension, with 1< DT<2, representing the extent of convolutedness of capillary pathways for fluid flow through a medium. Higher the value of DT more will be the convolutedness or tortuosity. The limiting values of DT=1 and DT=2 correspond to a straight capillary and highly tortuous line that fills a plane (Wheatcraft and Tyler, 1988), respectively. The size distribution of pore diameters is another important property. Yu and Chen (2002) considered pores in a porous medium as analogous to the islands on earth or spots on engineering surfaces and obtained the following fractal scaling law.
where N is the number of pores with diameter (L) greater than or equal to λ, Df the pore area dimension, with 1< Df<2, is the fractal dimension of the intersecting pore cross sections with a plane normal to the flow direction. Eq. (2) suggests that when λ corresponds to the maximum pore size, λmax, the number of pores greater than or equal to it is one. Conversely, when λ corresponds to smallest
J. Ind. Geophys. Union (January 2016)Special Volume-1/ 2016 pp: 59-63
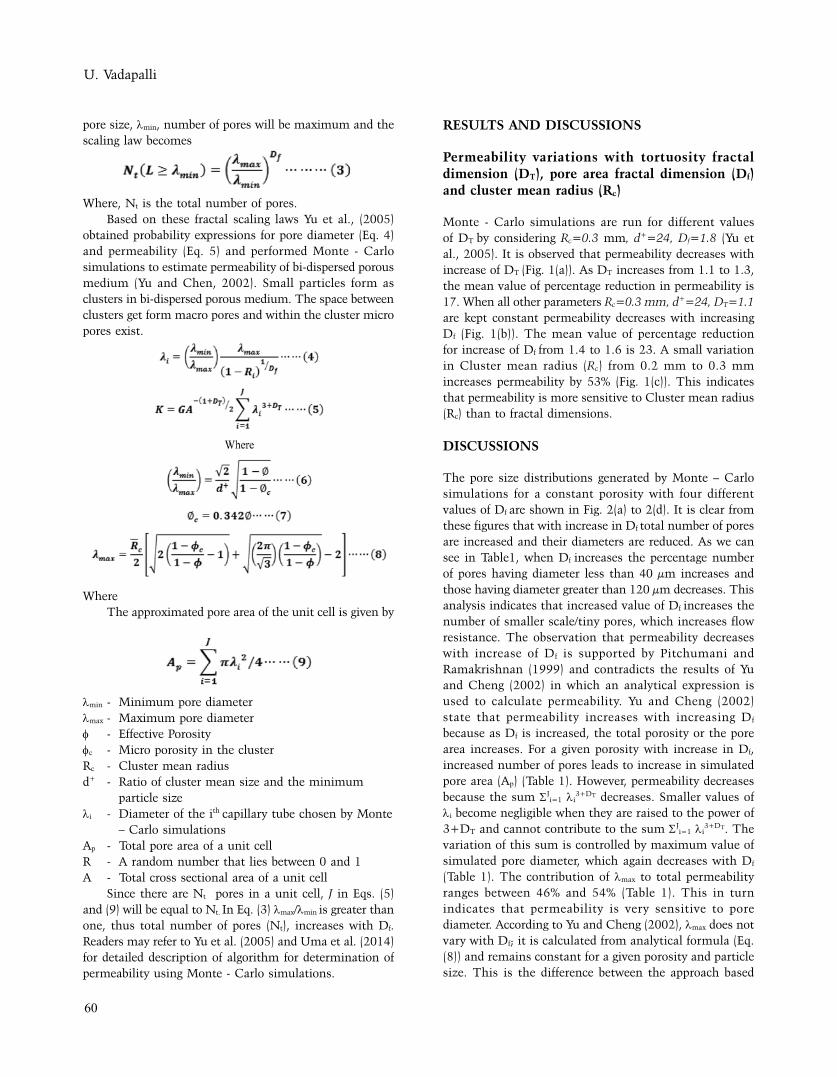
60
U. Vadapalli
pore size, λmin, number of pores will be maximum and the scaling law becomes
Where, Nt is the total number of pores.Based on these fractal scaling laws Yu et al., (2005)
obtained probability expressions for pore diameter (Eq. 4) and permeability (Eq. 5) and performed Monte - Carlo simulations to estimate permeability of bi-dispersed porous medium (Yu and Chen, 2002). Small particles form as clusters in bi-dispersed porous medium. The space between clusters get form macro pores and within the cluster micro pores exist.
Where The approximated pore area of the unit cell is given by
λmin - Minimum pore diameterλmax - Maximum pore diameterf - Effective Porosityfc - Micro porosity in the clusterRc - Cluster mean radiusd+ - Ratio of cluster mean size and the minimum
particle sizeλi - Diameter of the ith capillary tube chosen by Monte
– Carlo simulationsAp - Total pore area of a unit cellR - A random number that lies between 0 and 1A - Total cross sectional area of a unit cell
Since there are Nt pores in a unit cell, J in Eqs. (5) and (9) will be equal to Nt. In Eq. (3) λmax/λmin is greater than one, thus total number of pores (Nt), increases with Df. Readers may refer to Yu et al. (2005) and Uma et al. (2014) for detailed description of algorithm for determination of permeability using Monte - Carlo simulations.
RESULTS AND DISCUSSIONS
Permeability variations with tortuosity fractal dimension (DT), pore area fractal dimension (Df) and cluster mean radius (Rc)
Monte - Carlo simulations are run for different values of DT by considering Rc=0.3 mm, d+=24, Df=1.8 (Yu et al., 2005). It is observed that permeability decreases with increase of DT (Fig. 1(a)). As DT increases from 1.1 to 1.3, the mean value of percentage reduction in permeability is 17. When all other parameters Rc=0.3 mm, d+=24, DT=1.1 are kept constant permeability decreases with increasing Df (Fig. 1(b)). The mean value of percentage reduction for increase of Df from 1.4 to 1.6 is 23. A small variation in Cluster mean radius (Rc) from 0.2 mm to 0.3 mm increases permeability by 53% (Fig. 1(c)). This indicates that permeability is more sensitive to Cluster mean radius (Rc) than to fractal dimensions.
DISCUSSIONS
The pore size distributions generated by Monte – Carlo simulations for a constant porosity with four different values of Df are shown in Fig. 2(a) to 2(d). It is clear from these figures that with increase in Df total number of pores are increased and their diameters are reduced. As we can see in Table1, when Df increases the percentage number of pores having diameter less than 40 µm increases and those having diameter greater than 120 µm decreases. This analysis indicates that increased value of Df increases the number of smaller scale/tiny pores, which increases flow resistance. The observation that permeability decreases with increase of Df is supported by Pitchumani and Ramakrishnan (1999) and contradicts the results of Yu and Cheng (2002) in which an analytical expression is used to calculate permeability. Yu and Cheng (2002) state that permeability increases with increasing Df because as Df is increased, the total porosity or the pore area increases. For a given porosity with increase in Df, increased number of pores leads to increase in simulated pore area (Ap) (Table 1). However, permeability decreases because the sum SJ
i=1 λi3+DT decreases. Smaller values of
λi become negligible when they are raised to the power of 3+DT and cannot contribute to the sum
SJ
i=1 λi3+DT. The
variation of this sum is controlled by maximum value of simulated pore diameter, which again decreases with Df (Table 1). The contribution of λmax to total permeability ranges between 46% and 54% (Table 1). This in turn indicates that permeability is very sensitive to pore diameter. According to Yu and Cheng (2002), λmax does not vary with Df; it is calculated from analytical formula (Eq.(8)) and remains constant for a given porosity and particle size. This is the difference between the approach based
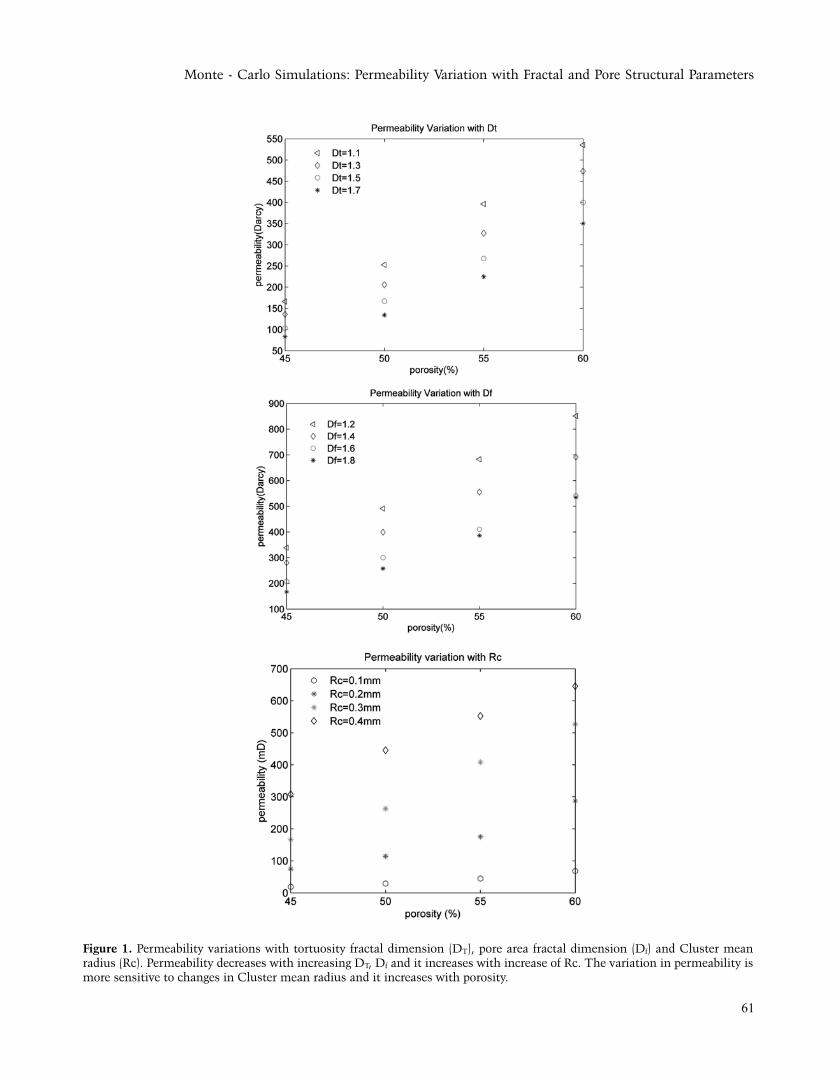
61
Monte - Carlo Simulations: Permeability Variation with Fractal and Pore Structural Parameters
Figure 1. Permeability variations with tortuosity fractal dimension (DT), pore area fractal dimension (Df) and Cluster mean radius (Rc). Permeability decreases with increasing DT, Df and it increases with increase of Rc. The variation in permeability is more sensitive to changes in Cluster mean radius and it increases with porosity.
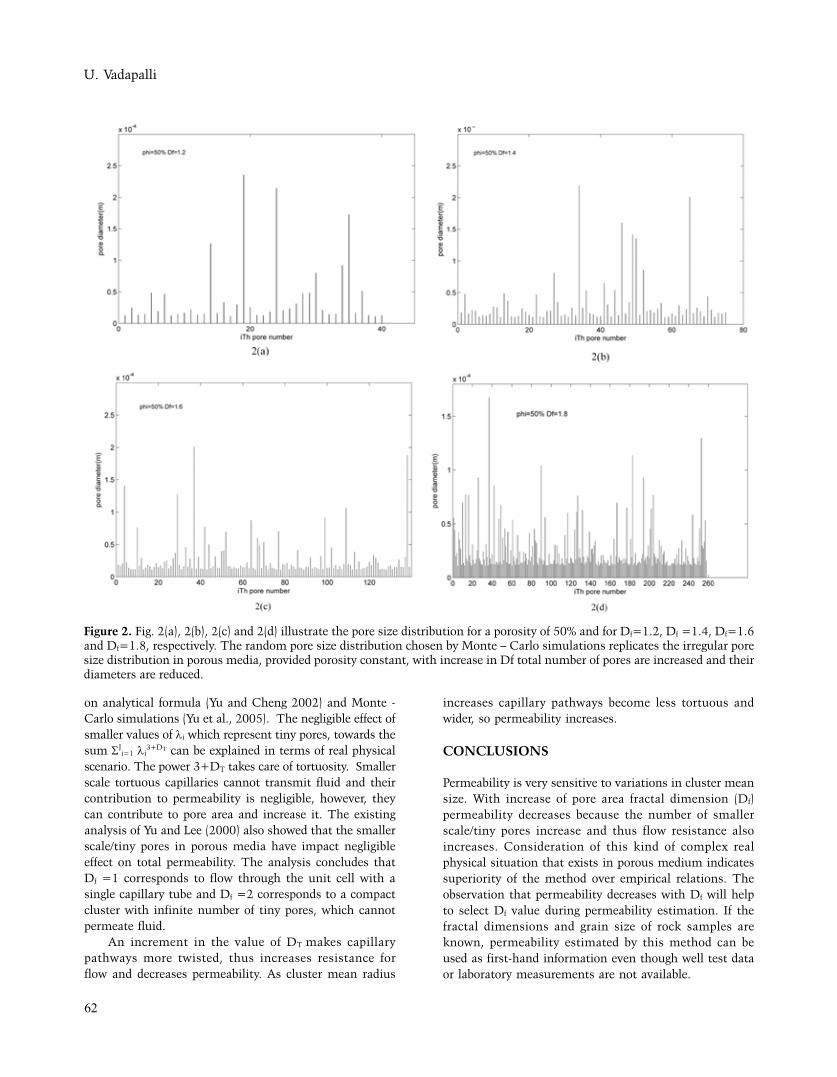
62
U. Vadapalli
Figure 2. Fig. 2(a), 2(b), 2(c) and 2(d) illustrate the pore size distribution for a porosity of 50% and for Df=1.2, Df =1.4, Df=1.6 and Df=1.8, respectively. The random pore size distribution chosen by Monte – Carlo simulations replicates the irregular pore size distribution in porous media, provided porosity constant, with increase in Df total number of pores are increased and their diameters are reduced.
on analytical formula (Yu and Cheng 2002) and Monte - Carlo simulations (Yu et al., 2005). The negligible effect of smaller values of λi which represent tiny pores, towards the sum SJ
i=1 λi3+DT can be explained in terms of real physical
scenario. The power 3+DT takes care of tortuosity. Smaller scale tortuous capillaries cannot transmit fluid and their contribution to permeability is negligible, however, they can contribute to pore area and increase it. The existing analysis of Yu and Lee (2000) also showed that the smaller scale/tiny pores in porous media have impact negligible effect on total permeability. The analysis concludes that Df =1 corresponds to flow through the unit cell with a single capillary tube and Df =2 corresponds to a compact cluster with infinite number of tiny pores, which cannot permeate fluid.
An increment in the value of DT makes capillary pathways more twisted, thus increases resistance for flow and decreases permeability. As cluster mean radius
increases capillary pathways become less tortuous and wider, so permeability increases.
CONCLUSIONS
Permeability is very sensitive to variations in cluster mean size. With increase of pore area fractal dimension (Df) permeability decreases because the number of smaller scale/tiny pores increase and thus flow resistance also increases. Consideration of this kind of complex real physical situation that exists in porous medium indicates superiority of the method over empirical relations. The observation that permeability decreases with Df will help to select Df value during permeability estimation. If the fractal dimensions and grain size of rock samples are known, permeability estimated by this method can be used as first-hand information even though well test data or laboratory measurements are not available.
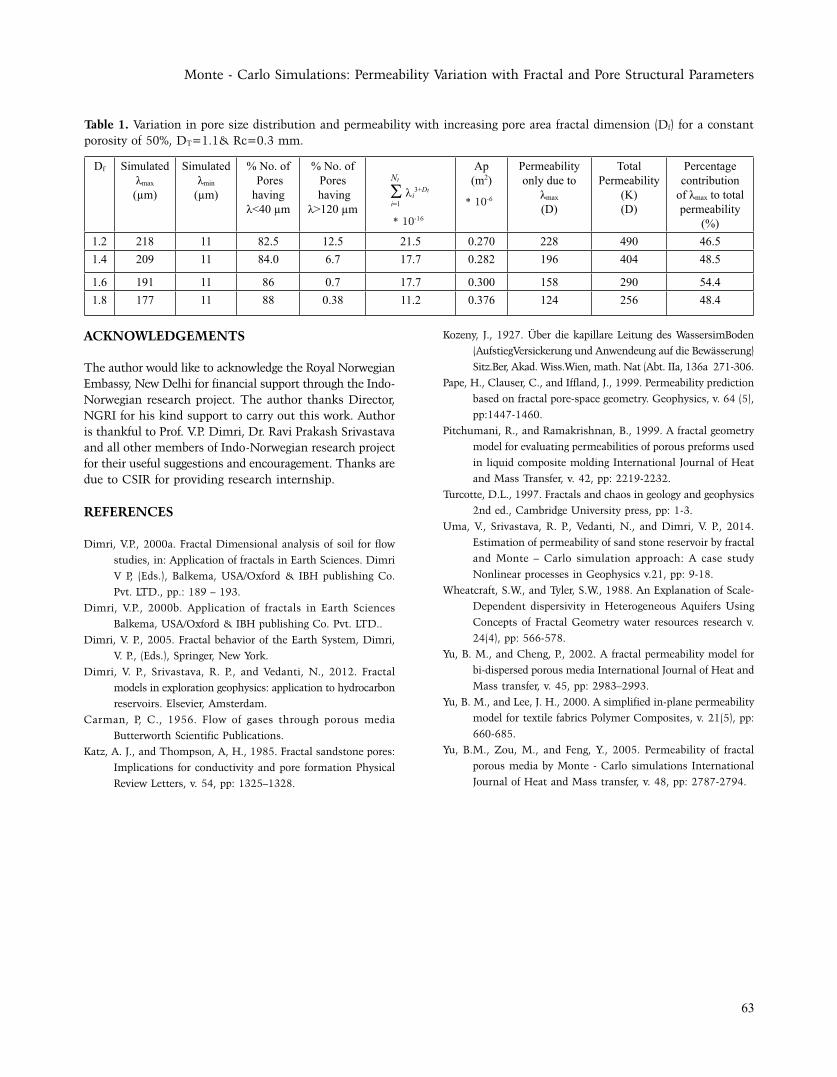
63
Monte - Carlo Simulations: Permeability Variation with Fractal and Pore Structural Parameters
ACKNOWLEDGEMENTS
The author would like to acknowledge the Royal Norwegian Embassy, New Delhi for financial support through the Indo-Norwegian research project. The author thanks Director, NGRI for his kind support to carry out this work. Author is thankful to Prof. V.P. Dimri, Dr. Ravi Prakash Srivastava and all other members of Indo-Norwegian research project for their useful suggestions and encouragement. Thanks are due to CSIR for providing research internship.
REFERENCES
Dimri, V.P., 2000a. Fractal Dimensional analysis of soil for flow
studies, in: Application of fractals in Earth Sciences. Dimri
V P, (Eds.), Balkema, USA/Oxford & IBH publishing Co.
Pvt. LTD., pp.: 189 – 193.
Dimri, V.P., 2000b. Application of fractals in Earth Sciences
Balkema, USA/Oxford & IBH publishing Co. Pvt. LTD..
Dimri, V. P., 2005. Fractal behavior of the Earth System, Dimri,
V. P., (Eds.), Springer, New York.
Dimri, V. P., Srivastava, R. P., and Vedanti, N., 2012. Fractal
models in exploration geophysics: application to hydrocarbon
reservoirs. Elsevier, Amsterdam.
Carman, P, C., 1956. Flow of gases through porous media
Butterworth Scientific Publications.
Katz, A. J., and Thompson, A, H., 1985. Fractal sandstone pores:
Implications for conductivity and pore formation Physical
Review Letters, v. 54, pp: 1325–1328.
Kozeny, J., 1927. Über die kapillare Leitung des WassersimBoden
(AufstiegVersickerung und Anwendeung auf die Bewässerung)
Sitz.Ber, Akad. Wiss.Wien, math. Nat (Abt. IIa, 136a 271-306.
Pape, H., Clauser, C., and Iffland, J., 1999. Permeability prediction
based on fractal pore-space geometry. Geophysics, v. 64 (5),
pp:1447-1460.
Pitchumani, R., and Ramakrishnan, B., 1999. A fractal geometry
model for evaluating permeabilities of porous preforms used
in liquid composite molding International Journal of Heat
and Mass Transfer, v. 42, pp: 2219-2232.
Turcotte, D.L., 1997. Fractals and chaos in geology and geophysics
2nd ed., Cambridge University press, pp: 1-3.
Uma, V., Srivastava, R. P., Vedanti, N., and Dimri, V. P., 2014.
Estimation of permeability of sand stone reservoir by fractal
and Monte – Carlo simulation approach: A case study
Nonlinear processes in Geophysics v.21, pp: 9-18.
Wheatcraft, S.W., and Tyler, S.W., 1988. An Explanation of Scale-
Dependent dispersivity in Heterogeneous Aquifers Using
Concepts of Fractal Geometry water resources research v.
24(4), pp: 566-578.
Yu, B. M., and Cheng, P., 2002. A fractal permeability model for
bi-dispersed porous media International Journal of Heat and
Mass transfer, v. 45, pp: 2983–2993.
Yu, B. M., and Lee, J. H., 2000. A simplified in-plane permeability
model for textile fabrics Polymer Composites, v. 21(5), pp:
660-685.
Yu, B.M., Zou, M., and Feng, Y., 2005. Permeability of fractal
porous media by Monte - Carlo simulations International
Journal of Heat and Mass transfer, v. 48, pp: 2787-2794.
Table 1. Variation in pore size distribution and permeability with increasing pore area fractal dimension (Df) for a constant porosity of 50%, DT=1.1& Rc=0.3 mm.
Df Simulatedλmax
(µm)
Simulatedλmin
(µm)
% No. of Poreshaving
λ<40 µm
% No. of Pores
havingλ>120 µm
Nt
S λi3+Dt
i=1
Ap(m2)
Permeability only due to
λmax
(D)
Total Permeability
(K)(D)
Percentagecontribution
of λmax to total permeability
(%)1.2 218 11 82.5 12.5 21.5 0.270 228 490 46.51.4 209 11 84.0 6.7 17.7 0.282 196 404 48.5
1.6 191 11 86 0.7 17.7 0.300 158 290 54.41.8 177 11 88 0.38 11.2 0.376 124 256 48.4
* 10-16
* 10-6
R. Gopichandran
64
Emerging Considerations about the Sustainability of CCS for EOR and other Downstream Applications: A Policy Perspective
R. GopichandranVigyan Prasar, New Delhi
E-mail: [email protected]
ABSTRACTThe paper briefly states important policy related aspects such as enabling access to CO2 on a sustained basis supported with appropriate infrastructure. These aspects cannot be overlooked if the benefits of carbon capture, storage and utilization are to be up-scaled over time. This will also create an incentive for high emitters of CO2 to enable mitigation, with cross – sectorial implications for integrated management of emissions.
INTRODUCTION
The importance of carbon capture and storage cannot be over emphasised, particularly as a mitigation measure with respect to climate change impact management. Production of power and use across several sectors entails the release of carbon-dioxide with significant impacts on climate systems. While the capture of CO2 by itself has enormous value for mitigation, its subsequent use to enhance oil recovery from wells adds value to these mitigation measures. Recent papers by Hill et al., (2013) and Hidug (2012) highlight the twin advantages of use of captured CO2 to enhance oil recovery and further explore the fate of CO2 remaining within the reservoirs. The latter could generate additional mitigation benefits.
The present paper takes stock of some of the recent considerations in this context through a policy perspective especially at a juncture when India and countries with similar circumstances of growth may like to consider enhancing CO2 capture options. It is well known that some portions of CO2 injected in to the wells also return to the surface with oil production and can be separated and re-injected as part of a reuse strategy.
POLICY LINKAGES IN THE SEQUESTRATION AND USE INTERFACE
Several major policy highlights have been made by the Advanced Resources International, Inc. (2010) in the context of the above stated. It has been emphasized that the CO2 storage in oil reservoirs and CO2 enhanced oil recovery provide critical solutions for reducing GHG emissions. This is based on the experiences in commercial applications for nearly three decades: albeit, at a scale of some consequence predominantly in the United States. This has also helped establish extensive networks of CO2 pipelines; duly integrated with anthropogenic sources of CO2. This is however, constrained by not – so - easy availability of CO2 of reliable quality and quantity. Enhancing access to CO2 calls
for appropriate infrastructure with related incentives for capturing CO2. Interestingly oil producers could be expected to pay for the CO2 because it can be used to recover oil. Carbon capture and storage mechanisms therefore become important to ensure adequate supply of CO2. These multiple benefits however call for well integrated regulatory fiscal and non-fiscal measures supported by institutional mechanisms.
A workshop organised jointly by the International Energy Agency and the Organisation of Petroleum Exporting Countries on CO2–Enhanced Oil Recovery with Carbon Capture and Storage emphasised the importance of CO2–EOR for the longevity of hydrocarbon assets. These could however be specific to regions and circumstances of extraction. Policy makers may like to take note of the fact that CO2-EOR with carbon capture and storage is seen as an early stage mitigation option for duly capturing CO2 from multiple and large point sources. It will therefore be useful to dovetail CO2 capture and reuse with involvement of large scale CO2 generators.
The workshop further discussed the dynamics of the behaviour of oil fields with respect to enhancing the storage of CO2 vis-à-vis reservoir pressure, fracturing, etc. It is therefore important to understand the qualitative and quantitative aspects of storage and intended use before technological measures supported with policies are mainstreamed. Typically environmental management policies, programs and projects have to support well-designed monitoring, reporting and verification tools to ensure success. Appropriate capacity building of personnel to sustain transitions is equally crucial.
Godec (2012) at the above stated workshop deliberated on the occurrence and distribution of CO2 during EOR with suggestions for increasing CO2 storage. This is also aligned with a lesser CO2 foot print of oil extraction processes. However, some of the significant challenges as highlighted by Godec pertain to balancing a requirement of CO2 with steady supply and regulations for long term monitoring, and setting of pipelines. This particular aspect
J. Ind. Geophys. Union (January 2016)JIGU Special Volume-1/ 2016 pp: 64-66
Considerations about the Sustainability of CCS for EOR and other Downstream Applications
65
is important especially for legislation on environmental impact, assessment and establishing trade offs for larger scale community benefits. This is further substantiated by the National Enhanced Oil Recovery Initiative (2012); that established a coalition of stakeholders from various sectors related to energy including oil and gas industries regulators and decision makers, signifying synergies across sectors. The initiative recommends incentives for capture and infrastructure projects including pipelines, probably with the assumption that this will promote mitigation benefits. This is further expected to enhance technological innovation for CO2 capture and its distribution across large areas.
The initiative further draws attention to the possibility that anthropogenic sources of CO2 may have to be given greater attention for capture compared to natural sources. The Petroleum Technology Transfer Council (2012) links the occurrence of mature wells that are not responsive any longer to primary and secondary methods of oil recovery as useful sites for EOR. The Council has highlighted the fact that the USDOE has transformed the concept of CCS to Carbon Capture, Utilization and Storage (CCUS) emphasising the utilisation and storage aspects. Eric (2012) reiterates the above stated and cites the case of the Texas Clean Energy Project that has delivered multiple benefits across sectors. This is particularly relevant for the power and oil sectors.
In a recent paper Eide et al., (2013) argues that adequate policy attention has not been conferred on CO2 markets and therefore may affect the development of CCS on commercial scale. Policy makers are however urged to take note of the implications of utilisation and storage aspects before launching on integrated measures for mitigation and other benefits. This is further reinforced by the Centre for Environment Friendly Energy Research Newsletter (2012). This appears to have expanding recognition of CO2 storage spaces with greater exploration potential in several parts of the world.
The special case of India on the prospects of carbon capture and storage technologies has been presented by the Wuppertal Institute for Climate, Environment and Energy with GIZ (2012). The report deals with the status of CCS in India, the potential storage in India, pathways for India’s power sector and other industries to relate to CCS development, matching supply of CO2 with the storage capacities, economic assessments of storage and lifecycle aspects of storage with respect to environmental impacts assessments for the coal sector in particular. This report was aligned with insights from China and South Africa; setting the context for a detailed policy framework.
Based on the above, it is interesting to note that CCS with special reference to utilisation for EOR is an evolving area with significant scope for embedding preventive approaches. Such approaches have to be specially aligned
with the structural integrity of reservoirs at their end use followed by detailed assessments of the sources of CO2 and sustained access supported with adequate infrastructure.
CONCLUSION
India in particular has demonstrated its ability to be resilient even as significant chaos was seen across the globe with economic downturns. The opportunity to capture CO2 and enhance oil recovery is indeed quite exciting because it can complement economic benefits with environmental protection gains. Policy measures that trigger and foster innovations in this dynamic area of technologies and tools including monitoring and verification, should also help leap frog into newer regimes of technologies supported by robust management information support systems. These systems should establish linkages between emissions and impacts avoided by gains that will be achieved through EOR; further quantifying environmental impacts that will be generated through the use of such recovered energy substrates. The period of time that could be allocated for extended energy use should also be spent on identifying and mainstreaming additional alternatives and enabling transitions to an environmentally and economically efficient energy future.
REFERENCES
Eide, J., Herzog, H., and Webster, M., 2013. Rethinking CCS –
developing quantitative tools for designing robust policy
in face of uncertainty. Energy Procedia, Elsevier. http://
sequestration.mit.edu/pdf/eide_etal_rethinking_ccs_ghgt11.pdf
Eric, R., 2012. CCS and Enhanced Oil Recovery: technology,
business, & policy considerations for California. A
presentation at the USEA workshop, Sacramento,
June 27. http://www.usea.org/sites/default/files/event-
presentations/09-12/summit_ccus_eor.pdf
Godec, M.L., 2012. From CO2 - EOR to CCS: “Prospects and
Challenges of Combining CO2 - EOR with storage”
Presentation at the IEA OPEC CO2 - EOR workshop Kuwait,
7-8 Feb’2012. http://www.iea.org/media/workshops/2012/
ieaopec/Godec.pdf
Hidug, W., 2012. Joint IEA –OPEC workshop on CO2 enhanced
oil recovery with CCS Kuwait
City, 7-8 Feb’ Workshop Report, pp: 29. http://www.iea.org/
publications/freepublications/publication/HEIDUG_
Workshop_Report_IEA_OPEC_FINAL.PDF
Hill, B., Hovorka, S., and Melzer, S., 2013. Geologic carbon storage
through enhanced oil recovery.EnergyProcedia, Elsevier.
https://www.fossiltransition.org/filebin/images/ghgt11_hill_
hovorka_melzer-2.pdf
Report: Advanced Resources International Inc, Arlington, VA,
USA and Melzer Consulting, Midland, TX, USA 2010.
Optimisation of CO2 storage in CO2 enhanced oil
recovery projects, pp: 57. https://www.gov.uk/government/
R. Gopichandran
66
uploads/system/uploads/attachment_data/file/47992/1006-
optimization-of-co2-storage-in-co2-enhanced-oil-re.pdf.
Report: National enhanced Oil Recovery Initiative, 2012. Carbon
Dioxide Enhanced Oil recovery: A critical domestic
energy, economic, and environmental opportunity. pp: 35.
Centre for Climate and Energy Solutions & Great Plains
Institute. http://www.neori.org/NEORI_Report.pdf
Report: News letter from the Success Centre 2012. Successful
News, Subsurface CO2 storage – critical elements and
superior strategy. (5): pp: 2. http://www.fmesuccess.no/
doc/publications/news%20letter/success_newsletter_2012_
october.pdf
Report: Petroleum Technology Transfer Council 2012. EOR moves
into the mainstream, v, 18(3), pp: 16.http://www.pttc.org/
newsletter/v18n3.pdf
Report: Wuppertal Institute for Climate environment and energy
and GIZ 2012. CCS Global: Prospects of carbon capture and
storage technologies (CCS) in Emerging Economies. Final
Report to the German Federal Ministry for the Environment,
Nature conservation and Nuclear safety (BMU) Part II:
Country Study India, pp: 179.http://wupperinst.org/uploads/
tx_wupperinst/ccsglobal_finalreport2_india.pdf.