spatialvis: visualization of spatial gesture interaction...
TRANSCRIPT
SpatialVis: Visualization of Spatial Gesture Interaction LogsErik Paluka and Christopher Collins
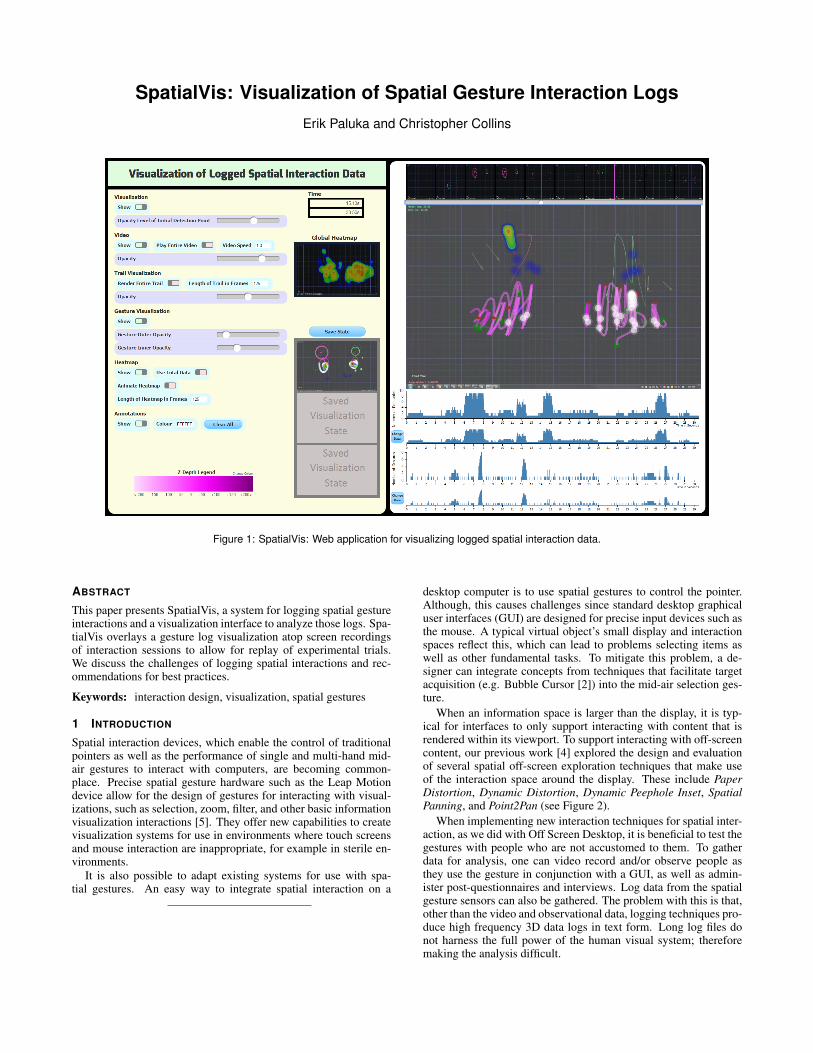
Figure 1: SpatialVis: Web application for visualizing logged spatial interaction data.
ABSTRACT
This paper presents SpatialVis, a system for logging spatial gestureinteractions and a visualization interface to analyze those logs. Spa-tialVis overlays a gesture log visualization atop screen recordingsof interaction sessions to allow for replay of experimental trials.We discuss the challenges of logging spatial interactions and rec-ommendations for best practices.
Keywords: interaction design, visualization, spatial gestures
1 INTRODUCTION
Spatial interaction devices, which enable the control of traditionalpointers as well as the performance of single and multi-hand mid-air gestures to interact with computers, are becoming common-place. Precise spatial gesture hardware such as the Leap Motiondevice allow for the design of gestures for interacting with visual-izations, such as selection, zoom, filter, and other basic informationvisualization interactions [5]. They offer new capabilities to createvisualization systems for use in environments where touch screensand mouse interaction are inappropriate, for example in sterile en-vironments.
It is also possible to adapt existing systems for use with spa-tial gestures. An easy way to integrate spatial interaction on a
desktop computer is to use spatial gestures to control the pointer.Although, this causes challenges since standard desktop graphicaluser interfaces (GUI) are designed for precise input devices such asthe mouse. A typical virtual object’s small display and interactionspaces reflect this, which can lead to problems selecting items aswell as other fundamental tasks. To mitigate this problem, a de-signer can integrate concepts from techniques that facilitate targetacquisition (e.g. Bubble Cursor [2]) into the mid-air selection ges-ture.
When an information space is larger than the display, it is typ-ical for interfaces to only support interacting with content that isrendered within its viewport. To support interacting with off-screencontent, our previous work [4] explored the design and evaluationof several spatial off-screen exploration techniques that make useof the interaction space around the display. These include PaperDistortion, Dynamic Distortion, Dynamic Peephole Inset, SpatialPanning, and Point2Pan (see Figure 2).
When implementing new interaction techniques for spatial inter-action, as we did with Off Screen Desktop, it is beneficial to test thegestures with people who are not accustomed to them. To gatherdata for analysis, one can video record and/or observe people asthey use the gesture in conjunction with a GUI, as well as admin-ister post-questionnaires and interviews. Log data from the spatialgesture sensors can also be gathered. The problem with this is that,other than the video and observational data, logging techniques pro-duce high frequency 3D data logs in text form. Long log files donot harness the full power of the human visual system; thereforemaking the analysis difficult.
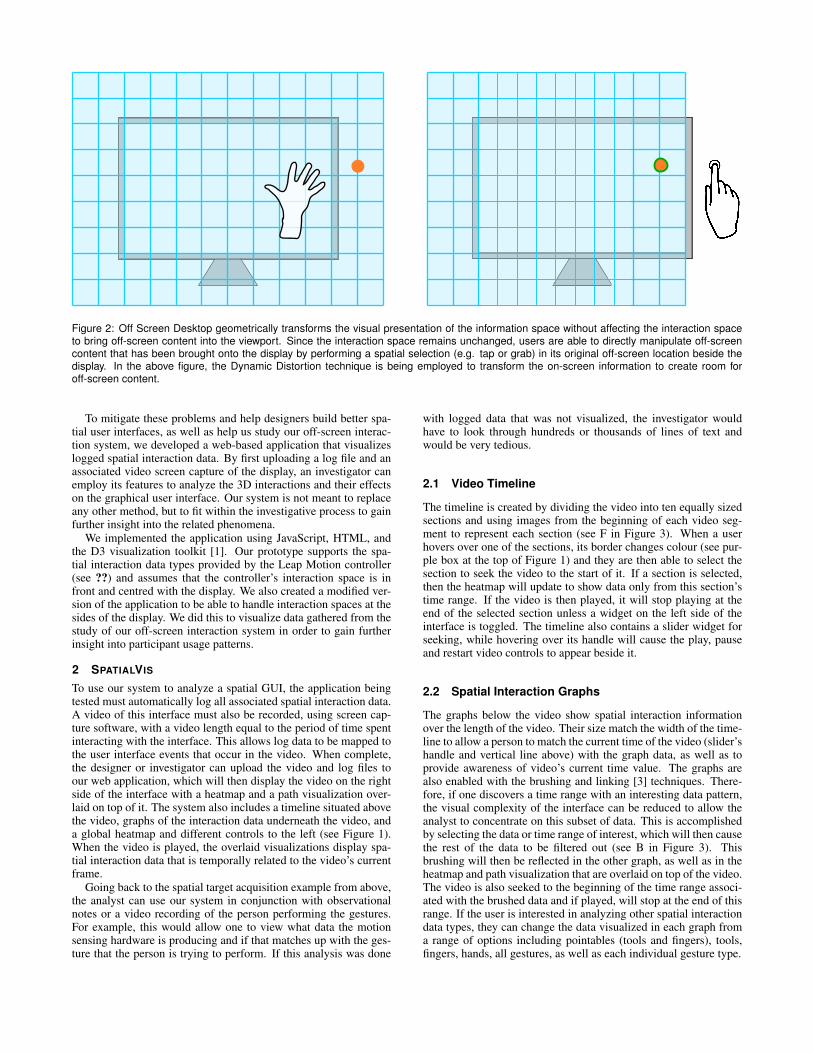
Figure 2: Off Screen Desktop geometrically transforms the visual presentation of the information space without affecting the interaction spaceto bring off-screen content into the viewport. Since the interaction space remains unchanged, users are able to directly manipulate off-screencontent that has been brought onto the display by performing a spatial selection (e.g. tap or grab) in its original off-screen location beside thedisplay. In the above figure, the Dynamic Distortion technique is being employed to transform the on-screen information to create room foroff-screen content.
To mitigate these problems and help designers build better spa-tial user interfaces, as well as help us study our off-screen interac-tion system, we developed a web-based application that visualizeslogged spatial interaction data. By first uploading a log file and anassociated video screen capture of the display, an investigator canemploy its features to analyze the 3D interactions and their effectson the graphical user interface. Our system is not meant to replaceany other method, but to fit within the investigative process to gainfurther insight into the related phenomena.
We implemented the application using JavaScript, HTML, andthe D3 visualization toolkit [1]. Our prototype supports the spa-tial interaction data types provided by the Leap Motion controller(see ??) and assumes that the controller’s interaction space is infront and centred with the display. We also created a modified ver-sion of the application to be able to handle interaction spaces at thesides of the display. We did this to visualize data gathered from thestudy of our off-screen interaction system in order to gain furtherinsight into participant usage patterns.
2 SPATIALVIS
To use our system to analyze a spatial GUI, the application beingtested must automatically log all associated spatial interaction data.A video of this interface must also be recorded, using screen cap-ture software, with a video length equal to the period of time spentinteracting with the interface. This allows log data to be mapped tothe user interface events that occur in the video. When complete,the designer or investigator can upload the video and log files toour web application, which will then display the video on the rightside of the interface with a heatmap and a path visualization over-laid on top of it. The system also includes a timeline situated abovethe video, graphs of the interaction data underneath the video, anda global heatmap and different controls to the left (see Figure 1).When the video is played, the overlaid visualizations display spa-tial interaction data that is temporally related to the video’s currentframe.
Going back to the spatial target acquisition example from above,the analyst can use our system in conjunction with observationalnotes or a video recording of the person performing the gestures.For example, this would allow one to view what data the motionsensing hardware is producing and if that matches up with the ges-ture that the person is trying to perform. If this analysis was done
with logged data that was not visualized, the investigator wouldhave to look through hundreds or thousands of lines of text andwould be very tedious.
2.1 Video Timeline
The timeline is created by dividing the video into ten equally sizedsections and using images from the beginning of each video seg-ment to represent each section (see F in Figure 3). When a userhovers over one of the sections, its border changes colour (see pur-ple box at the top of Figure 1) and they are then able to select thesection to seek the video to the start of it. If a section is selected,then the heatmap will update to show data only from this section’stime range. If the video is then played, it will stop playing at theend of the selected section unless a widget on the left side of theinterface is toggled. The timeline also contains a slider widget forseeking, while hovering over its handle will cause the play, pauseand restart video controls to appear beside it.
2.2 Spatial Interaction Graphs
The graphs below the video show spatial interaction informationover the length of the video. Their size match the width of the time-line to allow a person to match the current time of the video (slider’shandle and vertical line above) with the graph data, as well as toprovide awareness of video’s current time value. The graphs arealso enabled with the brushing and linking [3] techniques. There-fore, if one discovers a time range with an interesting data pattern,the visual complexity of the interface can be reduced to allow theanalyst to concentrate on this subset of data. This is accomplishedby selecting the data or time range of interest, which will then causethe rest of the data to be filtered out (see B in Figure 3). Thisbrushing will then be reflected in the other graph, as well as in theheatmap and path visualization that are overlaid on top of the video.The video is also seeked to the beginning of the time range associ-ated with the brushed data and if played, will stop at the end of thisrange. If the user is interested in analyzing other spatial interactiondata types, they can change the data visualized in each graph froma range of options including pointables (tools and fingers), tools,fingers, hands, all gestures, as well as each individual gesture type.
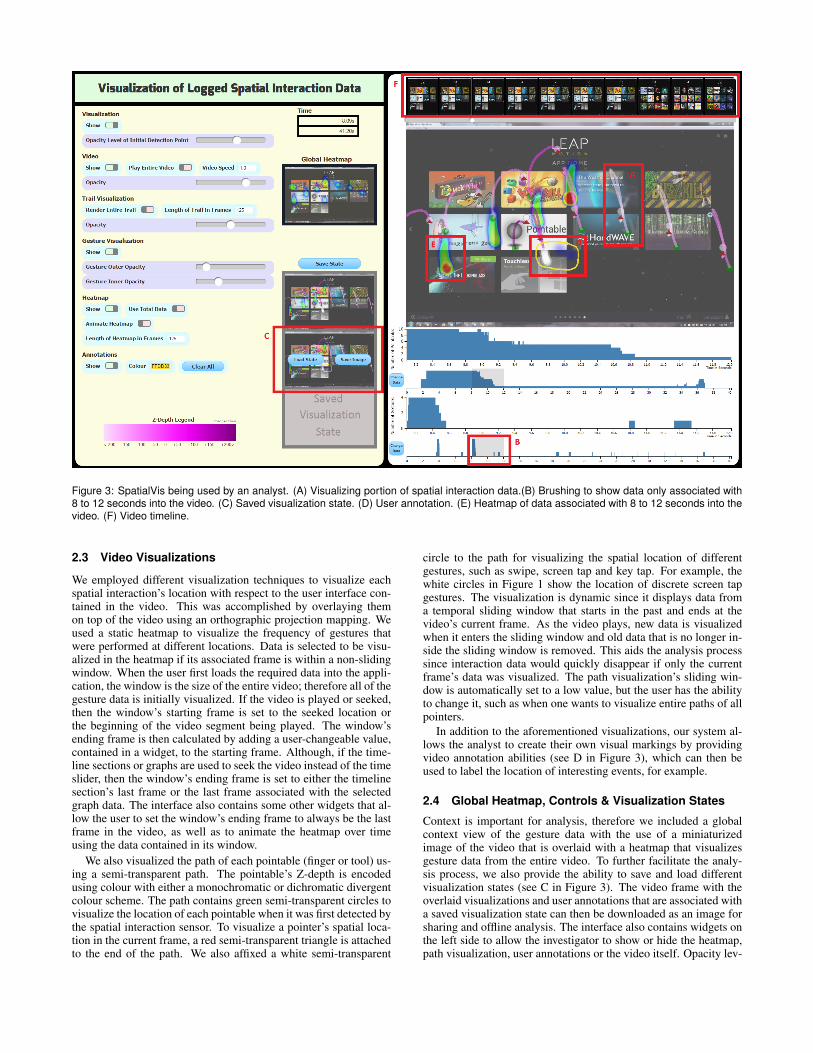
Figure 3: SpatialVis being used by an analyst. (A) Visualizing portion of spatial interaction data.(B) Brushing to show data only associated with8 to 12 seconds into the video. (C) Saved visualization state. (D) User annotation. (E) Heatmap of data associated with 8 to 12 seconds into thevideo. (F) Video timeline.
2.3 Video Visualizations
We employed different visualization techniques to visualize eachspatial interaction’s location with respect to the user interface con-tained in the video. This was accomplished by overlaying themon top of the video using an orthographic projection mapping. Weused a static heatmap to visualize the frequency of gestures thatwere performed at different locations. Data is selected to be visu-alized in the heatmap if its associated frame is within a non-slidingwindow. When the user first loads the required data into the appli-cation, the window is the size of the entire video; therefore all of thegesture data is initially visualized. If the video is played or seeked,then the window’s starting frame is set to the seeked location orthe beginning of the video segment being played. The window’sending frame is then calculated by adding a user-changeable value,contained in a widget, to the starting frame. Although, if the time-line sections or graphs are used to seek the video instead of the timeslider, then the window’s ending frame is set to either the timelinesection’s last frame or the last frame associated with the selectedgraph data. The interface also contains some other widgets that al-low the user to set the window’s ending frame to always be the lastframe in the video, as well as to animate the heatmap over timeusing the data contained in its window.
We also visualized the path of each pointable (finger or tool) us-ing a semi-transparent path. The pointable’s Z-depth is encodedusing colour with either a monochromatic or dichromatic divergentcolour scheme. The path contains green semi-transparent circles tovisualize the location of each pointable when it was first detected bythe spatial interaction sensor. To visualize a pointer’s spatial loca-tion in the current frame, a red semi-transparent triangle is attachedto the end of the path. We also affixed a white semi-transparent
circle to the path for visualizing the spatial location of differentgestures, such as swipe, screen tap and key tap. For example, thewhite circles in Figure 1 show the location of discrete screen tapgestures. The visualization is dynamic since it displays data froma temporal sliding window that starts in the past and ends at thevideo’s current frame. As the video plays, new data is visualizedwhen it enters the sliding window and old data that is no longer in-side the sliding window is removed. This aids the analysis processsince interaction data would quickly disappear if only the currentframe’s data was visualized. The path visualization’s sliding win-dow is automatically set to a low value, but the user has the abilityto change it, such as when one wants to visualize entire paths of allpointers.
In addition to the aforementioned visualizations, our system al-lows the analyst to create their own visual markings by providingvideo annotation abilities (see D in Figure 3), which can then beused to label the location of interesting events, for example.
2.4 Global Heatmap, Controls & Visualization States
Context is important for analysis, therefore we included a globalcontext view of the gesture data with the use of a miniaturizedimage of the video that is overlaid with a heatmap that visualizesgesture data from the entire video. To further facilitate the analy-sis process, we also provide the ability to save and load differentvisualization states (see C in Figure 3). The video frame with theoverlaid visualizations and user annotations that are associated witha saved visualization state can then be downloaded as an image forsharing and offline analysis. The interface also contains widgets onthe left side to allow the investigator to show or hide the heatmap,path visualization, user annotations or the video itself. Opacity lev-
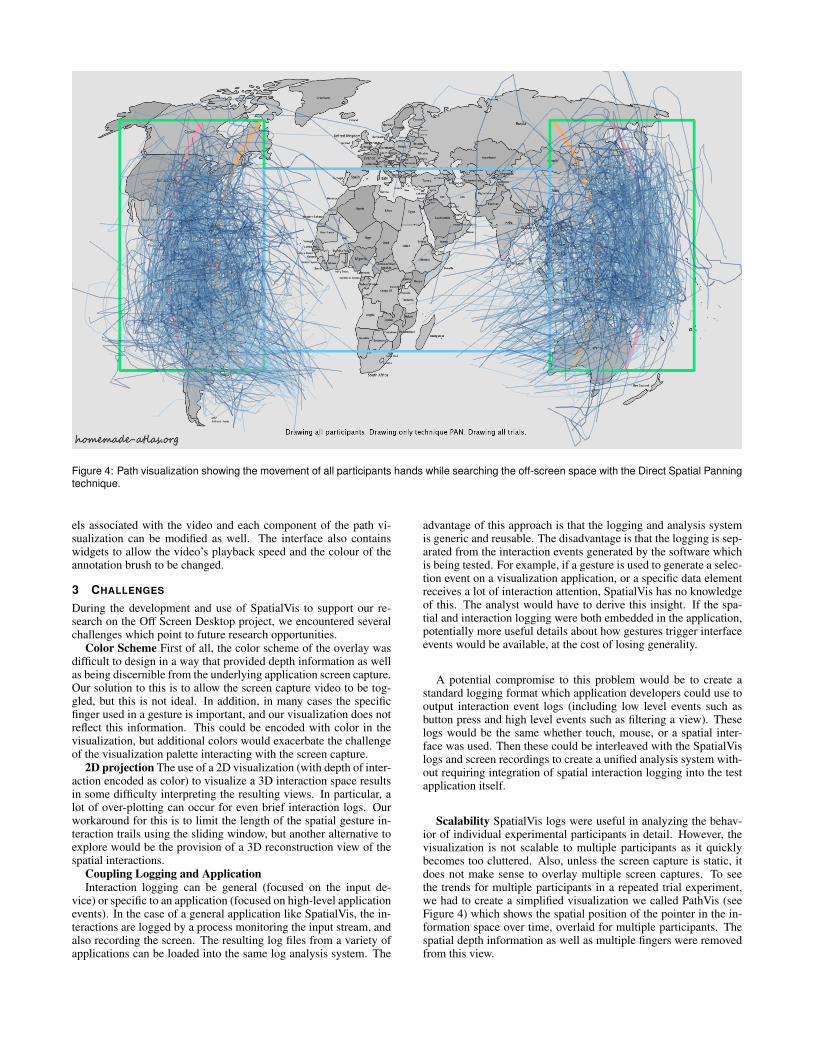
Figure 4: Path visualization showing the movement of all participants hands while searching the off-screen space with the Direct Spatial Panningtechnique.
els associated with the video and each component of the path vi-sualization can be modified as well. The interface also containswidgets to allow the video’s playback speed and the colour of theannotation brush to be changed.
3 CHALLENGES
During the development and use of SpatialVis to support our re-search on the Off Screen Desktop project, we encountered severalchallenges which point to future research opportunities.
Color Scheme First of all, the color scheme of the overlay wasdifficult to design in a way that provided depth information as wellas being discernible from the underlying application screen capture.Our solution to this is to allow the screen capture video to be tog-gled, but this is not ideal. In addition, in many cases the specificfinger used in a gesture is important, and our visualization does notreflect this information. This could be encoded with color in thevisualization, but additional colors would exacerbate the challengeof the visualization palette interacting with the screen capture.
2D projection The use of a 2D visualization (with depth of inter-action encoded as color) to visualize a 3D interaction space resultsin some difficulty interpreting the resulting views. In particular, alot of over-plotting can occur for even brief interaction logs. Ourworkaround for this is to limit the length of the spatial gesture in-teraction trails using the sliding window, but another alternative toexplore would be the provision of a 3D reconstruction view of thespatial interactions.
Coupling Logging and ApplicationInteraction logging can be general (focused on the input de-
vice) or specific to an application (focused on high-level applicationevents). In the case of a general application like SpatialVis, the in-teractions are logged by a process monitoring the input stream, andalso recording the screen. The resulting log files from a variety ofapplications can be loaded into the same log analysis system. The
advantage of this approach is that the logging and analysis systemis generic and reusable. The disadvantage is that the logging is sep-arated from the interaction events generated by the software whichis being tested. For example, if a gesture is used to generate a selec-tion event on a visualization application, or a specific data elementreceives a lot of interaction attention, SpatialVis has no knowledgeof this. The analyst would have to derive this insight. If the spa-tial and interaction logging were both embedded in the application,potentially more useful details about how gestures trigger interfaceevents would be available, at the cost of losing generality.
A potential compromise to this problem would be to create astandard logging format which application developers could use tooutput interaction event logs (including low level events such asbutton press and high level events such as filtering a view). Theselogs would be the same whether touch, mouse, or a spatial inter-face was used. Then these could be interleaved with the SpatialVislogs and screen recordings to create a unified analysis system with-out requiring integration of spatial interaction logging into the testapplication itself.
Scalability SpatialVis logs were useful in analyzing the behav-ior of individual experimental participants in detail. However, thevisualization is not scalable to multiple participants as it quicklybecomes too cluttered. Also, unless the screen capture is static, itdoes not make sense to overlay multiple screen captures. To seethe trends for multiple participants in a repeated trial experiment,we had to create a simplified visualization we called PathVis (seeFigure 4) which shows the spatial position of the pointer in the in-formation space over time, overlaid for multiple participants. Thespatial depth information as well as multiple fingers were removedfrom this view.

4 CONCLUSION
Spatial interaction is an emerging modality for many types of appli-cations, including information visualization. We have presented aninitial visualization application, available online at (URL to comefor final version), for analyzing experimental trials of interactionswith visualization applications using spatial gestures.
REFERENCES
[1] M. Bostock, V. Ogievetsky, and J. Heer. D3 data-driven docu-ments. IEEE Transactions on Visualization and Computer Graphics,17(12):2301–2309, Dec. 2011.
[2] T. Grossman and R. Balakrishnan. The Bubble Cursor: Enhancing tar-get acquisition by dynamic resizing of the cursor’s activation area. InProceedings of the SIGCHI Conference on Human Factors in Com-puting Systems, CHI ’05, pages 281–290, New York, NY, USA, 2005.ACM.
[3] D. A. Keim. Information visualization and visual data mining. IEEETransactions on Visualization and Computer Graphics, 8(1):1–8, Jan.2002.
[4] E. Paluka. Spatial peripheral interaction techniques for viewing andmanipulating off-screen digital content. Master’s thesis, University ofOntario Institute of Technology, Oshawa, Ontario, Canada, 2015.
[5] J. S. Yi, Y. a. Kang, J. Stasko, and J. Jacko. Toward a deeper under-standing of the role of interaction in information visualization. IEEETransactions on Visualization and Computer Graphics, 13(6):1224–1231, Nov. 2007.