spatial prediction of wildfire hazard across new zealand ... · pdf filespatial prediction of...
TRANSCRIPT

Spatial Prediction of Wildfire Hazard Across
New Zealand: A Significant Upgrade
Landcare Research
September 2005
The objective of this project was to develop new high-resolution, 25m grid data layers to describe the wild fire hazard across New Zealand, utilising improved data sources like the Landcover Database 2 which was developed after the first iteration of this research in 2001. Weather data measured over time across the NRFA weather station network were used to calculate average fire hazard during the worst 20% of days in the fire season. Mathematical surfaces were fitted to these data to enable estimation of standard fire weather indices (FWI) across New Zealand. Results consisted of 7 new 25-m grid layers for fire weather indices (FWI) across New Zealand. From these initial FWI layers, additional derived layers of slope correction factor (SCF), fuel load (FL), rate of spread (ROS), and head fire intensity (HFI) were also calculated. The results indicate considerable spatial variation in wildfire danger across New Zealand, this is increasingly evident with the new 25-m grids that were developed. The values of fuel load, fuel types and slope correction factor have improved as a result of using higher resolution underlying spatial data layers.
New Zealand Fire Service Commission Research Report Number 55 ISBN Number 1-877349-23-2 © Copyright New Zealand Fire Service Commission

Spatial Prediction of Wildfire Hazard across New Zealand
A Significant Upgrade
Craig Briggs, Robbie Price, and *Grant Pearce Landcare Research Private Bag 3127, Hamilton 2001 New Zealand *Scion – trading name of the NZ Forest Research Institute P O Box 29237 Chrischurch New Zealand Landcare Research Contract Report: LC0506/014 PREPARED FOR: New Zealand Fire Service P O Box 2133 Wellington New Zealand DATE: September 2005

Reviewed by: Bruce Burns Scientist Landcare Research
Approved for release by: David Choquenot Science Manager Science Manager
© Landcare Research New Zealand Ltd 2005 No part of this work covered by copyright may be reproduced or copied in any form or by any means (graphic, electronic or mechanical, including photocopying, recording, taping, information retrieval systems, or otherwise) without the written permission of the publisher.

Landcare Research
3
Contents
1. Summary ...........................................................................................................................5 2. Introduction .......................................................................................................................6 3. Background .......................................................................................................................6
3.1 Components of the Fire Weather Index System ......................................................6 3.2 Standard FWI Indices...............................................................................................6 3.3 Derived FWI Layers.................................................................................................7
4. Methods .............................................................................................................................7 4.1 Methods for Developing Fire Hazard Layers ..........................................................7 4.2 Prediction of FWI Components from Fire Service Data..........................................8 4.3 Calculation of Derived Layers .................................................................................9 4.4 Fuel Loads................................................................................................................9 4.5 Slope Correction Factor ...........................................................................................9 4.6 Rate of Fire Spread ................................................................................................12 4.7 Degree of Cure .......................................................................................................12 4.8 Head Fire Intensity.................................................................................................12
5. Results .............................................................................................................................13 5.1 Surface Statistics for FWI Layers ..........................................................................13 5.2 Standard FWI layers...............................................................................................13 5.3 Derived FWI Layers...............................................................................................21
6. Discussion .......................................................................................................................26 7. References .......................................................................................................................27 Appendix 1: ArcGIS 9.0 Spatial Analysis Formula for Fuel Loads, Rate of Spread, and Head Fire Intensity. ............................................................................................................................28 Appendix 2: FWI and Derived FWI grid layer descriptions.....................................................29 Appendix 3: Sub-contract report attachment Fuel Load and Fire Behaviour Assessments for Vegetation within LCDB2 H. Grant Pearce

Landcare Research
4

Landcare Research
5
1. Summary
Project and Client Landcare Research, Hamilton was engaged by the New Zealand Fire Service, through funding from the Contestable Research Fund, to develop new Wildfire Hazard layers across New Zealand in July and August 2005. Objectives • Use new and enhanced data layers such as Landcover Database 2 (LCDB2) and an
improved national 25-m digital elevation model (DEM) developed by Landcare Research to make significant improvements on previous data layers, that had been calculated in Spatial Prediction of Wildfire Hazard Across New Zealand, Landcare Research Contract Report LCR 0001/081.
Methods • Weather data measured over time across the NRFA weather station network were used to
calculate average fire hazard during the worst 20% of days in the fire season. • Mathematical surfaces were fitted to these data to enable estimation of standard fire
weather indices (FWI) across New Zealand. • As a result of the updated Landcover database version, improved calculations to define
fuel types, fuel loads, and potential fire behaviour were supplied by Grant Pearce, Scion Research, Christchurch.
Results • Results consisted of 7 new 25-m grid layers for fire weather indices (FWI) across New
Zealand. • From these initial FWI layers, additional derived layers of slope correction factor (SCF),
fuel load (FL), rate of spread (ROS), and head fire intensity (HFI) were also calculated. Discussion • The results indicate considerable spatial variation in wildfire danger across New Zealand,
this is increasingly evident with the new 25-m grids that were developed. • The values of fuel load, fuel types and slope correction factor have improved as a result
of using higher resolution underlying spatial data layers.

Landcare Research
6
2. Introduction
The objective of this project was to develop high-resolution, 25-m grid data layers describing wildfire hazard across New Zealand. These layers include both fuel moisture codes and fire behaviour indices of the Fire Weather Index (FWI) System (Van Wagner & Pickett 1985). This system is widely used by Rural Fire Authorities to provide an indication of climatic conditions that would lead to high fire danger, and derived layers that describe fire behaviour. The resulting digital maps will be inputs to the subsequent prediction of spatial variation of fire hazard by Rural Fire Authorities.
3. Background
3.1 Components of the Fire Weather Index System
The following is a brief description of both the standard components of the Fire Weather Index (FWI) system and the derived layers produced by this project. 3.2 Standard FWI Indices
The Fine Fuel Moisture Code (FFMC): a numerical rating of the moisture content of litter and other cured fine fuels. This code is an indicator of the relative ease of ignition and flammability of fine fuel. The Duff Moisture Code (DMC): a numerical rating of the average moisture content of loosely compacted organic layers of moderate depth. This code gives an indication of fuel consumption in duff layers of moderate depth and medium-sized woody material. The Drought Code (DC): a numerical rating of the average moisture content of deep, compact, organic layers. This code is a useful indicator of seasonal drought effects on forest fuels, and the amount of smouldering expected in deep duff layers and large logs. The Initial Spread Index (ISI): a numerical rating of the expected rate of fire spread. It combines the effects of wind and the Fine Fuel Moisture Code on rate of spread without the influence of variable quantities of fuel. The Buildup Index (BUI): a numerical rating of the total amount of fuel available for combustion that combines the Duff Moisture Code and the Drought Code. The Fire Weather Index (FWI): a numerical rating of fire intensity that combines the Initial Spread Index and the Buildup Index. The Daily Severity Rating (DSR): a parameter that estimates the severity of the fire weather for each day. This parameter reflects potential fire intensity, control difficulty, and the amount of work required to suppress a fire. It also allows researchers to compare the severity

Landcare Research
7
of fire weather from one year to another. 3.3 Derived FWI Layers
Fuel Load (FL): indicates the dry weight of combustible materials per unit area, measured in kilograms per square metre (kg/m2) or tonnes per hectare (t/ha). Fuel load was described for each vegetated cover type as either a constant value or an equation. Slope Correction Factor (SCF): a dimensionless coefficient that indicates the effect of slope on fire rate of spread. Fire is assumed to travel more rapidly up slope due to heat convection and radiation. Degree of Cure (DoC): indicates the degree of drying, and is used to determine rate of fire spread in grass fuel types. Degree of curing is a key variable in determining the rate of fire spread in grassland vegetation types. Rate of Spread (ROS): the progress per unit time of the head fire or another specified part of the fire perimeter, generally measured as metres per hour (m/hr). Rate of spread, uncorrected for the effect of slope, was described for each vegetation cover type using an equation, or in a few cases, given a constant value. Head Fire Intensity (HFI): The head fire intensity represents the potential energy output in kilowatts per metre (kW/m) of the spreading fire front, assumed to be at the head where the rate of spread is the greatest.
4. Methods
4.1 Methods for Developing Fire Hazard Layers
Methods consisted of using a combination of Geographic Information Systems (GIS) applications, in particular ArcGIS 9, ArcView 3.2a, with spatial analyst extensions, and ANUSPLIN, a surface fitting software application, to calculate new estimated surfaces for standard FWI and derived FWI layers consisting of fuel load, rate of spread, and head fire intensity across New Zealand. A similar methodology was followed in this project as was used in the previous Spatial Prediction of Wildfire Hazard Across New Zealand project (Leathwick & Briggs, 2001). However, significant enhancements in this project involved the development of new FWI surfaces at a higher 25-m grid resolution as shown in Figure 1. This upgrade is in a large part due to new improvements including new versions of a land-cover database (LCDB2) (Thompson et al. 2004) and a 25-m DEM developed by Landcare Research Lincoln (Barringer et al. 2002).

Landcare Research
8
NRFA DataNRFA supplied FWI values from station climate data for 80th
percentile data to update FWI climate layers.
Calculate new FWI 25m climate layers
FFMC Fire Fuel Moisture Content
DMC Duff moisture Content
DC Drought Code
ISI Initial Spread Index
BUI Build Up Index
FWI Fire Weather Index
DSR Daily Severity Rating
25m grid surfaces calculated using Anusplin software.
Fuel Loads (FL) – Recalculated using LCDB2
Categorised into fuel types based on new Landcover database (LCDB2). Equations were supplied by Grant Pearce from Forest Research. Measured in tonnes per hectare (t/ha)
Degree of Cure (DoC)
Determining rate of fire spread in grass fuel types. Used supplied rates of DoC indicated in equations from Grant Pearce.
Rates of Spread (ROS)
Relationships derived for each fuel type based on calculations of ISI, BUI, and DoC. Described for each vegetation cover type using an equation. Measured in metres per hour (m/hr)
Head Fire Intensity (HFI)
Based on the calculated fuel load and slope corrected ROS values. Measured in potential energy output in kilowatts per metre (kW/m)
Slope Correction Factor (SCF) –Recalculate with 25m DEM
The effect of slope on fire spread. Recalculated using new 25 meter DEM. Calculation supplied by Grant Pearce. SCF was calculated using raster calculator in ArcGIS 9 spatial analyst.
The following layers were calculated at Landcare Research
NRFA DataNRFA supplied FWI values from station climate data for 80th
percentile data to update FWI climate layers.
NRFA DataNRFA supplied FWI values from station climate data for 80th
percentile data to update FWI climate layers.
Calculate new FWI 25m climate layers
FFMC Fire Fuel Moisture Content
DMC Duff moisture Content
DC Drought Code
ISI Initial Spread Index
BUI Build Up Index
FWI Fire Weather Index
DSR Daily Severity Rating
25m grid surfaces calculated using Anusplin software.
Fuel Loads (FL) – Recalculated using LCDB2
Categorised into fuel types based on new Landcover database (LCDB2). Equations were supplied by Grant Pearce from Forest Research. Measured in tonnes per hectare (t/ha)
Fuel Loads (FL) – Recalculated using LCDB2
Categorised into fuel types based on new Landcover database (LCDB2). Equations were supplied by Grant Pearce from Forest Research. Measured in tonnes per hectare (t/ha)
Degree of Cure (DoC)
Determining rate of fire spread in grass fuel types. Used supplied rates of DoC indicated in equations from Grant Pearce.
Degree of Cure (DoC)
Determining rate of fire spread in grass fuel types. Used supplied rates of DoC indicated in equations from Grant Pearce.
Rates of Spread (ROS)
Relationships derived for each fuel type based on calculations of ISI, BUI, and DoC. Described for each vegetation cover type using an equation. Measured in metres per hour (m/hr)
Rates of Spread (ROS)
Relationships derived for each fuel type based on calculations of ISI, BUI, and DoC. Described for each vegetation cover type using an equation. Measured in metres per hour (m/hr)
Head Fire Intensity (HFI)
Based on the calculated fuel load and slope corrected ROS values. Measured in potential energy output in kilowatts per metre (kW/m)
Head Fire Intensity (HFI)
Based on the calculated fuel load and slope corrected ROS values. Measured in potential energy output in kilowatts per metre (kW/m)
Slope Correction Factor (SCF) –Recalculate with 25m DEM
The effect of slope on fire spread. Recalculated using new 25 meter DEM. Calculation supplied by Grant Pearce. SCF was calculated using raster calculator in ArcGIS 9 spatial analyst.
Slope Correction Factor (SCF) –Recalculate with 25m DEM
The effect of slope on fire spread. Recalculated using new 25 meter DEM. Calculation supplied by Grant Pearce. SCF was calculated using raster calculator in ArcGIS 9 spatial analyst.
The following layers were calculated at Landcare Research
Fig. 1 Process for developing wildfire hazard layers across New Zealand. 4.2 Prediction of FWI Components from Fire Service Data
FWI values from 171 climate stations were supplied from the New Zealand Fire Service. The values supplied were for the 80th percentile and above to calculate the average fire hazard during the worst 20% of days in the fire season. These values were then used to fit a thin-plate spline surface that allows subsequent interpolation of the FWI indices at sites remote from weather stations. ANUSPLIN software was used to carry out this procedure. Predictor variables used in the fitting of the surface were New Zealand Map Grid easting and northing, elevation, and seasonal rainfall for October through to April (fire season) using LENZ 1.0

Landcare Research
9
monthly rainfall surfaces. These predictor variables were re-sampled to 25-m grid resolution. To help speed up processing time to carry out these calculations, 8000 by 8000 pixel tiles covering New Zealand were derived from the 25-m surfaces using an Avenue script (ArcView 3.2a, ESRI) and exported as binary raster data files. A further Avenue script was used to convert the results from binary raster data into 25-m ESRI grids, and merge the grids to form a complete New Zealand coverage. 4.3 Calculation of Derived Layers
Derived FWI layers consisted of calculated layers for Fuel Load, Slope Correction Factor, Rate of Spread, and Head Fire Intensity. These layers were calculated to 25-m grid resolution. The derived FWI layers were calculated using a mixture of Avenue scripts and ArcView 3.2a for Fuel Loads and Rate of Spread, and ArcGIS 9.0 Spatial Analyst for equations for Slope Correction Factor and Head Fire Intensity. 4.4 Fuel Loads
Fuel loads used land-cover classes in the LCDB2 (Land Cover Database version 2) to define calculations of fuel load. Equations to carry out this procedure were supplied in an Excel spreadsheet from Scion (Pearce 2005). This document outlines the processes followed to derive these equations. In the process of updating fuel model assessments from LCDB 1 to LCDB 2 it was decided to streamline the process by developing a single, generic equation for all fuel types, both fuel load and rate of spread. The close relationship between fuel load and Land Cover Database has resulted in a fuel-load layer which calculates fuel load with a corresponding LCDB2 land-cover class at each 25 by 25 metre pixel. Figure 11 describes fuel load for New Zealand, and note a scale factor of 10. Fuel load was measured in tonnes per hectare (t/ha). 4.5 Slope Correction Factor
The Slope Correction Factor (SCF) is used to adjust Rate of Spread (ROS) estimates for the effect of slope. This equation estimates values to take into account the upslope effect of increased preheating of fuels through radiation and convection. It is assumed that fires only run upslope. In the previous version of the NZWTAS hazard layer, two different SCF equations were included that distinguished between the slope effect in scrub fuels and in other vegetation types. This was based on limited observations available at that time from fires in scrub fuels. Since this time, however, there has been no further evidence to support the need for a separate relationship to be used in producing the updated fire hazard layer (Pearce 2005). The slope layer used in calculating the SCF was derived from a 25-m DEM (digital elevation model) for New Zealand. Refer to Figure 10.
Slope Correction Factor = EXP(((TAN(Slope/57.29578))^1.2)*3.533)

Landcare Research
10
In developing the SCF layer there was an initial issue with values when the slope was greater than 60 degrees. Grant Pearce from Scion advised that the equation “was really only intended to be used for vegetated slopes (i.e., slopes on which you would normally expect to find vegetation growing), so that it probably only applies for slopes up to 35 degrees (70%). Above this, we’d expect patchy vegetation interspersed with rock screes or outcrops with little or no vegetation, and certainly not continuous vegetation required for continuous fire spread.” – extract from Pearce 2005. As a result of this outcome an upper limit at 35 degrees (where SCF = 10) was given and slopes greater than 35 degrees were given the value of 11. Figure 2 illustrates terrain where slope is greater than 35 degrees, and describes the areas where a constant SCF value of 11 was assumed.

Landcare Research
11
Fig. 2 Calculation of slopes greater than 35 degrees.

Landcare Research
12
4.6 Rate of Fire Spread
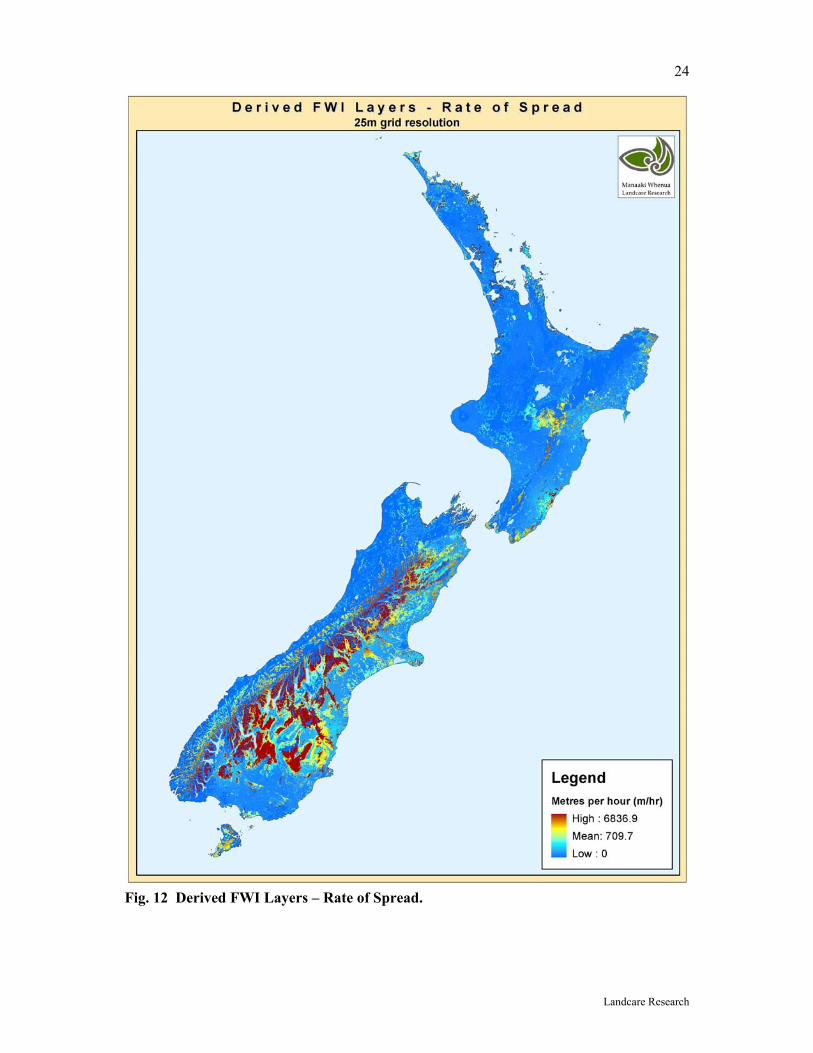
Rate of fire spread was calculated uncorrected for the effect of slope. Equations for this layer were supplied in an Excel spreadsheet, and processed using an Avenue script in ArcView 3.2a to link the equations with the LCDB2 coverage. Rate of spread was derived for each vegetation cover in the LCDB2, using an equation or, in a few cases (e.g., dumps, mangroves), an assumed constant value. Rate of spread in shrub/scrub vegetation types was based on variations of the New Zealand scrubland fire danger model, which uses the Initial Spread Index (ISI) component from the FWI System. Rate of spread in grassland vegetation types was based on the open grass fuel models from the Canadian FBP System, which utilise the ISI component, and an estimate of the degree of grass curing (DoC%). Depending on the predominant fuels expected to carry a fire, forest fuel types were based on either grass models (ROS2), logging slash or standing pine models or, in the case of indigenous forest, mixed wood fuel types from the Canadian FBP System. As well as the ISI component, these equations also include a BUI effect on rate of spread (Pearce & Anderson 2004). Figure 12 illustrates Rate of Spread for New Zealand. Scale factor is set at 10. Rate of fire spread is measured in metres per hour (m/hr). 4.7 Degree of Cure
The degree of curing of grass fuels is used to describe grasslands seasonal die-off. This is a key variable in determining the rate of fire spread in grassland vegetation types and, at values below 50% rate of curing, rate of spread is normally assumed to be zero. In the previous version of the NZWTAS hazard layer, this degree of curing (DoC%) was treated as a constant that only varied slightly as a result of seasonal dryness. Due to the larger number of vegetation cover types within LCDB2 (Land Cover Database 2) over LCDB1, and the wider variability in curing values expected within these cover types (e.g., from irrigated grasses in urban parklands, orchards and other perennial crops with low to moderate DoC% values through to depleted tussock and alpine grasslands, and short-rotation grain crops with high DoC% values) under extreme dry seasonal conditions (20% worst days of the fire season – data used for these results), it was concluded that a wider range of assumed constant values of DoC% would be more appropriate for this version of the hazard layer calculations. The constant values of DoC% were assigned to the various grass-dominated cover types within LCDB2, and range from 60% to 100%, Pearce (2005). 4.8 Head Fire Intensity
The head fire intensity represents the potential energy output (measured in kilowatts per metre, kW/m) of the spreading fire front (assumed to be at the head where the rate of spread is the greatest). It is determined from the amount of fuel consumed (assumed to be equivalent to the available fuel load, FL) and the slope-corrected rate of fire spread (ROS * SCF). Figure 13 shows the estimated Head Fire Intensity for New Zealand. Scale factor is set at 10.
2SCFROSFLHFI ∗∗
=

Landcare Research
13
5. Results
5.1 Surface Statistics for FWI Layers
A summary of statistics for the FWI layers is shown in Table 1. Two measures of predictive error are provided for each surface: the square root of the generalised cross validation, and the square root of the mean standard error. Neither is a completely satisfactory measure of the true surface errors, the first overestimating and the second underestimating the true surface error, the true standard error is estimated to be located between these two values. All grid layers were stored as integers to reduce their size to manageable levels. To preserve a required numerical precision, for some layers this has been achieved by multiplying values by a scale factor before integer conversion. Values should be divided by these scale factors when using these grids in calculations. Table 1 Surface statistics for Fire Weather Index components derived from the ANUSPLIN SplineA process.
FWI Mean Std Dev Root GCV
Root MSE
Scale Factor
BUI 84.4970 2.233 1.47 0.623 10DC 22.3300 9.436 5.50 1.360 10DMC 208.1500 91.760 44.90 8.470 10DSR 7.5146 4.843 3.64 1.340 10FFMC 33.2060 14.260 8.03 1.960 10FWI 12.2400 5.987 4.25 1.370 10ISI 3.4360 3.106 2.13 0.661 10
5.2 Standard FWI layers
The following Figures 3 through to 9 illustrate newly calculated standard FWI layers. The standard FWI grids are all calculated to 25-m grid resolution.

Landcare Research
14
Fig. 3 Fire Weather Index - Build Up Index.

Landcare Research
15
Fig. 4 Fire Weather Index – Drought Code.

Landcare Research
16
Fig. 5 Fire Weather Index – Duff Moisture Code.

Landcare Research
17
Fig. 6 Fire Weather Index – Daily Severity Rating.

Landcare Research
18
Fig. 7 Fire Weather Index – Fine Fuel Moisture Code.

Landcare Research
19
Fig. 8 Fire Weather Index.

Landcare Research
20
Fig. 9 Fire Weather Index – Initial Spread Index.

Landcare Research
21
5.3 Derived FWI Layers
The following Figures 10 through to 13 illustrate newly calculated derived FWI layers consisting of slope correction factor, fuel load, rate of spread, and head fire intensity. The derived FWI grids are all calculated to 25-m grid resolution.

Landcare Research
22
Fig. 10 Derived FWI Layers – Slope Correction Factor.

Landcare Research
23
Fig. 11 Derived FWI Layers – Fuel Load.
Landcare Research
24
Fig. 12 Derived FWI Layers – Rate of Spread.

Landcare Research
25
Fig. 13 Derived FWI Layers – Head Fire Intensity.

Landcare Research
26
6. Discussion
New 25-m FWI and derived FWI grid layers such as slope correction factor, fuel load, rate of spread, and head fire intensity were calculated for New Zealand, using New Zealand Fire Service climate data from 171 climate stations to estimate FWI and derived FWI surfaces. Figures 2 through to 9 illustrate the FWI layers for fine fuel moisture content, duff moisture content, drought code, initial spread index, build up index, fire weather index, and daily severity rating. Although these figures differ in mean and maximum values, there are some similarities based in a large part on climatic factors. Higher values occur in the eastern regions of both islands, particularly Canterbury, Hawke’s Bay and in some cases Northland, whereas lower values for FWI layers occur in western regions of both the North and South Islands, including regions such as Southland, and the Waikato. Figures 10 through to 13 show derived FWI layers. Areas of fuel load, slope correction factor, rate of spread, and head fire intensity show some commonalities with higher values in the central parts of both North and South Islands. This would be expected, given the degree of slope and fuel load in these areas, whereas lower values of FL, ROS, SCF, and HFI predominantly occur in western and southern areas of the South Island, and parts of Northland, Waikato, and Manuwatu in the North Island. Again this is to be expected given the rates of slope and available fuel load in these areas. Issues with this project arose with calculating both FWI and derived FWI layers in an ArcView and ArcGIS environment, and incorporating equations from an Excel spreadsheet into a GIS process. There was also an increased level of complexity with some of the derived FWI layers due to the higher levels of resolution. For example, the slope correction factor had values well in extreme of what was expected and outside the parameters of the equation. This was in part due to the effect of a higher resolution slope layer with slope degrees at a maximum value of 85 degrees compared with 67 degrees for the 100-m layer used previously. This issue was resolved by only calculating a slope correction factor for slopes less or equal to 35 degrees (refer to Figure 2.) Users of these layers should note that it is necessary to divide by the appropriate scale factor to get the actual result. A scale factor of 10 was used because of the higher degree of resolution required; and therefore it was necessary to change the derived FWI layers to a more manageable integer form.

Landcare Research
27
7. References
Barringer J R F, Pairman D, McNeil S J 2002. Development of a high-resolution
digital elevation model for New Zealand. Landcare Research Contract Report, LC0102/170.
Hutchinson M F 2000. Anusplin Version 4.1 User Guide. Canberra, Australia.
Centre for Resource and Environmental Studies. Leathwick J R, Briggs C M 2001. Spatial prediction of wildfire hazard across New
Zealand. Landcare Research Contract Report, LCR 0001/081 (unpublished). Pearce G H 2005. Fuel load and fire behaviour for vegetation within LCDB2. Scion,
Christchurch. Sub-contracted contract report to this project. See Appendix 3. Pearce H G, Anderson S A J 2004. Field guide to fire behaviour in New Zealand fuel
types. Forest Research Forest and Rural Fire Research Programme, Christchurch. Pearce G H, Mullan A B, Salinger M J, Opperman T W, Woods D, Moore J R 2005.
Impact of climate change on long-term fire danger. NIWA Client Report AKL2005-45, Prepared for New Zealand Fire Service Commission.
Thompson S, Gruner I, Gapare N 2004. New Zealand land cover database version 2.
User Guide. Prepared for the New Zealand Climate Change Office, Contract Number 04/05-0019-S.
Van Wagner C E, Pickett T L 1985. Equations and FORTRAN program for the
Canadian Forest Fire Weather Index System. Forestry Technical Report 33. Canada, Canadian Forestry Service.

Landcare Research
28
Appendix 1: ArcGIS 9.0 Spatial Analysis Formula for Fuel Loads, Rate of Spread, and Head Fire Intensity.
The following formulae were converted for use in ArcGIS 9.0 and ArcView 3.2a using Spatial Analyst extension, using equations supplied by Grant Pearce Scion, Christchurch. All grid layers were stored as integers to reduce their size to manageable levels. For some layers this has been achieved by multiplying values by a scale factor before integer conversion. When using these calculations values should be divided by these scale factors, for both setting up the legends, and when using the grids in calculations. Calculating Slope Correction Factor SCF7 = Int((Exp((Pow(Tan([nz_slope25m] / 57.29578), 1.2)) * 3.533))* 10) Reclassed SCF7 – (version 7) same values to 35 degrees as SCF7, above and including 36 degrees, were given the same values of 111 (scale factor of 10). Calculating Fuel Load Fuel load calculations were supplied in an Excel spreadsheet by Grant Pearce. Ref 4. The spreadsheet contained 3 different calculation parameters for 70 different land cover classes from the LCDB2. Calculating Rate of Spread Rate of spread calculations were supplied in an Excel spreadsheet by Grant Pearce (Pearce 2005). The spreadsheet contained 4 different calculation parameters for 70 different land cover classes from the LCDB2. Calculating Head Fire Intensity HFI3= (([fl] * ([ros] * [scf7reclass])) / 2) / 100

Landcare Research
29
Appendix 2: FWI and Derived FWI grid layer descriptions.
Grid name FWI code FWI name
Spatial Extent
Grid resolution Data sources Equation Source
Grid scale factor Map projection
Bui BUI build up index NZ 25-m FWI data-NRFA climate stations Anusplin 10 NZMG
Dc DC drought code NZ 25-m FWI data-NRFA climate stations Anusplin 10 NZMG
Dmc DMC duff moisture code NZ 25-m FWI data-NRFA climate stations Anusplin 10 NZMG
Dsr DSR daily severity rating NZ 25-m FWI data-NRFA climate stations Anusplin 10 NZMG
Ffmc FFMC fine fuel moisture content NZ 25-m
FWI data-NRFA climate stations Anusplin 10 NZMG
Fwi FWI fire weather index NZ 25-m FWI data-NRFA climate stations Anusplin 10 NZMG
Isi ISI initial spread index NZ 25-m FWI data-NRFA climate stations Anusplin 10 NZMG
Fl FL fuel load NZ 25-m LCDB2 and BUI (Pearce, Scion, 2005) 10 NZMG Ros ROS rate of spread NZ 25-m LCDB2 and ISI, BUI, DoC% (Pearce, Scion, 2005) 10 NZMG
SCF7reclass SCF slope correction factor NZ 25-m
25m DEM - Slope, Landcare Research (Pearce, Scion, 2005) 10 NZMG
HFI3 HFI head fire intensity NZ 25-m FL, ROS, and SCF (Pearce, Scion, 2005) 10 NZMG