spatial heterogeneity and seasonal succession of ... · reactive phosphorus (srp), no 3-n, no 2-n...
TRANSCRIPT
Spatial heterogeneity and seasonal successionof phytoplankton functional groups along thevertical gradient in a mesotrophic reservoir
Tugba Ongun Sevindik1*, Kemal Celik2 and Luigi Naselli-Flores3
1 Department of Biology, Faculty of Arts and Science, Sakarya University, 54187, Sakarya, Turkey2 Department of Biology, Faculty of Arts and Science, Bal�kesir University, 10145, Bal�kesir, Turkey3 Department of Biological, Chemical and Pharmaceutical Sciences and Technologies (STEBICEF), Section of Botany andPlant Ecology, University of Palermo, Via Archirafi 38, I-90123 Palermo, Italy
Received 26 September 2016; Accepted 15 December 2016
Abstract – Tracking morphological variability of phytoplankton is a useful tool to better understandenvironmental changes. Highly dynamic systems such as reservoirs are convenient environments to investigate
the effects of environmental variables on phytoplankton morphology. However, to fully understand the effectsof mixing and trophic state on phytoplankton functional group (FG) distribution, the entire water columnmust be considered since integrated or sub-superficially collected samples, may not adequately represent
phytoplankton structure. This idea was tested by analyzing vertical profiles of phytoplankton FGs, theirrelative biomass, physical and chemical parameters, through monthly samplings over a 2 years period, at threestations located along the longitudinal axis in the monomictic, mesotrophic Ikizcetepeler reservoir,northwestern part of Turkey. Thermal stratification occurred in the reservoir from April to September, and
zmix/zeu values increased after the breaking down of the thermocline. Nine FGs characterized the seasonalcycle and C-strategist organisms were typical representatives of the assemblages. Nutrient availability andtemperature were found to influence phytoplankton dynamics, whereas water withdrawal played a secondary
role. Groups Y, P, B, J, F, Lo and Tc showed heterogeneous distribution along the water column and,temperature heterogeneity, high DIN values in surface waters, zmix/zeu values and sedimentation loss were themost important factors regulating their distribution. The results show that phytoplankton morphological
spectrum throughout the entire water column, contributes useful information to assess the influence of mixingand trophic state on phytoplankton dynamics in mesotrophic reservoirs.
Key words: C–S–R strategies / freshwater phytoplankton / functional groups / mesotrophic reservoir
Introduction
In the last few years, a large number of reservoirshave been created all over the world to store water fordomestic water supply, irrigation, navigation, recreation,sedimentation control, flood control and to hydropower(ICOLD, 2007; Zarfl et al., 2015). These ecosystemstherefore represent important elements of Earth’s fresh-water network although they often lie in the upper partof the trophic spectrum and their water exploitationcan be seriously compromised by the occurrence oftoxic cyanobacteria blooms (Naselli-Flores et al., 2007).Conversely to natural lakes, reservoirs are actuallysubjected to operational procedure, which may interferewith their physical, chemical and biological characteristics(Naselli-Flores, 2000; Rangel et al., 2012). In particular,
Mediterranean reservoirs show wide water-level fluctua-tions, which may influence the ratio between mixingdepth and euphotic depth and ultimately influence phyto-plankton structure (Naselli-Flores, 2014).
Spatial heterogeneity of phytoplankton in reservoirshas been largely investigated both vertically and horizon-tally (e.g., Albay and Akcaalan, 2003; Borges et al., 2008;Rychtecky and Znachor, 2011). Morpho-functional (e.g.,shape, size, presence of flagella, presence of mucilage,coloniality) and physiological (photosynthetic efficiency,nutrient uptake and mixotrophic ability, buoyancy regu-lation, etc.) traits of phytoplankton play an important rolein their heterogeneous vertical distribution (Lindholm,1992; Tremblay et al., 1997; Serra et al., 2003) and rep-resent adaptive strategies to allow phytoplankton as-semblages to compel with changes in environmentalconditions. Reynolds (2006) showed that phytoplanktongrowth strategies in a lake at a given time could be*Corresponding author: [email protected]
Article published by EDP Sciences
Ann. Limnol. - Int. J. Lim. 53 (2017) 129–141 Available online at:� EDP Sciences, 2017 www.limnology-journal.orgDOI: 10.1051/limn/2016040

predicted from the environmental conditions prevailing inthe water column. These conditions are largely determinedby two key variables: the ratio between the depth of themixing zone and the euphotic depth (zmix/zeu), which rep-resents a proxy of underwater light climate, and nutrientavailability (Naselli-Flores and Barone, 2011). In Sicilianreservoirs, Naselli-Flores (2000) observed that in thehigher part of the trophic spectrum, where nutrientsare seldom (if ever) limiting phytoplankton growth, thezmix/zeu ratio is the main constraint for phytoplanktonfunctional composition, strongly controlling the phyto-plankton morphological characteristics and the seasonalsuccession of functional groups (FGs). In contrast, theinfluence of nutrients on the phytoplankton morphologiesappeared to be higher in the lower part of the trophicspectrum. Phytoplankton morphological variability canthus supply important information on the ecologicalconditions (nutrient and light availability) of a given waterbody (Naselli-Flores, 2014). Moreover, the FGs approach(Reynolds et al., 2002; Padisak et al., 2009), based onthe physiological, morphological and ecological attributesof the species, has been proved to be an efficientway to analyze seasonal changes in phytoplankton dy-namics (Salmaso et al., 2015). The functional classificationapproach has been successfully applied in reservoirs (e.g.,Crossetti and Bicudo, 2008; Becker et al., 2010; Rychteckyand Znachor, 2011) and can reveal the ecological statusof aquatic ecosystems independently from their geo-graphic location (Padisak et al., 2006). However, previousstudies mainly focused on the temporal distributionsof FGs without investigating their vertical variability(Fonseca and Bicudo, 2008; Becker et al., 2009a; Xiaoet al., 2011). On the other hand, to our knowledge, vertical
distribution of FGs was not investigated in Mediterraneanreservoirs and only a short-term study (Becker et al.,2009b) and a long-term one (Crossetti and Bicudo, 2008)were performed in tropical Brazilian reservoirs.
The aim of this study is to test the hypothesis thatthe interplay of mixing regime and trophic state influencesphytoplankton FG distribution throughout the entirewater column. Therefore surface sampling, especiallyduring stratification periods, only gives just a partial resultof the phytoplankton structure and dynamics in reservoirs,especially in those at the lower side of the trophic spec-trum. To support this idea, we studied the phytoplanktondynamics both on a morphology-based approach andaccording to the FGs classification following Reynoldset al. (2002) and Padisak et al. (2009) along the verticalgradient in monomictic and mesotrophic Mediterraneanreservoir during a 2 years study.
Materials and methods
Study area
Ikizcetepeler reservoir is a mesotrophic (Carlson, 1977;OECD, 1982; Karadzic et al., 2010) man-made lake withan annual mean chlorophyll a concentration of 4.8 mg.Lx1
and an average Secchi disc depth of 1.64 m. The reservoir,located at 39x29k N, 27x56k E in the Mediterranean part ofTurkey (Fig. 1), is a slightly dendritic, warm monomicticwater body. It lies at 175 m above the sea level and hasa maximum depth of 25 m, a length of 6.34 km, and asurface area of 10 km2. The reservoir was built in 1992and it is used for irrigation and to provide drinking
Fig. 1. The map of the Ikizcetepeler reservoir and the location of sampling stations.
Tugba Ongun Sevindik et al.: Ann. Limnol. - Int. J. Lim. 53 (2017) 129–141130

water (State Water Works, 2005). Its catchment areahas been subjected to agricultural, urban and industrialdevelopment, which resulted in the deterioration of thewater quality (Turkish Ministry of Environment andForestry, 2007). Data on its phytoplankton taxonomiccomposition and vertical and seasonal distribution ofchlorophyll a are available in Sevindik et al. (2011), Celikand Sevindik (2011) and Sevindik and Celik (2012).
Three sampling stations were selected along the mainaxis of the reservoir to investigate the differences occurringin the riverine, transition and lacustrine zones. During thestudied period, water depth ranged between 5 and 10 m atthe riverine station, between 8 and 14 m at the transitionstation, while it was between 10 and 20 m at the lacustrinestation.
Phytoplankton analysis
Sampling was carried out monthly at the three stationsbetween February 2007 and January 2009. Samples werecollected at 1 m intervals using a 1 L Hydrobios watersampler, between 9:00 and 11:30 a.m., placed in 250 mLglass bottles, and fixed with Lugol’s solution. In the lab-oratory, the samples were shaken and poured into 50 mLgraduated cylinders. At the end of a 24 h settling period,45 mL of water was siphoned off and the remaining 5 mLof water was poured into a small glass vial for microscopicanalysis (Utermohl, 1958). Enumeration and identificationof algae were performed under an Olympus BX 51 com-pound microscope, equipped with water immersionlenses and a phase contrast attachment. Algal specieswere identified according to the most updated literature.Taxonomy of algae follows Guiry and Guiry (2016).Phytoplankton biomass was calculated from biovolumeestimations (Wetzel and Likens, 2000; Sun and Liu, 2003).Species were grouped in FGs according to Reynolds et al.(2002) and Padisak et al. (2009).
Physical and chemical analyses
Sampling for chemical analyses and measurementof physical variables was carried out contemporary tophytoplankton collection. Conductivity (EC), redoxpotential (ORP), pH and water temperature (T) weremeasured at 1 m intervals using YSI 6600 multi-parameterwater quality sonde (YSI Inc., Ohio, USA). Watertransparency was measured on each sampling date usinga Secchi disc. Dissolved inorganic nitrogen (DIN)concentrations were considered as the sum of the nitrate-nitrogen (NO3-N), nitrite-nitrogen (NO2-N) andammonium-nitrogen (NH4-N). Concentrations of solublereactive phosphorus (SRP), NO3-N, NO2-N and NH4-Nwere spectrophotometrically determined using samplescollected at 1, 5 and 10 m of depth in the first stationand 1, 5 and 15 m in the second and in the third stations(corresponding to the surface, middle and deep parts ofthe reservoir) according to Strickland and Parsons (1972)
and Technicon Industrial Methods (1977a, 1977b).Samplings were collected at 1, 5 and y1 m from thebottom of each station when the depth at these stationswas low. The euphotic zone (zeu) was calculated as 2.7times of Secchi depth (Cole, 1994). The depth of themixing layer (zmix) was estimated from individual tem-perature profiles in all the stations. Mixed layer toeuphotic zone (zmix/zeu) ratio was used as a measure oflight availability in the mixed layer (Jensen et al., 1994).
Data analysis
An ANOVA (analysis-of-variance) test was applied todata for determining the statistical differences in speciesrichness, biomass and the main physical and chemicalparameters among sampling stations, sampling depths andseasons using SPSS 20.0 software. Pearson’s correlationsbetween the selected physical and chemical parametersand species richness and biomass values were also calcul-ated using the SPSS 20.0 software. Redundancy analysis(RDA) was carried out using CANOCO software (TerBraak and Smilauer, 2002). To determine the relation-ship between the biomass of the FGs, sampling periodand environmental variables, RDA was carried out onthe log-normal transformed abundance data. Statisticalsignificance of the environmental predictor variables wasassessed by 999 restricted Monte Carlo permutations.
Results
Environmental parameters
The maximum inflow (5 r 103 m3.sx1) to the reservoiroccurred in spring and the minimum (25 m3.sx1) in thefall. This seasonal difference in water inflow andthe summer use of water for irrigation purposes causedthe water level to decrease by 10 m. Winter and springrepresent the filling period of the reservoir, which, withthe beginning of May, starts emptying due to the irrigationdemand and increased evaporation losses. From themiddle of September, ending agriculture needs, thereservoir fills up again.
Temperature profiles showed that the water columnwas stratified from April to August 2007 (f=2.68, n=88,P<0.05) and from April to September 2008 (f=2.5,n=111, P<0.05) during the study period. From springto mid-summer, the availability of light was high in themixing zone. After the break down of the thermocline,values of zmix/zeu>1.7 were recorded in the first and inthe second station and >2 in the third station (Fig. 2).zmix/zeu values were significantly different among seasons(f=3.61, n=72, P<0.05) and were significantly differentin the third station compared with the others (f=10.33,n=72, P<0.05).
Values of measured physical and chemical variablesare shown in Table 1. SRP values were slightly higher inwinter and significantly different along the vertical profile
Tugba Ongun Sevindik et al.: Ann. Limnol. - Int. J. Lim. 53 (2017) 129–141 131

as a result of high concentrations in 10 and 15 m fromJune to July, 2007 (f=26.28, n=18, P<0.05) and fromOctober to December, 2007 (f=234.31, n=27, P<0.05).However, no significant differences have been foundamong sites (P>0.05). DIN values in 2007 were higherthan the values in 2008 and no significant differences wererecorded at the different depth, except in summer 2008when highest concentrations were measured at 1 m andlowest at 5 m. More in general, environmental variables
were significantly different among seasons (P<0.05) andno significant differences were found among sites orsampling depth (P>0.05) in EC, pH and ORP values.
Phytoplankton structure
A total of 174 taxa belonging to 25 FGs were identifiedin the reservoir. Pearson’s correlation coefficients betweenselected environmental variables and, biomass and speciesrichness are shown in Table 2. Species richness rangedfrom 32 to 83 and was significantly different amongseasons (f=106.47, n=528, P<0.05). No significantdifferences were found among sites or sampling depth(P>0.05).
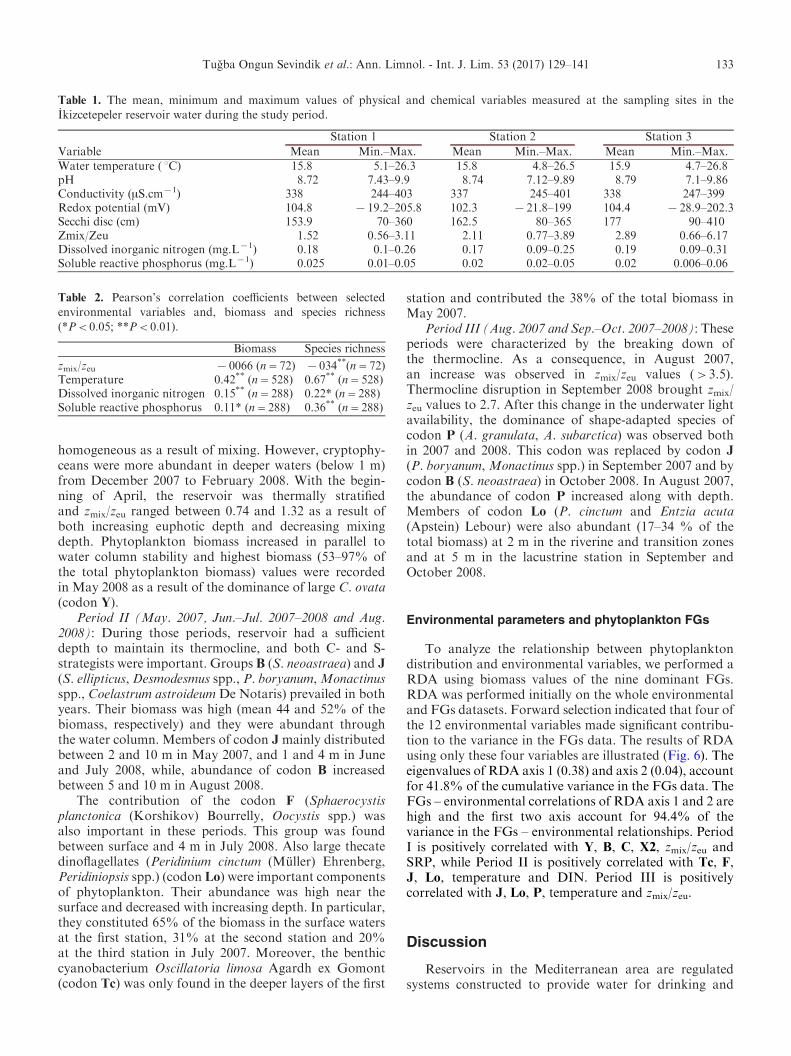
Phytoplankton total biomass ranged from 0.14 to43 mg.Lx1 (Fig. 3). The highest values were recordedbetween 2 and 10 m during summer 2007 and inMay 2008.The high biomass between July and September 2007was due to species with large size belonging to the FGs J(e.g., Scenedesmus ellipticus Corda, Desmodesmusspp., Pseudopediastrum boryanum (Turpin) Hegewald,Monactinus spp.) and P (e.g., Aulacoseira granulata(Ehrenberg) Simonsen, Aulacoseira subarctica (Muller)Haworth). Biomass values in August 2007 and May 2008were different along the vertical profile (f=7.97, n=26,P<0.05 and f=4.37, n=36, P<0.05, respectively).Biomass values were significantly different among seasons(f=42.65, n=528, P<0.01) and different between firstand third stations (f=2.84, n=528, P<0.05).
Seasonal dynamics and vertical distribution ofphytoplankton ecological groups
The temporal distribution of main phytoplanktonstrategies was shown (Fig. 4). In particular, C-strategistswere dominant in winter and spring, followed byS-strategists in mid-summer and by R-strategists afterthe breaking of the thermocline. C-strategists werealso present with representatives of the codon B (mainlyStephanodiscus neoastraea Hakansson and Hickel),during mid-summer and fall in both years when S- andR-strategists dominated.
Nine FGs constituted >20% of the total biomass inat least one sample and B, Y, J and P were the mainFGs (Fig. 5). Three different periods could be identified,based on differences in morphological variability andzmix/zeu ratio (Table 3).
Period I (Nov.–Apr. 2007–2008 and May 2008):C-strategists, belonging to FGs Y (Cryptomonas ovataEhrenberg and C. caudata Massart) and B (Lindaviaocellata (Pantocsek) Nakov et al. and S. neoastraea),dominated phytoplankton assemblage in this periodaccompanied by small flagellates belonging to codonX2 (Cryptomonas pyrenoidifera Geitler and Plagioselmisnannoplanctica (Skuja) Novarino, Lucas and Morrall)and C (Cyclotella meneghiniana Kutzing).
During November to March 2007 and 2008, verticaldistribution of the two dominant coda was generally
Fig. 2. Seasonal variation of the mixing zone (zmix), euphotic
zone (zeu), and the zmix/zeu ratio in the Ikizcetepeler reservoir.
Tugba Ongun Sevindik et al.: Ann. Limnol. - Int. J. Lim. 53 (2017) 129–141132
homogeneous as a result of mixing. However, cryptophy-ceans were more abundant in deeper waters (below 1 m)from December 2007 to February 2008. With the begin-ning of April, the reservoir was thermally stratifiedand zmix/zeu ranged between 0.74 and 1.32 as a result ofboth increasing euphotic depth and decreasing mixingdepth. Phytoplankton biomass increased in parallel towater column stability and highest biomass (53–97% ofthe total phytoplankton biomass) values were recordedin May 2008 as a result of the dominance of large C. ovata(codon Y).
Period II (May. 2007, Jun.–Jul. 2007–2008 and Aug.2008): During those periods, reservoir had a sufficientdepth to maintain its thermocline, and both C- and S-strategists were important. Groups B (S. neoastraea) and J
(S. ellipticus,Desmodesmus spp., P. boryanum,Monactinusspp., Coelastrum astroideum De Notaris) prevailed in bothyears. Their biomass was high (mean 44 and 52% of thebiomass, respectively) and they were abundant throughthe water column. Members of codon Jmainly distributedbetween 2 and 10 m in May 2007, and 1 and 4 m in Juneand July 2008, while, abundance of codon B increasedbetween 5 and 10 m in August 2008.
The contribution of the codon F (Sphaerocystisplanctonica (Korshikov) Bourrelly, Oocystis spp.) wasalso important in these periods. This group was foundbetween surface and 4 m in July 2008. Also large thecatedinoflagellates (Peridinium cinctum (Muller) Ehrenberg,Peridiniopsis spp.) (codon Lo) were important componentsof phytoplankton. Their abundance was high near thesurface and decreased with increasing depth. In particular,they constituted 65% of the biomass in the surface watersat the first station, 31% at the second station and 20%at the third station in July 2007. Moreover, the benthiccyanobacterium Oscillatoria limosa Agardh ex Gomont(codon Tc) was only found in the deeper layers of the first
station and contributed the 38% of the total biomass inMay 2007.
Period III (Aug. 2007 and Sep.–Oct. 2007–2008): Theseperiods were characterized by the breaking down ofthe thermocline. As a consequence, in August 2007,an increase was observed in zmix/zeu values (>3.5).Thermocline disruption in September 2008 brought zmix/zeu values to 2.7. After this change in the underwater lightavailability, the dominance of shape-adapted species ofcodon P (A. granulata, A. subarctica) was observed bothin 2007 and 2008. This codon was replaced by codon J
(P. boryanum, Monactinus spp.) in September 2007 and bycodon B (S. neoastraea) in October 2008. In August 2007,the abundance of codon P increased along with depth.Members of codon Lo (P. cinctum and Entzia acuta(Apstein) Lebour) were also abundant (17–34 % of thetotal biomass) at 2 m in the riverine and transition zonesand at 5 m in the lacustrine station in September andOctober 2008.
Environmental parameters and phytoplankton FGs
To analyze the relationship between phytoplanktondistribution and environmental variables, we performed aRDA using biomass values of the nine dominant FGs.RDA was performed initially on the whole environmentaland FGs datasets. Forward selection indicated that four ofthe 12 environmental variables made significant contribu-tion to the variance in the FGs data. The results of RDAusing only these four variables are illustrated (Fig. 6). Theeigenvalues of RDA axis 1 (0.38) and axis 2 (0.04), accountfor 41.8% of the cumulative variance in the FGs data. TheFGs – environmental correlations of RDA axis 1 and 2 arehigh and the first two axis account for 94.4% of thevariance in the FGs – environmental relationships. PeriodI is positively correlated with Y, B, C, X2, zmix/zeu andSRP, while Period II is positively correlated with Tc, F,J, Lo, temperature and DIN. Period III is positivelycorrelated with J, Lo, P, temperature and zmix/zeu.
Discussion
Reservoirs in the Mediterranean area are regulatedsystems constructed to provide water for drinking and
Table 2. Pearson’s correlation coefficients between selectedenvironmental variables and, biomass and species richness
(*P<0.05; **P<0.01).
Biomass Species richness
zmix/zeu x0066 (n=72) x034**(n=72)Temperature 0.42** (n=528) 0.67** (n=528)Dissolved inorganic nitrogen 0.15** (n=288) 0.22* (n=288)Soluble reactive phosphorus 0.11* (n=288) 0.36** (n=288)
Table 1. The mean, minimum and maximum values of physical and chemical variables measured at the sampling sites in the
Ikizcetepeler reservoir water during the study period.
Variable
Station 1 Station 2 Station 3
Mean Min.–Max. Mean Min.–Max. Mean Min.–Max.Water temperature ( xC) 15.8 5.1–26.3 15.8 4.8–26.5 15.9 4.7–26.8pH 8.72 7.43–9.9 8.74 7.12–9.89 8.79 7.1–9.86Conductivity (mS.cmx1) 338 244–403 337 245–401 338 247–399Redox potential (mV) 104.8 x19.2–205.8 102.3 x21.8–199 104.4 x28.9–202.3Secchi disc (cm) 153.9 70–360 162.5 80–365 177 90–410Zmix/Zeu 1.52 0.56–3.11 2.11 0.77–3.89 2.89 0.66–6.17Dissolved inorganic nitrogen (mg.Lx1) 0.18 0.1–0.26 0.17 0.09–0.25 0.19 0.09–0.31Soluble reactive phosphorus (mg.Lx1) 0.025 0.01–0.05 0.02 0.02–0.05 0.02 0.006–0.06
Tugba Ongun Sevindik et al.: Ann. Limnol. - Int. J. Lim. 53 (2017) 129–141 133
irrigation during the summer dry periods, which char-acterize Mediterranean climate (Naselli-Flores, 2014).Their (over-)exploitation during summer when precipita-tion is scarce, reduce water level, which in turns, alterthe physical structure of lakes, disrupting stratificationpatterns (Rimmer et al., 2011). Ikizcetepeler reservoir is awarm monomictic Mediterranean lake, used for irrigationand providing drinking water to Bal�kesir city. Dependingon the water demand and summer drought, its depthquickly decreases during summer, and consequently
midsummer breakdown in the thermocline is observed. Inthe studied period, the breaking down of the thermoclinewas followed by a consistent increase in zmix/zeu. Theeffects of zmix/zeu ratio on phytoplankton assemblageswere reported in Mediterranean region (Naselli-Floresand Barone, 1998, 2000, 2007; Naselli-Flores, 2000;Hoyer et al., 2009; Becker et al., 2010). The ratio is agood descriptor of the underwater light climate experi-enced by phytoplankton and its values can be related tothe morphological structure of phytoplankton assemblage,
Fig. 3. Spatial and temporal variations of phytoplankton biomass (mg.Lx1) in the Ikizcetepeler reservoir.
Tugba Ongun Sevindik et al.: Ann. Limnol. - Int. J. Lim. 53 (2017) 129–141134

especially in the upper part of the trophic spectrum(Naselli-Flores, 2000; Naselli-Flores and Barone, 2007).The influence of nutrients on the structure of phytoplank-ton appears to be more important in the lower part ofthe trophic spectrum (Naselli-Flores and Barone, 1998;Naselli-Flores, 2000).
Morphological features of shape and size representthe starting point to fully understand the relationshipsbetween phytoplankton and its environment (Naselli-Flores and Barone, 2011). Nutrients (e.g., Kagami and
Urabe, 2001) and light availability (e.g., O’Farrell et al.,2007) are the most important factors promoting a shapevariation in the dominant morphology of phytoplankton(Naselli-Flores and Barone, 2007). In particular, eutrophicand hypertrophic conditions offer a good opportunity toinvestigate the effect of light availability since nutrientlimitation is unlike to occur. Moreover, elongated shapesand buoyant cyanobacteria were most common in thoseenvironments characterized by stronger light limitation,as already reported for other Mediterranean reservoirs(Naselli-Flores and Barone, 2007; Naselli-Flores, 2014).On the other hand, as shown by Morabito et al. (2007),efficiency in nutrient uptake is largely depends on S/V(surface/volume) ratio. High values of this ratio are com-mon in small-sized organisms and are generally related toa better nutrient flux per unit volume. Thus, efficiency innutrient uptake is a major force shaping phytoplanktonmorphology in oligotrophic and mesotrophic environ-ments (Naselli-Flores et al., 2007). In Mediterraneanreservoirs, generally, the CpSpR successional patternwas observed among phytoplankton assemblage (Padisaket al., 2010; Rigosi and Rueda, 2012). In the higher part ofthe trophic spectrum, this succession pattern was obvious,where zmix/zeu<3.5 (Naselli-Flores, 2014). In mesotrophicIkizcetepeler reservoir, changes in zmix/zeu regulatedthis successional pattern, whereas high zmix/zeu selected Cand R strategists and low zmix/zeu selected S strategists.Although this pattern was recorded during the studyperiod, C strategists (especially diatom S. neoastraea andcryptophytes C. ovata and C. caudata) were almost alwayspresent. This was also observed in other mesotrophicMediterranean reservoirs, whereas C-strategists Cyclotellaspp. was typical representatives of the assemblages(Caputo et al., 2008; Celekli and Ozturk, 2014).
Considering the concentrations of dissolved nutrientsand the algal requirements based on half-saturations forgrowth, phytoplankton in the studied reservoir did notexperience nutrient limitation since the values were alwaysabove the required levels for phytoplankton growth satur-ation (Reynolds, 1997). However, RDA analysis supportsthe importance of DIN and SRP for phytoplanktonassemblages. Particularly, hypolimnetic SRP concentra-tions were always high and allegedly due to the internalloading. Similar patterns were observed in Lake Kinneret(Hambright et al., 2004) and Lake Arancio (Naselli-Flores, 2014). Biomass and species richness also increasedin parallel with the increase in temperature, DIN and SRPvalues. Especially, biomass values of 2007 were higherthan values of 2008, as a result of higher values of DIN in2007. In May 2008, the highest phytoplankton biomassvalues were recorded due to an increase of C. ovata andmainly concentrated between 5 and 10 m. The maximumbiomass of cryptophytes occupied deeper depths, as wealso observed, where their low light requirement is satisfied(Graham and Wilcox, 2000; Ptacnik et al., 2003; Longhiand Beisner, 2009).
Lakes and reservoirs with euphotic depth almostequal to mixing depth are generally characterized by aDCM (deep chlorophyll maximum) and phytoplankton
Fig. 4.Relative contribution to total biomass of the three survival
strategies of phytoplankton (C, S, R) in the three sampling sites.
Tugba Ongun Sevindik et al.: Ann. Limnol. - Int. J. Lim. 53 (2017) 129–141 135

taxonomic groups (chlorophytes, cryptophytes and dia-toms) in such systems show heterogeneous verticaldistribution patterns (Effler and O’Donnell, 2001;Hamilton et al., 2010). On the other hand, more turbidones where mixing depth deeper than euphotic depth, pro-moted the aggregates of positively buoyant cyanobacteria
in the upper layers of the water column (Moreno-Ostoset al., 2006). Moreover, Longhi and Beisner (2009)suggested that vertical variation of phytoplankton taxo-nomic groups was related mainly to epilimnetic watercolor and total phosphorus concentration. They observedthat darker lakes with more stained waters have more
Fig. 5. Relative frequency of dominant phytoplankton FGs (%) along the vertical gradients in the three sampling sites. Dark areaindicates the bottom.
Tugba Ongun Sevindik et al.: Ann. Limnol. - Int. J. Lim. 53 (2017) 129–141136

stable water columns. These studies revealed that deep lakesand reservoirs in the lower part of the trophic spectrumneed a higher sampling effort compared with morpho-metrically similar eutrophic and hypertrophic waterbodies, where sub-superficial samples may be considered
representative of the structure of the whole phytoplanktonassemblage. Phytoplankton vertical heterogeneity hasoften been undervalued as it was expressed only as the bulkchlorophyll a concentration, total biomass or phytoplank-ton taxonomic groups (Longhi and Beisner, 2009;
Table 3. Main species and morphology-based phytoplankton groups in the three periods of the Ikizcetepeler reservoir.
Periods Dominant taxa Accompanying taxaMorphology-based(for dominant taxa) Zmix/Zeu (mean)
Period I
Stephanodiscus neoastraea (B)Lindavia ocellata (B)
Cryptomonas ovata (Y)Cryptomonas caudata (Y)
Cyclotella meneghiniana (C)Cryptomonas pyrenoidifera (X2)Plagioselmis nannoplanctica (X2)
C-strategists 2.39
Period II
S. neoastraea (B)Scenedesmus ellipticus (J)
Pseudopediastrum boryanum (J)Desmodesmus spp. (J)Monactinus spp. (J)
Coelastrum astroideum (J)
Sphaerocystis planctonica (F)Oocystis spp. (F)
Peridinium cinctum (Lo)Peridiniopsis spp. (Lo)Oscillatoria limosa (Tc)
C- and S-strategists 1.46
Period III
P. boryanum (J)Monactinus spp. (J)A. granulata (P)A. subarctica (P)S. neoastraea (B)
P. cinctum (Lo)Entzia acuta (Lo)
C-, S- and R-strategists 2.76
Fig. 6. Ordination of the samples corresponding to the different sampling periods, scores of phytoplankton biomass by FGs andenvironmental variables, along the redundancy analysis axes. Environmental variables: T, water temperature; SRP, soluble reactivephosphorus; DIN, dissolved inorganic nitrogen; zmix/zeu, ratio of mixing and euphotic layers. Sampling periods: first character
corresponds to sampling months and years, and subsequent ones to stations (red, Period I; blue, Period II; green, Period III).
Tugba Ongun Sevindik et al.: Ann. Limnol. - Int. J. Lim. 53 (2017) 129–141 137
Hamilton et al., 2010). Previously, Becker et al. (2009b)showed diel variation of phytoplankton FGs in a tropicalreservoir during stratification period; however, long-termvertical variation of FGs was ignored. Even thoughCrossetti and Bicudo (2008) considered five differentdepths in a long-term period, their study mainly focusedon three different water phases during 7 years, rather thanthe vertical variation of FGs. In this respect, our resultsprovide evidence on vertical heterogeneous distributionof phytoplankton FGs in mesotrophic Mediterraneanreservoir, allowing for a deeper understanding of the roleof different groups in such systems.
Generally, vertical heterogeneity of FGs J, F, Tc, Loand B was observed as a result of vertical heterogeneity ofwater temperature, high values of DIN in surface waters,low values of zmix/zeu and cell sedimentation loss duringstratification period. These results revealed that phyto-plankton showed the most pronounced vertical hetero-geneity during stratification. Previous studies also haveshown that the thermal structure of the water columnshould influence vertical distribution of phytoplankton byaffecting the average light environment, nutrient avail-ability and cell sedimentation loss (Reynolds, 1984; Diehlet al., 2002; Longhi and Beisner, 2009). Although theresults showed SRP values were higher in the bottomlayers in June and July 2007, there was no effect on thevertical heterogeneity of FGs. Groups J, F, Tc andLo include organisms (S-strategists), mainly representedby colonial chlorophytes, dinoflagellates and filamentouscyanobacteria. Consistently with theoretical patterns,O’Farrell et al. (2007) found a prevalence of small uni-cellular, non-flagellated organisms, thin filaments or smalltabular colonies in light limited environments, whereasflagellated forms and larger organisms prevailed in wellilluminated ones. Increased dimensions of Chlorophyta inmesotrophic environments, where the light limitation isnot severe, may allow more rapid movements in the watercolumn to optimize nutrient exploitation. In a study of45 lakes in eastern Canada, chlorophytes showed theshallowest average peak depth and the most heteroge-neous distribution of all groups and their heterogeneitywere greatest in lakes with clear, unproductive transparentwaters (Longhi and Beisner, 2009). Becker et al. (2009b)also found the dominance of codon F in the epilimnion ofstratified meso-eutrophic reservoir. Similar results wereobserved in our study: coda F and J mainly dominatedabove 5 m where high DIN and low zmix/zeu values wereobserved. With regard to large dinoflagellates (codon Lo),they were found near the surface in the stratificationperiod. Reynolds et al. (2002) stated that members oflarge dinoflagellates (codon Lo) are usually found insummer epilimnia in mesotrophic lakes with segregatednutrients and without prolonged or deep mixing. Theyexhibit motility, which enables them to maintain theirposition through the water column to suffice lightrequirements (Naselli-Flores and Barone, 2000). Darabaand Miron (2006) found that the density of O. limosa wasminimum at 12:00 a.m. due to the high quantity of light inthe study of Potoci Gulf – Bicaz Lake. Reynolds (1997)
also stated that Oscillatoriales were typical of very turbidenvironments and low light conditions. In our study, theS-strategist O. limosa (codon Tc) was only found in thedeeper parts of the reservoir at very low light conditions.During stratification, only the C-strategist S. neoastraea(codon B) showed a heterogeneous vertical distribution.Biomass of this group increased between 5 and 10 m inAugust 2008, and disappeared when the mixing eventcaused zmix/zeu<2. Similar results were reported frommeso-oligotrophic reservoirs where diatom species occu-pied deeper depth when stratification became stronger(Moreno-Ostos et al., 2006). Since diatoms cannot activelyregulate their position in the water column, they tend tosink under calm conditions. As a consequence, codon B
aggregate on the metalimnion in well-stratified waters,where the denser layer of water slows down their sinking(Reynolds, 1984).
Vertical heterogeneity of phytoplankton was alsoobserved during mixing in the FGs Lo, P and Y.Members of codon Y were found below 1 m betweenDecember 2007 and February 2008, probably because ofthe higher light availability in winter season. In August2007, after the disruption of the thermocline and theoccurrence of higher zmix/zeu, the abundance of codon P
increased with increasing depth. Their elongated shapeand shade adaptations (Silva et al., 2005) are actuallyuseful for their survival in darker conditions. This kind ofdiatom-dominated deep maxima was also observed inother temperate lakes (Fahnenstiel and Glime, 1983;Barbiero and Tuchman, 2001; Camacho et al., 2001).With regard to codon Lo, they were abundant between 2and 5 m in September and October 2008. Huszar et al.(2003) indicated that decreasing temperature and deepen-ing of mixing zone are unfavorable for Lo dominance;however, the relatively high temperature recorded in thosemonths in the studied reservoir may favor their highbiomass values.
Conclusion
In conclusion, nutrient dynamics, temperature andlight availability were mainly driven by the water circula-tion patterns, governing the phytoplankton morphologicalvariability (CpSpR) in Ikizcetepeler reservoir. Nutrientavailability and temperature constituted the main environ-mental constraints influencing phytoplankton dynamics,while zmix/zeuratio played a secondary role. A similarconclusion for mesotrophic lakes was achieved by Naselli-Flores (2000) by studying 21 Sicilian man-made lakes.Despite the variations in zmix/zeu ratio as a result ofstratification versus mixing events and water withdrawal,C-strategists were typical representatives of phytoplank-ton assemblage.
Similar to temporal distribution, vertical heterogeneityof phytoplankton was affected by nutrients (especiallyDIN values), temperature and zmix/zeu values, which weremainly driven by the water circulation pattern. This studyindicates that mixing and trophic state influence
Tugba Ongun Sevindik et al.: Ann. Limnol. - Int. J. Lim. 53 (2017) 129–141138
phytoplankton FG distribution throughout the entirewater column and confirms our hypothesis.
Acknowledgements. The authors would like to thank Bal�kesirUniversity Research Foundation for financially supporting thisresearch (Project number: 2007/18).
References
Albay M. and Akcaalan R., 2003. Factors influencing thephytoplankton steady state assemblages in a drinking-waterreservoir (Omerli reservoir, Istanbul). Hydrobiologia, 502,85–95.
Barbiero R.M. and Tuchman M.L., 2001. Results fromthe EPA’s biological open waters surveillance program ofthe Lauretian Great Lakes. II. Deep chlorophyll maxima.J. Great Lakes Res., 27, 155–166.
Becker V., Huszar V.L.M. and Crossetti L.O., 2009a. Responsesof phytoplankton functional groups to the mixing regime ina deep subtropical reservoir. Hydrobiologia, 628, 137–151.
Becker V., Cardoso L.S. and Huszar V.L.M., 2009b. Dielvariation of phytoplankton functional groups in a subtropi-cal reservoir in southern Brazil during an autumnal stratifica-tion period. Aquat. Ecol., 43, 2285–2293.
Becker V., Caputo L., Ordonez J., Marce R., Armengol J.,Crossetti L.O. and Huszar V.L., 2010. Driving factors of thephytoplankton functional groups in a deep Mediterraneanreservoir. Water Res., 44, 3345–3354.
Borges P.A.F., Train S. and Rodrigues L.C., 2008. Spatial andtemporal variation of phytoplankton in two subtropicalBrazilian reservoirs. Hydrobiologia, 607, 63–74.
Camacho A., Erez J., Chicote A., Florin M., Squires M.M.,Lehmann C. and Bachofen R., 2001. Microbial microstrati-fication, inorganic carbon photoassimilation and darkcarbon fixation at the chemocline of the meromictic LakeCadagno (Switzerland) and its relevance to the food web.Aquat. Sci., 63, 91–106.
Caputo L., Naselli-Flores L., Ordonez J. and Armengol J., 2008.Phytoplankton distribution along trophic gradients withinand among reservoirs in Catalonia (Spain). Freshwat. Biol.,53, 2543–2556.
Carlson R.E., 1977. A trophic state index for lakes. Limnol.Oceanogr., 22, 361–369.
Cole G.A., 1994. Textbook of Limnology, Waveland Press,Prospect Heights, Illinois.
Crossetti L.O. and Bicudo C.E.M., 2008. Phytoplankton as amonitoring tool in a tropical urban shallow reservoir (GarcasPond): the assemblage index application.Hydrobiologia, 610,161–173.
Celekli A. and Ozturk B., 2014. Determination of ecologicalstatus and ecological preferences of phytoplanktonusing multivariate approach in a Mediterranean reservoir.Hydrobiologia, 740, 115–135. doi: 10.1007/s10750-014-1948-8.
Celik K. and Sevindik T.O., 2011. The vertical and seasonaldistribution of chlorophyll and main nutrients in aMesotrophic Freshwater Reservoir. Int. J. Environ. Prot., 1,9–14.
Daraba O.M. and Miron I., 2006. Nictemeral structure anddynamics of the phytoplankton in the Potoci Gulf–Bicaz
Lake. Analele Stiintifice ale Universitatii “AL. I. CUZA” Iasi,s. Biologie animala, 52, 53–58.
Diehl S., Berger S., Ptacnik R. and Wild A., 2002.Phytoplankton, light, and nutrients in a gradient of mixingdepths: field experiments. Ecology, 83, 399–411.
Effler S.E. and O’Donnell D.M., 2001. Resolution of spatialpatterns in three reservoirs with rapid profiling instrumenta-tion. Hydrobiologia, 450, 197–208.
Fahnenstiel G.L. and Glime J.M., 1983. Subsurface chlorophyllmaximum and associated Cyclotella pulse in Lake Superior.Internationale Revue der Gesamten Hydrobiologie undHydrographie, 68, 605–616.
Fonseca B.M. and Bicudo C.E.M., 2008. Phytoplanktonseasonal variation in a shallow stratified eutrophicreservoir (Garcas Pond, Brazil). Hydrobiologia, 600,267–282.
Graham L.E. and Wilcox L.W., 2000. Algae, Prentice-Hall Inc.,NJ.
Guiry M.D. and Guiry G.M., 2016. AlgaeBase. World-wideelectronic publication, National University of Ireland,Galway. Accessed online 22 July 2016, http://www.algaebase.org
Hambright K.D., Eckert W., Leavitt P.R. and Schelske C.L.,2004. Effects of historical lake level and land use on sedimentand phosphorus accumulation rates in Lake Kinneret.Environ. Sci. Technol., 38, 6460–6467.
Hamilton D.P., O’Brien K.R., Burford M.A., Brookes J.D.and McBride C.G., 2010. Vertical distributions of chloro-phyll in deep, warm monomictic lakes. Aquat. Sci., 72,295–307.
Hoyer A.B., Moreno-Ostos E., Vidal J., Blanco J.M., Palomino-Torres R.L., Basanta A., Escot C. and Rueda F.J., 2009. Theinfluence of external perturbations on the functional compo-sition of phytoplankton in a Mediterranean reservoir.Hydrobiologia, 636, 49–64.
Huszar V.L.M., Kruk C. and Caraco N., 2003. Steady-stateassemblages of phytoplankton in four temperate lakes (NEUSA). Hydrobiologia, 502, 97–109.
ICOLD, 2007. Dams and the World’s Water, an EducationalBook that Explains How Dams Help to Manage the World’sWater, VFC, Levallois-Perret-France.
Jensen P., Jeppesen E., Olrik K. and Kristensen P., 1994. Impactof nutrients and physical factors on the shift from cyano-bacterial to chlorophyte dominance in shallow Danish lakes.Can. J. Fish. Aquat. Sci., 51, 1692–1699.
Kagami M. and Urabe J., 2001. Phytoplankton growth rate as afunction of cell size: an experimental test in Lake Biwa.Limnology, 2, 111–117.
Karadzic V., Subakov-Simic G., Krizmanic J. and Natic D.,2010. Phytoplankton and eutrophication development in thewater supply reservoirs Garasi and Bukulja (Serbia).Desalination, 255, 91–96.
Lindholm T., 1992. Ecological role of depth maxima ofphytoplankton. Archiv fur Hydrobiologie–BeiheftErgebnisseder Limnologie, 35, 33–45.
Longhi M.L. and Beisner B.E., 2009. Environmental factorscontrolling the vertical distribution of phytoplankton inlakes. J. Plankton Res., 31, 1195–1207. doi: 10.1093/plankt/fbp065.
Morabito G., Oggioni A., Caravati E. and Panzani P.,2007. Seasonal morphological plasticity of phytoplanktonin Lago Maggiore (N. Italy). Hydrobiologia, 578, 47–57.
Tugba Ongun Sevindik et al.: Ann. Limnol. - Int. J. Lim. 53 (2017) 129–141 139

Moreno-Ostos E., Cruz-Pizarro L., Basanta-Alves A., Escot C.and George D.G., 2006. Algae in the motion: spatialdistribution of phytoplankton in thermally stratified reser-voirs. Limnetica, 25, 205–216.
Naselli-Flores L., 2000. Phytoplankton assemblages in twen-ty-one Sicilian reservoirs: relationships between speciescomposition and environmental factors. Hydrobiologia, 424,1–11.
Naselli-Flores L., 2014. Morphological analysis of phyto-plankton as a tool to assess ecological state of aquaticecosystems: the case of Lake Arancio, Sicily, Italy. InlandWaters, 4, 15–26.
Naselli-Flores L. and Barone R., 1998. Phytoplanktondynamics in two reservoirs with different trophic state (LakeRosamarina and Lake Arancio, Sicily, Italy). Hydrobiologia,369/370, 163–178.
Naselli-Flores L. and Barone R., 2000. Phytoplankton dynamicsand structure: a comparative analysis in natural and man-made water bodies of different trophic state. Hydrobiologia,438, 65–74.
Naselli-Flores L. and Barone R., 2007. Pluriannual morpholo-gical variability of phytoplankton in a highly productiveMediterranean reservoir (Lake Arancio, SouthwesternSicily). Hydrobiologia, 578, 87–95.
Naselli-Flores L. and Barone R., 2011. Fight on plankton! Or,phytoplankton shape and size as adaptive tools toget ahead in the struggle for life. Cryptogamie Algol., 32,157–204.
Naselli-Flores L., Padisak J. and Albay M., 2007. Shape and sizein phytoplankton ecology: do they matter? Hydrobiologia,578, 157–161.
OECD (Organization for Economic Cooperationand Development), 1982. Eutrophication of waters.Monitoring, assessment and control. Final Report. OECDCooperative Programme on Monitoring of Inland Waters(Eutrophication Control), Environment Directorate, OECD,Paris.
O’Farrell I., Izaguirre I. and de Tezanos Pinto P., 2007.Phytoplankton morphological response to the underwaterlight conditions in a vegetated wetland. Hydrobiologia, 578,65–77.
Padisak J., Grigorszky I., Borics G. and Soroczki-Pinter E.,2006. Use of phytoplankton assemblages for monitor-ing ecological status of lakes within the WaterFramework Directive: the assemblage index. Hydrobiologia,553, 1–14.
Padisak J., Crossetti L.O. and Naselli-Flores L., 2009. Use andmisuse in the application of the phytoplankton functionalclassification: a critical review with updates. Hydrobiologia,621, 1–19.
Padisak J., Hajnal E., Naselli-Flores L., Dokulil M.T., Noges P.and Zohary T., 2010. Convergence and divergence inorganization of phytoplankton communities under variousregimes of physical and biological control. Hydrobiologia,639, 205–220.
Ptacnik R., Diehl S. and Berger S., 2003. Performance of sinkingand nonsinking phytoplankton taxa in a gradient of mixingdepths. Limnol. Oceanogr., 48, 1903–1912.
Rangel L.M., Silva L.H., Rosa P., Roland F. and Huszar V.L.,2012. Phytoplankton biomass is mainly controlled byhydrology and phosphorus concentrations in tropical hydro-electric reservoirs. Hydrobiologia, 693, 13–28.
Reynolds C.S., 1984. The Ecology of Freshwater Phytoplankton,Cambridge University Press, Cambridge, UK.
Reynolds C.S., 1997. Vegetation Process in the Pelagic:A Model for Ecosystem Theory, –Ecology Institute,Oldendorf, Luhe.
Reynolds C.S., 2006. The Ecology of Phytoplankton, CambridgeUniversity Press, Cambridge, UK.
Reynolds C.S., Huszar V.L.M., Kruk C., Nasseli-Flores L.and Melo S., 2002. Towards a functional classificationof the freshwater phytoplankton. J. Plankton Res., 24,417–428.
Rigosi A. and Rueda F.J., 2012. Hydraulic control of short-termsuccessional changes in the phytoplankton assemblage instratified reservoirs. Ecol. Eng., 44, 216–226.
Rimmer A., Gal G., Opher T., Lechinsky Y. and Yacobi Y.,2011. Mechanisms of long-term variations in thethermal structure of a warm lake. Limnol. Oceanogr., 56,974–988.
Rychtecky P. and Znachor P., 2011. Spatial heterogeneity andseasonal succession of phytoplankton along the longitudinalgradient in a eutrophic reservoir. Hydrobiologia, 663,175–186.
Salmaso N., Naselli-Flores L. and Padisak J., 2015. Functionalclassifications and their application in phytoplanktonecology. Freshwat. Biol., 60, 603–619. doi: 10.1111/fwb.12520.
Serra T., Granata T., Colomer J., Stips A., Møhlenberg F. andCasamitjana X., 2003. The role of advection and turbulentmixing in the vertical distribution of phytoplankton. Estuar.Coast Shelf Sci., 56, 53–62.
Sevindik T.O. and Celik K., 2012. Phytoplankton composition ofIkizcetepeler Reservoir, Bal�kesir-Turkey. OT SistematikBotanik Dergisi, 19, 105–124.
Sevindik T.O., Celik K. and Gonulol A., 2011. Twenty newrecords for Turkish freshwater algal flora from Caygoren andIkizcetepeler Reservoirs (Bal�kesir, Turkey). Turk. J. Fish.Aquat. Sci., 11, 399–406.
Silva C.A., Train S. and Rodrigues L., 2005. Phytoplanktonassemblages in a Brazilian subtropical cascading reservoirsystem. Hydrobiologia, 537, 99–109.
State Water Works, 2005. Manyas Project, 25th RegionalBranch, Bal�kesir, Turkey.
Strickland J.D.H. and Parsons T.R., 1972. A practical handbookof seawater analysis (2nd edn), Bulletin of the FisheriesResearch Board of Canada No. 167, Alger Press Ltd.,Ottawa.
Sun J. and Liu D., 2003. Geometric models for calculating cellbiovolume and surface area for phytoplankton. J. PlanktonRes., 25, 1331–1346.
Technicon Industrial Methods, 1977a. Nitrate and nitrite inwater and wastewater. No. 158–71, W/A.
Technicon Industrial Methods, 1977b. Phosphate and silicateanalysis in water and seawater. No. 253–280 E. Applicationnote, UK.
Ter Braak C.J.F. and Smilauer P., 2002. CANOCO ReferenceManual and CanoDraw for Windows user’s Guide: Softwarefor Canonical Community Ordination (version 4.5),Microcomputer Power, Ithaca (NY, USA).
Tremblay J.E., Klein B., Legendre L., Rivkin R.B. andTherriault J.C., 1997. Estimation of f-ratios in oceans basedon phytoplankton size structure. Limnol. Oceanogr., 42,595–601.
Tugba Ongun Sevindik et al.: Ann. Limnol. - Int. J. Lim. 53 (2017) 129–141140

Turkish Ministry of Environment and Forestry, 2007. TheEnvironmental Report for the City of Bal�kesir. TechnicalReport No. 2007/10. Turkish Ministry of Environment andForestry, Ankara, Turkey.
Utermohl H., 1958. Zur Vervollkommnung der quantitativenPhytoplankton Methodik. Mitteilung InternationaleVereinigung fuer Theoretische und Amgewandte Limnologie,9, 1–38.
Wetzel R.G. and Likens G.E., 2000. Limnological Analysis,Springer, New York.
Xiao L.J., Wang T., Hu R., Han B.P., Wang S., Qian X. andPadisak J., 2011. Succession of phytoplankton functionalgroups regulated by monsoonal hydrology in a large canyon-shaped reservoir. Water Res., 45, 5099–5109.
Zarfl C., Lumsdon A.E., Berlekamp I., Tydecks L. andTockner K., 2015. Aquat. Sci., 77, 161–170.
Tugba Ongun Sevindik et al.: Ann. Limnol. - Int. J. Lim. 53 (2017) 129–141 141