spatial decision support system for identifying priority sites for
TRANSCRIPT
405
Spatial Decision Support System for Identifying Priority Sites for Watershed Management Schemes Jagarlapudi Adinarayana
Abstract In the context of rural India, planning mainly consists of distribution of resources through various government-sponsored watershed management schemes, which are implemented by sectoral institutions in the district. A conceptual framework and a spatial decision support system for rural land use planning (SDSS/LUP) have been developed for supporting decision making on area selection for different watershed management schemes for conservation planning. SDSS/LUP is also intended to provide suggestions and hazard warnings for land use sustainability by combining data from the existing sources. The paper also discusses future national level Web decision support system for rural land use planning. Keywords: conservation planning, geographical information systems, remote sensing, spatial decision support system, watershed management schemes Introduction Rural land use planning in India mainly employs prescriptive planning on a watershed basis through various mandated schemes, which are financed by the state or central government and implemented by sectoral institutions (top-down). Each scheme has a set of policies that are defined by the legislation. Under these watershed management schemes, planners at the district/sub-district level need to identify priority watershed/sub-watersheds for preferential treatments/land use plans.
Adinarayana is a Research Scientist, Centre of Studies in Resources Engineering, Indian Institute of Technology-Bombay, Powai, Mumbai – 400 076, India. E-mail: [email protected].
The Natural Resources Data Management System (NRDMS) of the Department of Science & Technology, Government of India is a multi-disciplinary program that is developing decision support systems (DSS) for decentralized planning using GIS technology. Its immediate clients are district-level planners and professional staff of line departments engaged in rural development activities. Our attempt, as a part of the NRDMS Program, in the development of spatial decision support system (SDSS) is to draw together the natural resources data of sectoral agencies, process them to computer-compatible format and build up a database for watershed planning in an integral manner. Design Principles What decisions are to be supported? At the outset, a needs assessment was carried out amongst district-level staff to establish their requirements for spatial data. It proved difficult for them to articulate their needs but a number of specific requirements emerged from these discussions: Decision type A: Area selection for schemes A.1 Which are priority watersheds for interventions
by various line departments? A.2 Within a priority watershed, which sub-
watersheds should be treated first? A.3 Where, within a sub-watershed, are the hot-spots
requiring interventions? Decision type B: Site selection for infrastructure B.1 Where should small-scale conservation
infrastructure be built? B.2 Where should water resources infrastructure be
built or authorized?

406
Decision C: Land evaluation for changes in land use C.1 Economic options C.2 Conservation options C.3 Implemented options C.4 Radical options How are these decisions actually made? In the first instance, emphasis is given on selecting priority sites for conservation planning which will help the decision-makers to do their job more easily, accurately and consistently. Each scheme is bounded by government policies, which have social, economic and biophysical dimensions. Policy is enshrined in the directives that establish the scheme and these commonly lay down criteria for site selection. For example, the National Watershed Development Program for Rainfed Agriculture (NWDPRA) lays down four criteria: < 30 % area is irrigated; < 750 mm average rainfall; no other scheme have been implemented; and size of a watershed is between 5000 and 10000 ha. But site selection according to these criteria is not so straightforward as it might appear. The physical criteria actually reflect the political intention to benefit the disadvantaged. Also, the concept of a watershed is not strictly hydrological; there are no standard maps of watersheds or any standard method for delineating them. The SDSS approaches the problem stepwise. First, a topographical base is generated within the Geographical Information Systems (GIS) from 1:50000 scale Survey of India topographic sheets. The boundaries of hydrological watersheds are drawn manually to produce watersheds of the required size and these boundaries are digitized within the GIS. Within any watershed there will be some 20 sub-watersheds, each of about 500 ha, that may be considered the primary planning units because they are small enough for concerted intervention. They must be ranked in order of priority for intervention and in the absence of the SDSS, local field staff will recommend sub-watersheds – preferring those with a range of land types, so that many rural departments can be involved and those with the most severe physical and social problems. The SDSS adopts explicit criteria: degree to which sub-watershed satisfies the objectives of a particular scheme; actual problems with productivity due to erosion or other degradation processes (on-site
effects); sediment delivery to reservoirs (off-site effects); extent of degraded land; and multi-criteria evaluation based on all of the above. Using NDWPRA selection criteria The sub-watersheds are prioritized according to decision rules formulated by NWDPRA. If the sub-watershed does not meet the minimum criteria (i.e. > 30 % irrigated area) it is rejected. Otherwise, the same criteria are used to rank sub-watersheds so that the less the proportion of irrigated land, the higher the priority. Interventions in the highest-priority sub-watershed should go furthest in satisfying policy objectives. By erosion intensity The sub-watersheds are prioritized according to the modeled intensity of erosion under present land use and management. Intervention in the highest-priority sub-watershed should result in the maximum reduction in erosion. The area of a sub-watershed is not considered. Instead, the decision-maker chooses sub-watersheds in order of their erosion intensity until the maximum area that can be treated is reached. Identification of hot-spots Once a sub-watershed is identified for intervention, the question arises as to which areas within the sub-watershed are most critical. The decision is supported by modeled erosion intensity for the individual polygons of the GIS. The SDSS presents a map of the sub-watershed with the more critical areas, overlain by the road and stream network and contours to help identify these areas on the ground. By sediment yield Sub-watersheds are prioritized according to the modeled sediment delivery to watercourses or reservoirs. Intervention in highest-priority sub-watershed should result in the maximum decline in sedimentation. By present land degradation status Sub-watersheds are prioritized according to their proportion of degraded land, which are identified with the help of Indian Remote Sensing Satellite (IRS)-IC/ID remotely sensed data. Intervention in the most degraded sub-watershed should result in the maximum proportional land reclamation but this is by no means the same thing as optimum return for the effort expended.
407
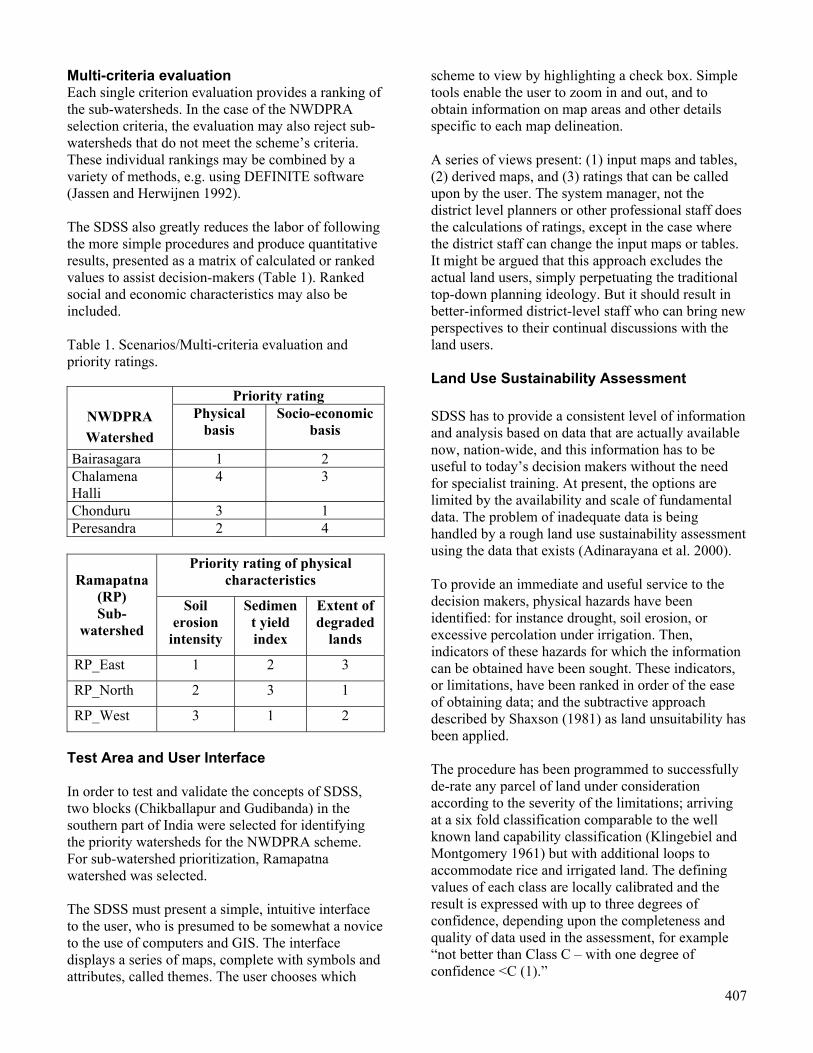
Multi-criteria evaluation Each single criterion evaluation provides a ranking of the sub-watersheds. In the case of the NWDPRA selection criteria, the evaluation may also reject sub-watersheds that do not meet the scheme’s criteria. These individual rankings may be combined by a variety of methods, e.g. using DEFINITE software (Jassen and Herwijnen 1992). The SDSS also greatly reduces the labor of following the more simple procedures and produce quantitative results, presented as a matrix of calculated or ranked values to assist decision-makers (Table 1). Ranked social and economic characteristics may also be included. Table 1. Scenarios/Multi-criteria evaluation and priority ratings.
Priority rating NWDPRA Watershed
Physical basis
Socio-economic basis
Bairasagara 1 2 Chalamena Halli
4 3
Chonduru 3 1 Peresandra 2 4
Priority rating of physical characteristics
Ramapatna
(RP) Sub-
watershed
Soil erosion
intensity
Sediment yield index
Extent of degraded
lands
RP_East 1 2 3
RP_North 2 3 1
RP_West 3 1 2
Test Area and User Interface In order to test and validate the concepts of SDSS, two blocks (Chikballapur and Gudibanda) in the southern part of India were selected for identifying the priority watersheds for the NWDPRA scheme. For sub-watershed prioritization, Ramapatna watershed was selected. The SDSS must present a simple, intuitive interface to the user, who is presumed to be somewhat a novice to the use of computers and GIS. The interface displays a series of maps, complete with symbols and attributes, called themes. The user chooses which
scheme to view by highlighting a check box. Simple tools enable the user to zoom in and out, and to obtain information on map areas and other details specific to each map delineation. A series of views present: (1) input maps and tables, (2) derived maps, and (3) ratings that can be called upon by the user. The system manager, not the district level planners or other professional staff does the calculations of ratings, except in the case where the district staff can change the input maps or tables. It might be argued that this approach excludes the actual land users, simply perpetuating the traditional top-down planning ideology. But it should result in better-informed district-level staff who can bring new perspectives to their continual discussions with the land users. Land Use Sustainability Assessment SDSS has to provide a consistent level of information and analysis based on data that are actually available now, nation-wide, and this information has to be useful to today’s decision makers without the need for specialist training. At present, the options are limited by the availability and scale of fundamental data. The problem of inadequate data is being handled by a rough land use sustainability assessment using the data that exists (Adinarayana et al. 2000). To provide an immediate and useful service to the decision makers, physical hazards have been identified: for instance drought, soil erosion, or excessive percolation under irrigation. Then, indicators of these hazards for which the information can be obtained have been sought. These indicators, or limitations, have been ranked in order of the ease of obtaining data; and the subtractive approach described by Shaxson (1981) as land unsuitability has been applied. The procedure has been programmed to successfully de-rate any parcel of land under consideration according to the severity of the limitations; arriving at a six fold classification comparable to the well known land capability classification (Klingebiel and Montgomery 1961) but with additional loops to accommodate rice and irrigated land. The defining values of each class are locally calibrated and the result is expressed with up to three degrees of confidence, depending upon the completeness and quality of data used in the assessment, for example “not better than Class C – with one degree of confidence <C (1).”
408
On the basis of the identification of hazards, district staff can design management packages to combat the threats to the sustainability of the desired land use, or recommend an alternative land use. In short, we are applying the threat identification and management concept outlined by Smith et al. (1999). Conclusions and Future Developments NRDMS centers are being set up in various districts in 10 Indian states. The decision support service that can be provided as of now meets the requirements specified during the needs assessment. As far as land evaluation is concerned, it is unsophisticated but it is robust and functions with the data that are actually available in every district in India. With a better database we can provide a better service, and a program to upgrade the database should begin with addition of the 10 m contour data (which are already held by the Survey of India) to the digitized topographic sheets. Good use can also be made of the more recent, high definition satellite imagery. A cut-down version of ALES (Rossiter and Van Wambeke 1997) can be added to the SDSS to provide a framework for land suitability evaluation for specific crops/land use types, including basic financial/economic analysis. SDSS/LUP addresses a single district only and is not sufficiently robust for the entire agricultural extension community to use for decision-making. Hence, it is proposed to develop a new Web based decision support system (DSS) for assisting the extension community in rural land use planning decision making.
Acknowledgments The research work forms a part of the UNDP/DST joint effort “GIS based technologies for local level development planning (IND/95/002).” The author wishes to thank the UNDP Consultants Dr. David Rossiter, ITC-Enschede, The Netherlands and Dr. David Dent, ISRIC- Wageningen, The Netherlands for their valuable guidance and suggestions on the approach. The author also wishes to acknowledge the support extended by departmental colleagues Dr. G. Venkataraman and Dr. S. Maitra, and sincerely appreciates the reviews of Dr. Xuan Zhu, NIE, Nanyang Technological University, Singapore. References Adinarayana, J., S. Maitra, and David Dent 2000. A spatial decision support system for land use planning at district level in India. The Land 4(2):111-130. Janssen, R., and M. van Herwijnene. 1992. DEFINITE: Decisions on a Finite Set of Alternatives. Kluwer Academic Publishers, Dordrecht. Klingebiel A.A., and P.H. Montgomery. 1961. Land capability classification. U.S. Department of Agriculture Handbook 210, Washington, DC. Rossiter D.G., and A. Van Wambeke. 1997. ALES Version 4, Users’ Manual, SCAC Teaching Series T93-2. Cornell University, Soil Crop and Atmospheric Sciences Department, Ithaca, NY. Shaxson, T.F. 1981. Determining erosion hazard and land use incapability: a rapid subtractive method. Soil Survey and Land Evaluation 1(3):44-50. Smith, C., R. Thwaites, and G. McDonald. 1999. TIM: Evaluating the sustainability of agricultural land management at the planning stage. The Land 3(1):21-38.