spain: financial stability assessment - imf ... · spain: financial stability assessment ... mimi...
TRANSCRIPT
© 2012 International Monetary Fund June 2012
IMF Country Report No. 12/137
Spain: Financial Stability Assessment This paper was prepared based on the information available at the time it was completed on May 30, 2012. The views expressed in this document are those of the staff team and do not necessarily reflect the views of the government of Spain or the Executive Board of the IMF. The policy of publication of staff reports and other documents by the IMF allows for the deletion of market-sensitive information.
Copies of this report are available to the public from
International Monetary Fund ● Publication Services 700 19th Street, N.W. ● Washington, D.C. 20431
Telephone: (202) 623-7430 ● Telefax: (202) 623-7201 E-mail: [email protected] ● Internet: http://www.imf.org
International Monetary Fund Washington, D.C.
INTERNATIONAL MONETARY FUND
SPAIN
Financial System Stability Assessment
Prepared by the Monetary and Capital Markets and European Departments
Approved by Christopher Towe and Reza Moghadam
May 30, 2012
This report summarizes the findings of the Financial Sector Assessment Program (FSAP) Update for Spain. The assessment involved two missions, February 1–21 and April 12–25, 2012. The team comprised Ceyla Pazarbasioglu (head), Li Lian Ong (deputy), Alessandro Giustiniani, Ana Carvajal, Sarah Kwoh, Fabiana Melo, Christine Sampic and Rodolfo Wehrhahn; Alessandro Gullo; Jerome Vacher; and the following IMF external consultants: Andreas Jobst, Göran Lind, Min Qi, Alfredo Bello, Mimi Ho, Malcolm Rodgers, and José Tuya. While there is a core of strong banks that are well-managed and appear resilient to further shocks, vulnerabilities remain. Substantial progress has been made in reforming the former savings banks, and the most vulnerable institutions have either been resolved or are being restructured. Recent measures address the most problematic part of banks’ portfolios (real estate developer loans). Going forward, a further restructuring and recapitalization of some of the remaining weaker banks may be needed as a result of deteriorating economic conditions. A major and much-needed restructuring of the banking system is underway. Full implementation of the reforms—including thorough independent valuations, a credible backstop, further restructuring of weaker banks, and dealing with legacy assets—as well as an effective communication strategy are critical for preserving financial stability and laying the ground for recovery. The assessment of the financial oversight framework identifies both strengths and weaknesses. Supervisory agencies have highly experienced and respected professional staff, and are supported by good information systems. However, a gradual approach in taking corrective action has allowed weak banks to continue to operate to the detriment of financial stability. The processes and the accountability framework for effective enforcement and bank resolution powers need to be improved.
FSAP assessments are designed to assess the stability of the financial system as a whole and not that of individual institutions. They have been developed to help countries identify and remedy weaknesses in their financial sector structure, thereby enhancing their resilience to macroeconomic shocks and cross-border contagion. FSAP assessments do not cover risks that are specific to individual institutions such as asset quality, operational or legal risks, or fraud.
2
Contents Page
Glossary .....................................................................................................................................4
Executive Summary ...................................................................................................................6
I. Introduction ..........................................................................................................................10
II. Risks and Vulnerabilities in the Banking Sector .................................................................11 A. The Condition of the Financial Sector ....................................................................13 B. Risks and Vulnerabilities ........................................................................................15 C. A Comprehensive Strategy to Address the Remaining Vulnerabilities ..................22
III. Strengthening the Supervision of the Financial Sector ......................................................24 A. Microprudential and Macroprudential Regulatory Infrastructure ...........................24 B. Assessment of the Oversight Framework ................................................................25 C. Regulation and Supervision of the Banking Sector ................................................26 D. Supervision of Financial Market Infrastructures ....................................................28 E. Supervision of the Insurance Sector ........................................................................29 F. Regulation of Securities Markets.............................................................................29
IV. Crisis Management and Resolution ...................................................................................30
V. Anti-Money Laundering and Combating the Financing of Terrorism (AML/CFT) ...........32 Tables 1. High Priority Recommendations..........................................................................................9 2. Main Economic Indicators .................................................................................................53 3. Support Measures for the Financial Sector ........................................................................54 4. Selected Financial Soundness Indicators for the Banking Sector ......................................55 5. Overview of Diagnostics and Stress Test Sample, as at End-2011 ...................................56 6. Bank Profitability and Financial Soundness ......................................................................57 7. Funding Liquidity Sources of the Banking Sector .............................................................58 8. Financial Soundness Indicators of the Non-banking Sectors ............................................59 9. Macroeconomic Scenarios for Solvency Stress Tests .......................................................60 10. Solvency Stress Test Results, with RDL 02/2012 and RDL 18/2012Impact ....................61 11. BdE Top Down Stress Test Results by Bank Grouping (Incorporating New Provisioning Requirements) ......................................................................................62 12. Joint Market-Implied Expected Losses Below ..................................................................63 13. Reverse Stress Tests of Liquidity Risk—5- and 30-Day Implied Cash Flow Analysis ....64 14. Liquidity Stress Test—Quasi-Basel III and Maturity Mismatch Analysis ........................65 Figures 1. Consolidation of the Banking Sector ...................................................................................8 2. Economic Developments ...................................................................................................41
3
3. Market Shares of Credit Institutions as of End-2010.........................................................42 4. Structure of the Financial Sector ........................................................................................43 5. Exposure of Credit Institutions to the Property Sector ......................................................43 6. Sovereign Debt...................................................................................................................44 7. Banking Sector Developments ...........................................................................................45 8. Financial Market Indicators ...............................................................................................46 9. Banks’ Plans for Complying with the Provisioning Requirements of Royal Decree Law 02/2012 ...............................................................................................47 10. Interest Rates and Household Loans ..................................................................................48 11. Macro Scenarios for the Solvency Stress Testing Exercise ...............................................49 12. Overview of the Spain FSAP Update Stress Testing Exercise ..........................................50 13. Banks’ Foreign Exposures .................................................................................................51 14. Structured Finance Market .................................................................................................52 Boxes 1. Sensitivity and Scenario Analyses of Household and Corporate Indebtedness .................33 2. Market Estimates of Bank Recapitalization Needs ............................................................36 3. Analysis of Spillover Risk into the Domestic Banking System ........................................37 4. Covered Bond Markets ......................................................................................................40 Appendices I. Risk Assessment Matrix .....................................................................................................66 II. Stress Test Matrices ...........................................................................................................68 III. Details of Solvency Stress Test Methodologies and Assumptions ....................................72 Appendix Tables 15. Summary of Banking Sector Stress Tests: Solvency Risks ...............................................68 16. Summary of Banking Sector Stress Tests: Detailed Assumptions for Testing Solvency
Risk ....................................................................................................................................69 17. Summary of Banking Sector Stress Tests: Liquidity Risk .................................................71 18. Impact of RDL 02/2012 and RDL 18/2012 on the Income Statement and Balance Sheet .....................................................................................................................73 19. Sovereign Debt Haircuts with Common Interest Rate Shock ...........................................76
4
GLOSSARY
AfS Available-for-Sale AMC Asset Management Company AML/CFT Anti-Money Laundering and Combating the Financing of Terrorism APS Asset Protection Schemes BBVA Banco Bilbao Vizcaya Argentaria BCBS Basel Committee on Banking Supervision BCP Basel Core Principles BdE Banco de España BIS The Bank for International Settlements BME Bolsas y Mercados Españoles CAR Capital Adequacy Ratio CCPs Central Counter Parties CDS Credit Default Swap CESFI Comité de Estabilidad Financiera CNMV Comisión Nacional del Mercado de Valores CPSS/IOSCO Committee on Payment and Settlement Systems/International
Organization of Securities Commissions DGSFP Dirección General de Seguros y Fondos de Pensiones EBA European Banking Authority ECB European Central Bank FAAF Fondo para la Adquisición de Activos Financieros FATF Financial Action Task Force FGD Fondo de Garantía de Depósitos FMIs Financial Market Infrastructures FROB Fondo de Reestructuración Ordenada Bancaria FSAP Financial Sector Assessment Program GDP Gross Domestic Product HSBC Hongkong and Shanghai Banking Corporation ICR Interest Coverage Ratio IMF International Monetary Fund LCR Liquidity Coverage Ratio LGD Loss-given-default LTD Loan-to-Deposit LTRO Long Term Refinancing Operation MBS Mortgage-backet Securities MdE Ministerio de Economía y Competitividad NPLs Nonperforming Loans NSFR Net Stable Funding Ratio PD Probability of Default RDL Royal Decree Law

5
RoA Return on Assets SCCA Systemic Contingent Claims Analysis SMEs Small and Medium-sized Enterprises TD Top-Down WEO World Economic Outlook
6
EXECUTIVE SUMMARY 1. The past four years have witnessed a crisis in the Spanish financial sector unprecedented in its modern history. While external factors contributed to the turmoil, a domestic real estate boom-bust exposed weaknesses in the savings bank sector, shortcomings in the policy and regulatory framework, and an over-reliance on wholesale funding.
2. A major and much-needed restructuring of the banking sector is now under way (Figure 1). This has involved an important reform of the savings banks’ legal framework together with financial support from the state-owned recapitalization vehicle Fondo de Reestructuración Ordenada Bancaria (FROB). Substantial progress has been made in addressing balance sheet weaknesses and recently announced measures show promise of further progress.
3. The team’s stress tests show that while the core of the system appears resilient, vulnerabilities remain. Although important caveats attach to the team’s assessment, including the extent to which lender forbearance—which the supervisory authorities have indicated they are monitoring closely—may have affected the underlying data and the risk of an even more severe downside shock than embodied in the analysis, the results suggest that:
The largest banks appear sufficiently capitalized and have strong profitability to withstand further deterioration of economic conditions. This reflects their solid capital buffers and the robust earnings of the internationally-diversified institutions.
There are a group of banks where vulnerabilities seem highest and where public support seems most critical. Most of these banks have been acquired by other solvent entities or are in varying stages of restructuring. Recently, the government committed to a capital injection of about 2 percent of GDP to the fourth largest bank (which will become state owned) to effectively support its restructuring.
Continued efforts are needed to rebuild capital buffers. Although liquidity positions have improved and European Central Bank (ECB) long-term funding brings a reprieve, Spanish banks need to continue to bolster their balance sheets to enable them to re-access private funding markets.
4. Recent measures aim to address these vulnerabilities and provide targeted support where needed. The May 2012 decision to increase sharply provisioning rates on performing real estate developer loans (from 7 percent to 30 percent) should provide adequate coverage for potential future losses of this portfolio, and banks that are highly capitalized and have limited real estate exposures are expected to be able to meet these requirements. Other banks that need additional time will be supported with a public capital backstop (injected either in the form of common equity or contingent capital).

7
5. Notwithstanding these measures, further restructuring of the weaker banks are likely to be needed. Although the most problematic part of banks’ portfolios—real estate developer loans—appear now to have been addressed, the extent and persistence of the macroeconomic deterioration may imply further losses in the rest of the loan portfolio. The authorities committed to undertaking a comprehensive review of banks’ asset portfolios, with third-party participation. This is a welcome step and should provide the basis for determining further restructuring needs. The experience of this FSAP and the announced restructuring of the fourth largest bank illustrates that stress tests can provide a useful indication of the magnitude of these needs, but should be supplemented by a more granular due diligence especially if public funds are to be used.
6. The full implementation of reforms, including a credible public backstop and an effective communication strategy, are critical for preserving financial stability. The authorities have pursued a strategy of burden sharing between the public and private sectors. Most recently, they have switched to greater reliance on public funding in order to avoid undermining viable banks. Going forward, it will be critical to communicate clearly the timetable for the diagnostic review, a strategy for providing a credible backstop for capital shortfalls, and a plan for dealing with impaired real estate exposures.
7. The assessment of the financial oversight framework identifies strengths and weaknesses. The supervisory agencies have highly experienced and respected professional staff, who are supported by good information systems and thorough supervisory processes. However, this assessment identified a number of shortcomings, especially a gradual approach in taking corrective action that allowed weak banks to continue to operate to the detriment of financial stability, and calls for steps in the following areas (Table 1):
Strengthening the authority and the processes, including the accountability framework, for the banking regulator to address preemptively the build-up of risks and take remedial action;
Enhancing the regulatory independence of the banking and securities regulators and addressing limitations on financial/budgetary independence for the insurance and securities regulators, while ensuring adequate accountability; and
Strengthening the regulatory framework for the insurance sector (the current solvency regime is not risk-sensitive) and the monitoring of risk build-up in the sector.
8. The conclusions above are necessarily tentative, given that the banking system strategy is still being formulated amid the wider spread of turmoil in Europe. The analysis provides a point-in-time assessment of current vulnerabilities and systemic resilience to a possible further deterioration in macroeconomic conditions. While this provides comfort regarding the direction of current policies, it is critical that the authorities continue to take decisive action to address the weaker institutions and restore market confidence in Spanish banks. Delays could exacerbate the macroeconomic downturn, erode market confidence, and damage stability more broadly.
8
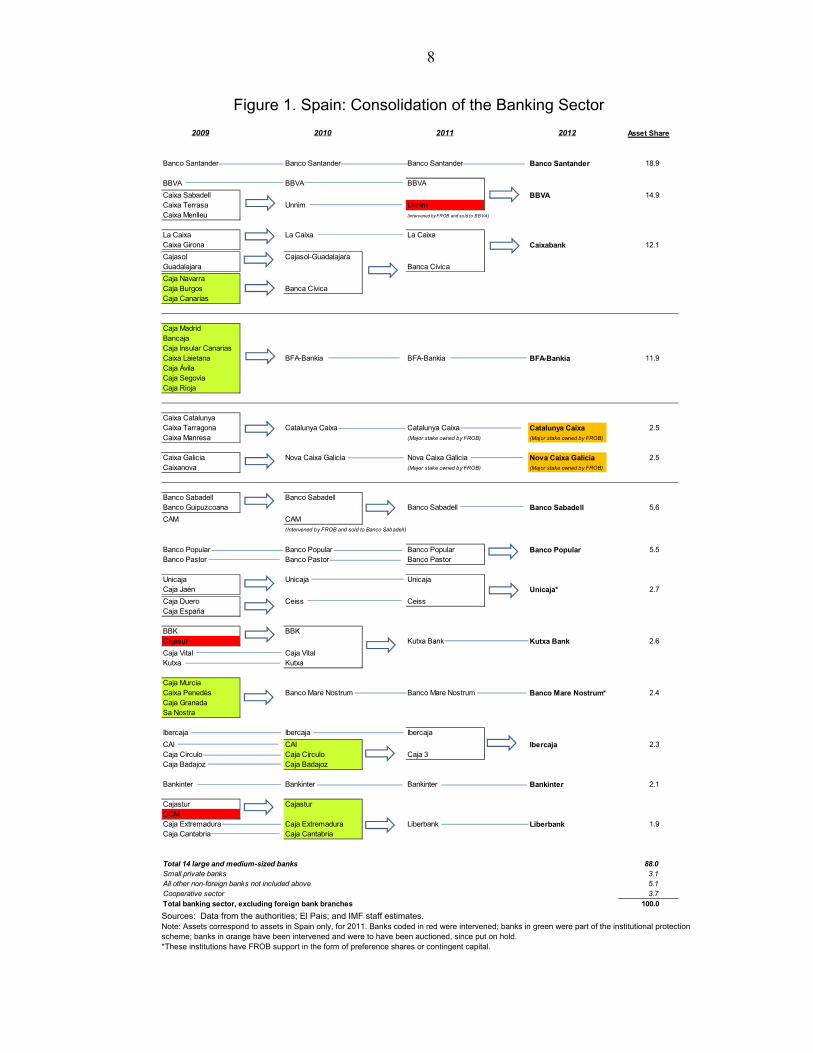
Figure 1. Spain: Consolidation of the Banking Sector
Sources: Data from the authorities; El Pais; and IMF staff estimates. Note: Assets correspond to assets in Spain only, for 2011. Banks coded in red were intervened; banks in green were part of the institutional protection scheme; banks in orange have been intervened and were to have been auctioned, since put on hold. *These institutions have FROB support in the form of preference shares or contingent capital.
2009 2010 2011 2012 Asset Share
Banco Santander Banco Santander Banco Santander Banco Santander 18.9
BBVA BBVA BBVA
Caixa Sabadell BBVA 14.9Caixa Terrasa Unnim UnnimCaixa Menlleu (intervened by FROB and so ld to BBVA)
La Caixa La Caixa La CaixaCaixa Girona Caixabank 12.1
Cajasol Cajasol-GuadalajaraGuadalajara Banca Cívica
Caja NavarraCaja Burgos Banca CívicaCaja Canarias
Caja MadridBancajaCaja Insular CanariasCaixa Laietana BFA-Bankia BFA-Bankia BFA-Bankia 11.9Caja ÁvilaCaja SegoviaCaja Rioja
Caixa CatalunyaCaixa Tarragona Catalunya Caixa Catalunya Caixa Catalunya Caixa 2.5Caixa Manresa (Major stake owned by FROB) (Major stake owned by FROB)
Caixa Galicia Nova Caixa Galicia Nova Caixa Galicia Nova Caixa Galicia 2.5Caixanova (Major stake owned by FROB) (Major stake owned by FROB)
Banco Sabadell Banco SabadellBanco Guipuzcoana Banco Sabadell Banco Sabadell 5.6
CAM CAM(Intervened by FROB and sold to Banco Sabadell)
Banco Popular Banco Popular Banco Popular Banco Popular 5.5Banco Pastor Banco Pastor Banco Pastor
Unicaja Unicaja UnicajaCaja Jaén Unicaja* 2.7
Caja Duero Ceiss CeissCaja España
BBK BBKCajasur Kutxa Bank Kutxa Bank 2.6
Caja Vital Caja VitalKutxa Kutxa
Caja MurciaCaixa Penedés Banco Mare Nostrum Banco Mare Nostrum Banco Mare Nostrum* 2.4Caja GranadaSa Nostra
Ibercaja Ibercaja Ibercaja
CAI CAI Ibercaja 2.3Caja Círculo Caja Círculo Caja 3Caja Badajoz Caja Badajoz
Bankinter Bankinter Bankinter Bankinter 2.1
Cajastur CajasturCCMCaja Extremadura Caja Extremadura Liberbank Liberbank 1.9Caja Cantabria Caja Cantabria
Total 14 large and medium-sized banks 88.0Small private banks 3.1All other non-foreign banks not included above 5.1Cooperative sector 3.7Total banking sector, excluding foreign bank branches 100.0
9
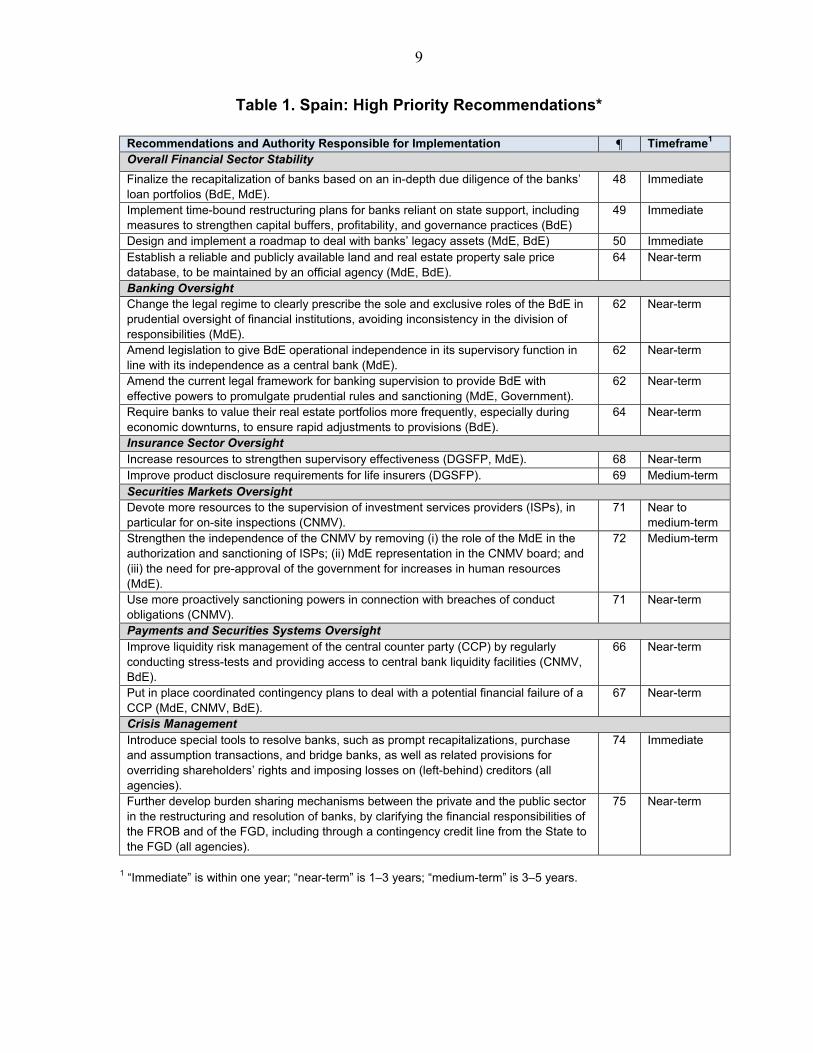
Table 1. Spain: High Priority Recommendations*
Recommendations and Authority Responsible for Implementation ¶ Timeframe1 Overall Financial Sector Stability
Finalize the recapitalization of banks based on an in-depth due diligence of the banks’ loan portfolios (BdE, MdE).
48 Immediate
Implement time-bound restructuring plans for banks reliant on state support, including measures to strengthen capital buffers, profitability, and governance practices (BdE)
49 Immediate
Design and implement a roadmap to deal with banks’ legacy assets (MdE, BdE) 50 Immediate Establish a reliable and publicly available land and real estate property sale price database, to be maintained by an official agency (MdE, BdE).
64 Near-term
Banking Oversight Change the legal regime to clearly prescribe the sole and exclusive roles of the BdE in prudential oversight of financial institutions, avoiding inconsistency in the division of responsibilities (MdE).
62 Near-term
Amend legislation to give BdE operational independence in its supervisory function in line with its independence as a central bank (MdE).
62 Near-term
Amend the current legal framework for banking supervision to provide BdE with effective powers to promulgate prudential rules and sanctioning (MdE, Government).
62 Near-term
Require banks to value their real estate portfolios more frequently, especially during economic downturns, to ensure rapid adjustments to provisions (BdE).
64 Near-term
Insurance Sector Oversight Increase resources to strengthen supervisory effectiveness (DGSFP, MdE). 68 Near-term Improve product disclosure requirements for life insurers (DGSFP). 69 Medium-term Securities Markets Oversight Devote more resources to the supervision of investment services providers (ISPs), in particular for on-site inspections (CNMV).
71 Near to medium-term
Strengthen the independence of the CNMV by removing (i) the role of the MdE in the authorization and sanctioning of ISPs; (ii) MdE representation in the CNMV board; and (iii) the need for pre-approval of the government for increases in human resources (MdE).
72 Medium-term
Use more proactively sanctioning powers in connection with breaches of conduct obligations (CNMV).
71 Near-term
Payments and Securities Systems Oversight Improve liquidity risk management of the central counter party (CCP) by regularly conducting stress-tests and providing access to central bank liquidity facilities (CNMV, BdE).
66 Near-term
Put in place coordinated contingency plans to deal with a potential financial failure of a CCP (MdE, CNMV, BdE).
67 Near-term
Crisis Management Introduce special tools to resolve banks, such as prompt recapitalizations, purchase and assumption transactions, and bridge banks, as well as related provisions for overriding shareholders’ rights and imposing losses on (left-behind) creditors (all agencies).
74 Immediate
Further develop burden sharing mechanisms between the private and the public sector in the restructuring and resolution of banks, by clarifying the financial responsibilities of the FROB and of the FGD, including through a contingency credit line from the State to the FGD (all agencies).
75 Near-term
1 “Immediate” is within one year; “near-term” is 1–3 years; “medium-term” is 3–5 years.
10
I. INTRODUCTION
9. Spain is experiencing the bursting of a real estate bubble after a decade of excessive leveraging. Construction and real estate loans grew from 10 percent of GDP in 1992 to 43 percent in 2009, and amounted to about 37 percent of GDP at end-2011. Spanish banks funded their increasing exposures largely from external sources during the period of high global liquidity and low interest rates, rather than through the mobilization of savings. The freezing of wholesale markets and the onset of the Euro-area debt crisis exposed Spain’s vulnerabilities from accumulated domestic and external imbalances (Figure 2) and pushed the economy into a sharp recession in 2009–10. The economy is expected to contract by 1.8 percent in 2012 and unemployment is at 24 percent and rising, especially among the young (Table 2).
10. Banks dominate the Spanish financial system and are large relative to the economy. The total assets of the Spanish banks (excluding foreign branches) amount to about 320 percent of GDP taking into account international activities of the banks, with the largest five banks accounting for more than 70 percent of total assets. Loans extended to the private sector in Spain account for 166 percent of GDP (Figure 3). In contrast, the growth of nonbank financial entities has not kept pace with the domestic banking industry and with EU peers, and this segment represents a relatively small share of the financial sector (Figure 4).
11. A major restructuring of the savings bank sector is taking place. The reforms to the savings banks legal framework together with financial support from the state-owned vehicle, the FROB, were instrumental in starting the much needed reform process to restructure and consolidate the banking sector (Table 3). The number of institutions has been reduced from 45 to 11, through a combined set of actions including interventions, mergers, or takeovers.
12. Despite significant consolidation and loss recognition, banks’ access to wholesale funding markets remains limited. Banks are exposed to further losses on their loan portfolios, notably to the real estate and construction sectors, due to the weak macro-economic environment (Figure 5). The deterioration in markets’ perception of sovereign and bank risk has further increased pressure on the Spanish banks, most of which rely on wholesale markets to fund important parts of their portfolios.
13. The authorities are, rightly, focusing on strengthening the banking sector. There is an appropriate sense of urgency from the authorities, as well as the awareness of the need for a carefully designed strategy given the potential implications for public debt dynamics. Indeed, unless the non-viable banks are resolved, the sound banks will continue to be penalized by across-the-board tighter regulations and expensive funding, with the risk of delaying renewed growth in credit in the country, and ultimately economic recovery.
11
II. RISKS AND VULNERABILITIES IN THE BANKING SECTOR
14. The Spanish economy and financial system have been hit by a succession of shocks, starting with the global financial crisis, which led to the domestic real estate crisis, subsequently intensified by the European sovereign debt crisis:
The initial impact of the global financial crisis was relatively mild. The banking sector weathered the first wave due to robust capital and provisioning buffers. However, banks, like many of their international peers, lost access to wholesale funding markets. During this initial phase of the crisis, the authorities took measures to assist bank funding rather than to inject capital, in line with EU policies.
The second-round effects were severe. The domestic economy entered into a sharp recession, with construction activity collapsing, unemployment soaring, and with the contribution of foreign demand insufficiently strong to clear imbalances. This particularly affected the former savings banks, also reflecting weak lending practices during the economic upswing. In response, the authorities launched a restructuring and recapitalization scheme and tighter minimum capital requirements, thereby encouraging the transformation of these institutions into commercial banks.
The third phase of the global crisis is still underway, reflecting concerns about sovereign debt markets. The defining challenge of this phase is the strong interconnection between the sovereign and its banking system (Figure 6)—with the former affecting the financial health of the latter, and vice versa.
15. In this difficult environment, the restructuring of the banking sector initially proceeded slowly. The depth and length of the economic crisis, and hence the latent losses in the banking sector particularly associated with real estate sector exposures, were underestimated. The institutional framework and complex governance arrangements for savings banks further delayed action. In some cases, weak entities were merged together forming larger weak entities. Regarding operational restructuring by banks, since 2008, the number of bank employees has been reduced by 11 percent (most of which occurred during 2011), and the number of branches has been trimmed by about 15 percent.
16. As a result, the quality of banks’ assets continued to deteriorate, exacerbating the credit crunch. Nonperforming loans continued to increase, particularly driven by loans to construction and real estate developers (Table 4). The stock of repossessed assets also increased, accounting for about 3½ percent of gross loans. At the same time, growth in credit to the private sector fell sharply and turned negative, reflecting the bursting of the real estate bubble, tighter lending criteria, increasing cost of risk, and deteriorating funding conditions saw banks increase their reliance on the ECB (Figure 7).
17. The ECB’s three-year Long Term Refinancing Operation (LTRO) has provided significant temporary relief, but has also increased the interconnectedness between
12
banks and the sovereign. Although banks, mainly the largest ones, had been able to exploit windows of opportunity in the wholesale markets, as in early 2012, market access remains very expensive, also reflecting the growing interconnectedness between bank and sovereign risk (Figure 8). Retail deposits have declined slightly (4 percent on a y-o-y basis) reflecting also portfolio reallocation towards higher yield bank commercial paper and government securities. Against this backdrop, Spanish banks have drawn extensively from the ECB, with refinancing reaching almost 11 percent of total assets. Most of this funding has been used to “defensively” substitute short-term repo funding, repay debt, buy sovereign paper, and build up precautionary cash buffers.
18. Since the beginning of the crisis, the banks and the authorities have taken measures to strengthen the banking sector:
Banks increased loan loss allowances by € 112 billion (11 percent of GDP) and raised their tier 1 capital ratio from less than 7 percent to more than 9 percent by end-2011, including capital injections by the state.
The total gross direct intervention by the government (excluding bond issuance guarantees) amounted to about € 34 billion (3 percent of GDP) as of April 2012, of which more than half has already been recovered, reducing net fiscal costs.
The industry has contributed, through the Fondo de Garantía de Depósitos (FGD), to the funding of the FROB and the resolution of three intervened institutions a total of about € 13 billion, which could rise up to € 34 billion (3.2 percent of GDP) if the recently granted asset protection schemes are fully called.
19. The authorities have recently accelerated the financial sector reforms:
In February 2012, higher provisions and specific capital buffers for banks’ outstanding real estate exposures were introduced through the Royal Decree Law (RDL) 02/2012. Banks have submitted plans to comply with the new requirements by end-2012 through earnings, asset sales, conversion of preferred shares and bonds into equity, and paying dividends in the form of new shares (Figure 9).
In May 2012, provisions on performing real estate developer loans were further increased from 7 percent to 30 percent in the RDL 02/2018. Banks that are not able to comply with their own means will be supported with a public capital backstop (issuance of equity or contingent capital to FROB).
A comprehensive review of banks’ loan books and real estate assets will be conducted by auditors to increase transparency.
In May 2012, the government committed to a capital injection of € 19 billion (about 2 percent of GDP) to the fourth largest bank, which will become state owned.

13
A. The Condition of the Financial Sector
20. The resilience of individual banks to the crisis has been markedly different, largely attributable to the varying business models and the differences in management quality and risk management philosophies. Thus, any analysis of the Spanish banking sector should necessarily differentiate the characteristics underpinning banks’ financial strength. This section aims to provide such an analysis, using supervisory data—banks are categorized into four groups covering about 83 percent of the banking sector excluding foreign bank branches (Table 5):
Large internationally active banks (G1). The two banks in this group are well-diversified in terms of their geographic footprints and business models. On a solo basis (Spain activities only) they account for about 33 percent of banking assets and almost half of the system at a consolidated level, with only one third of their net profits are generated domestically.
Former savings banks that have not received any state support (G2). These seven banks account for approximately 17 percent of domestic banking sector assets, and most of their lending is focused on the residential housing market.
Former savings banks that have received state support (G3). The seven banks in this group account for about 22 percent of sector assets; they rely significantly on the government/FROB for capital and liquidity support. Most of the banks included in this group show a high share of mortgage lending relative to their average balance sheet size, but most importantly, they are heavily exposed to real estate and construction-related lending.
Medium and small private sector banks (G4). This group accounts for approximately 11 percent of domestic banking assets. Their main lending activities are concentrated in the corporate sector, with exposures to the real estate and construction sector being second only to G3.
21. The groups differ in terms of loan exposures (Table 6). Banks in G3 has the highest exposure to the real estate developer sector, with 19 percent of its loans made to this sector, and with the highest proportion in land loans (that are the hardest hit). G1 and G2 have the lowest exposures and mainly to finished buildings. G3 also has the largest proportion of foreclosed assets.
22. The profitability of the system has been adversely affected by provisioning needs, and capitalization is uneven across groups. G1 profitability is augmented by diversified international businesses, which contribute some 75 percent of profits. G3 has the lowest capital base, is loss making, and least efficient in terms of cost to revenue ratio. The groups are distinct also in terms of capital quality—G3 banks have a higher proportion of Tier 1 instruments (FROB 1 injections), which are not considered accounting capital.
14
23. Meeting the increased provisioning requirements could pose challenges for some banks (Table 5 and Figure 9). G1 banks appear to be able to cover the February provisioning requirements, particularly leveraging off the relatively high group-wide pre-provision profits, and are expected to be able to absorb the additional May provisioning requirements on performing loans. In contrast, some of the banks in G2 and G4 will likely come under pressure even without taking into account the latest requirements, with a risk that some of them may record overall losses in 2012. G3 banks clearly face the biggest challenge.
24. The composition of funding sources of the banks provides some insight into how loans are being financed (Table 7):
Deposits represent about half of total system-wide funding. G1 and G4 have the highest loan-to-deposit (LTD) ratios at 143 and 150 percent, respectively (Table 6).
Banks also place significant reliance on the issuance of covered bonds (cédulas hipotecarias), which serve as an important source of long-term funding of mortgages, particularly for banks in G2 and G3. However, with a few exceptions, most recent issues have been retained by banks for ECB refinancing purposes.
There was a significant take-up of the ECB LTRO facility across most banks, which has improved their liquidity profile. G3 and G4 banks are the biggest borrowers relative to their total funding needs.
25. In other parts of the financial sector, the insurance industry has weathered the financial crisis well. Going forward, key challenges are the transition to Solvency II and the management of exposures to sovereign and corporate debts.
Despite the financial crisis, insurers have remained profitable, maintaining a return on equity at around 15 percent. The profitability of several players is all the more important given the well established and highly profitable bank-assurance model.
The industry has a healthy solvency margin of around 200 percent above the required capitalization in the life sector and 350 percent in the non-life sector under the current Solvency I regime. The introduction of Solvency II will impact the solvency margin of the sector, albeit to a still unknown magnitude, but the industry should remain comfortably solvent, as suggested by the latest QIS 5 exercise.
On the asset side, about a quarter of the investment assets are in sovereign debt and about 30 percent in corporate debt. Many Spanish investment-type insurance policies contain a market value adjustment provision, which effectively transfers market risk to policyholders. Thus, market risk affects policyholders’ interest even if it may not affect insurers’ solvency position.
15
B. Risks and Vulnerabilities
26. The economic environment increases the risks to corporate and household balance sheets and consequently, to the soundness of the banking sector. The economy has fallen back into recession (GDP is expected to contract by 1.8 percent in 2012) and unemployment is 24 percent and rising (Table 1). The outlook is challenging given: large-scale fiscal consolidation to come, market concerns and sovereign spread widening caused by external and domestic events (e.g., the difficult financial situation of the regions), house prices sliding further, and substantial bank and private sector deleveraging. On the positive side, the current account deficit has fallen sharply and exports have been robust. Moreover, important structural weaknesses are being tackled—the labor market has been made more flexible, while the fiscal framework has been strengthened to bring autonomous communities’ budget under tighter central control.
27. House prices have declined sharply, but inventories still remain large (estimated 700,000–1 million units). Market estimates suggest that these will take about four years to clear. Sales prices are still 20–25 percent below asking prices and banks need to offload their repossessed assets (estimated 200,000 units), increasing the risk of further price corrections.
Corporate and household sectors1
28. Though not the highest in the Euro Area, household debt increased rapidly during the boom years to around 90 percent of GDP, in line with the housing cycle (Table 8). Mortgage nonperforming loan (NPL) ratios have held up well considering the tensions on household incomes, in particular, given the large increase in unemployment. There are several potential mitigating factors:
the overall sharp drop in Euribor rates since the onset of the crisis (Figure 10), which has helped to moderate debt service relative to income (98 percent of mortgages are at variable rates);
the uptick in interest rates over the past year has been offset by the continuing contraction in new mortgages (minus 42 percent year-on-year in March);
restructuring of loans by banks and policy initiatives to lower debt service for the most vulnerable households;
full recourse by banks (borrowers are liable for the full value of the loan including penalties and fees, and not only for the value of the house that was mortgaged);
1 See Technical Note, “Vulnerabilities of Private Sector Balance Sheets and Risks to the Financial Sector.”
16
relatively low loan to value ratios (on average 58 percent);
high and relatively (compared to other countries) well distributed wealth, albeit very concentrated in housing, an illiquid asset during crisis periods; and
country-specific factors that may alleviate the weight of debt service despite economic distress and high unemployment rates (such as family support and additional income provided by grey economy activities).
29. The debt servicing ability among households has deteriorated since 2008. It is expected to weaken further due to the difficult economic situation. Sensitivity analysis of household indebtedness (Box 1) shows that:
Households are most vulnerable to rising interest rates, particularly on their mortgages (given the high share of variable rates); the shares of vulnerable households and debt-at-risk increases fairly sharply under rising interest rate scenarios, with stronger impact on lower income households.
Income shocks have a moderate impact on households’ debt servicing ability, which is consistent with the similarly muted impact from rising unemployment. One possible explanation is that the shock is being partially absorbed by the income of other household members and unemployment benefits, which may dry up in a prolonged recession resulting in second round effects.
30. A difficult economic outlook in 2012 and 2013 is expected to further weaken households’ financial positions. A sharp decline in output growth would cause an increase in debt-at-risk, with an impact that is most severe for borrowers among the poor and the young, which have already been hit hard, and bear a relatively high burden of debt.
31. Corporate debt poses a significant threat to financial stability, largely as a result of the weight of real estate and construction assets on banks’ loan books and the continuing adjustment in these sectors (Table 8). The deleveraging process will continue but will likely take a long time to complete, which means that financial stress and corporate vulnerability will remain elevated for some time. At 186 percent of GDP, corporate debt in Spain is the highest in the Euro Area after Ireland (Spain would be close to the Euro Area average if real estate and construction sectors are excluded); excluding trade credits, corporate debt would amount to 135 percent of GDP. Sensitivity analysis of the sector (Box 1) indicates that:
The corporate sector is vulnerable to interest rate shocks.
Small and medium-sized enterprises (SMEs) are exposed to domestic developments, due to their less-diversified sources of income. The recent decree creating a mechanism for the payment to suppliers of sub-national governments (up to
17
3.5 percent of GDP) goes in the direction of alleviating liquidity tensions at SMEs that depend on (already stretched) sub-national budgets for their business.
Macroeconomic shocks would have the biggest impact on the construction and real estate sectors while the export sector remains resilient.
Banking sector
32. The IMF’s central case (baseline) growth scenario projects a recession in 2012 and a modest recovery in 2013. Declining housing prices, strong headwinds from fiscal consolidation, and the ongoing de-leveraging of household, corporate, and bank balance sheets is expected to continue to weigh on domestic demand (see Risk Assessment Matrix in Appendix I). Led by net exports, real GDP growth is expected to accelerate gradually to around 1.8 percent over the medium term. The recent labor market reform will help contain costs and support the export-led recovery. Lower and stable inflation combined with productivity gains will help Spain keep its world share of goods exports.
33. Stress tests were conducted to assess solvency risks under baseline and two adverse scenarios. The tests covered over 96 percent of the domestic banking sector (by total assets, excluding foreign branches), over the 2012–13 risk horizon using end-2011 supervisory information (Appendix II). The additional provisioning requirements introduced in February and May are incorporated (Appendix III). Given the significant ongoing restructuring in the banking sector, a longer horizon for the stress test was not viewed as useful although the estimates are based on lifetime losses. The baseline growth projections are consistent with the IMF’s World Economic Outlook Update (January 2012), while the adverse scenarios comprise:
A “double-dip”recession scenario of one standard deviation from the baseline GDP growth trend over the two-year horizon (“IMF adverse”). In this scenario, most of the shock to economic growth occurs in the first year resulting from a sharp decline in output, further declines in house prices close to levels observed in 2002, and rising unemployment (Figure 11 and Table 9). Although the cumulative GDP shock under this scenario of 5.7 percentage points would be extreme by historical standards, it represents a plausible tail risk under current circumstances.2
An alternative adverse scenario (“BdE adverse”) where the shock to the two-year real GDP growth is more modest (i.e., reduced by 2.5 percentage points relative to the “IMF adverse” scenario.
2 The GDP drop in 2012 would represent the largest decline in economic activity since 1945.
18
34. The scenarios are designed with a specific focus on real estate prices, which are likely to decline further. In Spain, the fall in house prices of more than 20 percent in real terms is close to the average depreciation of house prices in the U.K. and in the Euro Area countries that have experienced similar real estate bubbles, but less than in Ireland and the United States. It is likely to continue to decline in nominal terms. This risk is reflected in the scenarios, with cumulative additional nominal declines for the period 2012–13 ranging between an additional 8 percent for the baseline to 23 percent for the IMF adverse scenario.
35. The scenarios include valuation haircuts on sovereign debt held in trading and available for sale portfolios. Banks hold about two-fifths of Spanish central government debt (about 8 percent of total banking system assets). Market-implied valuation haircuts are applied to sovereign debt holdings other than those in the held-to-maturity books (banks can repo these assets with the ECB and are thus not forced to sell them on-market). The haircuts were estimated based on the impact of the forward term structure of sovereign credit default swap (CDS) spreads on sovereign benchmark bonds as at end-2011 (Appendix III).
36. A three-pronged approach is used in the solvency stress testing exercise. The BdE runs two top down tests, using confidential supervisory data and based on guidelines provided by the FSAP team and agreed-upon assumptions (Appendix II), which are then cross-checked by the FSAP team using market data (Figure 12). These approaches consist of:
A top-down, balance sheet stress test conducted by the BdE on prudential data (“IMF TD model”);3
A top-down, balance sheet stress test conducted by the BdE (“BdE TD model”), applying its own panel regression model (Appendix III); and
Stress tests using the Systemic Contingent Claims Analysis (SCCA) approach.4 Using market information, capital needs are assessed based on perceived solvency and its implications for banks’ resilience to simultaneous shocks to multiple banks (“IMF SCCA model”).
37. The findings suggest that while the core of the system appears resilient, there are vulnerabilities that need to be addressed. Lender forbearance—which the supervisory authorities have indicated they are monitoring closely—is not explicitly addressed in the stress test due to lack of comparable data across institutions, and
3 Schmieder, Christian, Claus Puhr and Maher Hasan, 2011, “Next Generation Balance Sheet Stress Testing,” IMF Working Paper 11/83 (Washington: International Monetary Fund).
4 Gray, Dale F. and Andreas A. Jobst, 2011, "Modelling Systemic Financial Sector and Sovereign Risk," Sveriges Riksbank Economic Review, No. 2, pp. 68–106; International Monetary Fund, 2011, “United Kingdom: Stress Testing the Banking Sector Technical Note,” Country Report No. 11/222, July 1 (Washington: International Monetary Fund).
19
this may understate the extent of credit risk in some institutions. The results (Tables 10 and 11) suggest that:
The banks in G1 appear sufficiently capitalized and profitable to withstand further deterioration in economic conditions. This reflects the solid capital buffers and the robust earnings of the internationally-diversified operations.
G2 banks are resilient to adverse shocks up to a point. As a group, they comply with core tier 1 capital hurdle of 4 percent under the adverse scenario but show some capital need in the case of a 7 percent hurdle rate (see below).
For the banks in G3 and those administered by FROB, the vulnerabilities seem highest and public support most critical. Under the adverse IMF stress scenario, these banks’ core Tier 1 capital (almost € 27 billion) would be essentially wiped out (Table 11). These banks have already received state support—five have been acquired or merged with stronger entities and the rest are in varying stages of restructuring. In May, the largest bank in this group requested capital support from the government (conversion of € 4.5 billion of FROB preference shares into equity). The new management team subsequently asked for capital support of € 19 billion from the government, of which about € 13.5 billion (post-tax) are earmarked to comply with the new provisioning requirements and to cover potential future loan losses.
The banks in G4 would also be affected, but to a lesser extent, under the adverse IMF scenario. Post-shock, these banks would require about € 2 billion to comply with a core Tier 1 capital ratio of 4 percent.
The impact of sovereign risk on non-banking income does not appear significant. However, the widening sovereign CDS spreads for Spain since end-2011, commensurate with the rising risks to the economic outlook, are not reflected in the haircuts given the cut-off point for the stress tests. This means that banks could be affected by additional losses beyond the prescribed haircuts projected as at end-2011.
38. Consistent with other recent FSAP assessments, the stress tests also consider the readiness of the banking system to accommodate Basel III capital requirements, which will take the minimum core Tier 1 capital ratio from 3.5 percent in 2013 to 7 percent by the end of 2018. Post-shock, the Spanish banking system’s capital needs to comply with a 7 percent core Tier 1 ratio would amount to an aggregate € 37 billion, 80 percent of which are attributable to the banks in G3 and those being auctioned by FROB. In an international context, recent stress tests conducted by the EU and U.S. authorities were respectively based on a hurdle rate of core Tier 1 and Tier 1 common capital ratio of 5 percent under the adverse
20
scenario, and on a core Tier 1 ratio of 6 percent in the Irish 2011 stress tests. Market analysts’ estimates for Spain, on the other hand, tend to be based on higher hurdle rates (Box 2).5
39. Important caveats attach to these FSAP stress test results:
As in all other stress testing exercises, any feedback between banking system distress and economic performance cannot be fully captured. This consideration is especially pertinent in the context of the current crisis. Further bank strains, for example, that force a severe loan contraction that cause a self-reinforcing cut in domestic demand, deterioration in loan quality, and further bank funding pressures, are not captured in existing models.
As a result of the ongoing restructuring, one third of the banks in the stress test sample no longer exist as stand-alone entities as of May 2012. The financial strength of the merged entities may be different from the sum of its individual parts, which is not captured by the stress tests.
Moreover, other considerations need to be taken into account in the case of a bank under resolution/restructuring, especially if public funds are to be used. Indeed, as evidenced in the case of the fourth largest bank, some costs additional to provisioning for potential losses may be unknown ahead of time and are therefore not possible to incorporate in the stress tests. In this case, the industrial participations are marked-to-market in preparation for sale, as part of the restructuring plan, and the proceeds will likely be used to retire debt and thus improve the funding position.
40. Some banks have significant exposures to the banking and non-bank private sectors abroad (Figure 13). As a result, these banks may be susceptible to cross-border risk arising from shocks to a country to which they have made substantial loans or through the ring-fencing of profitable and liquid bank subsidiaries by host countries. Spillover analysis using the network approach indicate that the domestic banking system is most exposed to the realization of extreme credit and funding shocks to the United Kingdom and the United States, and to some extent to France and Germany (Box 3). Separately, analysis of cross-border shocks from partial ring-fencing of profits in key host countries to Spanish banks outside Europe suggest that the impact would be limited (0.5 percentage points of banks’ Core Tier 1 capital ratios or less).
41. The results of the SCCA analysis validate the stress test findings. As a complement, the SCCA model was used to estimate the joint solvency risk of seven large (and publicly-listed) banks (covering about 40 percent of the system and mainly in G1 and
5 Under the FSAP stress tests, if we were to consider a hurdle rate of 8 percent core Tier 1, total capital needs would reach € 45 billion, 75 percent of which is accounted by G3 and FROB banks.
21
G4). Consistent with the findings in the other two stress test approaches, the severe double-dip recession scenario has the biggest impact on the banking system (Table 12):
Under baseline conditions, potential joint solvency pressures from the realization of lower profitability, rising credit losses and risks to sovereign debt holdings would be relatively benign, resulting in joint potential capital losses averaging € 0.3 billion over 2012–13.
In the event that the severe adverse scenario were to be realized, sample banks would experience a total expected loss of more than EU14 billion on average (with a peak in excess of € 21 billion at end-2012) at a statistical probability of five percent or less (expressed as “tail risk”). The resulting capital levels, however, remain comfortably above all stress test hurdle rates.
42. The liquidity stress tests carried out as part of the FSAP comprise reverse stress tests and proxies for the proposed Basel III measures of liquidity risk. A country-specific spreadsheet-based stress testing tool was combined with a liquidity reporting format (based on the BCBS monitoring tool) and supplemented with balance sheet data of 29 institutions for this part of stress testing exercise. Consistent with the internal thematic liquidity risk assessment exercise of the 2011 EU system-wide stress tests conducted by European Banking Authority (EBA), these tests are conducted separately from the solvency risk analysis. Due to the stringency of assumptions that have been applied that is consistent with other FSAP stress tests, the findings are informative regarding the dynamics of aggregate funding positions under very severe system-wide distress (Appendix II). Separate stress tests for foreign currency liquidity are not conducted.
43. The results confirm that ECB support measures have significantly alleviated the difficult funding conditions confronting banks. Given the wide deposit base and retail-focused business model of most banks, the impact from disruptions to wholesale markets is limited, while retail funding has proven to be historically robust to economic shocks. All firms bar one pass the implied five-day cash flow test and the Liquidity Coverage Ratio (LCR) test, and overall liquidity shortfall remains contained for the 30-day test, with about one-third of firms (about 3 percent of system assets) being affected in a very severe scenario that assumes a 21.5 percent withdrawal of all deposits maturing within one year (Table 13).
44. While banks are resilient to short-lived cash flows shocks, some would struggle to withstand adverse scenarios if there were no access to central bank liquidity. Two-thirds of all sample banks—about half of all banks in G1, G2, and G3—fall below the Net Stable Funding Ratio (NSFR) benchmark of 100 percent, which together with maturity mismatches up to one year of almost all banks in the sample, raises concerns about the stability of current funding sources (Table 14). Especially in G2, where the reliance on long-term funding is the lowest, these concerns center on even shorter maturities, as indicated by a
22
low pass rate for the 30-day cash flow test. The highest rate of acceptance of funds from the ECB’s LTRO by G3 (but also G2) banks seems to confirm these findings.
45. Banks may not be able to rely on the issuance of structured finance products as a source of funding over the next few years. Covered bonds (cédulas) facilitate cost-efficient funding over longer time horizons, however, the required asset-backing entails overcollateralization requirements to help protect investors (Box 4). The retrenchment of mortgage credit continues to erode the stock of mortgages that support such over-collateralization, and it is anticipated that the issuance of covered bonds will continue to decline. Restarting securitization markets, which has traditionally been an important source of funding (Figure 13), will likely take time, as these markets are largely illiquid throughout Europe. Continued efforts towards greater transparency of underlying assets required for securitization will be key for investor confidence when market conditions improve.
C. A Comprehensive Strategy to Address the Remaining Vulnerabilities
46. As of May 2012, following mergers, acquisitions, and government interventions, the banking system comprises of 14 large and medium-sized banks (Figure 1). Together, these banks account for almost 90 percent of total system assets. This is a remarkable transformation from the pre-crisis situation of 45 former savings banks and 7 commercial banks. The rest of the system comprises small private banks, international banks with operations in Spain, and the cooperative sector. Of the former larger group of institutions:
The three largest banks (accounting for about 47 percent of the system) appear able to withstand a further deterioration in economic conditions.
The fourth largest bank (12 percent of system assets) will have received government capital support (including conversion of FROB preference shares) of € 23.5 billion (about 2 percent of GDP) by end-July, becoming a majority state-owned bank.
Two other banks (5 percent of system assets) are already under government administration and will need to be capitalized.
Four banks (16 percent of total assets) have remained resilient without state support. However, some of these banks may come under pressure in meeting the increased provisioning requirements, and may record losses in 2012.
The remaining four banks (about 9 percent of total assets) already rely on state support, either in the form of preference shares or contingent capital.
47. The additional provisioning requirements adopted in 2012 address important concerns regarding exposures to the real estate developer sector. The balance sheet valuation of troubled assets has been brought closer to market value (with a coverage ratio of problematic exposure of about 50 percent) and expected migration of performing or refinanced loans into doubtful categories are largely accounted for. These changes imply an
23
increase in the average coverage ratio of the real estate developer loan portfolio from 17 percent to 43 percent. However, real estate exposures of banks differ by region and type and the current levels of provisioning may be conservative for some banks and less so for others.
48. The authorities are committed to undertaking a comprehensive review of banks’ asset portfolios, with third-party participation. The top-down review by two independent firms is expected to provide an estimate of capital needs under stress scenarios by end-June. A thorough review by audit firms of all banks’ loan books and real estate assets should provide the basis for a comprehensive clean-up of the system, introducing an institutional framework for managing banks’ legacy real estate assets, and enhancing market confidence.
49. The full implementation of reforms, including a credible public backstop and an effective communication strategy, is critical for preserving financial stability. The authorities have pursued a strategy of burden sharing between the public and private sectors. Most recently, they have switched to greater reliance on public funding in order to avoid undermining viable banks. Going forward, the timetable for the diagnostic and the strategy to address the potential implications needs to be spelled out, as well as a strategy for dealing with impaired real estate exposures.
50. The authorities have required all banks to make an initial transfer of foreclosed assets into bank-specific asset management units. This should improve the management of such assets, including their effective disposal. This said, transfers within a bank group, which is consolidated for accounting purposes, do not change the risk profile, and may require further provisioning if the value of assets decline further. Further steps to manage impaired assets need to be determined based on the results of the diagnostic review. The diagnostic should also provide guidance on the transfer price if impaired assets were to be moved from balance sheets—it is critical that the assets are valued conservatively.
51. A number of institutional options for managing impaired assets could be considered. Banks can manage them directly, or sell them to one or more specialized, privately or publicly owned, asset management company(ies) (AMC). While each institutional set-up has advantages and disadvantages, experience suggests that, government-owned centralized AMCs may be relatively more efficient when the size of the problem is large, special powers for asset resolution are needed, or the required skills are scarce. The scope of the AMC should be decided based on the nature and size of the problem; fixed assets such as foreclosed properties and loans that require foreclosure or settlement with debtors are good candidates for transfer to AMCs, and different specialized AMCs may take over separate categories of assets.
52. An option that could be pursued is the use of a system-wide asset protection scheme (APS). This approach would be similar to that used by the FROB in resolving failed banks, but on a system-wide basis. A guarantee would be given by a third entity on specified
24
portfolios of impaired assets (e.g., by the FROB), covering losses in excess of a certain amount and, possibly, up to a certain percentage. The assets subject to the APS would remain on the balance sheets of the banks. There would not be loss mutualisation mechanisms among banks like in an AMC structure and, in light of such government guarantee, protected assets would benefit from lower risk weightings. This approach avoids the infrastructure or operating costs typically borne for AMCs as well as the potential for political interference that could arise when a large-scale state-owned entity is created to manage troubled loans. Although this approach would require no pre-funding (i.e., no immediate fiscal impact), it would imply an increase in public sector contingent liabilities.
53. However, systemic asset protection schemes (APS) need to be designed carefully to address moral hazard concerns. As in the U.K., consideration might be given to the introduction of a given fee in exchange of the provided protection. The beneficiary institution could pay the net present value of future fees through the issuance of capital instrument in favor of the institution providing the APS (either the FROB or the FGD). These capital instruments could be structured to qualify as Core Tier 1 capital. This approach would have the advantage of reducing a bank’s risk weighted assets while also increasing its quality capital.
III. STRENGTHENING THE SUPERVISION OF THE FINANCIAL SECTOR
A. Microprudential and Macroprudential Regulatory Infrastructure
54. In Spain, the regulation and supervision of financial institutions and securities markets is performed by three main agencies. The BdE, the CNMV, and the Dirección General de Seguros y Fondos de Pensiones (DGSFP, acting within the Ministerio de Economía y Competitividad, MdE) are responsible for the supervision of credit institutions, securities markets, and insurance companies and pension funds, respectively. Regional governments retain some regulatory and supervisory powers over the savings banks operating in their jurisdictions, even though these powers are less relevant now that savings banks have transferred their banking business to commercial banks.6 Oversight and supervisory responsibilities regarding payments and settlements systems are the purview of the BdE and the CNMV, respectively.
55. In 2006, the authorities established a financial stability committee, Comité de Estabilidad Financiera (CESFI), in which the three agencies are represented, together with the State Secretary for Economic Affairs acting as Chair. The objective was to strengthen coordination and exchange of information among the three institutions on financial stability and crisis prevention and management issues. The LABE establishes the BdE’s responsibility for ensuring the smooth operation and the stability of the financial system. In that capacity,
6 See Technical Note, “The Reform of Spanish Savings Banks.”
25
the BdE conducts analysis and monitoring of the risks that may affect the Spanish financial system and, in particular, the banking sector. It also ensures the efficiency of payments systems. The BdE publishes bi-annually a Financial Stability Report and a Financial Stability Journal. The MdE, which houses the secretariat of CESFI, is responsible for cross-sector coordination. Going forward, the CESFI could be strengthened through a more structured and formalized decision-making process, and could be the “platform” for the set-up of a macroprudential framework.
56. The new project on improving the credit registry is welcome and will facilitate both microprudential and macroprudential analysis. In an effort to improve the monitoring of credit risk in the system, the BdE has initiated a two-pronged project to collect credit information on a comprehensive scale, to be launched in 2014. Under this initiative, banks will report all transactions by any borrower, including non-residents, one of the main aims being to capture credit risk transfers within banking groups. The features of the central credit register would be enhanced to ensure that banks taking on credit risk would have complete details about their customers, including on the encumbrance of collateral used for loans.
57. Major progress has been achieved in reforming the savings bank sector and a clear strategy on governance structures needs to be designed. The spin-off of banking activities to commercial banks enhances financial stability as it brings clarity to the supervisory framework, now within the remit of the BdE, and market discipline as to the performance of the banks resulting from the spin-off. The current restructuring is reducing excessive capacity in the banking sector, and new requirements on governance and professionalism of management are welcome. In the current set-up, in some cases, the savings banks will act as holding companies of commercial banks and in some other cases they will become foundations with a minority stake in banks. However, the overall strategy on the role of savings banks needs to be kept under review. Building upon the major achievements of the recent reforms, sound governance arrangements and financial regulatory requirements need to be established for savings banks that convert into foundation—consideration should be given to adopting a special regime to transform savings banks into institutional investors with a view of becoming minority shareholders going forward.
B. Assessment of the Oversight Framework
58. The assessment of the financial oversight framework identified key strengths and weaknesses. The main strengths of the supervisory agencies are their highly experienced and respected professional staff supported by good information systems and thorough supervisory processes. Although some of the recommendations made in the previous FSAP have been addressed, a number of important weaknesses remain:
26
insufficient regulatory independence for the banking and securities regulators, and limitations on the financial/budgetary independence for the insurance and securities regulators;
lack of adequate authority and mandate for the banking regulator to address preemptively the build-up of risks in the system;
lack of a risk-based regulatory framework for the insurance sector (the current solvency regime is not risk-sensitive) and of a proper monitoring of potential risk build-up in the sector due to out-dated solvency regime; and
lack of a fully effective remedial action and sanctioning regime in banking supervision and limited use of on-site inspections in the securities supervision.
C. Regulation and Supervision of the Banking Sector
59. The BdE’s slow approach in taking corrective action has allowed weak banks to continue to operate. Weaknesses were identified at early stages and corrective actions were recommended, including the need for additional provisions, but enforcement was gradual. This contributed to growing vulnerabilities as weak banks were allowed to continue to operate. Action may also have been slowed as a result of deference to stakeholder interests that led to the complex decision making process involved in the mergers of the savings banks.7
60. The core supervisory process at the BdE is strong and is supported by an experienced cadre of inspectors, as identified in the assessment of Effectiveness of Banking Supervision based on the Basel Core Principles (BCP). Regulatory capital and loan-loss provisioning requirements for real estate exposures also have been tightened and further guidance on best practices for lending in this area has been provided. The authorities have also implemented measures to reduce incentives for equity investments in nonfinancial companies by banks and to manage related conflicts of interest, enhanced coordination and cooperation between financial sector regulators, and adopted additional requirements on internal controls.
61. However, supervisory practices did not always seem to be sufficiently timely or effective for bank intervention or resolution. Areas requiring improvement include timeliness of remedial action, operational independence concerning issuance of regulations and enforcement, and oversight of concentration risk and related party transactions.
7 These issues are mentioned in a recent speech by the Governor of the BdE, April 10, 2012 (http://www.bis.org/review/r120419e.pdf?ql=1).
27
62. The BdE’s independent authority can be enhanced to expedite corrective action and regulatory response in a number of areas:
Sanctioning powers. The delays in implementation of corrective actions and sanctions have led to concerns regarding the independence of the BdE. While it must be stressed that the assessors have not seen any evidence of government or industry interference in the operation of supervision and its budget in the BdE, it is true that the legal framework for sanctions and regulatory powers does not create an environment conducive to independence. Although sanctioning proposals are made by the Governing Council of the BdE to the Minister of Economy, it is the MdE that has sanctioning power for very serious infractions and resolution capacity. Adopting a more flexible enforcement regime would have enabled the supervisor to quickly adjust its course of action if the original assumptions had proven incorrect, while a more intensive use of sanctions could have been a stronger deterrent to imprudent risk management.
Regulatory autonomy. The legal framework establishes the MdE as the principal agency charged with issuing financial regulation. The BdE currently lacks authority to issue prudential regulations, except in areas specifically delegated by law or the MdE. The banking legislation, Ley de Autonomía del Banco de España, clearly distinguishes the independence and regulatory capacity of the BdE in its monetary authority role from its supervisory role. As prudential regulation in Spain depends on government action, changes in the regulatory framework tend to follow the political cycle and thus may result in delays in the issuance of critical regulations. Having the authority to issue prudential regulations would enable the BdE to address, at an earlier stage, developments of a systemic nature. Establishing BdE’s regulatory powers directly by law—rather than through delegation by the MdE—is recommended. The broad presence of the MdE in the sanctioning and regulatory hierarchy clouds the independence of a well-conducted and highly technical supervisory body, or may risk creating false perceptions and potentially undermine the credibility and effectiveness of supervision.
63. The regulatory framework and oversight of concentration risk and related party transactions were not sufficient to address significant build-up of risks. Some of the problems were due to the peculiar corporate governance structure of savings banks. The savings banks, given their local characteristics and business nature, presented both high sectoral (real estate) and geographical concentration, but economic sector concentration also affected many banks. In addition, many linkages between industrial companies and banks remain, and the organizational structures are often complex and related parties difficult to detect. The application of an enhanced regulatory framework within Pillar 2 and more intensive monitoring and control of such risks under seguimiento continuado is a welcome development. Going forward, the complex shareholder and governance structures of the new commercial banks present particular challenges to supervision of these risks, and the BdE

28
will need to apply special attention to ensure deficiencies in the previously existing structures do not contaminate banking organizations.
64. Given the importance of real estate loans on banks’ loan books, measures to improve existing valuation practices should be considered. In particular, the difficulties in determining the accuracy of real estate valuations have continued to weigh on perceptions regarding the adequacy of provisioning by banks. In this context, the establishment of a comprehensive, reliable and publicly available land and real estate property price database—to be maintained by an official agency—would be an important step towards much-needed transparency in the sector. The database should record actual transaction prices, rather than mortgage amounts, and detailed information on the respective properties. More frequent valuations by banks of their real estate portfolios, especially during downturns, would also ensure rapid adjustments to provisions.
D. Supervision of Financial Market Infrastructures8
65. Overall, financial market infrastructures (FMIs) are well regulated and supervised. The BdE and the CNMV have the necessary tools and resources to discharge their FMI oversight and supervision responsibilities and have been successful in inducing changes over the past decade. The integration of European post-trading systems is requiring the Spanish clearing, settlement, and registry system to undertake substantial changes, which are ongoing. In the next three years, the CNMV’s supervision methods will need to be adapted to the new European regulatory and operational framework and to the future domestic FMIs’organization.
66. Spanish CCPs benefit from robust financial risk management frameworks that could be further improved by better liquidity risk management and governance practices. Legal provisions, operational procedures, financial resources, and coordination arrangements are in place to deal with the default of a CCP’s participant. However, liquidity risk management could be further improved by regular liquidity stress-tests and access to central bank liquidity as soon as the on-going reorganization of clearing activities is completed. As for the governance arrangements of the Bolsas y Mercados Españoles (BME), they will need to be adapted by ring fencing the clearing activities, hiring independent members for their board and overhauling the composition of their risk committee to comply with the Committee on Payment and Settlement Systems/International Organization of Securities Commissions (CPSS/IOSCO) standards and the new European Market Infrastructure Regulation.
67. The authorities should consider developing coordinated contingency plans to deal with a potential failure of a CCP, in line with ongoing discussions at the
8 See also Technical Note, “Oversight and Supervision of Financial Market Infrastructures.”
29
international level. Spanish CCPs should conduct regular default management stress-testing exercises with the involvement of participants and relevant public authorities, to allow all stakeholders to check their state of readiness to handle crisis situations. Lastly, the orderly exit of the BdE from the BME’s capital should be planned, choosing the right moment to do so and avoiding sending a wrong message to the market by clearly explaining the reasons of such a move.
E. Supervision of the Insurance Sector
68. The insurance supervisor, DGSFP, should increase its resources to strengthen its supervisory effectiveness. Spain has an immediate need to implement new international prudential standards, namely, the Solvency II capital requirements, enterprise risk management framework for solvency purposes and a macroprudential surveillance system (including industry-wide stress testing). The high degree of market participation by foreign insurers also requires ongoing cooperation and coordination in supervising cross-border insurance groups and financial conglomerates. At the same time, the budget allocated to DGSFP as part of the government budget has remained static. Given the increasing demand and the limited resources, it is not surprising that the intensity of supervision has been adversely affected, as manifested in the reduced number of onsite inspections and the limited scope of offsite monitoring. DGSFP should explore alternative funding models, including being independent from the government to reduce its dependence on the state budget.
69. Product disclosure requirements for life insurance should be improved. The insurance laws and regulations have requirements on disclosure to customers at the point of sale. However, given the high proportion of guaranteed investment products sold in Spain, DGSFP should be empowered to strengthen the existing point-of-sale disclosure requirements to include description of investment strategies used to provide the guarantee, so that the customers may make an informed decision on the effectiveness of the guarantee. This is particularly pertinent in the case of unit-linked business where the customers bear the full investment risk. In this regard, intermediaries selling products backed by complex investment instruments should have special training so that they can explain the investments clearly to customers. Subsequent to sale, there is no requirement for ongoing disclosure to customers of the value of their policies. As market value adjustment is prevalent on guaranteed products, the insurers should be required to provide a statement to customers on changes to their policy values, at least on an annual basis.
F. Regulation of Securities Markets
70. Spain exhibits a high level of implementation of the IOSCO principles. The legal framework is robust and provides the CNMV with broad supervisory, investigative and enforcement powers. Arrangements for off-site monitoring of regulated entities are robust. Thematic reviews in selected areas have complemented such monitoring, allowing the CNMV to take a “full industry” perspective on key issues. The CNMV has also developed
30
robust arrangements for market surveillance. A new committee (the Grupo de Estabilidad Financiera) and annual strategic reviews allow the CNMV to contribute to the identification and monitoring of emerging and systemic risk.
71. Some areas of supervision and enforcement require strengthening. In particular, the CNMV should make more use of on-site inspections for all types of investment service providers, but in particular in connection with credit institutions given their dominant role in the securities markets and the inherent conflicts of interest that arise from their dual role as issuers and distributors of products. This could be done via spot checks on particular issues, and does not imply the need for full scale inspections. In tandem, the CNMV should continue to use more proactively its sanctioning powers in case of breaches by regulated entities, in addition to other enforcement mechanisms such as remedial agreements. Successful criminal prosecution of market abuse is a challenge, but positive steps have been taken as the CNMV has become more active in the referral of cases to the criminal authorities.
72. Certain aspects of the CNMV governance structure raise concerns about its independence, although the assessors saw no evidence of interference with day-to-day operations. The participation of a representative of the MdE in the board of the CNMV; the fact that certain key decisions (authorizations and the imposition of sanctions for the most serious breaches) are still a responsibility of the MdE; and the requirement of governmental approval to hire additional personnel are significant limits to CNMV’s independence. In practice the collegial nature of the board and the “regulated” nature of the authorization and sanctioning processes—which require a recommendation from the CNMV—have acted as mitigating factors.
IV. CRISIS MANAGEMENT AND RESOLUTION9
73. Although the BdE has flexible powers to deal with weak banks, the framework could be further strengthened by putting in place a forward-looking approach. The BdE supervisory action is based on a combination of judgment and quantitative analysis (e.g., on bank capital), which builds upon a risk-based supervisory methodology. This framework needs to be complemented with a more structured and forward-looking approach for promptly taking corrective actions. Accordingly, the BdE would have to consider an array of measures when a bank is assessed to be in a pre-defined overall risk category, and to contact other relevant authorities, as appropriate; it would retain the flexibility to decide whether or not to take any measures. Likewise, the current emergency liquidity assistance framework is broadly sound but some features could be further specified (such as the definition of “solvent bank,” of “systemic importance,” and of “temporary liquidity support”) and some aspects of of the framework could be publicly disclosed to further ensure certainty and well-established practices. 9 See also Technical Note, “ Safety Net, Bank Resolution and Crisis Management Framework.”
31
74. Resolution tools should be introduced, in line with recent international practices. While implementing changes in the midst of a crisis is a challenge, legislative improvements are warranted. New legislation should emphasize the public interest objectives inherent in resolution, aimed at protecting financial stability, and should enable allocation of losses to shareholders and creditors, such as through prompt recapitalizations, purchase and assumption transactions, and bridge banks. The ability to override shareholders’ rights is particularly important in taking prompt and cost-effective resolution measures. The exercise of strong resolution powers needs to be subject to strict legal protection and to accountability through ex post judicial review. Consideration should also be given, in the context of a broad overhaul of the Spanish resolution regime, to introducing depositor preference and an administrative-based framework that can ensure an orderly liquidation of failed banks.
75. The authorities are rightly pursuing a strategy of burden sharing between the public and private sector in the current bank resolution. Public resources are channeled through the FROB—the vehicle established by the State to foster such process—while private resources are drawn from the deposit insurance scheme, the FGD. Since 2011, significant costs, such as capital support for weak banks or asset protection scheme, have been shifted to the industry via contributions to the FGD. However, although this is commendable, if the resolution costs become too high for the industry to bear in a reasonable time period, this may risk the viability of healthier institutions. Temporary public funding may be needed in a crisis to preserve financial stability and must be devised in such a way so as to recoup its costs ex post.10 The FROB would continue to contribute to the structural consolidation of the banking industry regarding viable institutions.
76. The authorities used APS to facilitate the take-over of weak banks. An APS is a co-insurance mechanism aimed at “ring-fencing” a determined pool of troubled assets, and makes take-over bids of intervened banks more palatable. The first loss tranche on the “insured pool,” which is fully retained by the beneficiary institutions, has been usually set equal to the amount of provisions already accumulated by the weak institution that has been taken over. Consideration could be given to revising some features of this mechanism; for instance, a higher first-loss threshold might provide the incentives for the beneficiary institution to efficiently manage covered assets and may ultimately be more cost effective for the industry and the taxpayers.
77. Governance arrangements of financial safety net agencies should be reviewed to avoid conflicts of interest. While conflict-of-interest and confidentiality safeguards are in place, the presence of active bankers in the FGD and FROB governing bodies gives at least the appearance of conflicts of interests.
10 See FSB Key Attributes of Effective Resolution Regime for Financial Institutions.
32
78. A strong system of checks and balances would bring additional important improvements to the governance of financial sector agencies and avoid group-think. Cross-board membership in the governing bodies can play a positive role in ensuring coordination and the flow of information. Nevertheless, such system should be counter-weighted by enhancing checks and balances. For instance, the governance of the FGD and FROB could balance ex officio members from the MdE, the Ministerio de Hacienda y Administraciones Públicas and the BdE with executives and/or other independent members appointed by the authorities. This would allow a wider range of views, as well as a more informed decision-making that takes into account different perspectives.
79. In the medium term the institutional framework for resolution will need to be realigned and streamlined. Two financial sector agencies such as the FROB and the FGD have separate functions in important respects, but also share many similarities in their powers and organizational structures. Their role as operational and financing arms in a resolution will have to be defined. Building upon reinforced resolution tools, the identification of a resolution authority will also require careful thinking. Both the institutional and operational framework must ensure timely and effective action in crisis management and resolution and appropriate accountability arrangements should be put in place. The BdE should continue to be closely involved in the resolution process and the Government should preserve its overarching mandate of preserving financial stability.
V. ANTI-MONEY LAUNDERING AND COMBATING THE FINANCING OF TERRORISM
(AML/CFT)
80. An AML/CFT assessment of Spain was last conducted by the Financial Action Task Force (FATF) on Money Laundering in September 2005, more than five years since the previous FSAP. A full AML/CFT reassessment is required according to IMF Board decisions regarding the incorporation of AML/CFT into the FSAP. Given that a new methodology will be published in 2012 H2, the authorities have expressed a preference to undertake the AML/CFT assessment under the revised standards. They are currently in discussions with FATF to schedule the assessment sometime in 2013 which would fit within the policy of the FSAP. A ROSC will be forwarded to the Fund and subsequently circulated to the Board upon adoption of the mutual evaluation report by the FATF Plenary.
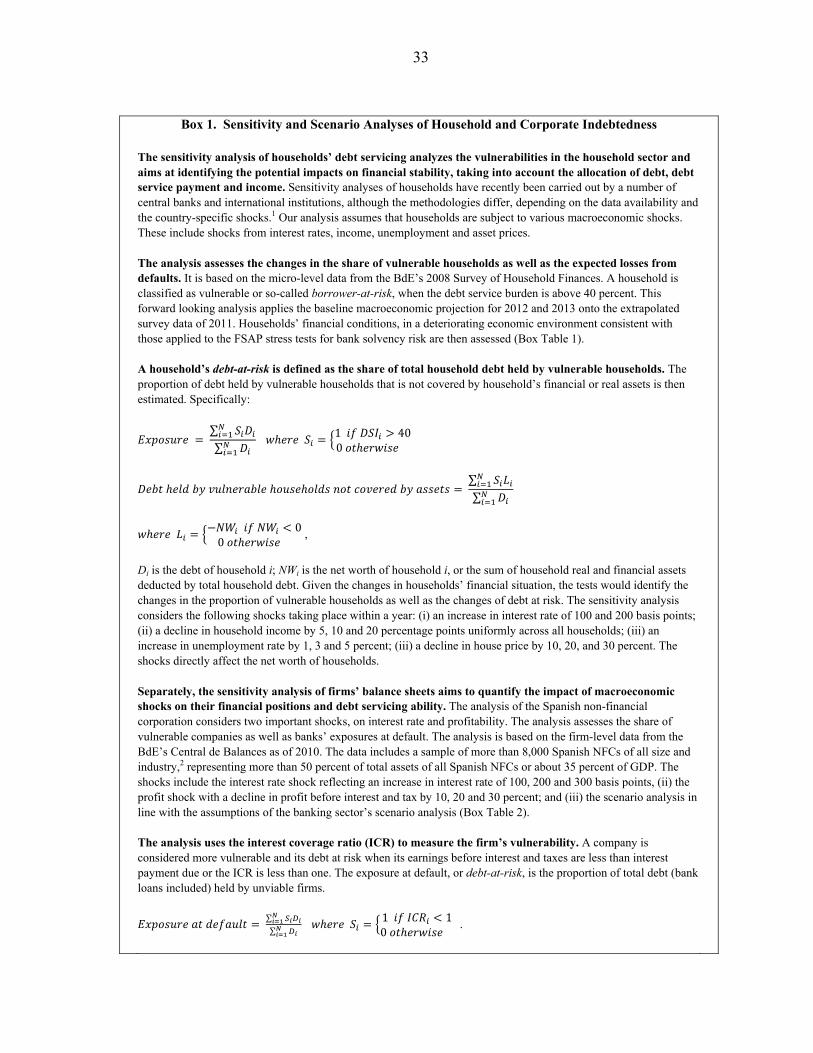
33
Box 1. Sensitivity and Scenario Analyses of Household and Corporate Indebtedness
The sensitivity analysis of households’ debt servicing analyzes the vulnerabilities in the household sector and aims at identifying the potential impacts on financial stability, taking into account the allocation of debt, debt service payment and income. Sensitivity analyses of households have recently been carried out by a number of central banks and international institutions, although the methodologies differ, depending on the data availability and the country-specific shocks.1 Our analysis assumes that households are subject to various macroeconomic shocks. These include shocks from interest rates, income, unemployment and asset prices. The analysis assesses the changes in the share of vulnerable households as well as the expected losses from defaults. It is based on the micro-level data from the BdE’s 2008 Survey of Household Finances. A household is classified as vulnerable or so-called borrower-at-risk, when the debt service burden is above 40 percent. This forward looking analysis applies the baseline macroeconomic projection for 2012 and 2013 onto the extrapolated survey data of 2011. Households’ financial conditions, in a deteriorating economic environment consistent with those applied to the FSAP stress tests for bank solvency risk are then assessed (Box Table 1). A household’s debt-at-risk is defined as the share of total household debt held by vulnerable households. The proportion of debt held by vulnerable households that is not covered by household’s financial or real assets is then estimated. Specifically:
∑
∑ 1 40
0
∑
∑
00
,
Di is the debt of household i; NWi is the net worth of household i, or the sum of household real and financial assets deducted by total household debt. Given the changes in households’ financial situation, the tests would identify the changes in the proportion of vulnerable households as well as the changes of debt at risk. The sensitivity analysis considers the following shocks taking place within a year: (i) an increase in interest rate of 100 and 200 basis points; (ii) a decline in household income by 5, 10 and 20 percentage points uniformly across all households; (iii) an increase in unemployment rate by 1, 3 and 5 percent; (iii) a decline in house price by 10, 20, and 30 percent. The shocks directly affect the net worth of households. Separately, the sensitivity analysis of firms’ balance sheets aims to quantify the impact of macroeconomic shocks on their financial positions and debt servicing ability. The analysis of the Spanish non-financial corporation considers two important shocks, on interest rate and profitability. The analysis assesses the share of vulnerable companies as well as banks’ exposures at default. The analysis is based on the firm-level data from the BdE’s Central de Balances as of 2010. The data includes a sample of more than 8,000 Spanish NFCs of all size and industry,2 representing more than 50 percent of total assets of all Spanish NFCs or about 35 percent of GDP. The shocks include the interest rate shock reflecting an increase in interest rate of 100, 200 and 300 basis points, (ii) the profit shock with a decline in profit before interest and tax by 10, 20 and 30 percent; and (iii) the scenario analysis in line with the assumptions of the banking sector’s scenario analysis (Box Table 2). The analysis uses the interest coverage ratio (ICR) to measure the firm’s vulnerability. A company is considered more vulnerable and its debt at risk when its earnings before interest and taxes are less than interest payment due or the ICR is less than one. The exposure at default, or debt-at-risk, is the proportion of total debt (bank loans included) held by unviable firms.
∑
∑ 1 1
0 .
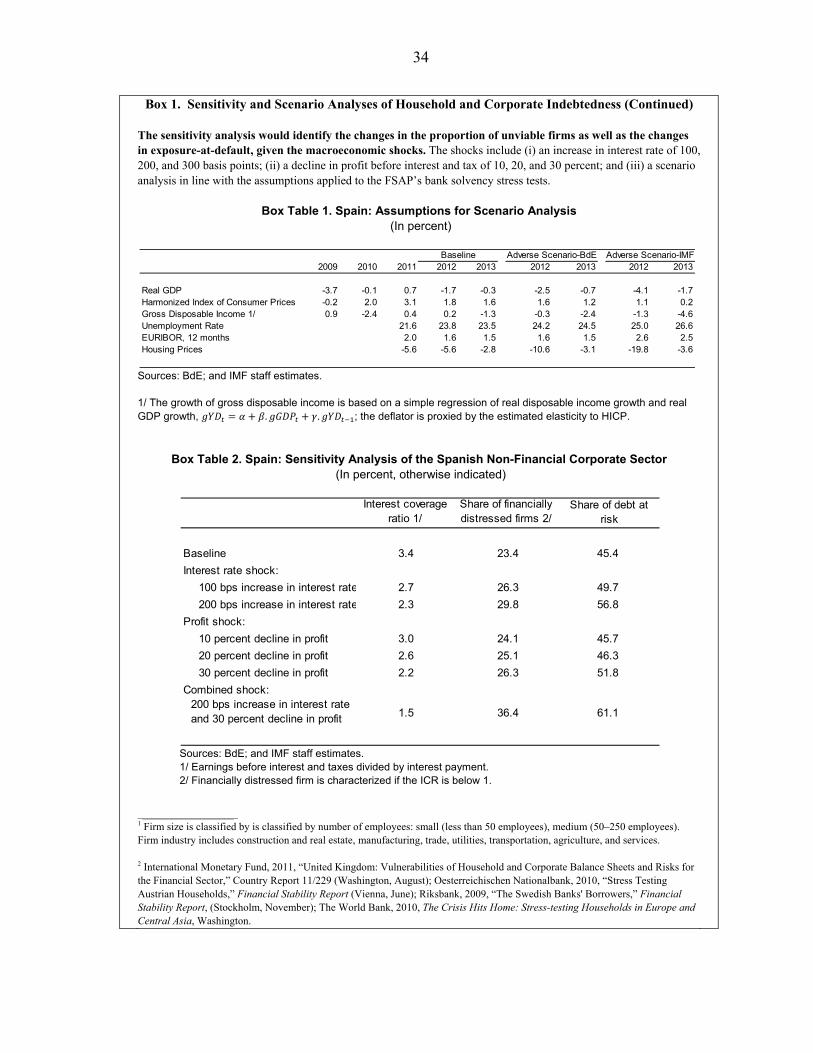
34
Box 1. Sensitivity and Scenario Analyses of Household and Corporate Indebtedness (Continued) The sensitivity analysis would identify the changes in the proportion of unviable firms as well as the changes in exposure-at-default, given the macroeconomic shocks. The shocks include (i) an increase in interest rate of 100, 200, and 300 basis points; (ii) a decline in profit before interest and tax of 10, 20, and 30 percent; and (iii) a scenario analysis in line with the assumptions applied to the FSAP’s bank solvency stress tests.
Box Table 1. Spain: Assumptions for Scenario Analysis (In percent)
Sources: BdE; and IMF staff estimates. 1/ The growth of gross disposable income is based on a simple regression of real disposable income growth and real GDP growth, . . ; the deflator is proxied by the estimated elasticity to HICP.
Box Table 2. Spain: Sensitivity Analysis of the Spanish Non-Financial Corporate Sector
(In percent, otherwise indicated)
Sources: BdE; and IMF staff estimates. 1/ Earnings before interest and taxes divided by interest payment. 2/ Financially distressed firm is characterized if the ICR is below 1.
_____________________ 1 Firm size is classified by is classified by number of employees: small (less than 50 employees), medium (50–250 employees). Firm industry includes construction and real estate, manufacturing, trade, utilities, transportation, agriculture, and services. 2 International Monetary Fund, 2011, “United Kingdom: Vulnerabilities of Household and Corporate Balance Sheets and Risks for the Financial Sector,” Country Report 11/229 (Washington, August); Oesterreichischen Nationalbank, 2010, “Stress Testing Austrian Households,” Financial Stability Report (Vienna, June); Riksbank, 2009, “The Swedish Banks' Borrowers,” Financial Stability Report, (Stockholm, November); The World Bank, 2010, The Crisis Hits Home: Stress-testing Households in Europe and Central Asia, Washington.
2009 2010 2011 2012 2013 2012 2013 2012 2013
Real GDP -3.7 -0.1 0.7 -1.7 -0.3 -2.5 -0.7 -4.1 -1.7Harmonized Index of Consumer Prices -0.2 2.0 3.1 1.8 1.6 1.6 1.2 1.1 0.2Gross Disposable Income 1/ 0.9 -2.4 0.4 0.2 -1.3 -0.3 -2.4 -1.3 -4.6Unemployment Rate 21.6 23.8 23.5 24.2 24.5 25.0 26.6EURIBOR, 12 months 2.0 1.6 1.5 1.6 1.5 2.6 2.5Housing Prices -5.6 -5.6 -2.8 -10.6 -3.1 -19.8 -3.6
Baseline Adverse Scenario-BdE Adverse Scenario-IMF
Interest coverage ratio 1/
Share of financially distressed firms 2/
Share of debt at risk
Baseline 3.4 23.4 45.4
Interest rate shock:
100 bps increase in interest rate 2.7 26.3 49.7
200 bps increase in interest rate 2.3 29.8 56.8
Profit shock:
10 percent decline in profit 3.0 24.1 45.7
20 percent decline in profit 2.6 25.1 46.3
30 percent decline in profit 2.2 26.3 51.8
Combined shock:200 bps increase in interest rate and 30 percent decline in profit 1.5 36.4 61.1
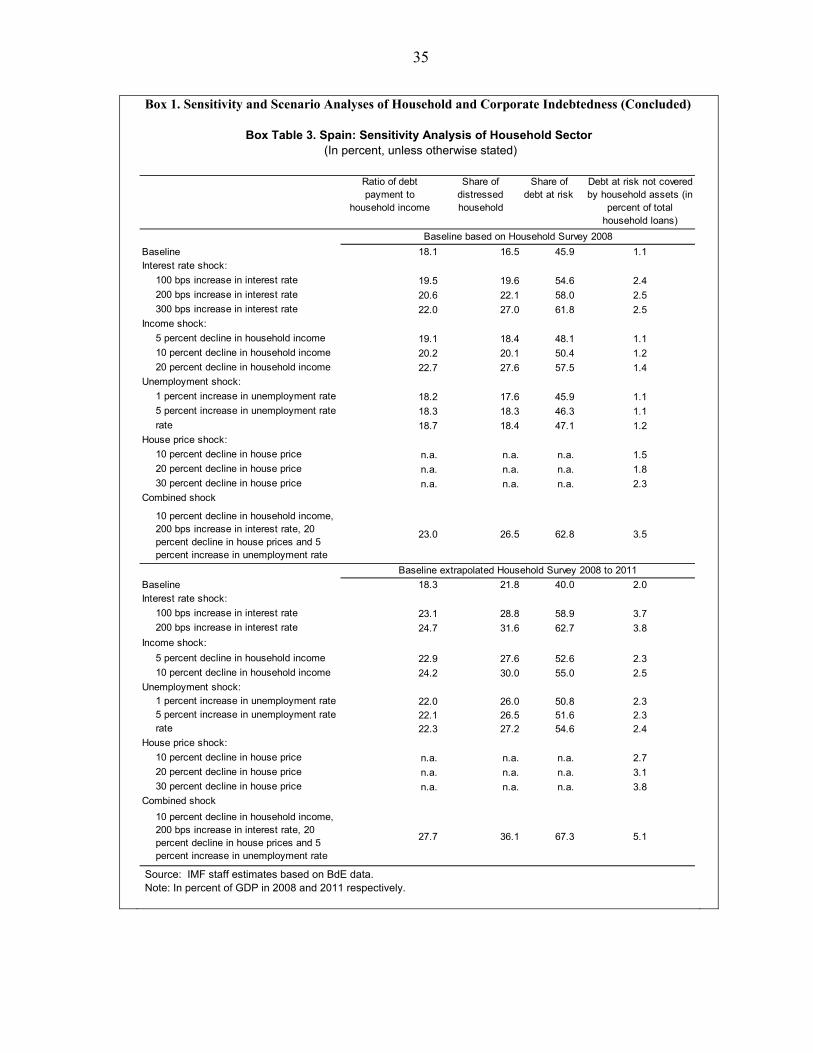
35
Box 1. Sensitivity and Scenario Analyses of Household and Corporate Indebtedness (Concluded)
Box Table 3. Spain: Sensitivity Analysis of Household Sector (In percent, unless otherwise stated)
Source: IMF staff estimates based on BdE data. Note: In percent of GDP in 2008 and 2011 respectively.
Ratio of debt payment to
household income
Share of distressed household
Share of debt at risk
Debt at risk not covered by household assets (in
percent of total household loans)
Baseline 18.1 16.5 45.9 1.1Interest rate shock:
100 bps increase in interest rate 19.5 19.6 54.6 2.4200 bps increase in interest rate 20.6 22.1 58.0 2.5300 bps increase in interest rate 22.0 27.0 61.8 2.5
Income shock:
5 percent decline in household income 19.1 18.4 48.1 1.110 percent decline in household income 20.2 20.1 50.4 1.220 percent decline in household income 22.7 27.6 57.5 1.4
Unemployment shock:
1 percent increase in unemployment rate 18.2 17.6 45.9 1.15 percent increase in unemployment rate 18.3 18.3 46.3 1.1rate 18.7 18.4 47.1 1.2
House price shock:
10 percent decline in house price n.a. n.a. n.a. 1.520 percent decline in house price n.a. n.a. n.a. 1.830 percent decline in house price n.a. n.a. n.a. 2.3
Combined shock
10 percent decline in household income, 200 bps increase in interest rate, 20 percent decline in house prices and 5 percent increase in unemployment rate
23.0 26.5 62.8 3.5
Baseline 18.3 21.8 40.0 2.0Interest rate shock:
100 bps increase in interest rate 23.1 28.8 58.9 3.7200 bps increase in interest rate 24.7 31.6 62.7 3.8
Income shock:
5 percent decline in household income 22.9 27.6 52.6 2.310 percent decline in household income 24.2 30.0 55.0 2.5
Unemployment shock: 1 percent increase in unemployment rate 22.0 26.0 50.8 2.35 percent increase in unemployment rate 22.1 26.5 51.6 2.3rate 22.3 27.2 54.6 2.4
House price shock:
10 percent decline in house price n.a. n.a. n.a. 2.720 percent decline in house price n.a. n.a. n.a. 3.130 percent decline in house price n.a. n.a. n.a. 3.8
Combined shock
10 percent decline in household income, 200 bps increase in interest rate, 20 percent decline in house prices and 5 percent increase in unemployment rate
27.7 36.1 67.3 5.1
Baseline based on Household Survey 2008
Baseline extrapolated Household Survey 2008 to 2011
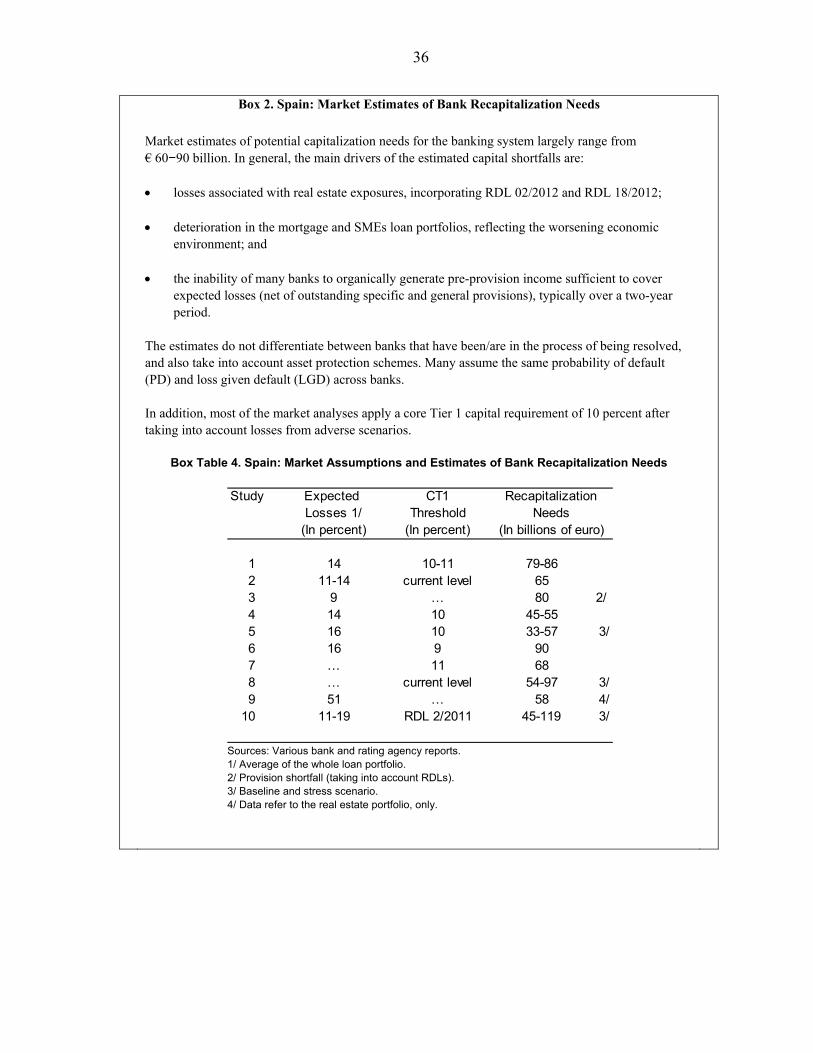
36
Box 2. Spain: Market Estimates of Bank Recapitalization Needs
Market estimates of potential capitalization needs for the banking system largely range from € 60−90 billion. In general, the main drivers of the estimated capital shortfalls are: losses associated with real estate exposures, incorporating RDL 02/2012 and RDL 18/2012;
deterioration in the mortgage and SMEs loan portfolios, reflecting the worsening economic
environment; and the inability of many banks to organically generate pre-provision income sufficient to cover
expected losses (net of outstanding specific and general provisions), typically over a two-year period.
The estimates do not differentiate between banks that have been/are in the process of being resolved, and also take into account asset protection schemes. Many assume the same probability of default (PD) and loss given default (LGD) across banks. In addition, most of the market analyses apply a core Tier 1 capital requirement of 10 percent after taking into account losses from adverse scenarios.
Box Table 4. Spain: Market Assumptions and Estimates of Bank Recapitalization Needs
Sources: Various bank and rating agency reports. 1/ Average of the whole loan portfolio. 2/ Provision shortfall (taking into account RDLs). 3/ Baseline and stress scenario. 4/ Data refer to the real estate portfolio, only.
Study Expected CT1Losses 1/ Threshold
(In percent) (In percent)
1 14 10-11 79-862 11-14 current level 653 9 … 80 2/4 14 10 45-555 16 10 33-57 3/6 16 9 907 … 11 688 … current level 54-97 3/9 51 … 58 4/
10 11-19 RDL 2/2011 45-119 3/
RecapitalizationNeeds
(In billions of euro)
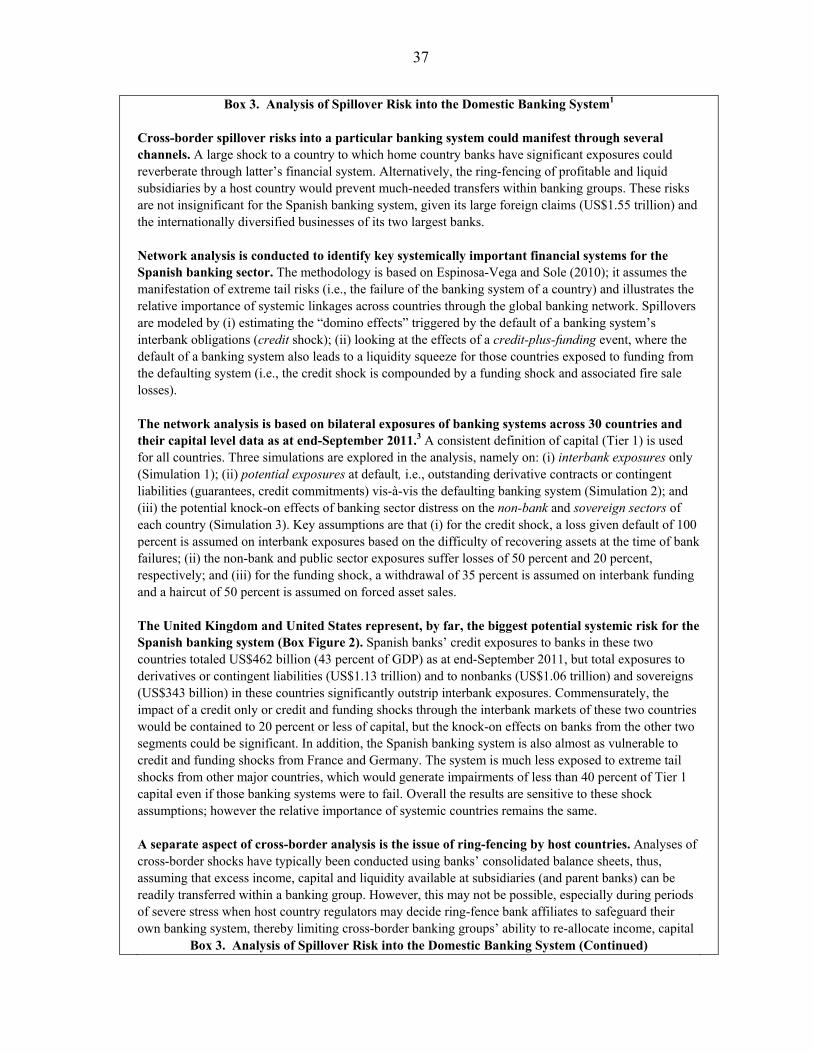
37
Box 3. Analysis of Spillover Risk into the Domestic Banking System1 Cross-border spillover risks into a particular banking system could manifest through several channels. A large shock to a country to which home country banks have significant exposures could reverberate through latter’s financial system. Alternatively, the ring-fencing of profitable and liquid subsidiaries by a host country would prevent much-needed transfers within banking groups. These risks are not insignificant for the Spanish banking system, given its large foreign claims (US$1.55 trillion) and the internationally diversified businesses of its two largest banks. Network analysis is conducted to identify key systemically important financial systems for the Spanish banking sector. The methodology is based on Espinosa-Vega and Sole (2010); it assumes the manifestation of extreme tail risks (i.e., the failure of the banking system of a country) and illustrates the relative importance of systemic linkages across countries through the global banking network. Spillovers are modeled by (i) estimating the “domino effects” triggered by the default of a banking system’s interbank obligations (credit shock); (ii) looking at the effects of a credit-plus-funding event, where the default of a banking system also leads to a liquidity squeeze for those countries exposed to funding from the defaulting system (i.e., the credit shock is compounded by a funding shock and associated fire sale losses). The network analysis is based on bilateral exposures of banking systems across 30 countries and their capital level data as at end-September 2011.3 A consistent definition of capital (Tier 1) is used for all countries. Three simulations are explored in the analysis, namely on: (i) interbank exposures only (Simulation 1); (ii) potential exposures at default, i.e., outstanding derivative contracts or contingent liabilities (guarantees, credit commitments) vis-à-vis the defaulting banking system (Simulation 2); and (iii) the potential knock-on effects of banking sector distress on the non-bank and sovereign sectors of each country (Simulation 3). Key assumptions are that (i) for the credit shock, a loss given default of 100 percent is assumed on interbank exposures based on the difficulty of recovering assets at the time of bank failures; (ii) the non-bank and public sector exposures suffer losses of 50 percent and 20 percent, respectively; and (iii) for the funding shock, a withdrawal of 35 percent is assumed on interbank funding and a haircut of 50 percent is assumed on forced asset sales. The United Kingdom and United States represent, by far, the biggest potential systemic risk for the Spanish banking system (Box Figure 2). Spanish banks’ credit exposures to banks in these two countries totaled US$462 billion (43 percent of GDP) as at end-September 2011, but total exposures to derivatives or contingent liabilities (US$1.13 trillion) and to nonbanks (US$1.06 trillion) and sovereigns (US$343 billion) in these countries significantly outstrip interbank exposures. Commensurately, the impact of a credit only or credit and funding shocks through the interbank markets of these two countries would be contained to 20 percent or less of capital, but the knock-on effects on banks from the other two segments could be significant. In addition, the Spanish banking system is also almost as vulnerable to credit and funding shocks from France and Germany. The system is much less exposed to extreme tail shocks from other major countries, which would generate impairments of less than 40 percent of Tier 1 capital even if those banking systems were to fail. Overall the results are sensitive to these shock assumptions; however the relative importance of systemic countries remains the same. A separate aspect of cross-border analysis is the issue of ring-fencing by host countries. Analyses of cross-border shocks have typically been conducted using banks’ consolidated balance sheets, thus, assuming that excess income, capital and liquidity available at subsidiaries (and parent banks) can be readily transferred within a banking group. However, this may not be possible, especially during periods of severe stress when host country regulators may decide ring-fence bank affiliates to safeguard their own banking system, thereby limiting cross-border banking groups’ ability to re-allocate income, capital
Box 3. Analysis of Spillover Risk into the Domestic Banking System (Continued)
38
and liquidity buffers from entities with excess to group entities with a shortage. During the crisis, bank regulators in Croatia, Poland, and Turkey, for example, recommended against the distribution of profits by subsidiaries of foreign banks despite relatively strong bank fundamentals. Cerutti et al. (2010) show that some large European banking groups could face substantial costs if ring fencing restrictions were to be imposed on their subsidiaries in Eastern Europe.4
Box Figure 2. Spain: Spillover and Ring-fencing Analysis
Source: IMF staff estimates.
0
20
40
60
80
100
120Simulation 1
Simulation 2
Simulation 3
Spillovers to Spain's Banking System: Credit Shock(Impairment as percent of Tier I capital)
0
20
40
60
80
100
120Simulation 1
Simulation 2
Simulation 3
Spillovers to Spain's Banking System: Credit and Funding Shock(Impairment as percent of Tier I capital)
8%
9%
9%
10%
10%
11%
11%
No-Ring Fencing Partial Ring Fencing
Ring-Fencing Based on EBABaseline Scenario: Core Tier 1 Ratio (at end-2013)
Santander
BBVA
Other large EU banks
0%
2%
4%
6%
8%
10%
12%
No-Ring Fencing Partial Ring Fencing
Rring-Fencing Based on EBA Adverse Scenario: Core Tier 1 Ratio (at end-2013)
Santander
BBVA
Other large EU banks
39
Box 3. Analysis of Spillover Risk into the Domestic Banking System (Concluded) While ring-fencing might be limited within the EU, it should be an important consideration for the two largest Spanish banks given their sizeable operations outside the region. Those businesses generate about one quarter of the banks’ income (averaged over the last five years) and constitute almost one-fifth of their assets. Since the onset of the financial crisis, these two banks have benefited from diversification away from the unfavorable domestic environment through their international operations, notably in Latin America. However, the advantages of diversification could be limited if non-EU regulators ring-fence their foreign subsidiaries. These two Spanish banks are examined for how they would fare if some form of ring-fencing were imposed on their subsidiaries under different scenarios of macroeconomic stress. Drawing on the methodology of Cerutti et al. (2010), the study is based on the outcomes of the June 2011 EBA stress testing exercise (baseline and adverse scenarios) for 2012−2013.5 It applies the assumption of partial ring-fencing of bank operations outside the EU, where only the projected profits within the group may be re-allocated from outside Europe. The results suggest that the banks could be affected somewhat by such actions by host country supervisors under adverse conditions (Box Figure 2). The two banks’ Core Tier 1 capital ratios would be 0.3−0.5 percentage points lower (at end-2013) under partial ring-fencing compared to if there was no ring-fencing, suggesting that the impact would be limited. _________ 1 Prepared by Serkan Arslanalp and Christian Schmieder (both MCM) and Eugenio Cerutti (RES). 2 Marco Espinosa-Vega and Juan Solé, 2010, “Cross-border Financial Surveillance: A Network Perspective,” IMF Working Paper 10/105 (Washington: International Monetary Fund). 3 All bilateral exposure data come from The Bank of International Settlements (BIS) consolidated banking statistics and are available as of end-September 2011 (Table 9C–E of BIS statistics) except for three countries—China, New Zealand, and South Korea, whose exposures are inferred from the foreign claims and liabilities of other countries. 4 Cerutti, Eugenio, Anna Ilyina, Yulia Makarova and Christian Schmieder , 2010, “…,” IMF Working Paper 10/247 (Washington: International Monetary Fund). 5 The analysis is based on publicly available data from Bankscope, adjusted by supervisory data and bank data.
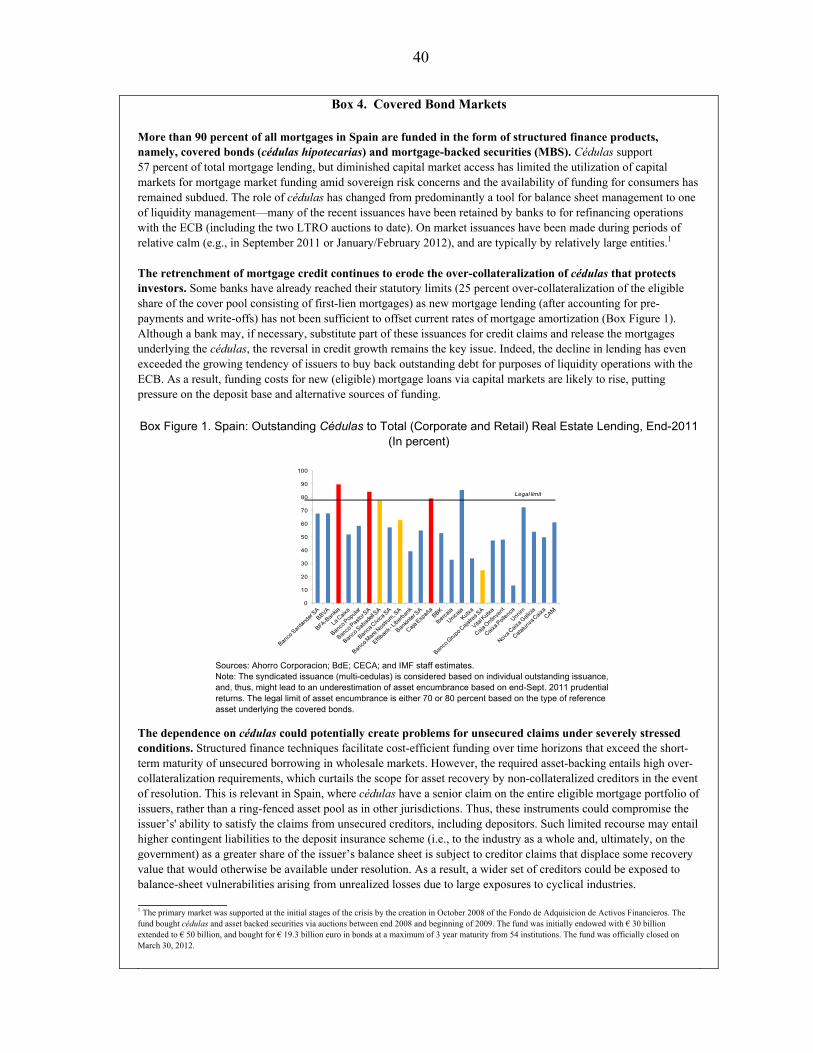
40
Box 4. Covered Bond Markets
More than 90 percent of all mortgages in Spain are funded in the form of structured finance products, namely, covered bonds (cédulas hipotecarias) and mortgage-backed securities (MBS). Cédulas support 57 percent of total mortgage lending, but diminished capital market access has limited the utilization of capital markets for mortgage market funding amid sovereign risk concerns and the availability of funding for consumers has remained subdued. The role of cédulas has changed from predominantly a tool for balance sheet management to one of liquidity management—many of the recent issuances have been retained by banks to for refinancing operations with the ECB (including the two LTRO auctions to date). On market issuances have been made during periods of relative calm (e.g., in September 2011 or January/February 2012), and are typically by relatively large entities.1
The retrenchment of mortgage credit continues to erode the over-collateralization of cédulas that protects investors. Some banks have already reached their statutory limits (25 percent over-collateralization of the eligible share of the cover pool consisting of first-lien mortgages) as new mortgage lending (after accounting for pre-payments and write-offs) has not been sufficient to offset current rates of mortgage amortization (Box Figure 1). Although a bank may, if necessary, substitute part of these issuances for credit claims and release the mortgages underlying the cédulas, the reversal in credit growth remains the key issue. Indeed, the decline in lending has even exceeded the growing tendency of issuers to buy back outstanding debt for purposes of liquidity operations with the ECB. As a result, funding costs for new (eligible) mortgage loans via capital markets are likely to rise, putting pressure on the deposit base and alternative sources of funding.
Box Figure 1. Spain: Outstanding Cédulas to Total (Corporate and Retail) Real Estate Lending, End-2011(In percent)
Sources: Ahorro Corporacion; BdE; CECA; and IMF staff estimates. Note: The syndicated issuance (multi-cedulas) is considered based on individual outstanding issuance, and, thus, might lead to an underestimation of asset encumbrance based on end-Sept. 2011 prudential returns. The legal limit of asset encumbrance is either 70 or 80 percent based on the type of reference asset underlying the covered bonds.
The dependence on cédulas could potentially create problems for unsecured claims under severely stressed conditions. Structured finance techniques facilitate cost-efficient funding over time horizons that exceed the short-term maturity of unsecured borrowing in wholesale markets. However, the required asset-backing entails high over-collateralization requirements, which curtails the scope for asset recovery by non-collateralized creditors in the event of resolution. This is relevant in Spain, where cédulas have a senior claim on the entire eligible mortgage portfolio of issuers, rather than a ring-fenced asset pool as in other jurisdictions. Thus, these instruments could compromise the issuer’s' ability to satisfy the claims from unsecured creditors, including depositors. Such limited recourse may entail higher contingent liabilities to the deposit insurance scheme (i.e., to the industry as a whole and, ultimately, on the government) as a greater share of the issuer’s balance sheet is subject to creditor claims that displace some recovery value that would otherwise be available under resolution. As a result, a wider set of creditors could be exposed to balance-sheet vulnerabilities arising from unrealized losses due to large exposures to cyclical industries. _______________ 1 The primary market was supported at the initial stages of the crisis by the creation in October 2008 of the Fondo de Adquisicion de Activos Financieros. The fund bought cédulas and asset backed securities via auctions between end 2008 and beginning of 2009. The fund was initially endowed with € 30 billion extended to € 50 billion, and bought for € 19.3 billion euro in bonds at a maximum of 3 year maturity from 54 institutions. The fund was officially closed on March 30, 2012.
0
10
20
30
40
50
60
70
80
90
100
Legal limit
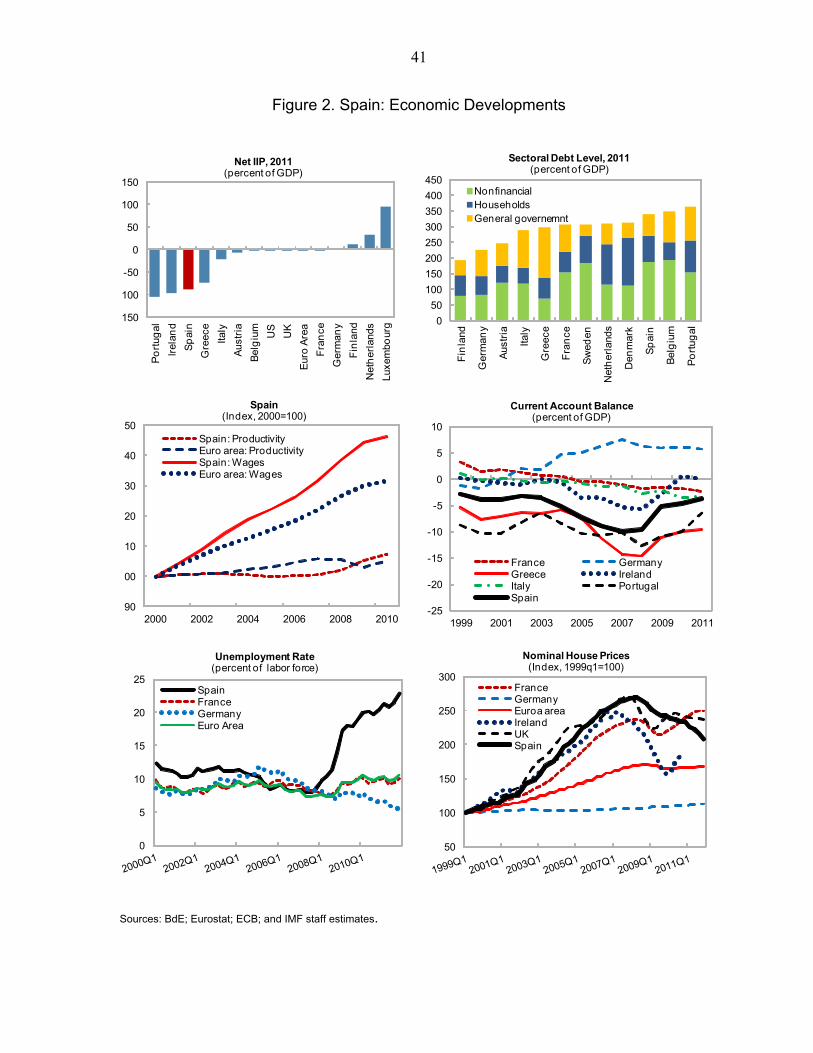
41
Figure 2. Spain: Economic Developments
Sources: BdE; Eurostat; ECB; and IMF staff estimates.
150
100
-50
0
50
100
150
Po
rtug
al
Irel
and
Sp
ain
Gre
ece
Italy
Aus
tria
Bel
giu
m
US
UK
Eur
o A
rea
Fra
nce
Ger
man
y
Fin
land
Net
her
land
s
Luxe
mbo
urg
Net IIP, 2011(percent of GDP)
-25
-20
-15
-10
-5
0
5
10
1999 2001 2003 2005 2007 2009 2011
France GermanyGreece IrelandItaly PortugalSpain
Current Account Balance(percent of GDP)
90
00
10
20
30
40
50
2000 2002 2004 2006 2008 2010
Spain: ProductivityEuro area: ProductivitySpain: WagesEuro area: Wages
Spain(Index, 2000=100)
0
50
100
150
200
250
300
350
400
450
Fin
land
Ger
man
y
Aus
tria
Italy
Gre
ece
Fra
nce
Sw
eden
Net
her
land
s
Den
mar
k
Sp
ain
Bel
giu
m
Po
rtug
al
NonfinancialHouseholdsGeneral governemnt
Sectoral Debt Level, 2011(percent of GDP)
0
5
10
15
20
25SpainFranceGermanyEuro Area
Unemployment Rate(percent of labor force)
50
100
150
200
250
300FranceGermanyEuroa areaIrelandUKSpain
Nominal House Prices(Index, 1999q1=100)
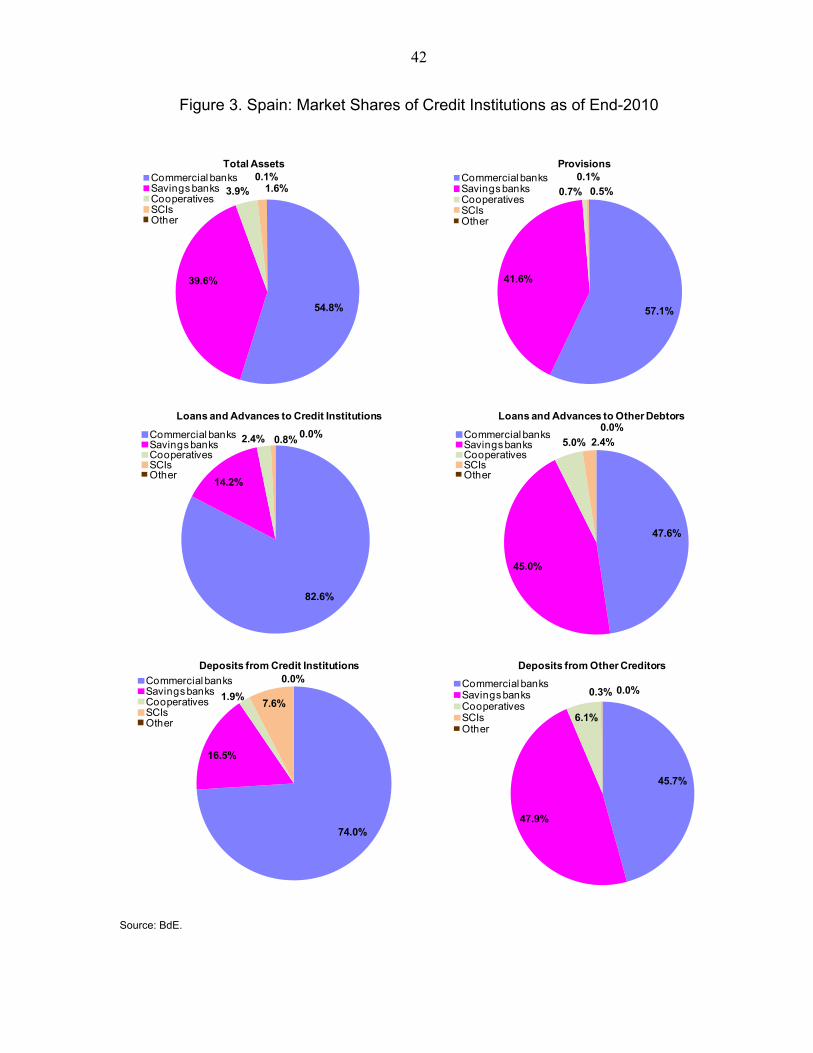
42
Figure 3. Spain: Market Shares of Credit Institutions as of End-2010
Source: BdE.
54.8%
39.6%
3.9% 1.6%0.1%
Total AssetsCommercial banksSavings banksCooperativesSCIsOther
57.1%
41.6%
0.7% 0.5%
0.1%Provisions
Commercial banksSavings banksCooperativesSCIsOther
82.6%
14.2%
2.4% 0.8% 0.0%
Loans and Advances to Credit Institutions
Commercial banksSavings banksCooperativesSCIsOther
47.6%
45.0%
5.0% 2.4%
0.0%Loans and Advances to Other Debtors
Commercial banksSavings banksCooperativesSCIsOther
74.0%
16.5%
1.9%7.6%
0.0%Deposits from Credit Institutions
Commercial banksSavings banksCooperativesSCIsOther
45.7%
47.9%
6.1%
0.3% 0.0%
Deposits from Other Creditors
Commercial banksSavings banksCooperativesSCIsOther
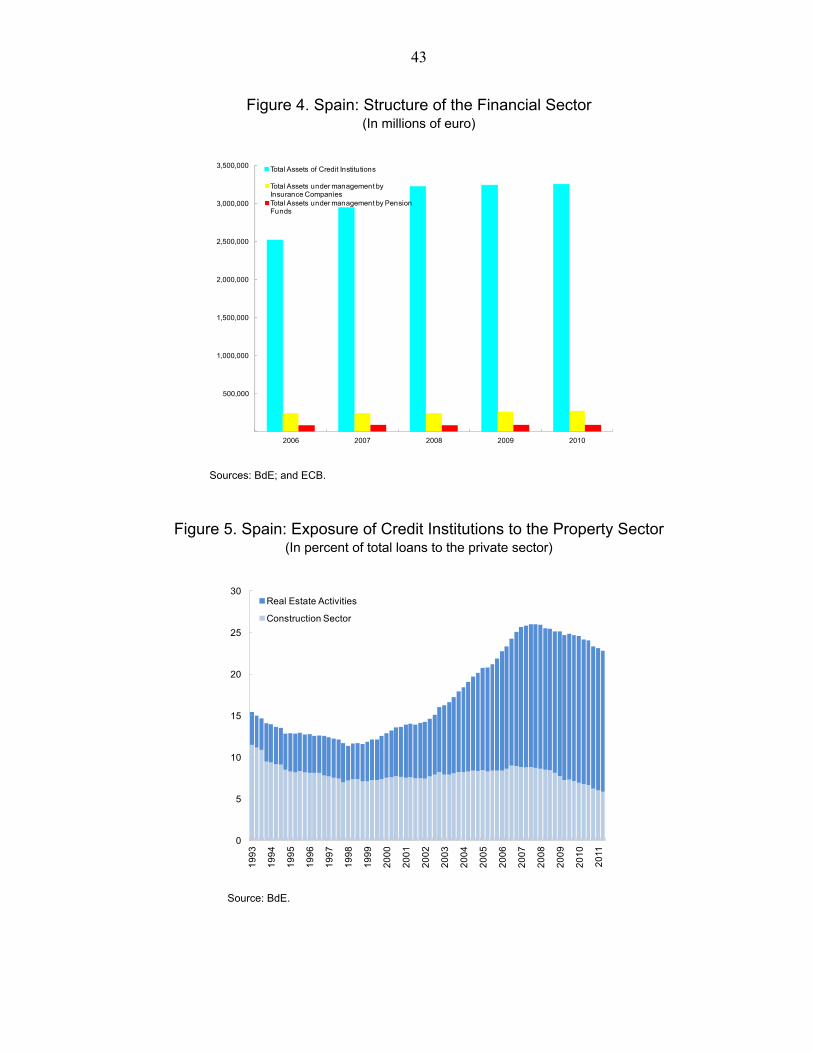
43
Figure 4. Spain: Structure of the Financial Sector (In millions of euro)
Sources: BdE; and ECB.
Figure 5. Spain: Exposure of Credit Institutions to the Property Sector
(In percent of total loans to the private sector)
Source: BdE.
500,000
1,000,000
1,500,000
2,000,000
2,500,000
3,000,000
3,500,000
2006 2007 2008 2009 2010
Total Assets of Credit Institutions
Total Assets under management by Insurance CompaniesTotal Assets under management by Pension Funds
0
5
10
15
20
25
30
19
93
19
94
19
95
19
96
19
97
19
98
19
99
20
00
20
01
20
02
20
03
20
04
20
05
20
06
20
07
20
08
20
09
20
10
20
11Real Estate Activities
Construction Sector
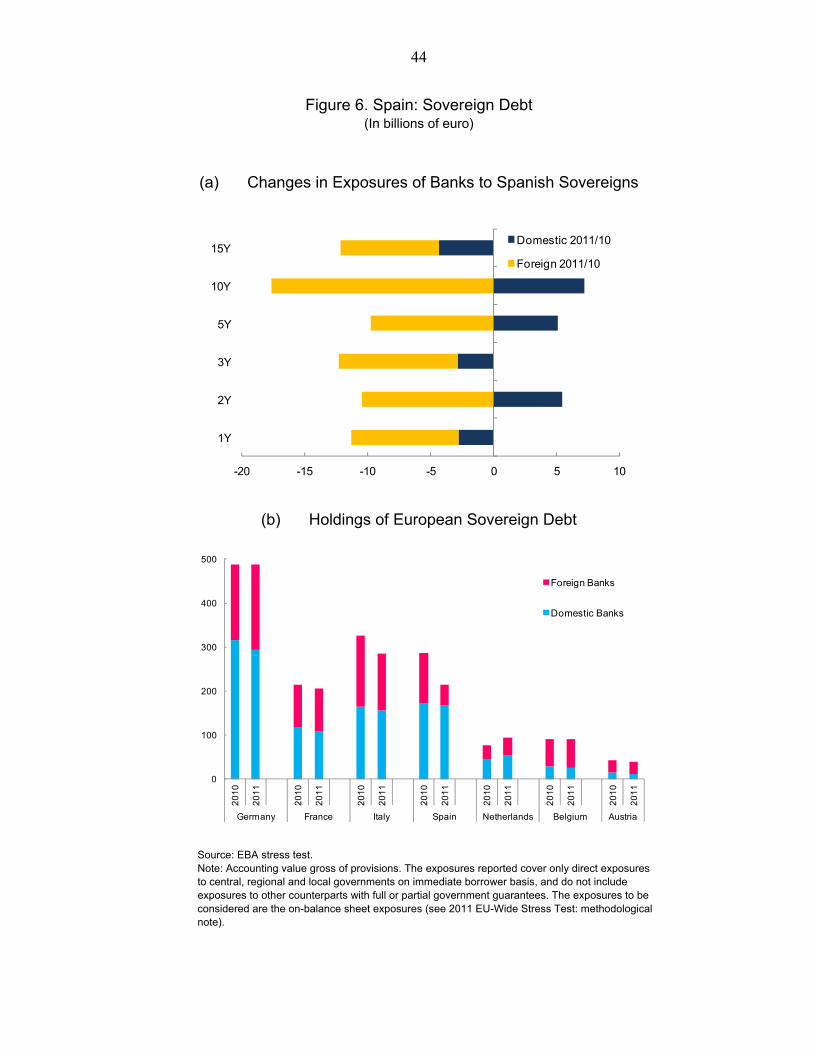
44
Figure 6. Spain: Sovereign Debt (In billions of euro)
(a) Changes in Exposures of Banks to Spanish Sovereigns
(b) Holdings of European Sovereign Debt
Source: EBA stress test. Note: Accounting value gross of provisions. The exposures reported cover only direct exposures to central, regional and local governments on immediate borrower basis, and do not include exposures to other counterparts with full or partial government guarantees. The exposures to be considered are the on-balance sheet exposures (see 2011 EU-Wide Stress Test: methodological note).
-20 -15 -10 -5 0 5 10
1Y
2Y
3Y
5Y
10Y
15YDomestic 2011/10
Foreign 2011/10
0
100
200
300
400
500
20
10
20
11
20
10
20
11
20
10
20
11
20
10
20
11
20
10
20
11
20
10
20
11
20
10
20
11
Germany France Italy Spain Netherlands Belgium Austria
Foreign Banks
Domestic Banks

45
Figure 7. Spain: Banking Sector Developments
Sources: BdE; and IMF staff estimates.
-10.0
-5.0
0.0
5.0
10.0
15.0
20.0
25.0
30.0
2005 2006 2007 2008 2009 2010 2011
(12-month percentage change)
Credit growth
Deposit growth
Credit and Deposits
0
50
100
150
200
250
300
350
400
0.0
2.0
4.0
6.0
8.0
10.0
12.0
2005 2006 2007 2008 2009 2010 2011
(in percent)
Provision to nonperforming loans ratio (RHS)Nonperforming loans ratio
Provisions and Non-Performing Loans
0.0
1.0
2.0
3.0
4.0
5.0
6.0
2005 2006 2007 2008 2009 2010 2011
(4 quarter rolling-sum over average assets/liabilities)
Interest income
Interest expenses
0.0
1.0
2.0
3.0
4.0
2005 2006 2007 2008 2009 2010 2011
(4 quarter rolling-sum over average assets)
Net interest margins
Other income
Net Interest Margin and Other Income
0.0
0.5
1.0
1.5
2005 2006 2007 2008 2009 2010 2011
(4 quarter rolling-sum over average assets)
Provisioning
Administrative costs
Provisions and Administrative Costs
-0.5
0.0
0.5
1.0
1.5
2.0
2005 2006 2007 2008 2009 2010 2011
(4 quarter rolling-sum over average assets)
Pre-tax profits
Pre-provision income
adjusted for repossessed assets
Interest Income and Interest Expense
Pre-Tax Profit and Pre-Provision Income
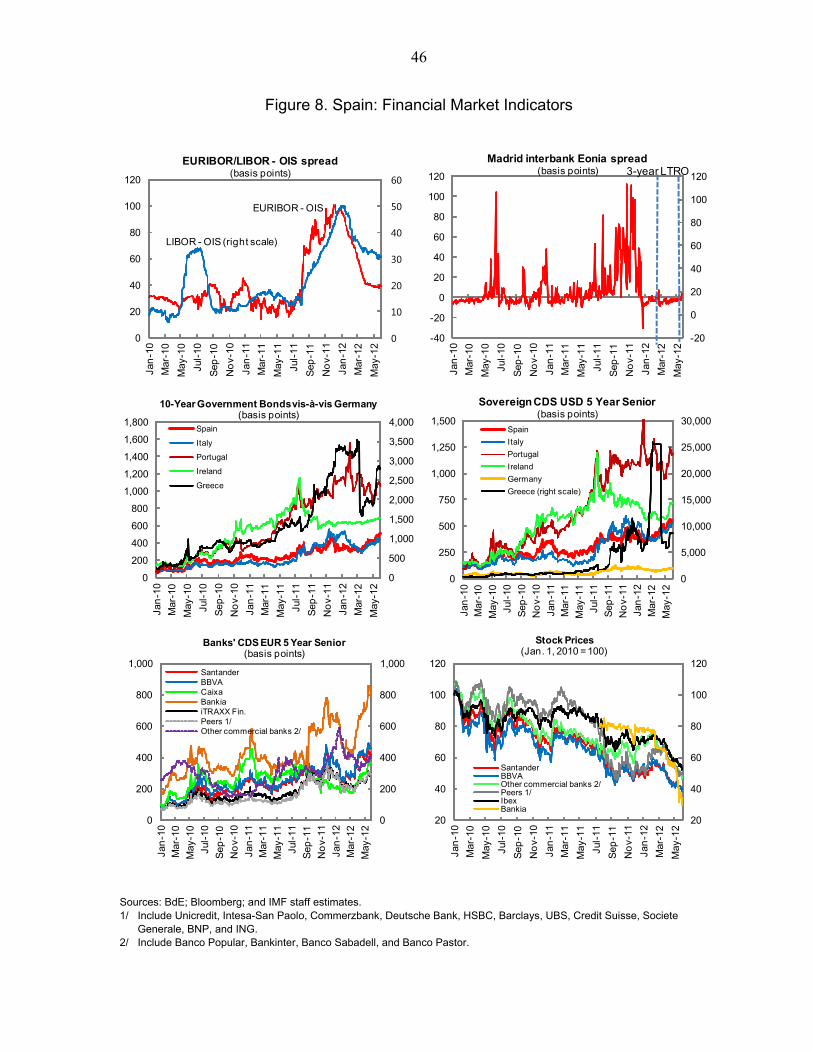
46
Figure 8. Spain: Financial Market Indicators
Sources: BdE; Bloomberg; and IMF staff estimates. 1/ Include Unicredit, Intesa-San Paolo, Commerzbank, Deutsche Bank, HSBC, Barclays, UBS, Credit Suisse, Societe
Generale, BNP, and ING. 2/ Include Banco Popular, Bankinter, Banco Sabadell, and Banco Pastor.
0
10
20
30
40
50
60
0
20
40
60
80
100
120
Jan
-10
Mar
-10
May
-10
Jul-
10
Sep
-10
No
v-10
Jan
-11
Mar
-11
May
-11
Jul-
11
Sep
-11
No
v-11
Jan
-12
Mar
-12
May
-12
EURIBOR/LIBOR - OIS spread(basis points)
EURIBOR - OIS
LIBOR - OIS (right scale)
-20
0
20
40
60
80
100
120
-40
-20
0
20
40
60
80
100
120
Jan
-10
Mar
-10
May
-10
Jul-
10
Sep
-10
No
v-10
Jan
-11
Mar
-11
May
-11
Jul-
11
Sep
-11
No
v-11
Jan
-12
Mar
-12
May
-12
Madrid interbank Eonia spread(basis points)
0
500
1,000
1,500
2,000
2,500
3,000
3,500
4,000
0
200
400
600
800
1,000
1,200
1,400
1,600
1,800
Jan
-10
Mar
-10
May
-10
Jul-
10
Sep
-10
No
v-10
Jan
-11
Mar
-11
May
-11
Jul-
11
Sep
-11
No
v-11
Jan
-12
Mar
-12
May
-12
10-Year Government Bonds vis-à-vis Germany(basis points)
Spain
Italy
Portugal
Ireland
Greece
0
5,000
10,000
15,000
20,000
25,000
30,000
0
250
500
750
1,000
1,250
1,500
Jan
-10
Mar
-10
May
-10
Jul-
10
Sep
-10
No
v-10
Jan
-11
Mar
-11
May
-11
Jul-
11
Sep
-11
No
v-11
Jan
-12
Mar
-12
May
-12
Sovereign CDS USD 5 Year Senior(basis points)
Spain
Italy
Portugal
Ireland
Germany
Greece (right scale)
0
200
400
600
800
1,000
0
200
400
600
800
1,000
Jan
-10
Mar
-10
May
-10
Jul-
10
Sep
-10
No
v-10
Jan
-11
Mar
-11
May
-11
Jul-
11
Sep
-11
No
v-11
Jan
-12
Mar
-12
May
-12
Banks' CDS EUR 5 Year Senior(basis points)
SantanderBBVACaixaBankiaiTRAXX Fin.Peers 1/Other commercial banks 2/
20
40
60
80
100
120
20
40
60
80
100
120
Jan
-10
Mar
-10
May
-10
Jul-
10
Sep
-10
No
v-10
Jan
-11
Mar
-11
May
-11
Jul-
11
Sep
-11
No
v-11
Jan
-12
Mar
-12
May
-12
Stock Prices(Jan. 1, 2010 = 100)
SantanderBBVAOther commercial banks 2/Peers 1/IbexBankia
3-year LTRO
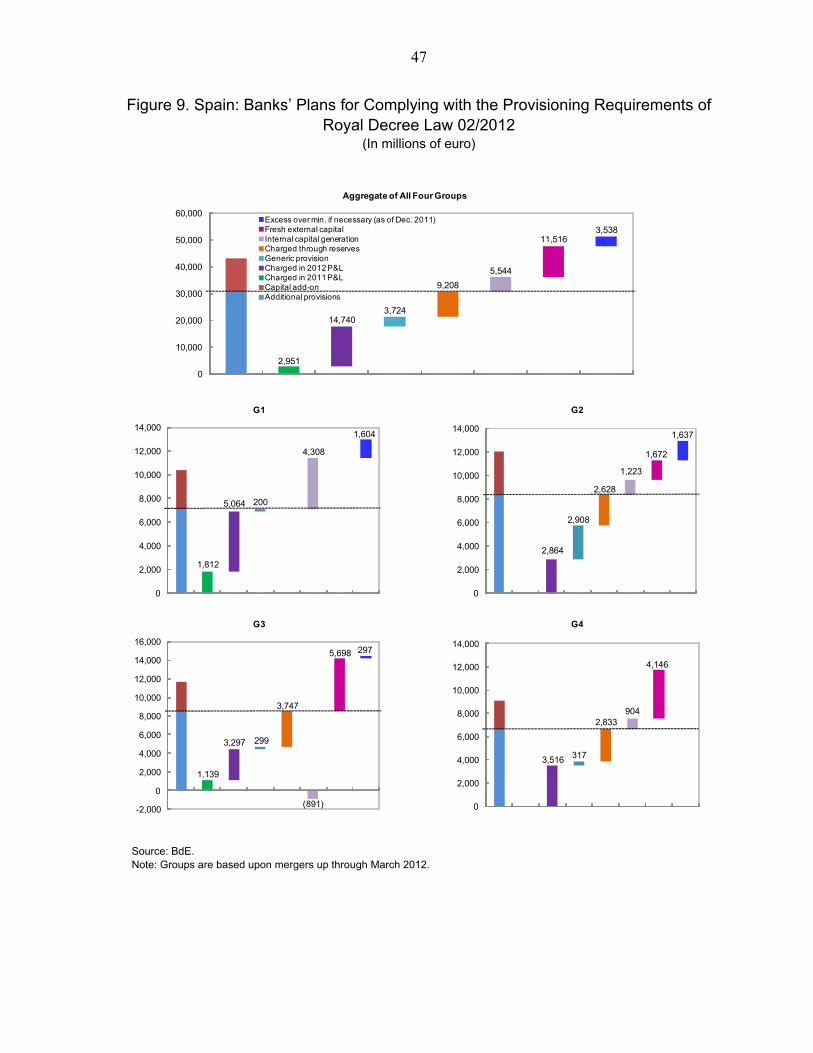
47
Figure 9. Spain: Banks’ Plans for Complying with the Provisioning Requirements of Royal Decree Law 02/2012
(In millions of euro)
Source: BdE. Note: Groups are based upon mergers up through March 2012.
2,951
14,7403,724
9,208
5,544
11,516 3,538
0
10,000
20,000
30,000
40,000
50,000
60,000
Aggregate of All Four Groups
Excess over min. if necessary (as of Dec. 2011)Fresh external capitalInternal capital generationCharged through reservesGeneric provisionCharged in 2012 P&LCharged in 2011 P&LCapital add-onAdditional provisions
1,812
5,064 200
4,308
1,604
0
2,000
4,000
6,000
8,000
10,000
12,000
14,000
G1
2,864
2,908
2,628
1,223
1,672
1,637
0
2,000
4,000
6,000
8,000
10,000
12,000
14,000
G2
1,139
3,297 299
3,747
(891)
5,698 297
-2,000
0
2,000
4,000
6,000
8,000
10,000
12,000
14,000
16,000
G3
3,516 317
2,833904
4,146
0
2,000
4,000
6,000
8,000
10,000
12,000
14,000
G4
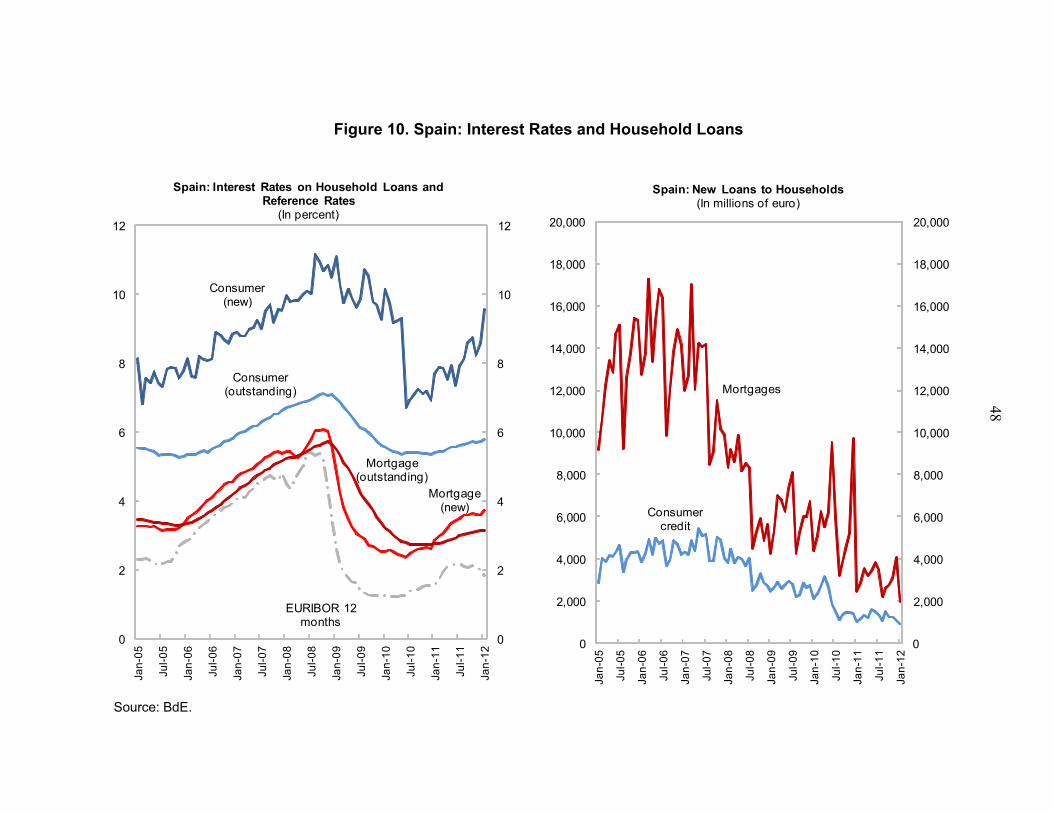
48
Figure 10. Spain: Interest Rates and Household Loans
Source: BdE.
Consumer credit
Mortgages
0
2,000
4,000
6,000
8,000
10,000
12,000
14,000
16,000
18,000
20,000
0
2,000
4,000
6,000
8,000
10,000
12,000
14,000
16,000
18,000
20,000
Jan
-05
Jul-
05
Jan
-06
Jul-
06
Jan
-07
Jul-
07
Jan
-08
Jul-
08
Jan
-09
Jul-
09
Jan
-10
Jul-
10
Jan
-11
Jul-
11
Jan
-12
Spain: New Loans to Households (In millions of euro)
Mortgage (new)
Consumer (new)
Mortgage (outstanding)
Consumer (outstanding)
EURIBOR 12 months
0
2
4
6
8
10
12
0
2
4
6
8
10
12
Jan
-05
Jul-
05
Jan
-06
Jul-
06
Jan
-07
Jul-
07
Jan
-08
Jul-
08
Jan
-09
Jul-
09
Jan
-10
Jul-
10
Jan
-11
Jul-
11
Jan
-12
Spain: Interest Rates on Household Loans and Reference Rates
(In percent)
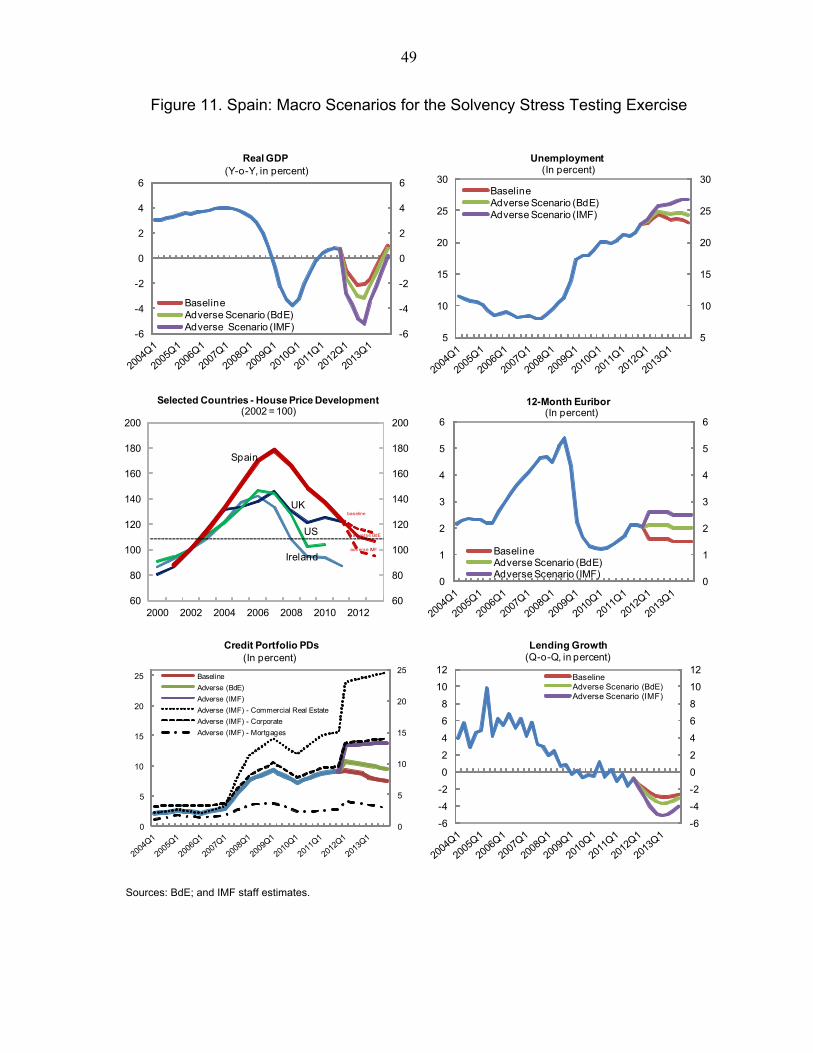
49
Figure 11. Spain: Macro Scenarios for the Solvency Stress Testing Exercise
Sources: BdE; and IMF staff estimates.
-6
-4
-2
0
2
4
6
-6
-4
-2
0
2
4
6
Real GDP
BaselineAdverse Scenario (BdE)Adverse Scenario (IMF)
(Y-o-Y, in percent)
5
10
15
20
25
30
5
10
15
20
25
30
Unemployment
BaselineAdverse Scenario (BdE)Adverse Scenario (IMF)
(In percent)
0
1
2
3
4
5
6
0
1
2
3
4
5
6
12-Month Euribor
BaselineAdverse Scenario (BdE)Adverse Scenario (IMF)
(In percent)
-6
-4
-2
0
2
4
6
8
10
12
-6
-4
-2
0
2
4
6
8
10
12
Lending Growth
BaselineAdverse Scenario (BdE)Adverse Scenario (IMF)
(Q-o-Q, in percent)
US
UK
Ireland
Spain
60
80
100
120
140
160
180
200
60
80
100
120
140
160
180
200
2000 2002 2004 2006 2008 2010 2012
Selected Countries - House Price Development (2002 = 100)
adverse IMF
baseline
adverse BdE
0
5
10
15
20
25
0
5
10
15
20
25
Credit Portfolio PDs
Baseline
Adverse (BdE)
Adverse (IMF)
Adverse (IMF) - Commercial Real Estate
Adverse (IMF) - Corporate
Adverse (IMF) - Mortgages
(In percent)
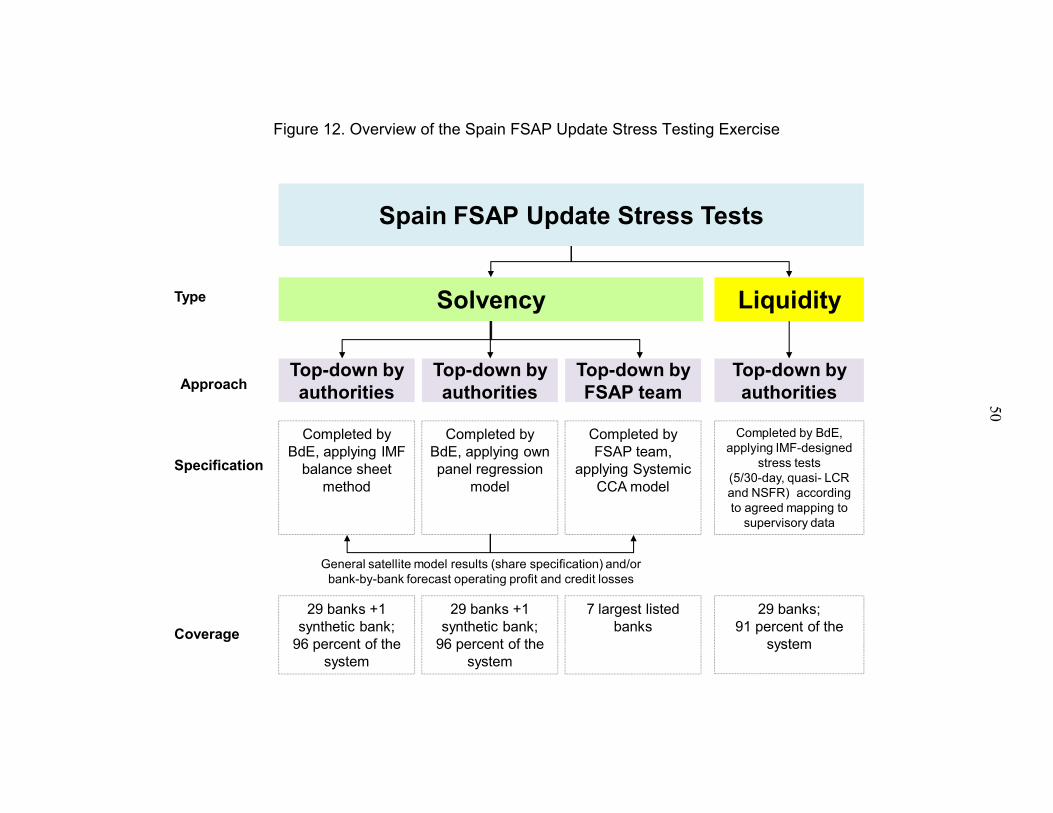
50
Figure 12. Overview of the Spain FSAP Update Stress Testing Exercise
Spain FSAP Update Stress Tests
Solvency Liquidity
Top-down by authorities
Completed by BdE, applying IMF
balance sheet method
Top-down by authorities
Completed by BdE, applying own panel regression
model
29 banks +1 synthetic bank;
96 percent of the system
Coverage
Specification
Type
Top-down by FSAP team
Completed by FSAP team,
applying Systemic CCA model
Top-down by authorities
Completed by BdE, applying IMF-designed
stress tests(5/30-day, quasi- LCR and NSFR) according to agreed mapping to
supervisory data
29 banks +1 synthetic bank;
96 percent of the system
7 largest listed banks
29 banks;91 percent of the
system
General satellite model results (share specification) and/or bank-by-bank forecast operating profit and credit losses
Approach
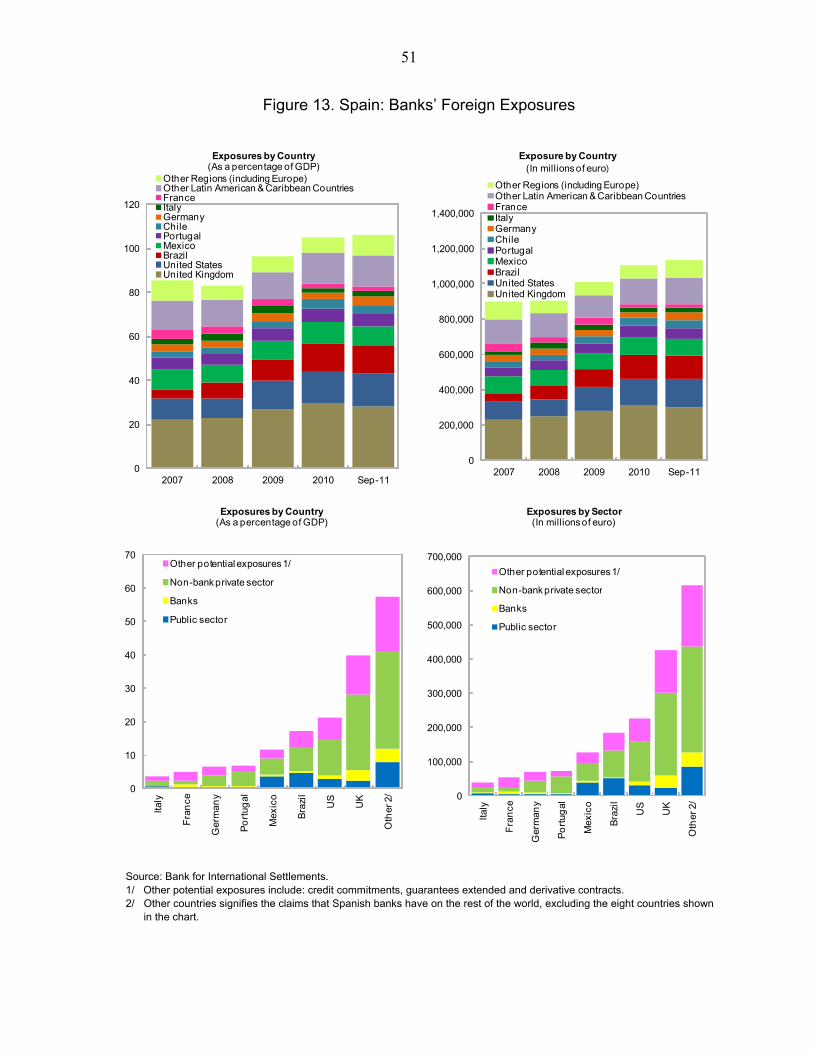
51
Figure 13. Spain: Banks’ Foreign Exposures
Source: Bank for International Settlements. 1/ Other potential exposures include: credit commitments, guarantees extended and derivative contracts. 2/ Other countries signifies the claims that Spanish banks have on the rest of the world, excluding the eight countries shown
in the chart.
0
20
40
60
80
100
120
2007 2008 2009 2010 Sep-11
Other Regions (including Europe)Other Latin American & Caribbean CountriesFranceItalyGermanyChilePortugalMexicoBrazilUnited StatesUnited Kingdom
Exposures by Country(As a percentage of GDP)
0
200,000
400,000
600,000
800,000
1,000,000
1,200,000
1,400,000
2007 2008 2009 2010 Sep-11
Other Regions (including Europe)Other Latin American & Caribbean CountriesFranceItalyGermanyChilePortugalMexicoBrazilUnited StatesUnited Kingdom
Exposure by Country(In millions of euro)
0
10
20
30
40
50
60
70
Italy
Fra
nce
Ger
man
y
Po
rtug
al
Mex
ico
Bra
zil
US
UK
Oth
er 2
/
Other potential exposures 1/
Non-bank private sector
Banks
Public sector
Exposures by Country(As a percentage of GDP)
0
100,000
200,000
300,000
400,000
500,000
600,000
700,000
Italy
Fra
nce
Ger
man
y
Po
rtug
al
Mex
ico
Bra
zil
US
UK
Oth
er 2
/
Other potential exposures 1/
Non-bank private sector
Banks
Public sector
Exposures by Sector(In millions of euro)
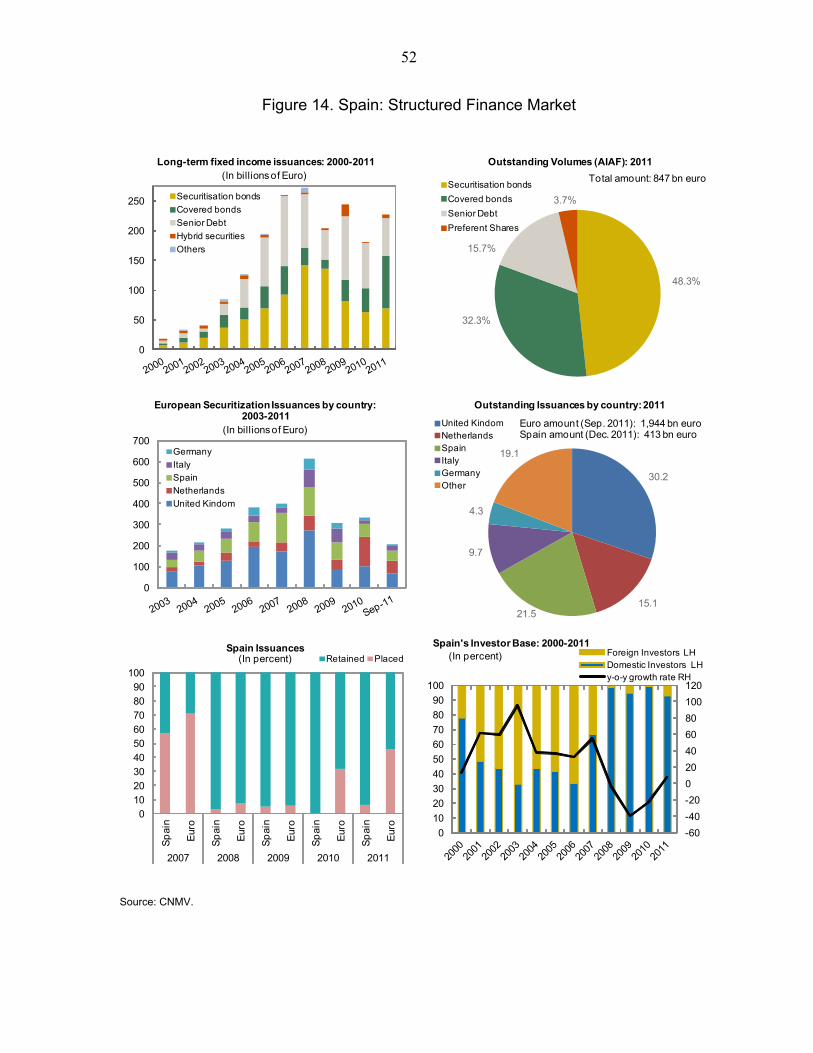
52
Figure 14. Spain: Structured Finance Market
Source: CNMV.
0
50
100
150
200
250
Long-term fixed income issuances: 2000-2011
Securitisation bonds
Covered bonds
Senior Debt
Hybrid securities
Others
(In billions of Euro)
48.3%
32.3%
15.7%
3.7%
Outstanding Volumes (AIAF): 2011
Securitisation bonds
Covered bonds
Senior Debt
Preferent Shares
Total amount: 847 bn euro
0
100
200
300
400
500
600
700
European Securitization Issuances by country: 2003-2011
Germany
Italy
Spain
Netherlands
United Kindom
(In billions of Euro)
30.2
15.121.5
9.7
4.3
19.1
Outstanding Issuances by country: 2011
United KindomNetherlandsSpainItalyGermanyOther
Euro amount (Sep. 2011): 1,944 bn euro Spain amount (Dec. 2011): 413 bn euro
0102030405060708090
100
Sp
ain
Eur
o
Sp
ain
Eur
o
Sp
ain
Eur
o
Sp
ain
Eur
o
Sp
ain
Eur
o
2007 2008 2009 2010 2011
Spain IssuancesRetained Placed(In percent)
-60
-40
-20
0
20
40
60
80
100
120
0
10
20
30
40
50
60
70
80
90
100
Spain's Investor Base: 2000-2011Foreign Investors LHDomestic Investors LHy-o-y growth rate RH
(In percent)
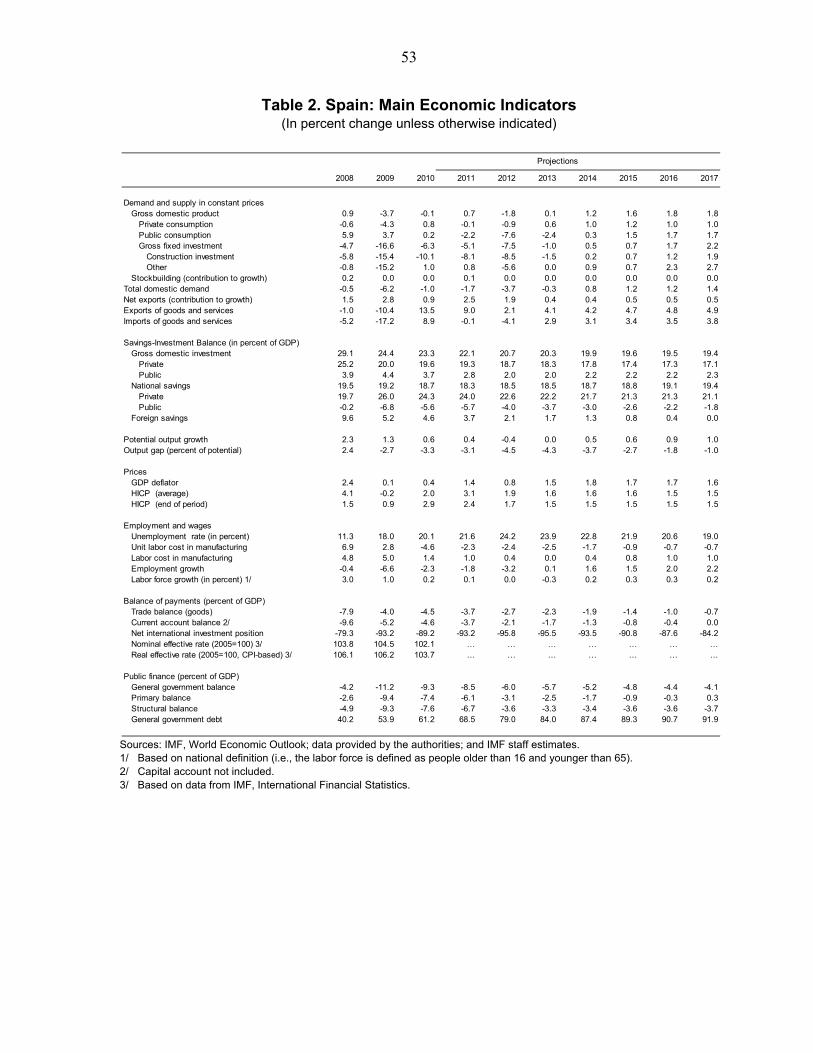
53
Table 2. Spain: Main Economic Indicators (In percent change unless otherwise indicated)
Sources: IMF, World Economic Outlook; data provided by the authorities; and IMF staff estimates. 1/ Based on national definition (i.e., the labor force is defined as people older than 16 and younger than 65). 2/ Capital account not included. 3/ Based on data from IMF, International Financial Statistics.
2008 2009 2010 2011 2012 2013 2014 2015 2016 2017
Demand and supply in constant pricesGross domestic product 0.9 -3.7 -0.1 0.7 -1.8 0.1 1.2 1.6 1.8 1.8
Private consumption -0.6 -4.3 0.8 -0.1 -0.9 0.6 1.0 1.2 1.0 1.0Public consumption 5.9 3.7 0.2 -2.2 -7.6 -2.4 0.3 1.5 1.7 1.7Gross fixed investment -4.7 -16.6 -6.3 -5.1 -7.5 -1.0 0.5 0.7 1.7 2.2
Construction investment -5.8 -15.4 -10.1 -8.1 -8.5 -1.5 0.2 0.7 1.2 1.9Other -0.8 -15.2 1.0 0.8 -5.6 0.0 0.9 0.7 2.3 2.7
Stockbuilding (contribution to growth) 0.2 0.0 0.0 0.1 0.0 0.0 0.0 0.0 0.0 0.0Total domestic demand -0.5 -6.2 -1.0 -1.7 -3.7 -0.3 0.8 1.2 1.2 1.4Net exports (contribution to growth) 1.5 2.8 0.9 2.5 1.9 0.4 0.4 0.5 0.5 0.5Exports of goods and services -1.0 -10.4 13.5 9.0 2.1 4.1 4.2 4.7 4.8 4.9Imports of goods and services -5.2 -17.2 8.9 -0.1 -4.1 2.9 3.1 3.4 3.5 3.8
Savings-Investment Balance (in percent of GDP) Gross domestic investment 29.1 24.4 23.3 22.1 20.7 20.3 19.9 19.6 19.5 19.4 Private 25.2 20.0 19.6 19.3 18.7 18.3 17.8 17.4 17.3 17.1 Public 3.9 4.4 3.7 2.8 2.0 2.0 2.2 2.2 2.2 2.3 National savings 19.5 19.2 18.7 18.3 18.5 18.5 18.7 18.8 19.1 19.4 Private 19.7 26.0 24.3 24.0 22.6 22.2 21.7 21.3 21.3 21.1 Public -0.2 -6.8 -5.6 -5.7 -4.0 -3.7 -3.0 -2.6 -2.2 -1.8 Foreign savings 9.6 5.2 4.6 3.7 2.1 1.7 1.3 0.8 0.4 0.0
Potential output growth 2.3 1.3 0.6 0.4 -0.4 0.0 0.5 0.6 0.9 1.0Output gap (percent of potential) 2.4 -2.7 -3.3 -3.1 -4.5 -4.3 -3.7 -2.7 -1.8 -1.0
PricesGDP deflator 2.4 0.1 0.4 1.4 0.8 1.5 1.8 1.7 1.7 1.6HICP (average) 4.1 -0.2 2.0 3.1 1.9 1.6 1.6 1.6 1.5 1.5HICP (end of period) 1.5 0.9 2.9 2.4 1.7 1.5 1.5 1.5 1.5 1.5
Employment and wagesUnemployment rate (in percent) 11.3 18.0 20.1 21.6 24.2 23.9 22.8 21.9 20.6 19.0Unit labor cost in manufacturing 6.9 2.8 -4.6 -2.3 -2.4 -2.5 -1.7 -0.9 -0.7 -0.7Labor cost in manufacturing 4.8 5.0 1.4 1.0 0.4 0.0 0.4 0.8 1.0 1.0Employment growth -0.4 -6.6 -2.3 -1.8 -3.2 0.1 1.6 1.5 2.0 2.2Labor force growth (in percent) 1/ 3.0 1.0 0.2 0.1 0.0 -0.3 0.2 0.3 0.3 0.2
Balance of payments (percent of GDP)Trade balance (goods) -7.9 -4.0 -4.5 -3.7 -2.7 -2.3 -1.9 -1.4 -1.0 -0.7Current account balance 2/ -9.6 -5.2 -4.6 -3.7 -2.1 -1.7 -1.3 -0.8 -0.4 0.0Net international investment position -79.3 -93.2 -89.2 -93.2 -95.8 -95.5 -93.5 -90.8 -87.6 -84.2Nominal effective rate (2005=100) 3/ 103.8 104.5 102.1 … … … … … … …Real effective rate (2005=100, CPI-based) 3/ 106.1 106.2 103.7 … … … … … … …
Public finance (percent of GDP)General government balance -4.2 -11.2 -9.3 -8.5 -6.0 -5.7 -5.2 -4.8 -4.4 -4.1Primary balance -2.6 -9.4 -7.4 -6.1 -3.1 -2.5 -1.7 -0.9 -0.3 0.3Structural balance -4.9 -9.3 -7.6 -6.7 -3.6 -3.3 -3.4 -3.6 -3.6 -3.7General government debt 40.2 53.9 61.2 68.5 79.0 84.0 87.4 89.3 90.7 91.9
Projections
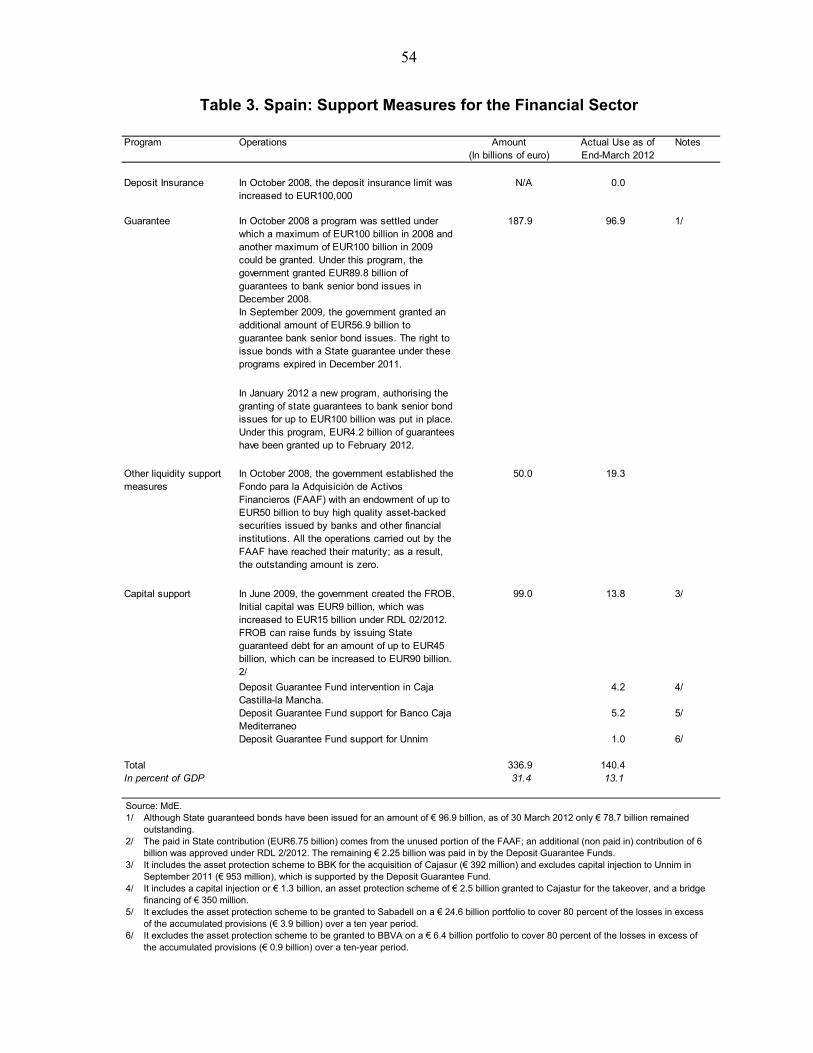
54
Table 3. Spain: Support Measures for the Financial Sector
Source: MdE. 1/ Although State guaranteed bonds have been issued for an amount of € 96.9 billion, as of 30 March 2012 only € 78.7 billion remained
outstanding. 2/ The paid in State contribution (EUR6.75 billion) comes from the unused portion of the FAAF; an additional (non paid in) contribution of 6
billion was approved under RDL 2/2012. The remaining € 2.25 billion was paid in by the Deposit Guarantee Funds. 3/ It includes the asset protection scheme to BBK for the acquisition of Cajasur (€ 392 million) and excludes capital injection to Unnim in
September 2011 (€ 953 million), which is supported by the Deposit Guarantee Fund. 4/ It includes a capital injection or € 1.3 billion, an asset protection scheme of € 2.5 billion granted to Cajastur for the takeover, and a bridge
financing of € 350 million. 5/ It excludes the asset protection scheme to be granted to Sabadell on a € 24.6 billion portfolio to cover 80 percent of the losses in excess
of the accumulated provisions (€ 3.9 billion) over a ten year period. 6/ It excludes the asset protection scheme to be granted to BBVA on a € 6.4 billion portfolio to cover 80 percent of the losses in excess of
the accumulated provisions (€ 0.9 billion) over a ten-year period.
Program Operations Amount (In billions of euro)
Actual Use as of End-March 2012
Notes
Deposit Insurance In October 2008, the deposit insurance limit was increased to EUR100,000
N/A 0.0
In October 2008 a program was settled under which a maximum of EUR100 billion in 2008 and another maximum of EUR100 billion in 2009 could be granted. Under this program, the government granted EUR89.8 billion of guarantees to bank senior bond issues in December 2008. In September 2009, the government granted an additional amount of EUR56.9 billion to guarantee bank senior bond issues. The right to issue bonds with a State guarantee under these programs expired in December 2011.
In January 2012 a new program, authorising the granting of state guarantees to bank senior bond issues for up to EUR100 billion was put in place. Under this program, EUR4.2 billion of guarantees have been granted up to February 2012.
Other liquidity support measures
In October 2008, the government established the Fondo para la Adquisición de Activos Financieros (FAAF) with an endowment of up to EUR50 billion to buy high quality asset-backed securities issued by banks and other financial institutions. All the operations carried out by the FAAF have reached their maturity; as a result, the outstanding amount is zero.
50.0 19.3
Capital support In June 2009, the government created the FROB. Initial capital was EUR9 billion, which was increased to EUR15 billion under RDL 02/2012. FROB can raise funds by issuing State guaranteed debt for an amount of up to EUR45 billion, which can be increased to EUR90 billion. 2/
99.0 13.8 3/
Deposit Guarantee Fund intervention in Caja Castilla-la Mancha.
4.2 4/
Deposit Guarantee Fund support for Banco Caja Mediterraneo
5.2 5/
Deposit Guarantee Fund support for Unnim 1.0 6/
Total 336.9 140.4In percent of GDP 31.4 13.1
96.9 1/Guarantee 187.9
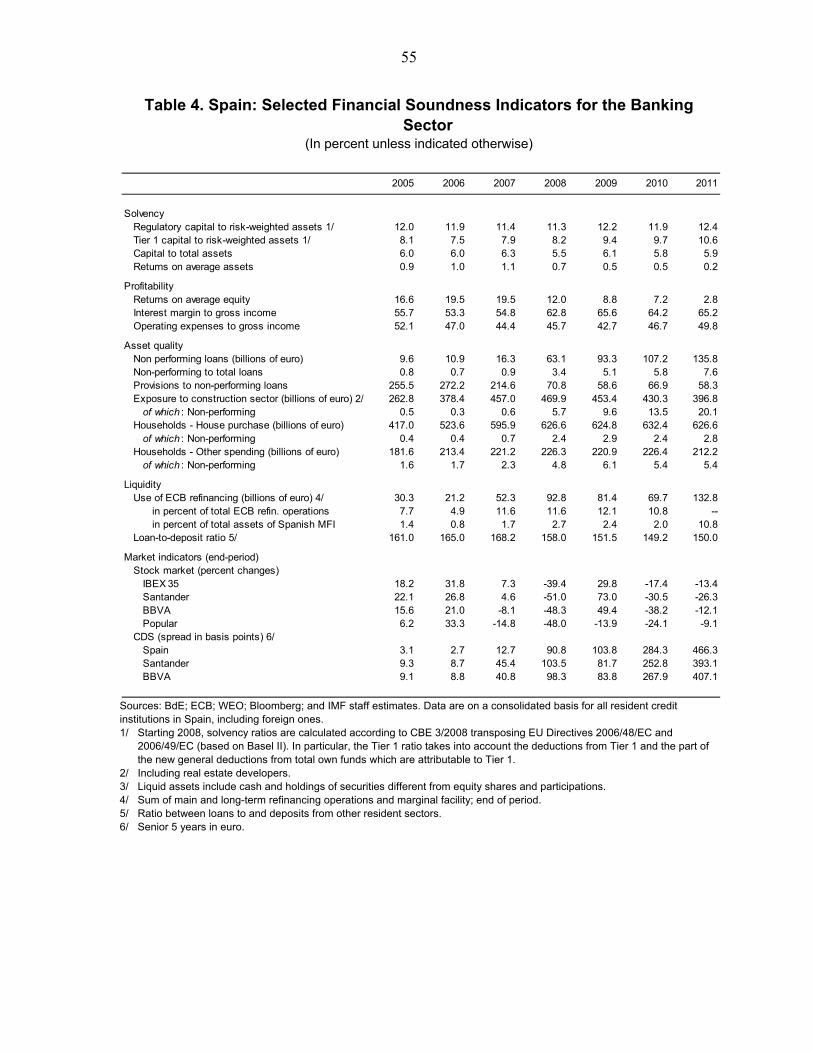
55
Table 4. Spain: Selected Financial Soundness Indicators for the Banking Sector
(In percent unless indicated otherwise)
Sources: BdE; ECB; WEO; Bloomberg; and IMF staff estimates. Data are on a consolidated basis for all resident credit institutions in Spain, including foreign ones. 1/ Starting 2008, solvency ratios are calculated according to CBE 3/2008 transposing EU Directives 2006/48/EC and
2006/49/EC (based on Basel II). In particular, the Tier 1 ratio takes into account the deductions from Tier 1 and the part of the new general deductions from total own funds which are attributable to Tier 1.
2/ Including real estate developers. 3/ Liquid assets include cash and holdings of securities different from equity shares and participations. 4/ Sum of main and long-term refinancing operations and marginal facility; end of period. 5/ Ratio between loans to and deposits from other resident sectors. 6/ Senior 5 years in euro.
2005 2006 2007 2008 2009 2010 2011
SolvencyRegulatory capital to risk-weighted assets 1/ 12.0 11.9 11.4 11.3 12.2 11.9 12.4Tier 1 capital to risk-weighted assets 1/ 8.1 7.5 7.9 8.2 9.4 9.7 10.6Capital to total assets 6.0 6.0 6.3 5.5 6.1 5.8 5.9Returns on average assets 0.9 1.0 1.1 0.7 0.5 0.5 0.2
ProfitabilityReturns on average equity 16.6 19.5 19.5 12.0 8.8 7.2 2.8Interest margin to gross income 55.7 53.3 54.8 62.8 65.6 64.2 65.2Operating expenses to gross income 52.1 47.0 44.4 45.7 42.7 46.7 49.8
Asset qualityNon performing loans (billions of euro) 9.6 10.9 16.3 63.1 93.3 107.2 135.8Non-performing to total loans 0.8 0.7 0.9 3.4 5.1 5.8 7.6Provisions to non-performing loans 255.5 272.2 214.6 70.8 58.6 66.9 58.3Exposure to construction sector (billions of euro) 2/ 262.8 378.4 457.0 469.9 453.4 430.3 396.8
of which : Non-performing 0.5 0.3 0.6 5.7 9.6 13.5 20.1Households - House purchase (billions of euro) 417.0 523.6 595.9 626.6 624.8 632.4 626.6
of which : Non-performing 0.4 0.4 0.7 2.4 2.9 2.4 2.8Households - Other spending (billions of euro) 181.6 213.4 221.2 226.3 220.9 226.4 212.2
of which : Non-performing 1.6 1.7 2.3 4.8 6.1 5.4 5.4
LiquidityUse of ECB refinancing (billions of euro) 4/ 30.3 21.2 52.3 92.8 81.4 69.7 132.8
in percent of total ECB refin. operations 7.7 4.9 11.6 11.6 12.1 10.8 --in percent of total assets of Spanish MFI 1.4 0.8 1.7 2.7 2.4 2.0 10.8
Loan-to-deposit ratio 5/ 161.0 165.0 168.2 158.0 151.5 149.2 150.0
Market indicators (end-period)Stock market (percent changes)
IBEX 35 18.2 31.8 7.3 -39.4 29.8 -17.4 -13.4Santander 22.1 26.8 4.6 -51.0 73.0 -30.5 -26.3BBVA 15.6 21.0 -8.1 -48.3 49.4 -38.2 -12.1Popular 6.2 33.3 -14.8 -48.0 -13.9 -24.1 -9.1
CDS (spread in basis points) 6/Spain 3.1 2.7 12.7 90.8 103.8 284.3 466.3Santander 9.3 8.7 45.4 103.5 81.7 252.8 393.1BBVA 9.1 8.8 40.8 98.3 83.8 267.9 407.1
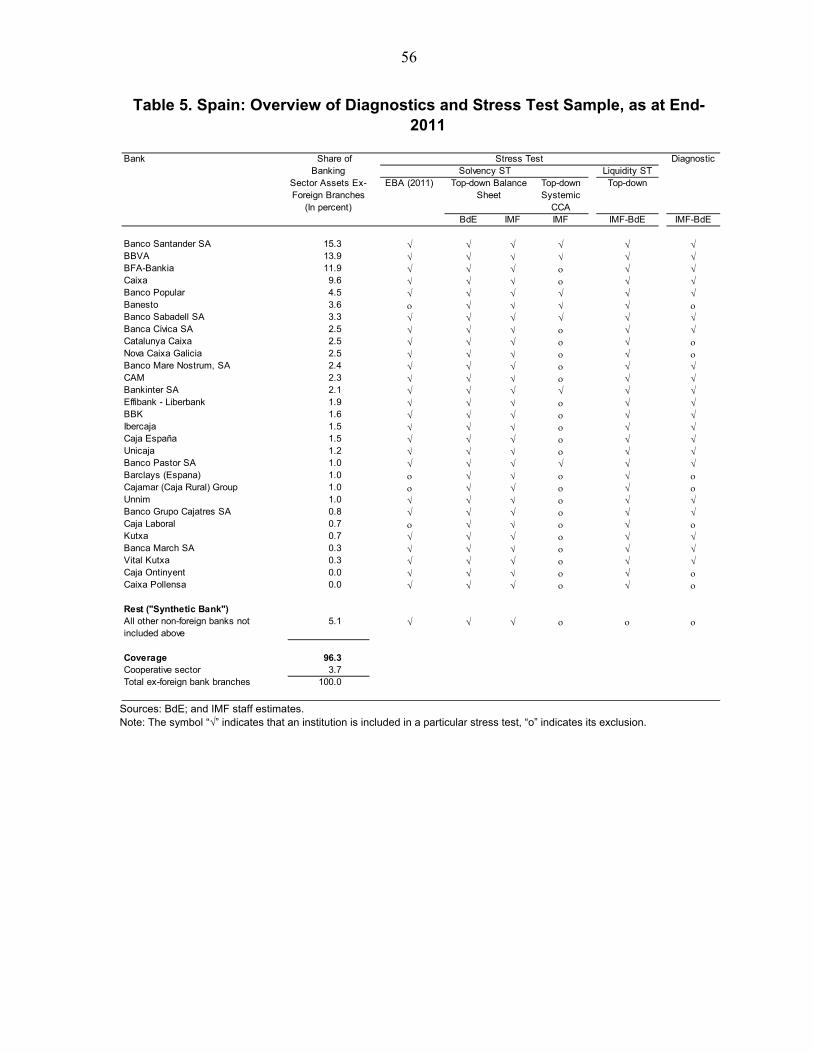
56
Table 5. Spain: Overview of Diagnostics and Stress Test Sample, as at End-2011
Sources: BdE; and IMF staff estimates. Note: The symbol “√” indicates that an institution is included in a particular stress test, “o” indicates its exclusion.
Bank DiagnosticLiquidity ST
Sector Assets Ex-Foreign Branches
(In percent)
EBA (2011) Top-down Systemic
CCA
Top-down
BdE IMF IMF IMF-BdE IMF-BdE
Banco Santander SA 15.3 BBVA 13.9 BFA-Bankia 11.9 Caixa 9.6 Banco Popular 4.5 Banesto 3.6 Banco Sabadell SA 3.3 Banca Cívica SA 2.5 Catalunya Caixa 2.5 Nova Caixa Galicia 2.5 Banco Mare Nostrum, SA 2.4 CAM 2.3 Bankinter SA 2.1 Effibank - Liberbank 1.9 BBK 1.6 Ibercaja 1.5 Caja España 1.5 Unicaja 1.2 Banco Pastor SA 1.0 Barclays (Espana) 1.0 Cajamar (Caja Rural) Group 1.0 Unnim 1.0 Banco Grupo Cajatres SA 0.8 Caja Laboral 0.7 Kutxa 0.7 Banca March SA 0.3 Vital Kutxa 0.3 Caja Ontinyent 0.0 Caixa Pollensa 0.0
Rest ("Synthetic Bank")All other non-foreign banks not included above
5.1
Coverage 96.3Cooperative sector 3.7Total ex-foreign bank branches 100.0
Top-down Balance Sheet
Share of Stress TestBanking Solvency ST
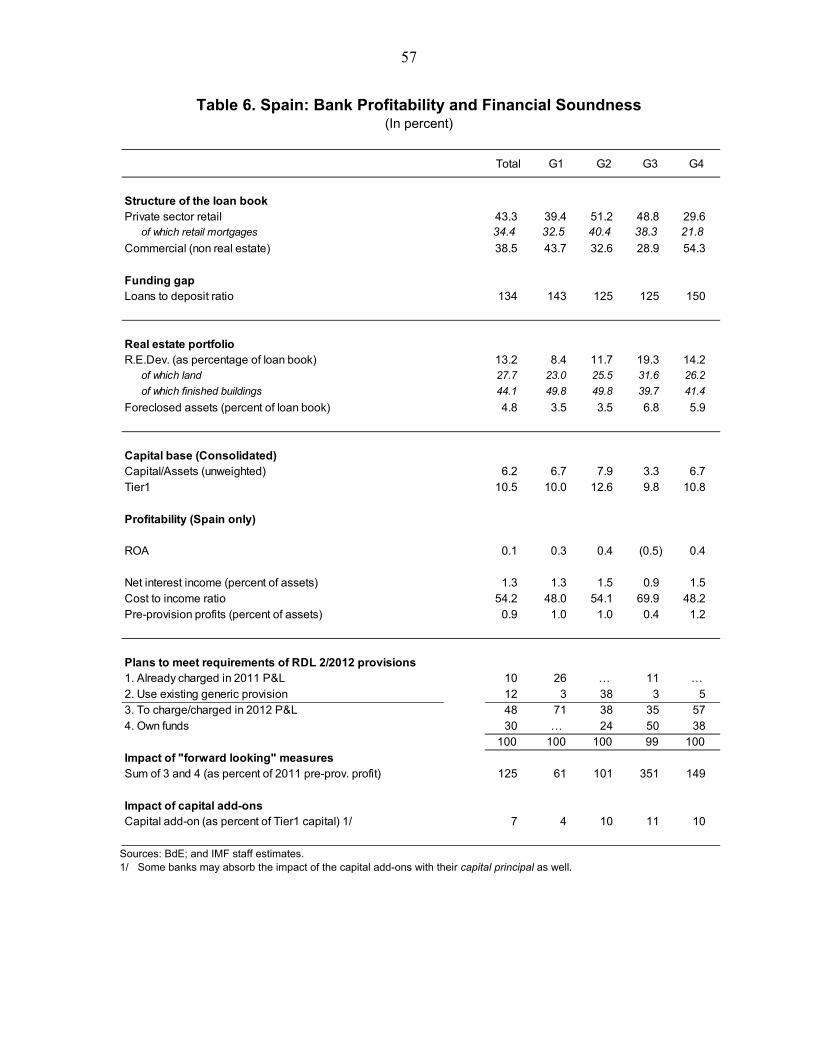
57
Table 6. Spain: Bank Profitability and Financial Soundness (In percent)
Sources: BdE; and IMF staff estimates. 1/ Some banks may absorb the impact of the capital add-ons with their capital principal as well.
Total G1 G2 G3 G4
Structure of the loan bookPrivate sector retail 43.3 39.4 51.2 48.8 29.6
of which retail mortgages 34.4 32.5 40.4 38.3 21.8
Commercial (non real estate) 38.5 43.7 32.6 28.9 54.3
Funding gapLoans to deposit ratio 134 143 125 125 150
Real estate portfolioR.E.Dev. (as percentage of loan book) 13.2 8.4 11.7 19.3 14.2
of which land 27.7 23.0 25.5 31.6 26.2
of which finished buildings 44.1 49.8 49.8 39.7 41.4
Foreclosed assets (percent of loan book) 4.8 3.5 3.5 6.8 5.9
Capital base (Consolidated)Capital/Assets (unweighted) 6.2 6.7 7.9 3.3 6.7 Tier1 10.5 10.0 12.6 9.8 10.8
Profitability (Spain only)
ROA 0.1 0.3 0.4 (0.5) 0.4
Net interest income (percent of assets) 1.3 1.3 1.5 0.9 1.5 Cost to income ratio 54.2 48.0 54.1 69.9 48.2 Pre-provision profits (percent of assets) 0.9 1.0 1.0 0.4 1.2
Plans to meet requirements of RDL 2/2012 provisions1. Already charged in 2011 P&L 10 26 … 11 …2. Use existing generic provision 12 3 38 3 5 3. To charge/charged in 2012 P&L 48 71 38 35 57 4. Own funds 30 … 24 50 38
100 100 100 99 100
Impact of "forward looking" measuresSum of 3 and 4 (as percent of 2011 pre-prov. profit) 125 61 101 351 149
Impact of capital add-onsCapital add-on (as percent of Tier1 capital) 1/ 7 4 10 11 10
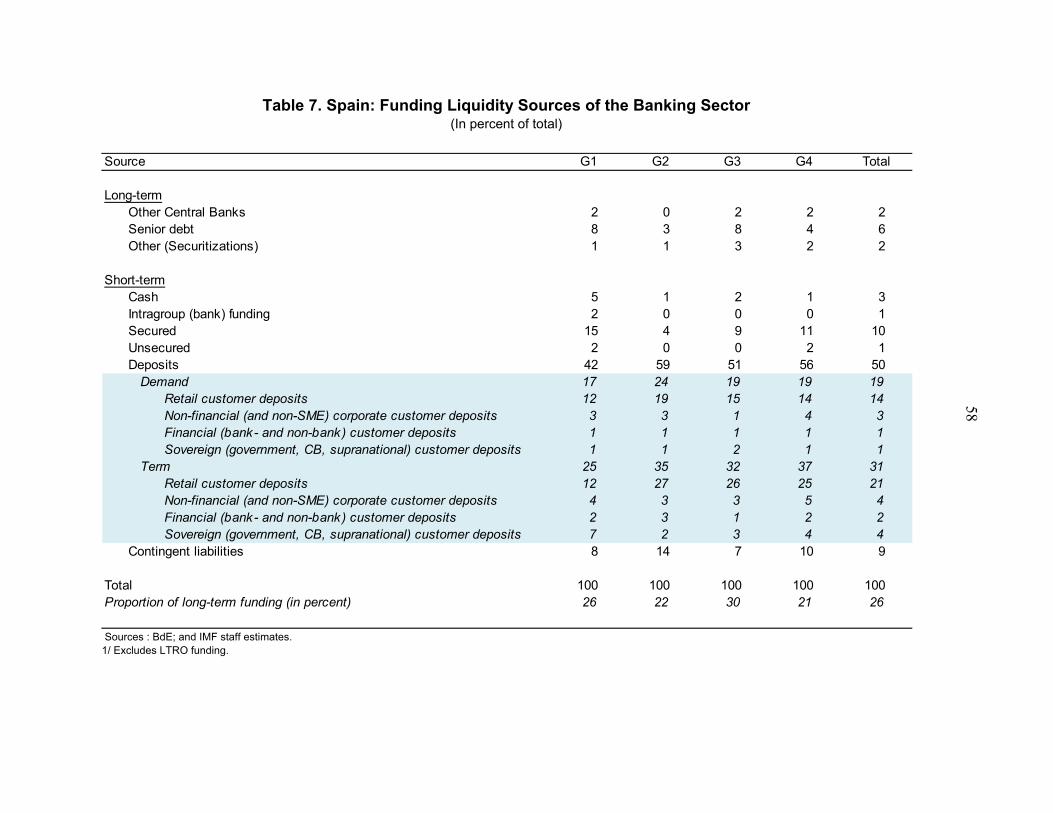
58
Table 7. Spain: Funding Liquidity Sources of the Banking Sector (In percent of total)
Sources : BdE; and IMF staff estimates. 1/ Excludes LTRO funding.
Source G1 G2 G3 G4 Total
Long-termOther Central Banks 2 0 2 2 2Senior debt 8 3 8 4 6Other (Securitizations) 1 1 3 2 2
Short-termCash 5 1 2 1 3Intragroup (bank) funding 2 0 0 0 1Secured 15 4 9 11 10Unsecured 2 0 0 2 1Deposits 42 59 51 56 50
Demand 17 24 19 19 19 Retail customer deposits 12 19 15 14 14 Non-financial (and non-SME) corporate customer deposits 3 3 1 4 3 Financial (bank- and non-bank) customer deposits 1 1 1 1 1 Sovereign (government, CB, supranational) customer deposits 1 1 2 1 1
Term 25 35 32 37 31 Retail customer deposits 12 27 26 25 21 Non-financial (and non-SME) corporate customer deposits 4 3 3 5 4 Financial (bank- and non-bank) customer deposits 2 3 1 2 2 Sovereign (government, CB, supranational) customer deposits 7 2 3 4 4
Contingent liabilities 8 14 7 10 9
Total 100 100 100 100 100Proportion of long-term funding (in percent) 26 22 30 21 26
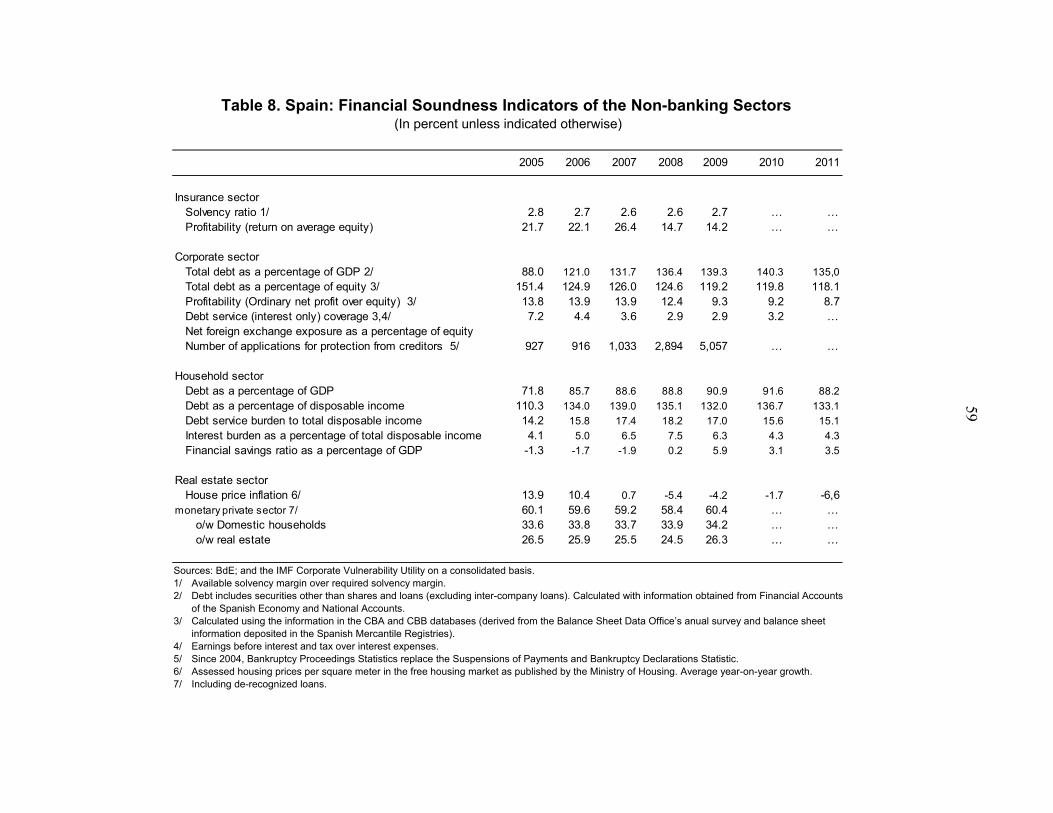
59
Table 8. Spain: Financial Soundness Indicators of the Non-banking Sectors (In percent unless indicated otherwise)
Sources: BdE; and the IMF Corporate Vulnerability Utility on a consolidated basis. 1/ Available solvency margin over required solvency margin. 2/ Debt includes securities other than shares and loans (excluding inter-company loans). Calculated with information obtained from Financial Accounts
of the Spanish Economy and National Accounts. 3/ Calculated using the information in the CBA and CBB databases (derived from the Balance Sheet Data Office’s anual survey and balance sheet
information deposited in the Spanish Mercantile Registries). 4/ Earnings before interest and tax over interest expenses. 5/ Since 2004, Bankruptcy Proceedings Statistics replace the Suspensions of Payments and Bankruptcy Declarations Statistic. 6/ Assessed housing prices per square meter in the free housing market as published by the Ministry of Housing. Average year-on-year growth. 7/ Including de-recognized loans.
2005 2006 2007 2008 2009 2010 2011
Insurance sectorSolvency ratio 1/ 2.8 2.7 2.6 2.6 2.7 … …Profitability (return on average equity) 21.7 22.1 26.4 14.7 14.2 … …
Corporate sectorTotal debt as a percentage of GDP 2/ 88.0 121.0 131.7 136.4 139.3 140.3 135,0
Total debt as a percentage of equity 3/ 151.4 124.9 126.0 124.6 119.2 119.8 118.1Profitability (Ordinary net profit over equity) 3/ 13.8 13.9 13.9 12.4 9.3 9.2 8.7Debt service (interest only) coverage 3,4/ 7.2 4.4 3.6 2.9 2.9 3.2 …Net foreign exchange exposure as a percentage of equity Number of applications for protection from creditors 5/ 927 916 1,033 2,894 5,057 … …
Household sectorDebt as a percentage of GDP 71.8 85.7 88.6 88.8 90.9 91.6 88.2
Debt as a percentage of disposable income 110.3 134.0 139.0 135.1 132.0 136.7 133.1
Debt service burden to total disposable income 14.2 15.8 17.4 18.2 17.0 15.6 15.1
Interest burden as a percentage of total disposable income 4.1 5.0 6.5 7.5 6.3 4.3 4.3
Financial savings ratio as a percentage of GDP -1.3 -1.7 -1.9 0.2 5.9 3.1 3.5
Real estate sectorHouse price inflation 6/ 13.9 10.4 0.7 -5.4 -4.2 -1.7 -6,6
monetary private sector 7/ 60.1 59.6 59.2 58.4 60.4 … … o/w Domestic households 33.6 33.8 33.7 33.9 34.2 … … o/w real estate 26.5 25.9 25.5 24.5 26.3 … …
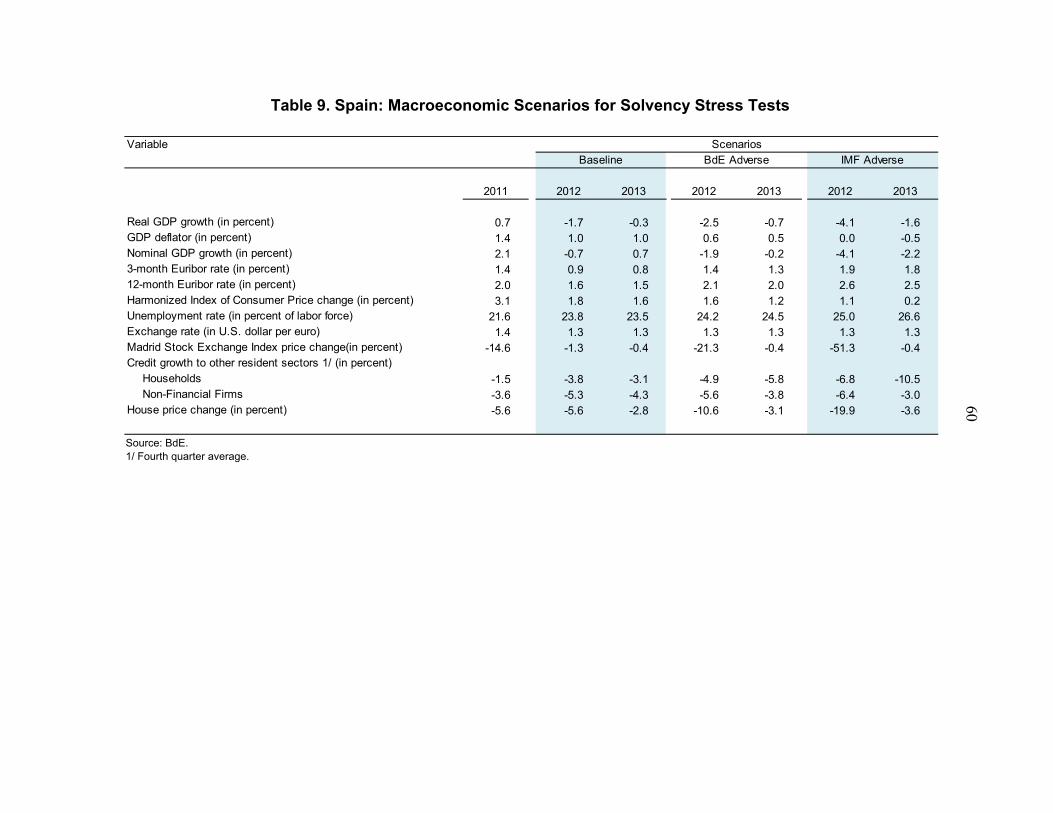
60
Table 9. Spain: Macroeconomic Scenarios for Solvency Stress Tests
Source: BdE. 1/ Fourth quarter average.
Variable
2011 2012 2013 2012 2013 2012 2013
Real GDP growth (in percent) 0.7 -1.7 -0.3 -2.5 -0.7 -4.1 -1.6GDP deflator (in percent) 1.4 1.0 1.0 0.6 0.5 0.0 -0.5Nominal GDP growth (in percent) 2.1 -0.7 0.7 -1.9 -0.2 -4.1 -2.23-month Euribor rate (in percent) 1.4 0.9 0.8 1.4 1.3 1.9 1.812-month Euribor rate (in percent) 2.0 1.6 1.5 2.1 2.0 2.6 2.5Harmonized Index of Consumer Price change (in percent) 3.1 1.8 1.6 1.6 1.2 1.1 0.2Unemployment rate (in percent of labor force) 21.6 23.8 23.5 24.2 24.5 25.0 26.6Exchange rate (in U.S. dollar per euro) 1.4 1.3 1.3 1.3 1.3 1.3 1.3Madrid Stock Exchange Index price change(in percent) -14.6 -1.3 -0.4 -21.3 -0.4 -51.3 -0.4Credit growth to other resident sectors 1/ (in percent)
Households -1.5 -3.8 -3.1 -4.9 -5.8 -6.8 -10.5Non-Financial Firms -3.6 -5.3 -4.3 -5.6 -3.8 -6.4 -3.0
House price change (in percent) -5.6 -5.6 -2.8 -10.6 -3.1 -19.9 -3.6
ScenariosBaseline BdE Adverse IMF Adverse
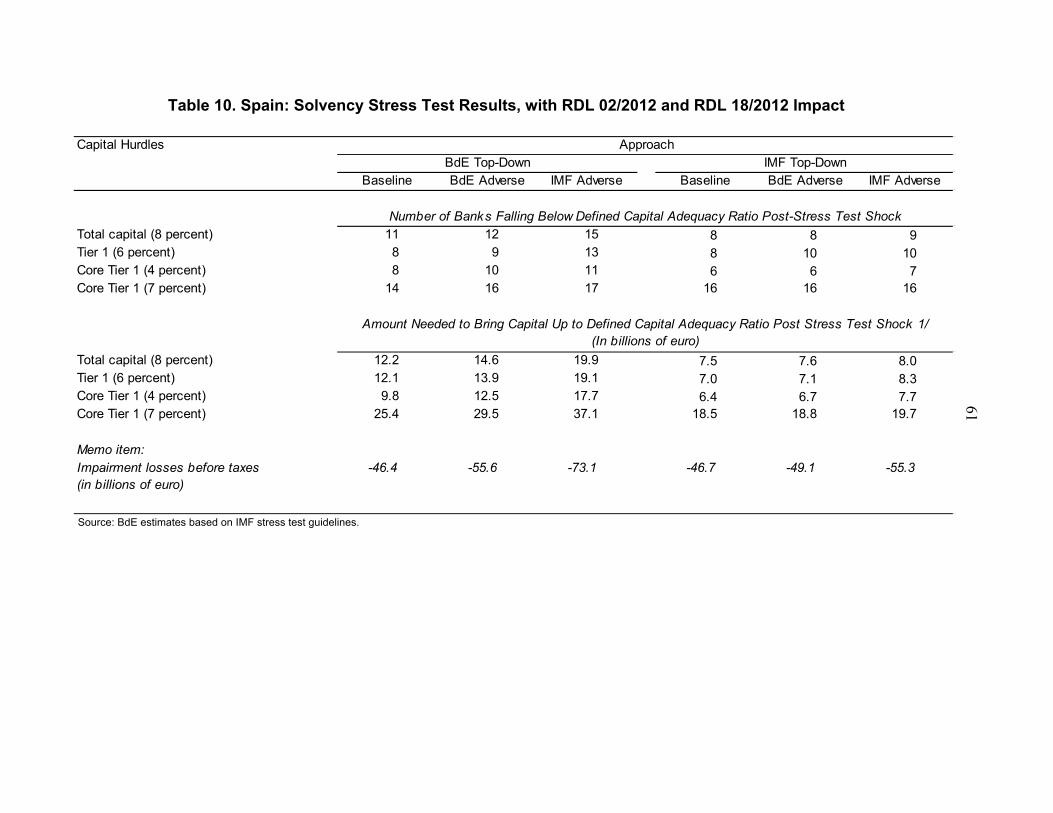
61
Table 10. Spain: Solvency Stress Test Results, with RDL 02/2012 and RDL 18/2012 Impact
Source: BdE estimates based on IMF stress test guidelines.
Capital Hurdles
Baseline BdE Adverse IMF Adverse Baseline BdE Adverse IMF Adverse
Total capital (8 percent) 11 12 15 8 8 9Tier 1 (6 percent) 8 9 13 8 10 10Core Tier 1 (4 percent) 8 10 11 6 6 7Core Tier 1 (7 percent) 14 16 17 16 16 16
Total capital (8 percent) 12.2 14.6 19.9 7.5 7.6 8.0Tier 1 (6 percent) 12.1 13.9 19.1 7.0 7.1 8.3Core Tier 1 (4 percent) 9.8 12.5 17.7 6.4 6.7 7.7Core Tier 1 (7 percent) 25.4 29.5 37.1 18.5 18.8 19.7
Memo item:Impairment losses before taxes (in billions of euro)
-46.4 -55.6 -73.1 -46.7 -49.1 -55.3
Amount Needed to Bring Capital Up to Defined Capital Adequacy Ratio Post Stress Test Shock 1/ (In billions of euro)
ApproachBdE Top-Down IMF Top-Down
Number of Banks Falling Below Defined Capital Adequacy Ratio Post-Stress Test Shock
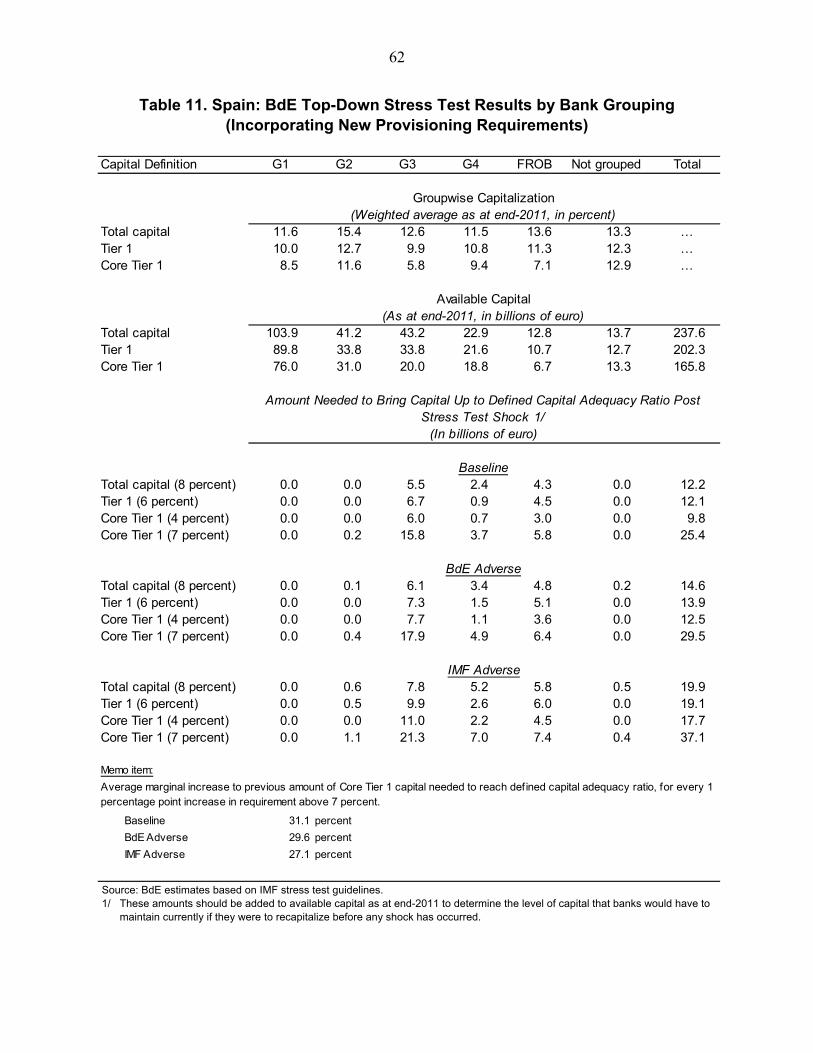
62
Table 11. Spain: BdE Top-Down Stress Test Results by Bank Grouping (Incorporating New Provisioning Requirements)
Source: BdE estimates based on IMF stress test guidelines. 1/ These amounts should be added to available capital as at end-2011 to determine the level of capital that banks would have to
maintain currently if they were to recapitalize before any shock has occurred.
Capital Definition G1 G2 G3 G4 FROB Not grouped Total
Total capital 11.6 15.4 12.6 11.5 13.6 13.3 …Tier 1 10.0 12.7 9.9 10.8 11.3 12.3 …Core Tier 1 8.5 11.6 5.8 9.4 7.1 12.9 …
Total capital 103.9 41.2 43.2 22.9 12.8 13.7 237.6Tier 1 89.8 33.8 33.8 21.6 10.7 12.7 202.3Core Tier 1 76.0 31.0 20.0 18.8 6.7 13.3 165.8
Total capital (8 percent) 0.0 0.0 5.5 2.4 4.3 0.0 12.2Tier 1 (6 percent) 0.0 0.0 6.7 0.9 4.5 0.0 12.1Core Tier 1 (4 percent) 0.0 0.0 6.0 0.7 3.0 0.0 9.8Core Tier 1 (7 percent) 0.0 0.2 15.8 3.7 5.8 0.0 25.4
Total capital (8 percent) 0.0 0.1 6.1 3.4 4.8 0.2 14.6Tier 1 (6 percent) 0.0 0.0 7.3 1.5 5.1 0.0 13.9Core Tier 1 (4 percent) 0.0 0.0 7.7 1.1 3.6 0.0 12.5Core Tier 1 (7 percent) 0.0 0.4 17.9 4.9 6.4 0.0 29.5
Total capital (8 percent) 0.0 0.6 7.8 5.2 5.8 0.5 19.9Tier 1 (6 percent) 0.0 0.5 9.9 2.6 6.0 0.0 19.1Core Tier 1 (4 percent) 0.0 0.0 11.0 2.2 4.5 0.0 17.7Core Tier 1 (7 percent) 0.0 1.1 21.3 7.0 7.4 0.4 37.1
Memo item:
Baseline 31.1 percent
BdE Adverse 29.6 percent
IMF Adverse 27.1 percent
Average marginal increase to previous amount of Core Tier 1 capital needed to reach defined capital adequacy ratio, for every 1 percentage point increase in requirement above 7 percent.
IMF Adverse
Groupwise Capitalization(Weighted average as at end-2011, in percent)
Available Capital(As at end-2011, in billions of euro)
Amount Needed to Bring Capital Up to Defined Capital Adequacy Ratio Post Stress Test Shock 1/
(In billions of euro)
Baseline
BdE Adverse
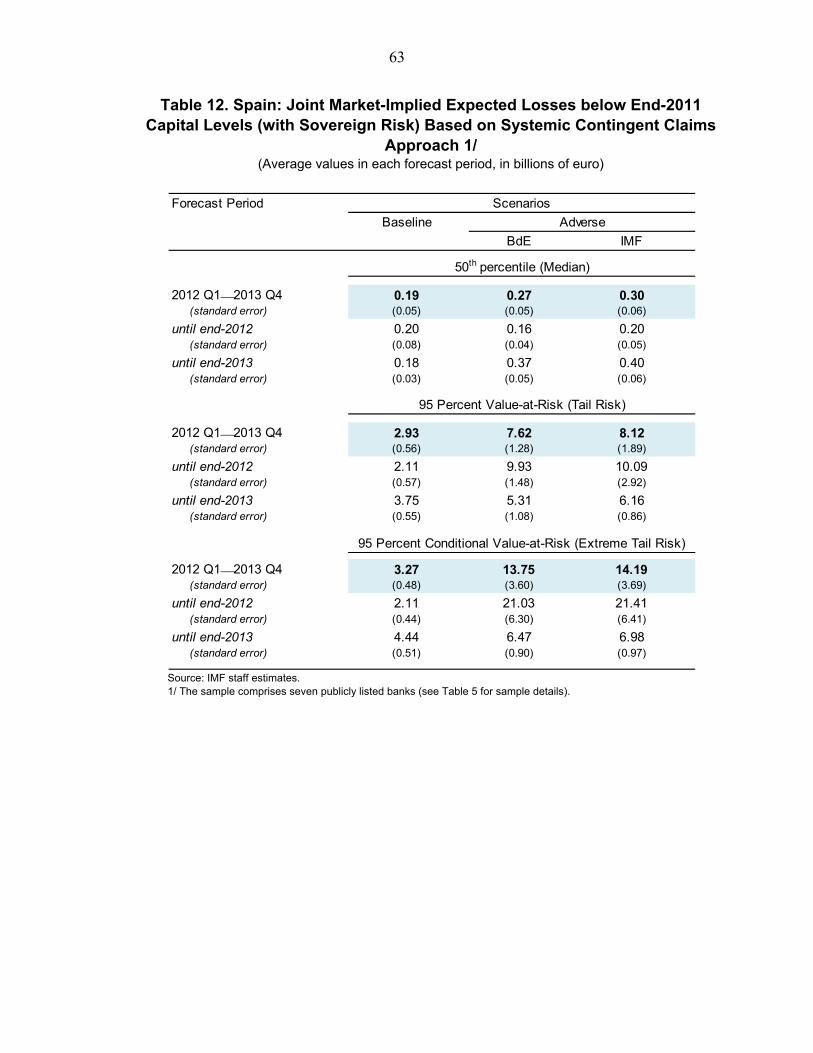
63
Table 12. Spain: Joint Market-Implied Expected Losses below End-2011 Capital Levels (with Sovereign Risk) Based on Systemic Contingent Claims
Approach 1/ (Average values in each forecast period, in billions of euro)
Source: IMF staff estimates. 1/ The sample comprises seven publicly listed banks (see Table 5 for sample details).
Forecast Period
Baseline
BdE IMF
0.19 0.27 0.30(standard error) (0.05) (0.05) (0.06)
0.20 0.16 0.20(standard error) (0.08) (0.04) (0.05)
0.18 0.37 0.40(standard error) (0.03) (0.05) (0.06)
2.93 7.62 8.12(standard error) (0.56) (1.28) (1.89)
2.11 9.93 10.09(standard error) (0.57) (1.48) (2.92)
3.75 5.31 6.16(standard error) (0.55) (1.08) (0.86)
3.27 13.75 14.19(standard error) (0.48) (3.60) (3.69)
2.11 21.03 21.41(standard error) (0.44) (6.30) (6.41)
4.44 6.47 6.98(standard error) (0.51) (0.90) (0.97)
until end-2013
2012 Q12013 Q4
until end-2012
until end-2013
95 Percent Conditional Value-at-Risk (Extreme Tail Risk)
2012 Q12013 Q4
until end-2012
95 Percent Value-at-Risk (Tail Risk)
Scenarios
Adverse
50th percentile (Median)
2012 Q12013 Q4
until end-2012
until end-2013
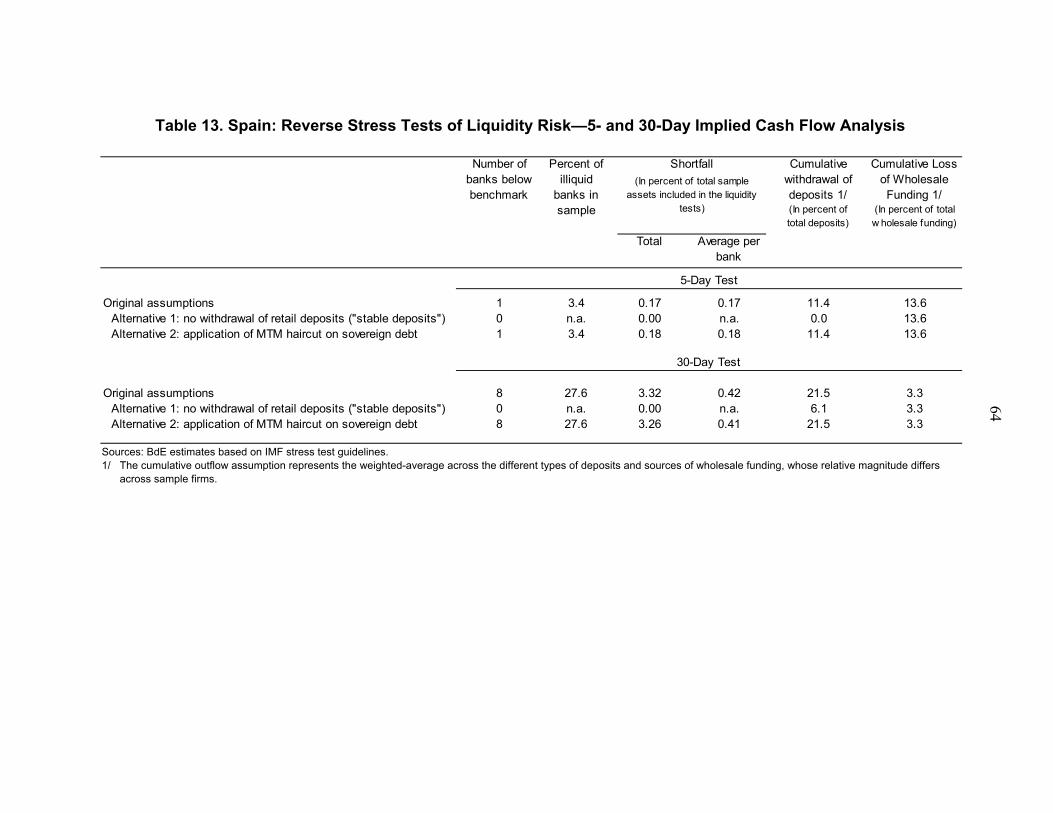
64
Table 13. Spain: Reverse Stress Tests of Liquidity Risk—5- and 30-Day Implied Cash Flow Analysis
Sources: BdE estimates based on IMF stress test guidelines. 1/ The cumulative outflow assumption represents the weighted-average across the different types of deposits and sources of wholesale funding, whose relative magnitude differs
across sample firms.
Total Average per bank
Original assumptions 1 3.4 0.17 0.17 11.4 13.6Alternative 1: no withdrawal of retail deposits ("stable deposits") 0 n.a. 0.00 n.a. 0.0 13.6Alternative 2: application of MTM haircut on sovereign debt 1 3.4 0.18 0.18 11.4 13.6
Original assumptions 8 27.6 3.32 0.42 21.5 3.3Alternative 1: no withdrawal of retail deposits ("stable deposits") 0 n.a. 0.00 n.a. 6.1 3.3Alternative 2: application of MTM haircut on sovereign debt 8 27.6 3.26 0.41 21.5 3.3
Number of banks below benchmark
Percent of illiquid
banks in sample
Shortfall
(In percent of total sample assets included in the liquidity
tests)
5-Day Test
30-Day Test
Cumulative withdrawal of deposits 1/(In percent of total deposits)
Cumulative Loss of Wholesale Funding 1/
(In percent of total w holesale funding)
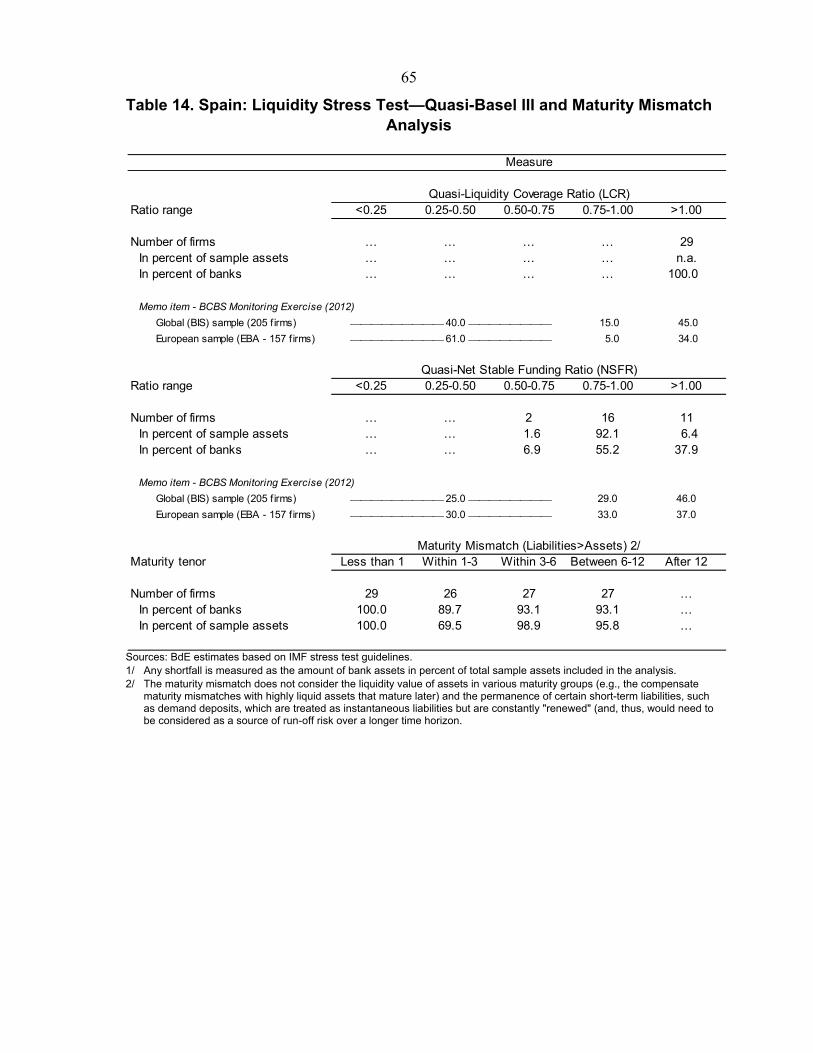
65
Table 14. Spain: Liquidity Stress Test—Quasi-Basel III and Maturity Mismatch Analysis
Sources: BdE estimates based on IMF stress test guidelines. 1/ Any shortfall is measured as the amount of bank assets in percent of total sample assets included in the analysis. 2/ The maturity mismatch does not consider the liquidity value of assets in various maturity groups (e.g., the compensate
maturity mismatches with highly liquid assets that mature later) and the permanence of certain short-term liabilities, such as demand deposits, which are treated as instantaneous liabilities but are constantly "renewed" (and, thus, would need to be considered as a source of run-off risk over a longer time horizon.
Ratio range <0.25 0.25-0.50 0.50-0.75 0.75-1.00 >1.00
Number of firms … … … … 29In percent of sample assets … … … … n.a.In percent of banks … … … … 100.0
Memo item - BCBS Monitoring Exercise (2012)
Global (BIS) sample (205 f irms) 15.0 45.0
European sample (EBA - 157 f irms) 5.0 34.0
Ratio range <0.25 0.25-0.50 0.50-0.75 0.75-1.00 >1.00
Number of firms … … 2 16 11In percent of sample assets … … 1.6 92.1 6.4In percent of banks … … 6.9 55.2 37.9
Memo item - BCBS Monitoring Exercise (2012)
Global (BIS) sample (205 f irms) 29.0 46.0
European sample (EBA - 157 f irms) 33.0 37.0
Maturity tenor Less than 1 Within 1-3 Within 3-6 Between 6-12 After 12
Number of firms 29 26 27 27 …In percent of banks 100.0 89.7 93.1 93.1 …In percent of sample assets 100.0 69.5 98.9 95.8 …
30.0
Maturity Mismatch (Liabilities>Assets) 2/
Measure
Quasi-Liquidity Coverage Ratio (LCR)
40.0
61.0
Quasi-Net Stable Funding Ratio (NSFR)
25.0

66
APPENDIX I: SPAIN: RISK ASSESSMENT MATRIX
Nature/Source of Main Threats
Overall Level of Concern
Likelihood of Severe Realization of Threat in the Next 1–3 Years
Expected Impact on Financial Stability if Threat is Realized
(high, medium or low) (high, medium or low)
1. Continued weak growth and high unemployment
Staff assessment: High Staff assessment: High
Spain may not recover its pre-crisis growth rates (fuelled by credit and construction) and may be mired in continued weak growth and high unemployment over the medium term.
ECB monetary policy remains accommodative but funding costs for Spain remain high.
Weak demand for loans plus deleveraging by banks adversely affects banks’ incomes.
The severe adverse scenario in the stress test envisages output declining by a cumulative 5.7 percentage points over 2012–13 (equivalent to a one standard deviation shock) amid a fiscal adjustment, along with rising funding costs via a significant rise in the short-term interest rate (and indirectly via other sources of income).
The expected impairment losses would amount to € 73 billion (about 7 percent of GDP); additional capital of € 18 billion would be needed to meet a core Tier 1 ratio of 4 percent (€ 38 billion to meet a core Tier 1 ratio of 7 percent)— in line with the Basel III transition schedule at end-2018).
2. Intensification of the decline in real estate prices
Staff assessment: High Staff assessment: High
Real estate prices have declined sharply, but have not bottomed. The slide in housing prices may overshoot current estimates of requisite adjustment, given the large stock of unsold units.
Banks with significant portfolios of repossessed assets may hold fire sales.
Several large real estate companies may not obtain the necessary refinancing and go into bankruptcy.
Unemployment remains high.
Given the banking sector’s large exposure to real estate, deterioration in asset quality would further increase recapitalization needs.
While large parts of the banking sector are sufficiently capitalized to withstand the assumed macroeconomic shocks, escalating impairment losses owing to a further rapid and steep drop in house prices would have an adverse impact on the banks.
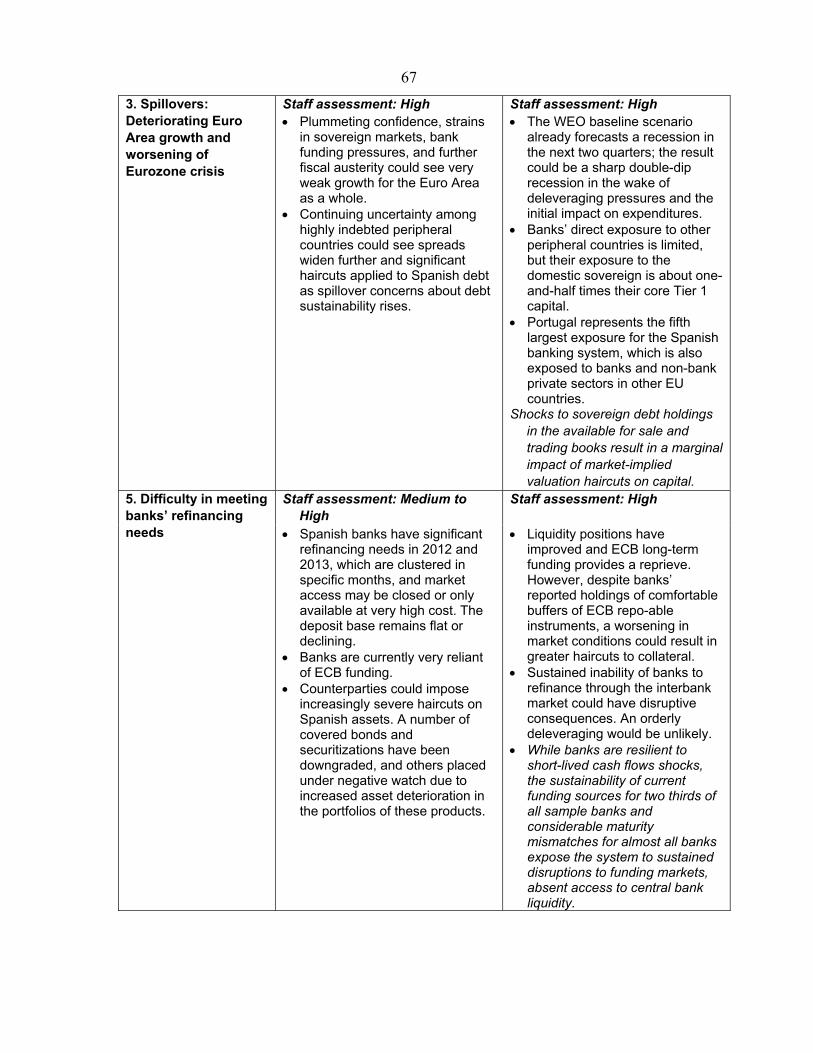
67
3. Spillovers: Deteriorating Euro Area growth and worsening of Eurozone crisis
Staff assessment: High Plummeting confidence, strains
in sovereign markets, bank funding pressures, and further fiscal austerity could see very weak growth for the Euro Area as a whole.
Continuing uncertainty among highly indebted peripheral countries could see spreads widen further and significant haircuts applied to Spanish debt as spillover concerns about debt sustainability rises.
Staff assessment: High The WEO baseline scenario
already forecasts a recession in the next two quarters; the result could be a sharp double-dip recession in the wake of deleveraging pressures and the initial impact on expenditures.
Banks’ direct exposure to other peripheral countries is limited, but their exposure to the domestic sovereign is about one-and-half times their core Tier 1 capital.
Portugal represents the fifth largest exposure for the Spanish banking system, which is also exposed to banks and non-bank private sectors in other EU countries.
Shocks to sovereign debt holdings in the available for sale and trading books result in a marginal impact of market-implied valuation haircuts on capital.
5. Difficulty in meeting banks’ refinancing needs
Staff assessment: Medium to High
Staff assessment: High
Spanish banks have significant refinancing needs in 2012 and 2013, which are clustered in specific months, and market access may be closed or only available at very high cost. The deposit base remains flat or declining.
Banks are currently very reliant of ECB funding.
Counterparties could impose increasingly severe haircuts on Spanish assets. A number of covered bonds and securitizations have been downgraded, and others placed under negative watch due to increased asset deterioration in the portfolios of these products.
Liquidity positions have improved and ECB long-term funding provides a reprieve. However, despite banks’ reported holdings of comfortable buffers of ECB repo-able instruments, a worsening in market conditions could result in greater haircuts to collateral.
Sustained inability of banks to refinance through the interbank market could have disruptive consequences. An orderly deleveraging would be unlikely.
While banks are resilient to short-lived cash flows shocks, the sustainability of current funding sources for two thirds of all sample banks and considerable maturity mismatches for almost all banks expose the system to sustained disruptions to funding markets, absent access to central bank liquidity.
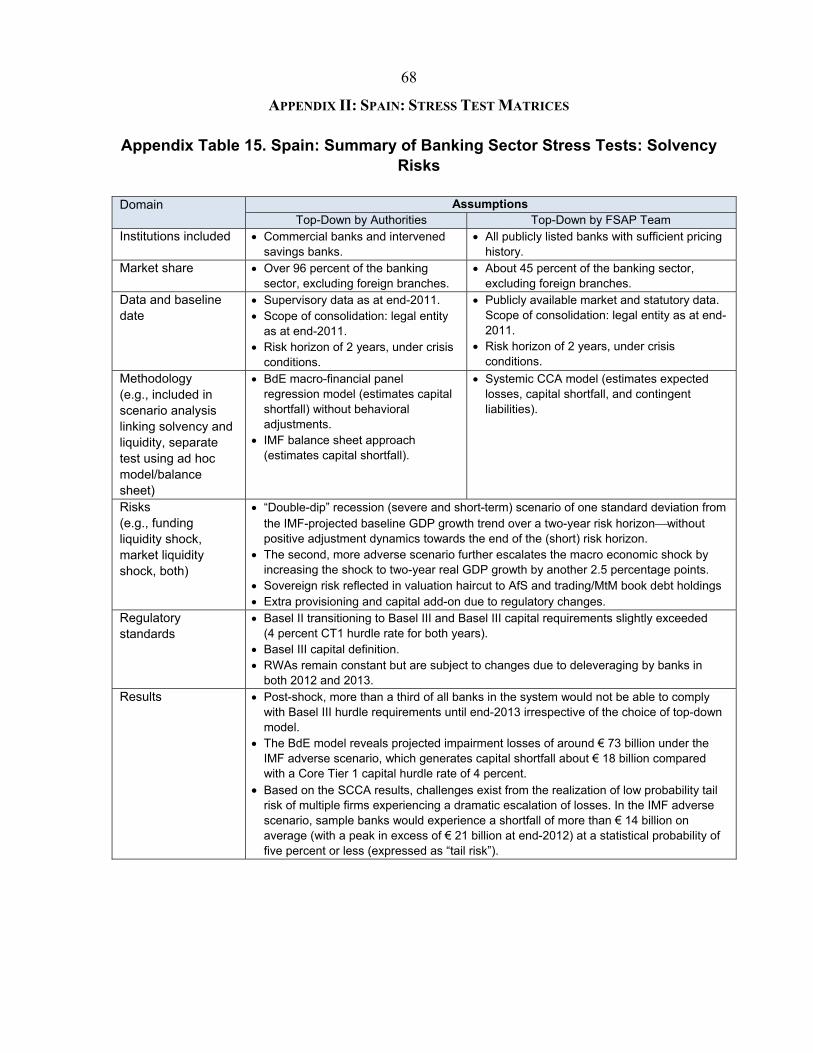
68
APPENDIX II: SPAIN: STRESS TEST MATRICES Appendix Table 15. Spain: Summary of Banking Sector Stress Tests: Solvency
Risks Domain Assumptions
Top-Down by Authorities Top-Down by FSAP TeamInstitutions included Commercial banks and intervened
savings banks. All publicly listed banks with sufficient pricing
history. Market share Over 96 percent of the banking
sector, excluding foreign branches. About 45 percent of the banking sector,
excluding foreign branches. Data and baseline date
Supervisory data as at end-2011. Scope of consolidation: legal entity
as at end-2011. Risk horizon of 2 years, under crisis
conditions.
Publicly available market and statutory data. Scope of consolidation: legal entity as at end-2011.
Risk horizon of 2 years, under crisis conditions.
Methodology (e.g., included in scenario analysis linking solvency and liquidity, separate test using ad hoc model/balance sheet)
BdE macro-financial panel regression model (estimates capital shortfall) without behavioral adjustments.
IMF balance sheet approach (estimates capital shortfall).
Systemic CCA model (estimates expected losses, capital shortfall, and contingent liabilities).
Risks (e.g., funding liquidity shock, market liquidity shock, both)
“Double-dip” recession (severe and short-term) scenario of one standard deviation from the IMF-projected baseline GDP growth trend over a two-year risk horizonwithout positive adjustment dynamics towards the end of the (short) risk horizon.
The second, more adverse scenario further escalates the macro economic shock by increasing the shock to two-year real GDP growth by another 2.5 percentage points.
Sovereign risk reflected in valuation haircut to AfS and trading/MtM book debt holdings Extra provisioning and capital add-on due to regulatory changes.
Regulatory standards
Basel II transitioning to Basel III and Basel III capital requirements slightly exceeded (4 percent CT1 hurdle rate for both years).
Basel III capital definition. RWAs remain constant but are subject to changes due to deleveraging by banks in
both 2012 and 2013. Results Post-shock, more than a third of all banks in the system would not be able to comply
with Basel III hurdle requirements until end-2013 irrespective of the choice of top-down model.
The BdE model reveals projected impairment losses of around € 73 billion under the IMF adverse scenario, which generates capital shortfall about € 18 billion compared with a Core Tier 1 capital hurdle rate of 4 percent.
Based on the SCCA results, challenges exist from the realization of low probability tail risk of multiple firms experiencing a dramatic escalation of losses. In the IMF adverse scenario, sample banks would experience a shortfall of more than € 14 billion on average (with a peak in excess of € 21 billion at end-2012) at a statistical probability of five percent or less (expressed as “tail risk”).
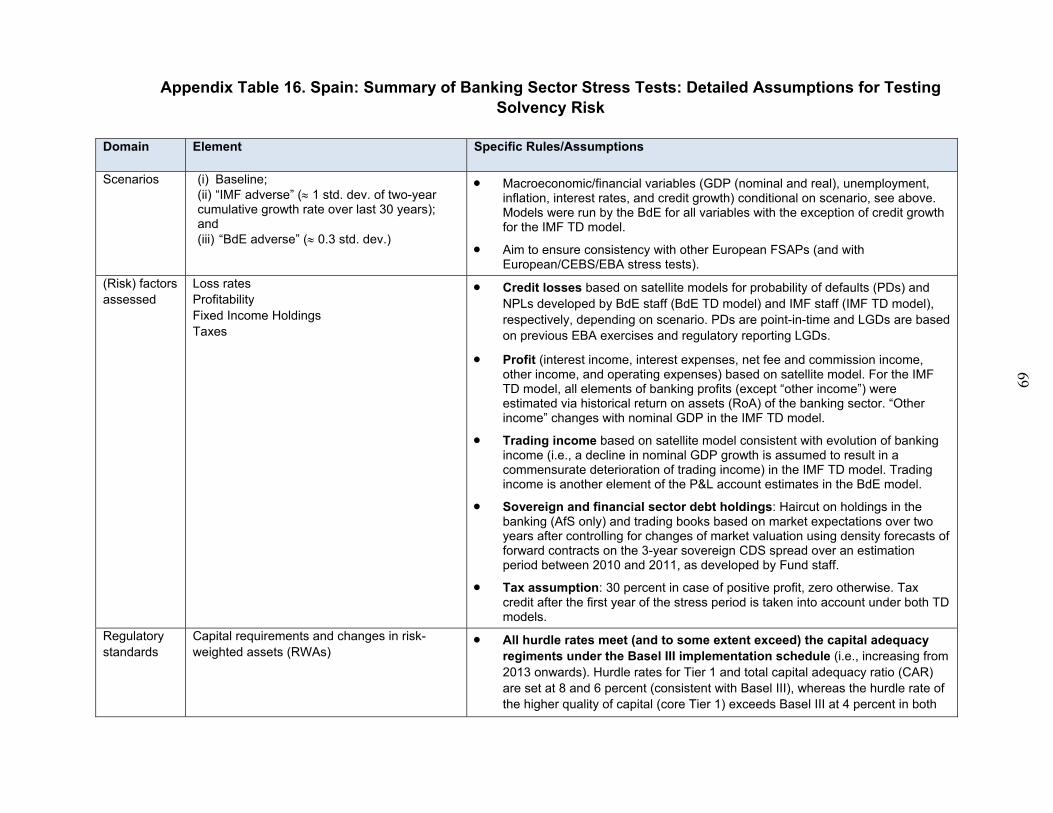
69
Appendix Table 16. Spain: Summary of Banking Sector Stress Tests: Detailed Assumptions for Testing Solvency Risk
Domain
Element Specific Rules/Assumptions
Scenarios (i) Baseline; (ii) “IMF adverse” ( 1 std. dev. of two-year cumulative growth rate over last 30 years); and (iii) “BdE adverse” ( 0.3 std. dev.)
Macroeconomic/financial variables (GDP (nominal and real), unemployment, inflation, interest rates, and credit growth) conditional on scenario, see above. Models were run by the BdE for all variables with the exception of credit growth for the IMF TD model.
Aim to ensure consistency with other European FSAPs (and with European/CEBS/EBA stress tests).
(Risk) factors assessed
Loss rates Profitability Fixed Income Holdings Taxes
Credit losses based on satellite models for probability of defaults (PDs) and NPLs developed by BdE staff (BdE TD model) and IMF staff (IMF TD model), respectively, depending on scenario. PDs are point-in-time and LGDs are based on previous EBA exercises and regulatory reporting LGDs.
Profit (interest income, interest expenses, net fee and commission income, other income, and operating expenses) based on satellite model. For the IMF TD model, all elements of banking profits (except “other income”) were estimated via historical return on assets (RoA) of the banking sector. “Other income” changes with nominal GDP in the IMF TD model.
Trading income based on satellite model consistent with evolution of banking income (i.e., a decline in nominal GDP growth is assumed to result in a commensurate deterioration of trading income) in the IMF TD model. Trading income is another element of the P&L account estimates in the BdE model.
Sovereign and financial sector debt holdings: Haircut on holdings in the banking (AfS only) and trading books based on market expectations over two years after controlling for changes of market valuation using density forecasts of forward contracts on the 3-year sovereign CDS spread over an estimation period between 2010 and 2011, as developed by Fund staff.
Tax assumption: 30 percent in case of positive profit, zero otherwise. Tax credit after the first year of the stress period is taken into account under both TD models.
Regulatory standards
Capital requirements and changes in risk-weighted assets (RWAs)
All hurdle rates meet (and to some extent exceed) the capital adequacy regiments under the Basel III implementation schedule (i.e., increasing from 2013 onwards). Hurdle rates for Tier 1 and total capital adequacy ratio (CAR) are set at 8 and 6 percent (consistent with Basel III), whereas the hurdle rate of the higher quality of capital (core Tier 1) exceeds Basel III at 4 percent in both
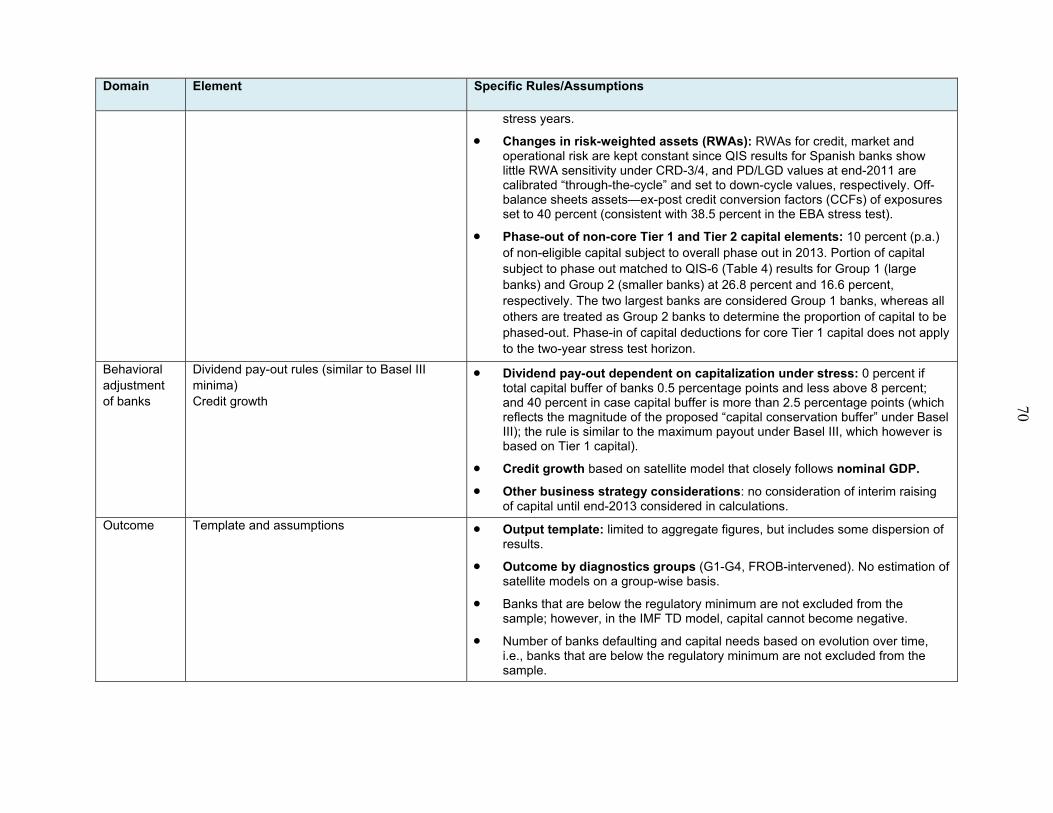
70
Domain
Element Specific Rules/Assumptions
stress years.
Changes in risk-weighted assets (RWAs): RWAs for credit, market and operational risk are kept constant since QIS results for Spanish banks show little RWA sensitivity under CRD-3/4, and PD/LGD values at end-2011 are calibrated “through-the-cycle” and set to down-cycle values, respectively. Off-balance sheets assets—ex-post credit conversion factors (CCFs) of exposures set to 40 percent (consistent with 38.5 percent in the EBA stress test).
Phase-out of non-core Tier 1 and Tier 2 capital elements: 10 percent (p.a.) of non-eligible capital subject to overall phase out in 2013. Portion of capital subject to phase out matched to QIS-6 (Table 4) results for Group 1 (large banks) and Group 2 (smaller banks) at 26.8 percent and 16.6 percent, respectively. The two largest banks are considered Group 1 banks, whereas all others are treated as Group 2 banks to determine the proportion of capital to be phased-out. Phase-in of capital deductions for core Tier 1 capital does not apply to the two-year stress test horizon.
Behavioral adjustment of banks
Dividend pay-out rules (similar to Basel III minima) Credit growth
Dividend pay-out dependent on capitalization under stress: 0 percent if total capital buffer of banks 0.5 percentage points and less above 8 percent; and 40 percent in case capital buffer is more than 2.5 percentage points (which reflects the magnitude of the proposed “capital conservation buffer” under Basel III); the rule is similar to the maximum payout under Basel III, which however is based on Tier 1 capital).
Credit growth based on satellite model that closely follows nominal GDP.
Other business strategy considerations: no consideration of interim raising of capital until end-2013 considered in calculations.
Outcome Template and assumptions Output template: limited to aggregate figures, but includes some dispersion of results.
Outcome by diagnostics groups (G1-G4, FROB-intervened). No estimation of satellite models on a group-wise basis.
Banks that are below the regulatory minimum are not excluded from the sample; however, in the IMF TD model, capital cannot become negative.
Number of banks defaulting and capital needs based on evolution over time, i.e., banks that are below the regulatory minimum are not excluded from the sample.
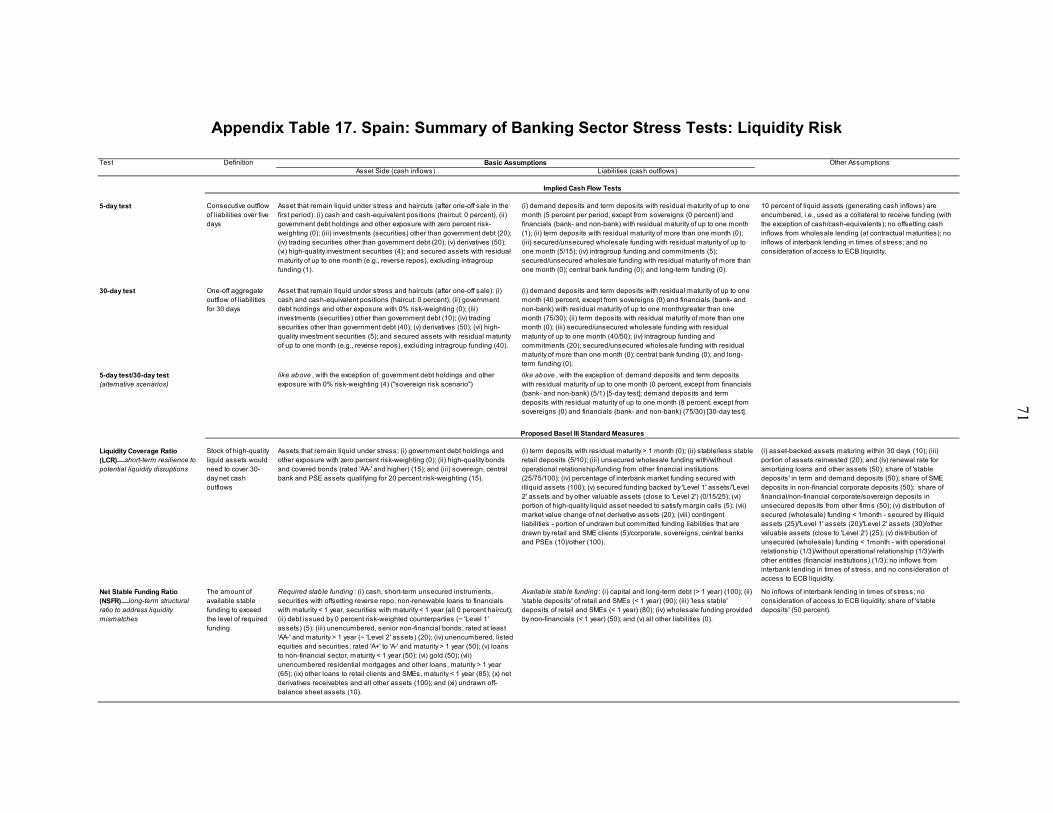
71
Appendix Table 17. Spain: Summary of Banking Sector Stress Tests: Liquidity Risk
Test Definition Other AssumptionsAsset Side (cash inflows) Liabilities (cash outflows)
5-day test Consecutive outflow of liabilities over five days
Asset that remain liquid under stress and haircuts (after one-off sale in the first period): (i) cash and cash-equivalent positions (haircut: 0 percent), (ii) government debt holdings and other exposure with zero percent risk-weighting (0); (iii) investments (securities) other than government debt (20); (iv) trading securities other than government debt (20); (v) derivatives (50); (vi) high-quality investment securities (4); and secured assets with residual maturity of up to one month (e.g., reverse repos), excluding intragroup funding (1).
(i) demand deposits and term deposits with residual maturity of up to one month (5 percent per period, except from sovereigns (0 percent) and financials (bank- and non-bank) with residual maturity of up to one month (1); (ii) term deposits with residual maturity of more than one month (0); (iii) secured/unsecured wholesale funding with residual maturity of up to one month (5/15); (iv) intragroup funding and commitments (5); secured/unsecured wholesale funding with residual maturity of more than one month (0); central bank funding (0); and long-term funding (0).
30-day test One-off aggregate outflow of liabilities for 30 days
Asset that remain liquid under stress and haircuts (after one-off sale): (i) cash and cash-equivalent positions (haircut: 0 percent); (ii) government debt holdings and other exposure with 0% risk-weighting (0); (iii) investments (securities) other than government debt (10); (iv) trading securities other than government debt (40); (v) derivatives (50); (vi) high-quality investment securities (5); and secured assets with residual maturity of up to one month (e.g., reverse repos), excluding intragroup funding (40).
(i) demand deposits and term deposits with residual maturity of up to one month (40 percent, except from sovereigns (0) and financials (bank- and non-bank) with residual maturity of up to one month/greater than one month (75/30); (ii) term deposits with residual maturity of more than one month (0); (iii) secured/unsecured wholesale funding with residual maturity of up to one month (40/50); (iv) intragroup funding and commitments (20); secured/unsecured wholesale funding with residual maturity of more than one month (0); central bank funding (0); and long-term funding (0).
5-day test/30-day test (alternative scenarios)
like above , with the exception of: government debt holdings and other exposure with 0% risk-weighting (4) ("sovereign risk scenario")
like above , with the exception of: demand deposits and term deposits with residual maturity of up to one month (0 percent, except from financials (bank- and non-bank) (5/1) [5-day test]; demand deposits and term deposits with residual maturity of up to one month (8 percent, except from sovereigns (0) and financials (bank- and non-bank) (75/30) [30-day test].
Liquidity Coverage Ratio (LCR)short-term resilience to potential liquidity disruptions
Stock of high-quality liquid assets would need to cover 30-day net cash outflows
Assets that remain liquid under stress: (i) government debt holdings and other exposure with zero percent risk-weighting (0); (ii) high-quality bonds and covered bonds (rated 'AA-' and higher) (15); and (iii) sovereign, central bank and PSE assets qualifying for 20 percent risk-weighting (15).
(i) term deposits with residual maturity > 1 month (0); (ii) stable/less stable retail deposits (5/10); (iii) unsecured wholesale funding with/without operational relationship/funding from other financial institutions (25/75/100); (iv) percentage of interbank market funding secured with illiquid assets (100); (v) secured funding backed by 'Level 1' assets/'Level 2' assets and by other valuable assets (close to 'Level 2') (0/15/25); (vi) portion of high-quality liquid asset needed to satisfy margin calls (5); (vii) market value change of net derivative assets (20); (viii) contingent liabilities - portion of undrawn but committed funding liabilities that are drawn by retail and SME clients (5)/corporate, sovereigns, central banks and PSEs (10)/other (100).
(i) asset-backed assets maturing within 30 days (10); (iii) portion of assets reinvested (20); and (iv) renewal rate for amortizing loans and other assets (50); share of 'stable deposits' in term and demand deposits (50); share of SME deposits in non-financial corporate deposits (50); share of financial/non-financial corporate/sovereign deposits in unsecured deposits from other firms (50); (v) distribution of secured (wholesale) funding < 1month - secured by illiquid assets (25)/'Level 1' assets (20)/'Level 2' assets (30)/other valuable assets (close to 'Level 2') (25); (v) distribution of unsecured (wholesale) funding < 1month - with operational relationship (1/3)/without operational relationship (1/3)/with other entities (financial institutions) (1/3); no inflows from interbank lending in times of stress, and no consideration of access to ECB liquidity.
Net Stable Funding Ratio (NSFR) long-term structural ratio to address liquidity mismatches
The amount of available stable funding to exceed the level of required funding.
Required stab le funding : (i) cash, short-term unsecured instruments, securities with offsetting reverse repo, non-renewable loans to financials with maturity < 1 year, securities with maturity < 1 year (all 0 percent haircut); (ii) debt issued by 0 percent risk-weighted counterparties (~ 'Level 1' assets) (5); (iii) unencumbered, senior non-financial bonds, rated at least 'AA-' and maturity > 1 year (~ 'Level 2' assets) (20); (iv) unencumbered, listed equities and securities, rated 'A+' to 'A-' and maturity > 1 year (50); (v) loans to non-financial sector, maturity < 1 year (50); (vi) gold (50); (vii) unencumbered residential mortgages and other loans, maturity > 1 year (65); (ix) other loans to retail clients and SMEs, maturity < 1 year (85); (x) net derivatives receivables and all other assets (100); and (xi) undrawn off-balance sheet assets (10).
Availab le stab le funding : (i) capital and long-term debt (> 1 year) (100); (ii) 'stable deposits' of retail and SMEs (< 1 year) (90); (iii) 'less stable' deposits of retail and SMEs (< 1 year) (80); (iv) wholesale funding provided by non-financials (< 1 year) (50); and (v) all other liabilities (0).
No inflows of interbank lending in times of stress; no consideration of access to ECB liquidity; share of 'stable deposits' (50 percent).
Basic Assumptions
Implied Cash Flow Tests
Proposed Basel III Standard Measures
10 percent of liquid assets (generating cash inflows) are encumbered, i.e., used as a collateral to receive funding (with the exception of cash/cash-equivalents); no offsetting cash inflows from wholesale lending (at contractual maturities); no inflows of interbank lending in times of stress; and no consideration of access to ECB liquidity.
72
APPENDIX III: DETAILS OF SOLVENCY STRESS TEST METHODOLOGIES AND ASSUMPTIONS
The BdE top-down model
81. The BdE model provides a quantitative framework for assessing how shocks transmit through balance sheets:
Satellite models are used to generate idiosyncratic variables using the macro-financial variables derived from the BdE’s macro models, that is, projections for key banking sector variables conditional on the choice of the macro-financial environment are produced.
A set of independent panel data estimations are then used to map projections of key macroeconomic variables into bank-specific profit and loss numbers, focusing on five key headline items: net interest income, net fees and commissions, operating expenses, and PDs for different loan types (mortgages, real estate developers, and corporate credit).
Credit losses are estimated using a system of regressions that link NPLs (based on forecasted PDs) and periodic exposures to broad asset classes to a set of empirically relevant macro indicators (e.g., real GDP growth, house prices).
However, the these estimations do not account for feedback effects between bank behavior and the real economy and consider only the average market value changes of banks’ exposures (e.g., as credit losses rise, for example, spreads on risky lending to firms and households change uniformly).
Incorporation of Royal Decree Laws
82. The potential impact of the new financial regulation approved by the RDL 02/2012 (issued on February 3, 2012) and RDL 18/2012 (issued on May 12, 2012) is taken into account in the FSAP’s solvency stress tests. The inclusion of the RDL requirements into the design of the tests enables a comprehensive assessment of banks’ risk-absorption capacity in light of substantial asset quality challenges to banks’ real estate portfolios. Due to the timing of the stress test exercise, the comprehensive capital assessment for all three top-down approaches was completed with the impact of RDL 02/2012. Upon announcement by the Spanish government that banks would be required to set aside an additional € 30 billion in provisions against performing real estate exposures (RDL 18/2012) on May 11, 2012, the stress test exercise was repeated―but only for the BdE TD model.
83. The RDL 02/2012 is a one-off measure that requires banks to recognize losses from real estate-related exposures in a timely manner. It covers problematic real estate loans (substandard and doubtful loans to developers and promoters, as well as foreclosed
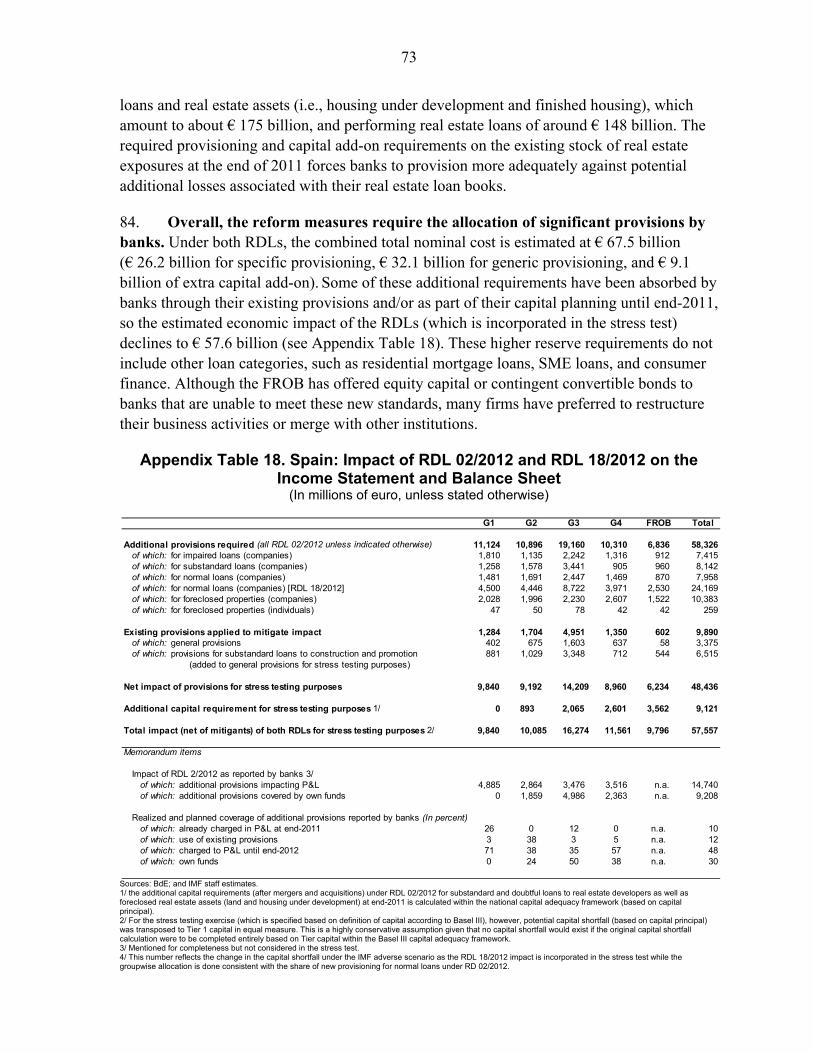
73
loans and real estate assets (i.e., housing under development and finished housing), which amount to about € 175 billion, and performing real estate loans of around € 148 billion. The required provisioning and capital add-on requirements on the existing stock of real estate exposures at the end of 2011 forces banks to provision more adequately against potential additional losses associated with their real estate loan books.
84. Overall, the reform measures require the allocation of significant provisions by banks. Under both RDLs, the combined total nominal cost is estimated at € 67.5 billion (€ 26.2 billion for specific provisioning, € 32.1 billion for generic provisioning, and € 9.1 billion of extra capital add-on). Some of these additional requirements have been absorbed by banks through their existing provisions and/or as part of their capital planning until end-2011, so the estimated economic impact of the RDLs (which is incorporated in the stress test) declines to € 57.6 billion (see Appendix Table 18). These higher reserve requirements do not include other loan categories, such as residential mortgage loans, SME loans, and consumer finance. Although the FROB has offered equity capital or contingent convertible bonds to banks that are unable to meet these new standards, many firms have preferred to restructure their business activities or merge with other institutions.
Appendix Table 18. Spain: Impact of RDL 02/2012 and RDL 18/2012 on the Income Statement and Balance Sheet
(In millions of euro, unless stated otherwise)
Sources: BdE; and IMF staff estimates. 1/ the additional capital requirements (after mergers and acquisitions) under RDL 02/2012 for substandard and doubtful loans to real estate developers as well as foreclosed real estate assets (land and housing under development) at end-2011 is calculated within the national capital adequacy framework (based on capital principal). 2/ For the stress testing exercise (which is specified based on definition of capital according to Basel III), however, potential capital shortfall (based on capital principal) was transposed to Tier 1 capital in equal measure. This is a highly conservative assumption given that no capital shortfall would exist if the original capital shortfall calculation were to be completed entirely based on Tier capital within the Basel III capital adequacy framework. 3/ Mentioned for completeness but not considered in the stress test. 4/ This number reflects the change in the capital shortfall under the IMF adverse scenario as the RDL 18/2012 impact is incorporated in the stress test while the groupwise allocation is done consistent with the share of new provisioning for normal loans under RD 02/2012.
G1 G2 G3 G4 FROB Total
Additional provisions required (all RDL 02/2012 unless indicated otherwise) 11,124 10,896 19,160 10,310 6,836 58,326of which: for impaired loans (companies) 1,810 1,135 2,242 1,316 912 7,415of which: for substandard loans (companies) 1,258 1,578 3,441 905 960 8,142of which: for normal loans (companies) 1,481 1,691 2,447 1,469 870 7,958of which: for normal loans (companies) [RDL 18/2012] 4,500 4,446 8,722 3,971 2,530 24,169of which: for foreclosed properties (companies) 2,028 1,996 2,230 2,607 1,522 10,383of which: for foreclosed properties (individuals) 47 50 78 42 42 259
Existing provisions applied to mitigate impact 1,284 1,704 4,951 1,350 602 9,890of which: general provisions 402 675 1,603 637 58 3,375of which: provisions for substandard loans to construction and promotion 881 1,029 3,348 712 544 6,515
(added to general provisions for stress testing purposes)
Net impact of provisions for stress testing purposes 9,840 9,192 14,209 8,960 6,234 48,436
Additional capital requirement for stress testing purposes 1/ 0 893 2,065 2,601 3,562 9,121
Total impact (net of mitigants) of both RDLs for stress testing purposes 2/ 9,840 10,085 16,274 11,561 9,796 57,557
Memorandum items
Impact of RDL 2/2012 as reported by banks 3/of which: additional provisions impacting P&L 4,885 2,864 3,476 3,516 n.a. 14,740of which: additional provisions covered by own funds 0 1,859 4,986 2,363 n.a. 9,208
Realized and planned coverage of additional provisions reported by banks (In percent)of which: already charged in P&L at end-2011 26 0 12 0 n.a. 10of which: use of existing provisions 3 38 3 5 n.a. 12of which: charged to P&L until end-2012 71 38 35 57 n.a. 48of which: own funds 0 24 50 38 n.a. 30
74
85. For the FSAP stress tests, the economic impact of higher loan loss reserves and capital requirements was estimated by BdE staff on a bank-by-bank basis and then integrated in both TD approaches. The following rationale was applied to determine the effect of the RDL on the capital assessment:
Provisioning for normal loans and additional provisions for substandard loans. Given that performing and substandard loans account for part of the loan losses under stress, overall impairment losses of a given firm below the sum of the required coverage (30 percent on average) of normal loans and the new provisions for substandard loans (between 20 and 80 percent depending on the type of real estate collateral) trigger additional provisions to make up the differenceunless general provisions have been exhausted. Thus, the impairment losses considered in the stress test exercise embed the marginal effect of provisions under the RDL as long as the estimated impairment in the stress test plus the mitigating effect of general provisions covering the overall portfolio exceed the RDL requirement. In this context, the existing stock of specific provisions for substandard loans is included in the general provisions for mitigation purposes.
Additional provisions on doubtful loans and foreclosed properties. These are calculated as additional impairment losses in the profit and loss statement as further provisioning expenses to balance the difference between the stock of provisions needed to reach the proposed coverage established by the RDL and the current level of provisions. As such, they are considered a one-off expense during the first year of the forecast cast horizon and as such are included by adding to the total amount of expected losses. Any residual mitigation effect from general provisions is taken into account for the final estimate of additional provisions required.
Capital add-ons for substandard and doubtful loans as well as for foreclosed land and housing under construction. These apply to banks whose capital buffers at end-2011 were insufficient to cover the minimum requirement (after mergers and acquisitions) for substandard and doubtful loans to real estate developers (65 and 80 percent, respectively) as well as for foreclosed real estate assets in the form of land and housing under development (also 65 and 80 percent, respectively). The required capital add-on for each bank is defined within the national capital adequacy framework and constitutes the capital shortfall (if applicable) of reported capital principal over the regulatory minimum vis-à-vis the additional capital principal needed to reach the specified coverage rates (see above). However, for the stress testing exercisewhich is specified based on definition of capital according to Basel IIIany identified capital shortfall under capital principal, however, had to be treated as Tier 1 capital. This represents a highly conservative assumption given that no capital shortfall would exist if the original capital shortfall calculation were to be completed entirely within the Basel III capital adequacy framework.
75
Estimating sovereign haircuts
86. The calculation of haircuts under different adverse macro scenarios is based on the valuation of government bonds using forward-looking information from CDS markets.11 Sovereign bond prices for each year under each scenario are calculated contingent on changes in the term structure of the applicable risk-free rate and market expectations of default risk as reflected in the past dynamics of CDS spreads. So for all bonds of a sample country, the future prices over a forecast horizon (e.g., up to five years) are calculated by using the end-year risk-free rate and applying a density forecast of expected default risk based on the empirically derived probability distribution of the forward rates on sovereign CDS contracts at different maturities. In the case of Spain, the most liquid bonds at maturities of one, three, five, seven and ten years have been considered for this estimation, with the three-year maturity group of bonds being considered representative of the average duration of banks’ government bond holdings.
87. These haircuts have been applied to the trading book and the available-for-sale (AfS) portfolio of sample banks for key rate durations along the entire interest rate term structure based on end-2011 market data. The severity assumptions underpinning these haircuts are contingent on the chosen scenariocurrent market expectations (baseline scenario) and a high-percentile density forecast of the historical variation of forward contracts on sovereign CDS (adverse scenario). For the purposes of the FSAP, maturity-matched haircuts are applied at a reasonably high confidence levels of the density forecast (75th percentile) of idiosyncratic credit risk and a general interest rate shock of 50 basis points for the forecast horizon of two years (2012 and 2013) of the solvency stress test(s) (Appendix Table 19).
88. The general methodology for the estimation of such valuation haircuts was also applied to the stress testing exercises for the FSAPs for Germany and the United Kingdom in 2011.12 In response to suggestions regarding a more comprehensive estimation and application of valuation haircuts to government debt, in the case of Spain, the estimation of haircuts was extended beyond the original five-year maturity tenor to include all key rate durations of the interest rate term structure beyond one year.
11 See Jobst, Andreas, Daniel Hardy and Christian Schmieder, forthcoming, “Sovereign Haircuts,” IMF Working Paper. 12 For published (and abridged) versions, see: International Monetary Fund (IMF), 2011, “United Kingdom: Stress Testing the Banking Sector Technical Note,” Country Report No. 11/222 (Washington, August); and IMF, 2011, “Germany: Technical Note on Stress Testing,” Country Report No. 11/371 (Washington, December).
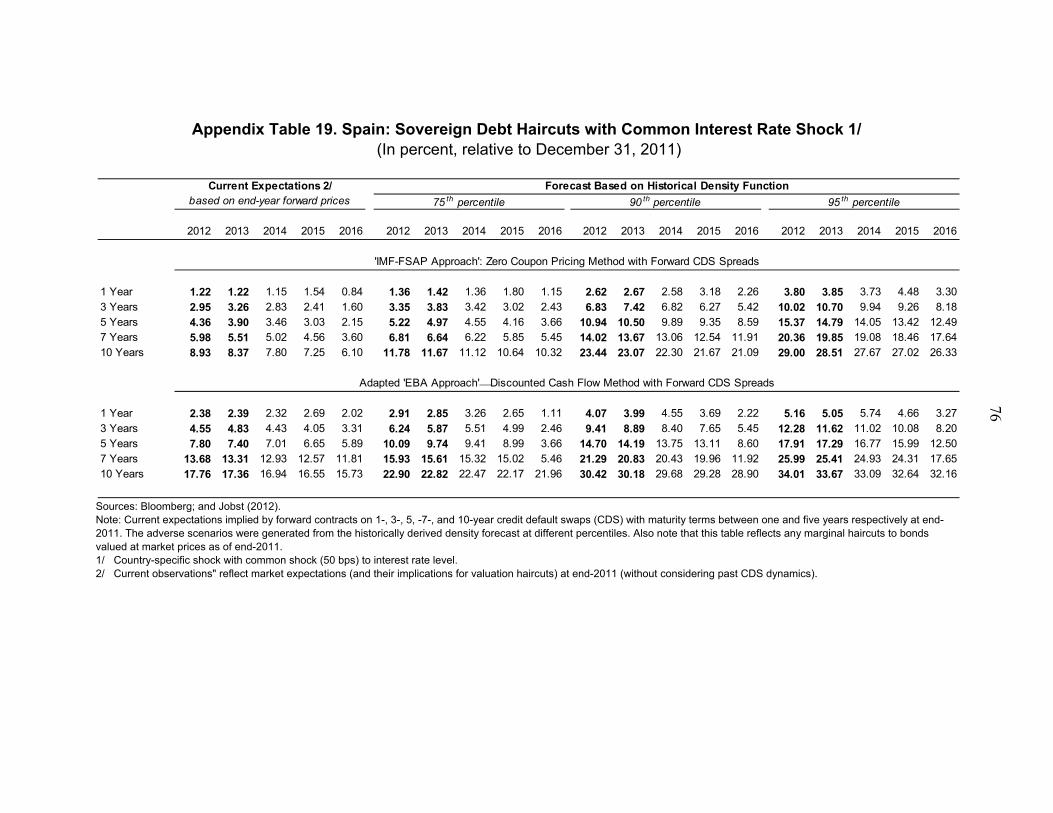
76
Appendix Table 19. Spain: Sovereign Debt Haircuts with Common Interest Rate Shock 1/ (In percent, relative to December 31, 2011)
Sources: Bloomberg; and Jobst (2012). Note: Current expectations implied by forward contracts on 1-, 3-, 5, -7-, and 10-year credit default swaps (CDS) with maturity terms between one and five years respectively at end-2011. The adverse scenarios were generated from the historically derived density forecast at different percentiles. Also note that this table reflects any marginal haircuts to bonds valued at market prices as of end-2011. 1/ Country-specific shock with common shock (50 bps) to interest rate level. 2/ Current observations" reflect market expectations (and their implications for valuation haircuts) at end-2011 (without considering past CDS dynamics).
2012 2013 2014 2015 2016 2012 2013 2014 2015 2016 2012 2013 2014 2015 2016 2012 2013 2014 2015 2016
1 Year 1.22 1.22 1.15 1.54 0.84 1.36 1.42 1.36 1.80 1.15 2.62 2.67 2.58 3.18 2.26 3.80 3.85 3.73 4.48 3.303 Years 2.95 3.26 2.83 2.41 1.60 3.35 3.83 3.42 3.02 2.43 6.83 7.42 6.82 6.27 5.42 10.02 10.70 9.94 9.26 8.185 Years 4.36 3.90 3.46 3.03 2.15 5.22 4.97 4.55 4.16 3.66 10.94 10.50 9.89 9.35 8.59 15.37 14.79 14.05 13.42 12.497 Years 5.98 5.51 5.02 4.56 3.60 6.81 6.64 6.22 5.85 5.45 14.02 13.67 13.06 12.54 11.91 20.36 19.85 19.08 18.46 17.6410 Years 8.93 8.37 7.80 7.25 6.10 11.78 11.67 11.12 10.64 10.32 23.44 23.07 22.30 21.67 21.09 29.00 28.51 27.67 27.02 26.33
1 Year 2.38 2.39 2.32 2.69 2.02 2.91 2.85 3.26 2.65 1.11 4.07 3.99 4.55 3.69 2.22 5.16 5.05 5.74 4.66 3.273 Years 4.55 4.83 4.43 4.05 3.31 6.24 5.87 5.51 4.99 2.46 9.41 8.89 8.40 7.65 5.45 12.28 11.62 11.02 10.08 8.205 Years 7.80 7.40 7.01 6.65 5.89 10.09 9.74 9.41 8.99 3.66 14.70 14.19 13.75 13.11 8.60 17.91 17.29 16.77 15.99 12.507 Years 13.68 13.31 12.93 12.57 11.81 15.93 15.61 15.32 15.02 5.46 21.29 20.83 20.43 19.96 11.92 25.99 25.41 24.93 24.31 17.6510 Years 17.76 17.36 16.94 16.55 15.73 22.90 22.82 22.47 22.17 21.96 30.42 30.18 29.68 29.28 28.90 34.01 33.67 33.09 32.64 32.16
Current Expectations 2/based on end-year forward prices 95 th percentile
'IMF-FSAP Approach': Zero Coupon Pricing Method with Forward CDS Spreads
Adapted 'EBA Approach'Discounted Cash Flow Method with Forward CDS Spreads
Forecast Based on Historical Density Function
75 th percentile 90 th percentile