sovereign debt sustainability in jamaica: a risk ... · according to goldfajn and guardia (2003),...
TRANSCRIPT
Working Paper: March 2004
Sovereign Debt Sustainability in Jamaica: A Risk Management Approach
Jide Lewis
Financial Stability Department Research and Economic Programming Division
Bank of Jamaica
Abstract This paper addresses some of the challenges associated with analyzing the sustainability of public debt in Jamaica by emphasizing the role that stochastic factors, including contingent liabilities, play in the evolution of debt dynamics. Similar to Garcia and Rigobon (2004), a VAR model is estimated and then used to simulate various debt paths based on the conditional means and variances of the reduced-form residuals. The modelling of the interdependence between the stochastic variables entering into the debt accumulation process is found to play a critical role the evolution of debt dynamics. Furthermore, the probability that the debt profile will exceed a given threshold is assessed and then used to compute a risk measure of debt sustainability. The exercise performed is akin to a stress test of the Government of Jamaica’s (GOJ) vulnerability to debt default. The risk measure for debt sustainability is found to have predictive value in tracking movements in the yield spreads on GOJ global bonds. The predictive power of the risk measure in explaining movements in GOJ spreads provides strong corroboration that the methodology captures a significant portion of market perception of the default risk in GOJ sovereign debt and, hence, can be used effectively in an early warning framework.
JEL Classification Numbers: H6, E6 Keywords: Early Warning; Sovereign Debt, VAR
Table of Contents
1. Introduction .............................................................................................................................. 3
2. Debt Sustainability: An Overview ........................................................................................... 4
3. Risk Management and Debt Sustainability: Methodology and Data ....................................... 6
4. Empirical Analysis of Jamaica’s Debt Sustainability Outlook .............................................. 12
4.1 Variance Covariance of Reduced Form Residuals....................................................... 12
4.2 Impulse responses ........................................................................................................ 12
4.3 Analysis of Debt Sustainability Prospects in the Absence of Risk .............................. 18
4.4 Risk based Analysis of Debt Sustainability – Monte Carlo Simulations ..................... 19
4.5 Sensitivity Analysis .................................................................................................... 21
4.6 Debt Sustainability and Sovereign Spreads ................................................................. 23
5. Conclusion ................................................................................................................... 25
Appendix.................................................................................................................................... 26
Bibliography............................................................................................................................... 27
2
1. Introduction
The sovereign risk associated with high levels of public debt and the large exposure of
banking institutions to these debt instruments has received considerable attention from
economic policy makers in recent years (see, for example, World Economic Outlook,
September 2003). Reflecting this growing concern, policy makers have focused attention
on developing frameworks which can assess the vulnerability of the emerging economies
to debt default and mitigate its impact on the economic performance and financial
stability of such economies. In Jamaica, approximately twenty-two per cent of the
banking sector’s asset base (J$ 105.3 billion) is comprised of claims to the public sector
via various types of government debt instruments.1 Consequently, a default on GOJ debt
instruments, especially one that affected both domestic and external creditors, would
likely derail monetary policy objectives and have serious repercussions for the viability
of banking organizations. The exposure to exogenous shocks inherent in an open
economy such as Jamaica, as well as the high level of indebtedness has raised many
questions for policymakers and the general public. For example, at what point does
public debt become too high?2 What can policy makers do to cushion the economy
against the risks that high debt presents, and, perhaps most importantly, what policy
actions does government need to take to ensure that its debt reduction strategy is
sustainable?
According to Goldfajn and Guardia (2003), debt sustainability exercises should focus on
medium and long-term scenarios, as well as, the probabilities associated with the
evolution of key variables in the debt accumulation process including, among others,
GDP growth, interest rates, and exchange rates. This paper addresses some of the
challenges associated with analyzing the sustainability of public debt in Jamaica by
emphasizing the role of stochastic factors, including contingent liabilities, on debt
dynamics. An assessment of the sensitivity of Jamaica’s public debt burden is conducted
by constructing a risk measure, which is derived from the likelihood of the debt to GDP 1 Government securities include Treasury bills, other GOJ securities, foreign currency GOJ instruments and LRS as at September 2004 for Commercial Banks, Building Societies, and Merchant Banks. 2 Economic theory provides little practical guidance on the optimum level of public debt as this varies with the specification of the model (see Aiyagari and McGrattan, 1998).
3
ratio exceeding a given threshold over a specific time-horizon. The analysis reveals
whether changes in the GDP growth rate, fiscal balance and real interest rate are
indicative of an improvement or deterioration in the debt sustainability dynamics in the
medium-term. This indicator of debt sustainability, to the extent that it can anticipate
deteriorations in the debt dynamics, can be used in conjunction with a stress-testing
framework to identify the impact of debt-dynamics on the portfolios of the financial
sector and thereby signal the necessary policy action, such as an adjustment to capital
adequacy allocation.3 The predictive power of the risk measure on the Euro-denominated
GOJ spreads provides strong corroboration that the methodology captures a significant
portion of market perception of the default risk in Jamaican sovereign debt and that it can
be used effectively in an early warning framework.
The paper has five sections. Section two gives a brief overview of the mainstream
approach to analyzing debt-sustainability. Section three discusses the empirical
framework used in this paper to assess the debt-dynamics in Jamaica between 1996 and
2004 and conducts a medium-term scenario based analysis. The fourth section discusses
the results. The final section summarizes the main findings and conclusions.
2. Debt Sustainability: An Overview
Much of the debt sustainability literature concentrates on the following debt
accumulation equation:
d ttttt fdgr +−+= −1)1( (1)
where is the debt to GDP ratio, is the real interest rate paid, is the growth rate
of GDP, and, is the primary deficit. The aim of the analysis is to determine the
primary surplus or growth rate of GDP that would maintain the debt at a certain level.
This equation has been critical in offering insights into various debt restructuring and
stabilization programmes. However, the static application of this identity may understate
td tr tg
tf
3 See Lewis (2004) for a stress-testing framework, which assesses the impact of macro-economic shocks on the portfolios of the banking sector in Jamaica.
4
or overstate the implicit risk associated with a given level of indebtedness, to the extent
that the variables in this identity are stochastic (uncertain) and perhaps, correlated. For
purposes of policy, one may be interested in the possible evolution of debt as a result of
changes in one of the underlying variables in the debt equation. Hence, the framework
would also have to account for the likelihood that the other variables would evolve
contemporaneously in response to movements in the policy variable of interest. Another
drawback of this approach is that it is often predicated on a notion of sustainability, as
defined by a constant debt-to-GDP ratio, which may not always be either desirable or
practical. Garcia (2004) notes that this approach may be of little practical policy use. He
suggests that since the purpose of accumulating debt in the first place is to smooth
consumption inter-temporally, it would be counter-intuitive to strive to keep the debt to
GDP ratio constant. Secondly, and perhaps more contextually relevant for Jamaica, if a
country faces significant levels of indebtedness or is highly vulnerable to external shocks,
then maintaining a constant debt to GDP level would not be sustainable.4
The evaluation of debt sustainability from a risk management perspective involves the
identification, measurement and assessment of adverse movements during the evolution
of the debt profile. The approach taken in the paper aims to promote insight into banking
sector risk exposure to sovereign debt default and facilitate proactive mitigation of
various risk factors from a policy implementation perspective.5
4 A high level public debt in this case would leave the country vulnerable to external shocks, such as a sudden a ‘sudden stop’ in capital flows or decline in GDP growth 5 See Chapter III September, 2003 World Economic Outlook (IMF 2003)
5
3. Risk Management and Debt Sustainability: Methodology and Data The paper follows the approach employed by Garcia and Rigobon (2004) in the
computation and assessment of GOJ debt dynamics. Innovative aspects of their approach
include the modelling of the impact of contingent liabilities and off-balance sheet items
on debt dynamics, as well as the impact of the greater relative volatility in the key
macroeconomic variables of emerging market economies. As such, the analysis accounts
for the fact that the variables entering into the equation are stochastic. Additionally,
variables that have a priori importance on the evolution of debt, such as the exchange
rate and the inflation rate, are included in the analysis.
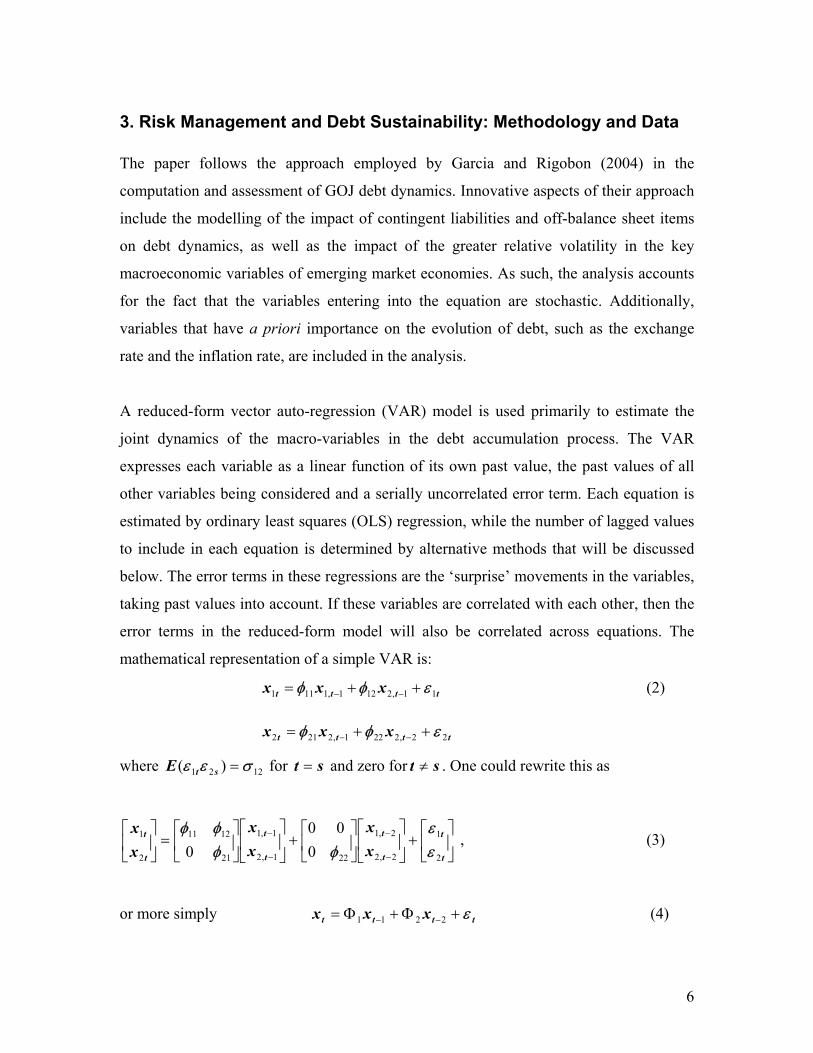
A reduced-form vector auto-regression (VAR) model is used primarily to estimate the
joint dynamics of the macro-variables in the debt accumulation process. The VAR
expresses each variable as a linear function of its own past value, the past values of all
other variables being considered and a serially uncorrelated error term. Each equation is
estimated by ordinary least squares (OLS) regression, while the number of lagged values
to include in each equation is determined by alternative methods that will be discussed
below. The error terms in these regressions are the ‘surprise’ movements in the variables,
taking past values into account. If these variables are correlated with each other, then the
error terms in the reduced-form model will also be correlated across equations. The
mathematical representation of a simple VAR is:
tttt xxx 11,2121,1111 εφφ ++= −− (2)
tttt xxx 22,2221,2212 εφφ ++= −−
where 1221 )( σεε =stE for st = and zero for st ≠ . One could rewrite this as
+
+
=
−
−
−
−
t
t
t
t
t
t
t
t
xx
xx
xx
2
1
2,2
2,1
221,2
1,1
21
1211
2
1
000
0 εε
φφφφ
, (3)
or more simply tttt xxx ε+Φ+Φ= −− 2211 (4)
6
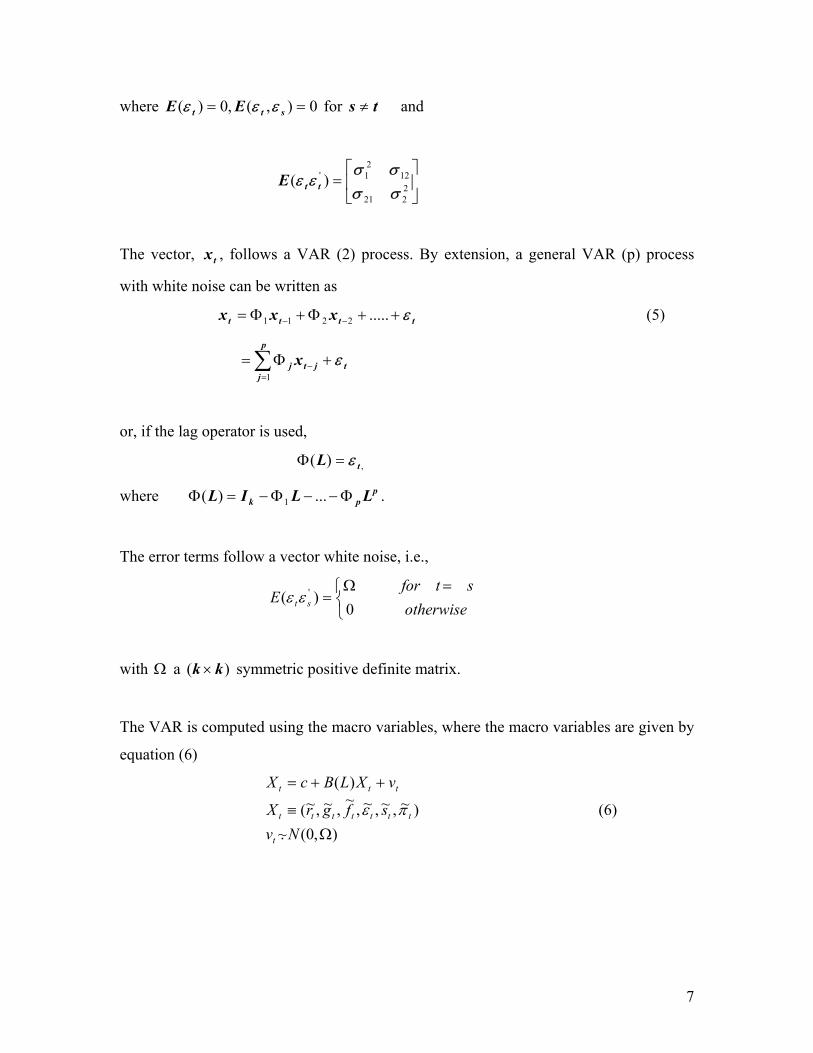
where 0),(,0)( == stt EE εεε for ts ≠ and
= 2
221
1221' )(
σσσσ
εε ttE
The vector, , follows a VAR (2) process. By extension, a general VAR (p) process
with white noise can be written as
tx
tttt xxx ε++Φ+Φ= −− .....2211 (5)
= ∑=
− +Φp
jtjtj x
1ε
or, if the lag operator is used,
,)( tL ε=Φ
where Φ . ppk LLIL Φ−−Φ−= ...)( 1
The error terms follow a vector white noise, i.e.,
E st )'εε otherwise
stfor =
Ω
=0
(
with Ω a symmetric positive definite matrix. )( kk ×
The VAR is computed using the macro variables, where the macro variables are given by
equation (6)
),0(.~)~,~,~,~,~,~(
)(
Ω≡
++=
NvsfgrX
vXLBcX
t
ttttttt
ttt
πε (6)
7
and ,~,~,~,~,~ttttt sfgr ε and tπ~ represent the real interest rate, growth rate of GDP, primary
deficit, debt shocks,6 real exchange rate, and inflation rate, respectively. The reduced-
form residuals, tν , are distributed multinomial normal with zero mean and covariance
matrix , and represents the coefficients of the lags. The lag length, L, for the
VAR is set at two, which is supported by both the Likelihood Ratio (LR) test and the
Akaike Information Criterion.
Ω )(LB
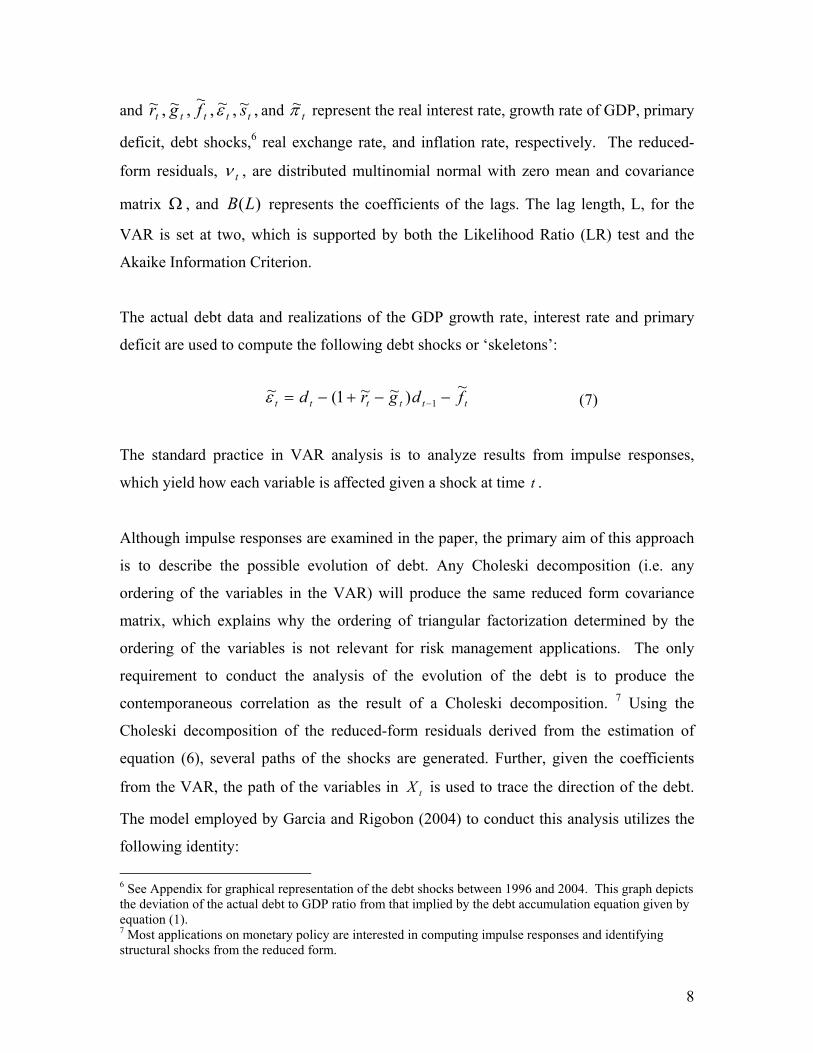
The actual debt data and realizations of the GDP growth rate, interest rate and primary
deficit are used to compute the following debt shocks or ‘skeletons’:
tttttt fdgrd ~)~~1(~1 −−+−= −ε (7)
The standard practice in VAR analysis is to analyze results from impulse responses,
which yield how each variable is affected given a shock at time . t
Although impulse responses are examined in the paper, the primary aim of this approach
is to describe the possible evolution of debt. Any Choleski decomposition (i.e. any
ordering of the variables in the VAR) will produce the same reduced form covariance
matrix, which explains why the ordering of triangular factorization determined by the
ordering of the variables is not relevant for risk management applications. The only
requirement to conduct the analysis of the evolution of the debt is to produce the
contemporaneous correlation as the result of a Choleski decomposition. 7 Using the
Choleski decomposition of the reduced-form residuals derived from the estimation of
equation (6), several paths of the shocks are generated. Further, given the coefficients
from the VAR, the path of the variables in is used to trace the direction of the debt.
The model employed by Garcia and Rigobon (2004) to conduct this analysis utilizes the
following identity:
tX
6 See Appendix for graphical representation of the debt shocks between 1996 and 2004. This graph depicts the deviation of the actual debt to GDP ratio from that implied by the debt accumulation equation given by equation (1). 7 Most applications on monetary policy are interested in computing impulse responses and identifying structural shocks from the reduced form.
8
d tttttt fdgr ε~~)~~1( 1 ++−+= − (8)
),(.~~,~,~,~,~,~tttttttt Nsfgr Σµπε
The stochastic variables in the identity are distributed multinomial8 normal with
conditional mean, tµ , and conditional covariance matrix, tΣ .
Using the VAR model to estimate possible paths of debt offers some advantages. First,
variables and shocks that are not part of the debt accumulation equation can still have an
impact of the debt dynamics. For example, the exchange rate, the terms of trade, and the
inflation rate can be included as variables in the VAR system. Even if variables are not
included, it is possible that the VAR could summarize their effect. Their impact on the
debt dynamics will show up either as GDP, inflation or real exchange rate movements.
Thus, the fact that the variable has been excluded from the VAR does not mean that its
effect has not been summarized in the variance-covariance matrix of the reduced form
residuals.
Second, the properties of the covariance matrix produced from the Choleski
decomposition may also be used to assess the sustainability of debt dynamics. For
example, in developed economies recessions (lower growth) are usually accompanied by
a decrease in interest rates (expansionary monetary policy). If this is the case, then
recession and the deterioration of the primary deficit – which are inimical to debt
sustainability – comes with a countervailing impact of a reduction in the interest rates –
which facilitates greater debt sustainability. Hence, implicit in the debt dynamics is an
automatic stabilizer. On the other hand, in many emerging market economies, a recession
usually deteriorates the fiscal accounts, increases the real interest rates, induces inflation
and depreciates the exchange rate. Additionally, if the economy has instruments in the
global market, such as bonds, the deterioration in the fiscal accounts may precipitate a
downgrade, requiring higher yields and exacerbating the financial cost of servicing the 8 This is a simplification that can be easily corrected in the Monte Carlo exercise. Here it is made mainly for expositional purposes.
9
debt. The increased likelihood of default can also result in capital flight, and if a
significant portion of sovereign debt is in foreign currency, then all the variables entering
into the debt dynamics equation will contribute to the deterioration in the debt dynamics.
This ‘vicious cycle’ of debt dynamics, arises when the correlations among the factors
impacting upon the debt accumulation process causes fiscal policy to become more pro-
cyclical. Thus, simulations that postulate independent paths for the relevant variables will
neglect the risk inherent in the correlation among these variables, which impact
significantly upon debt dynamics in emerging economies.
Third, using the Choleski decomposition of the reduced-form residuals and the
coefficients from the VAR model, one can compute several paths of the variables in .
These are used to project possible evolutions of the debt stock over time. This procedure
employs Monte Carlo analysis to determine the standard error bands for the debt profile.
The algorithm employs a simultaneous equation representation of an unrestricted VAR
(p) to evaluate equation (8). Given that the likelihood function of a VAR (p),
tX
),( ttxf ωθ where )](,[ υαθ Σ= vech can be decomposed into a normal distribution for
α conditional on and an inverted Wishart distribution for υΣ υΣ . It can be shown that the
posterior of Σ will have the same inverted Wishart distribution as the likelihood except
that now the degrees of freedom are (T-k), where k is the number of estimated
coefficients in each equation. On the other hand, the posterior of
υ
),( txυα Σ has a mean of
OLSα and variance equal )var( OLSα . With these results, standard error bands for the
stochastic forecast can be constructed using the following algorithm:
1. Generate T draws for k− iid tµ from where invN is the inverse of a normal distribution
))(),0( ' XAYXAyinvN OLSOLS −−
2. Form the second moments i.e. 2)(1 µµ −Σ−
=+ llkT
Σ where l = 1,2…L is
the number of draws and µlkTΣ
−=
1µbar
3. Set Σ =( ( l 1)−+Σ4. Draw α where ),0(.~, l
ttOLSl N Σ+= υυα )(Bvec=α where B=(B1,….Bp)
10
5. Compute B to derive the )(' l τ step ahead forecast for each draw l .6. Repeat steps 1 – 5 L times and report relevant percentiles of the distribution of
or compute the mean and the standard deviation of the forecast using simulated draws.
τB
The procedure is also used to estimate rolling regressions in order to assess the predictive
power of the model and perform out-of-sample tests. In so doing, the framework can be
used to derive a measure of debt sustainability which is based on the likelihood of the
debt ratio exceeding a given threshold over given time horizon.
The data employed in the analysis of debt dynamics in Jamaica are: the GDP growth rate,
the primary balance, the contingent liabilities or ‘skeletons’, the real interest rate and the
real exchange rate. The data are monthly for the sample period 1996:06 – 2004:08. Each
are these variables are represented as a share of GDP, with exception of the GDP growth
rate, the real interest rate, and the real exchange rate. As indicated in equation (7), the
skeletons are computed as the deviation of the actual debt to GDP ratio from that implied
by the debt accumulation equation given by equation (1).9 The real interest rate was
computed as the 6-month Treasury bill rate minus the inflation rate and the real exchange
rate computed as the nominal depreciation minus the inflation rate.10, 11 The spread on
Euro-denominated GOJ Bonds is used to measure country risk.
9 The ‘skeletons’ are a critical component of the analysis as they can have the (accounting) effect of leading to a deterioration in debt profile, which would otherwise not be captured as fiscal outlays for purposes of calculating the Public Sector Borrowing Requirement (PSBR). 10 Since the US inflation has very low variance in the sample, it is excluded from the real exchange rate calculation. Within the VAR framework, the constant term in the regression takes care of the effect of the US inflation on the real exchange rate. 11 One adjustment to the data was the use of six-month moving averages instead of monthly figures. This is because much of the latter series is quite volatile. For example, for the primary deficit, if some expenses were concentrated in a given month, the monthly series would show a large deficit among many surpluses, while the moving average would better reflect the fiscal stance.
11
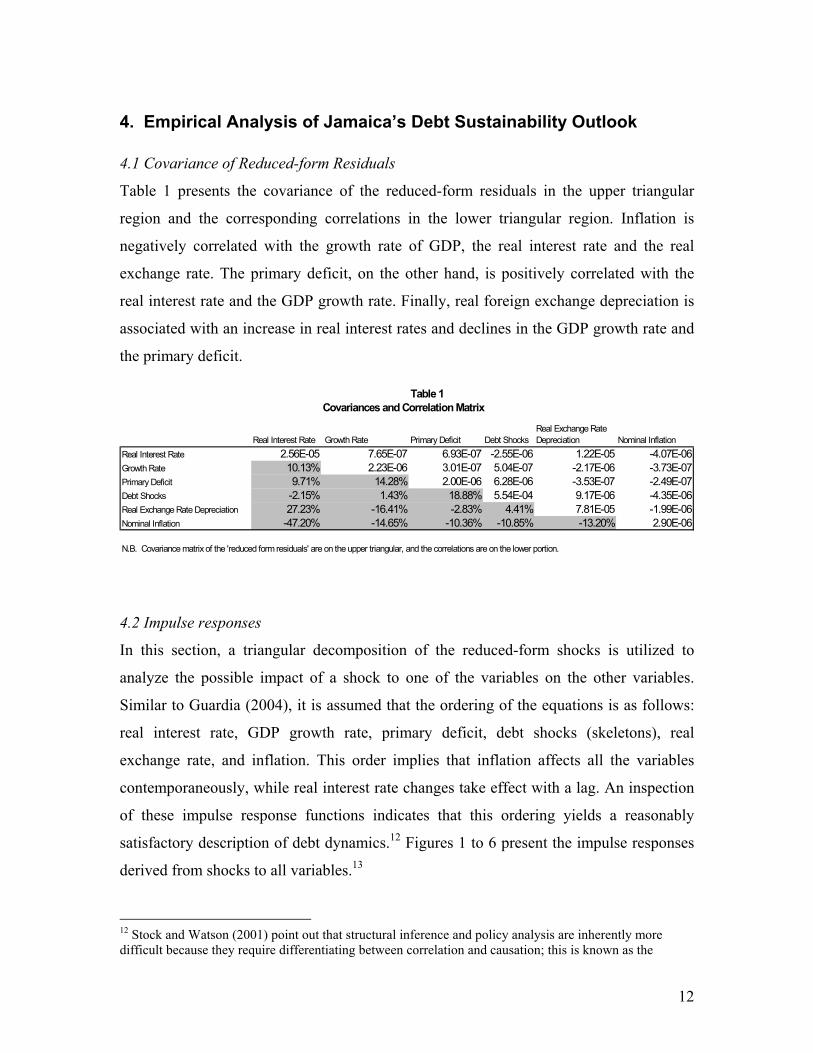
4. Empirical Analysis of Jamaica’s Debt Sustainability Outlook 4.1 Covariance of Reduced-form Residuals Table 1 presents the covariance of the reduced-form residuals in the upper triangular
region and the corresponding correlations in the lower triangular region. Inflation is
negatively correlated with the growth rate of GDP, the real interest rate and the real
exchange rate. The primary deficit, on the other hand, is positively correlated with the
real interest rate and the GDP growth rate. Finally, real foreign exchange depreciation is
associated with an increase in real interest rates and declines in the GDP growth rate and
the primary deficit.
Table 1Covariances and Correlation Matrix
Real Interest Rate Growth Rate Primary Deficit Debt ShocksReal Exchange Rate Depreciation Nominal Inflation
Real Interest Rate 2.56E-05 7.65E-07 6.93E-07 -2.55E-06 1.22E-05 -4.07E-06Growth Rate 10.13% 2.23E-06 3.01E-07 5.04E-07 -2.17E-06 -3.73E-07Primary Deficit 9.71% 14.28% 2.00E-06 6.28E-06 -3.53E-07 -2.49E-07Debt Shocks -2.15% 1.43% 18.88% 5.54E-04 9.17E-06 -4.35E-06Real Exchange Rate Depreciation 27.23% -16.41% -2.83% 4.41% 7.81E-05 -1.99E-06Nominal Inflation -47.20% -14.65% -10.36% -10.85% -13.20% 2.90E-06
N.B. Covariance matrix of the 'reduced form residuals' are on the upper triangular, and the correlations are on the lower portion.
4.2 Impulse responses
In this section, a triangular decomposition of the reduced-form shocks is utilized to
analyze the possible impact of a shock to one of the variables on the other variables.
Similar to Guardia (2004), it is assumed that the ordering of the equations is as follows:
real interest rate, GDP growth rate, primary deficit, debt shocks (skeletons), real
exchange rate, and inflation. This order implies that inflation affects all the variables
contemporaneously, while real interest rate changes take effect with a lag. An inspection
of these impulse response functions indicates that this ordering yields a reasonably
satisfactory description of debt dynamics.12 Figures 1 to 6 present the impulse responses
derived from shocks to all variables.13
12
12 Stock and Watson (2001) point out that structural inference and policy analysis are inherently more difficult because they require differentiating between correlation and causation; this is known as the
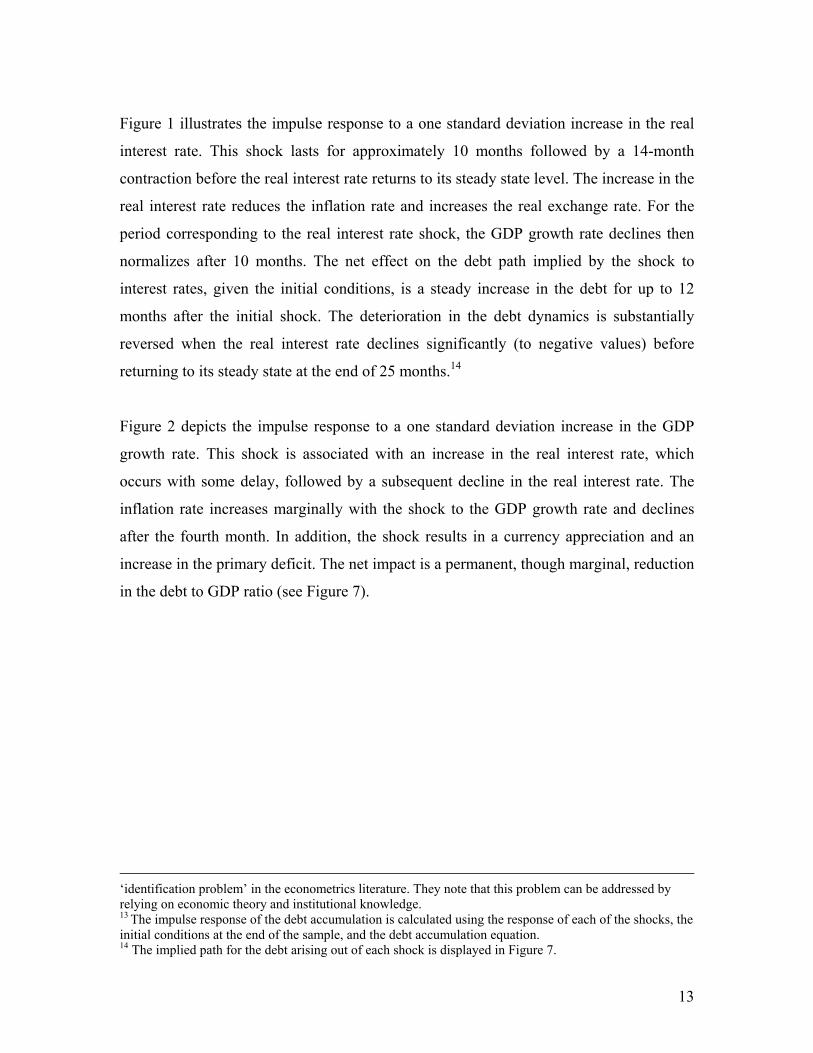
Figure 1 illustrates the impulse response to a one standard deviation increase in the real
interest rate. This shock lasts for approximately 10 months followed by a 14-month
contraction before the real interest rate returns to its steady state level. The increase in the
real interest rate reduces the inflation rate and increases the real exchange rate. For the
period corresponding to the real interest rate shock, the GDP growth rate declines then
normalizes after 10 months. The net effect on the debt path implied by the shock to
interest rates, given the initial conditions, is a steady increase in the debt for up to 12
months after the initial shock. The deterioration in the debt dynamics is substantially
reversed when the real interest rate declines significantly (to negative values) before
returning to its steady state at the end of 25 months.14
Figure 2 depicts the impulse response to a one standard deviation increase in the GDP
growth rate. This shock is associated with an increase in the real interest rate, which
occurs with some delay, followed by a subsequent decline in the real interest rate. The
inflation rate increases marginally with the shock to the GDP growth rate and declines
after the fourth month. In addition, the shock results in a currency appreciation and an
increase in the primary deficit. The net impact is a permanent, though marginal, reduction
in the debt to GDP ratio (see Figure 7).
‘identification problem’ in the econometrics literature. They note that this problem can be addressed by relying on economic theory and institutional knowledge. 13 The impulse response of the debt accumulation is calculated using the response of each of the shocks, the initial conditions at the end of the sample, and the debt accumulation equation. 14 The implied path for the debt arising out of each shock is displayed in Figure 7.
13
F ig u r e 1Im p u ls e r e s p o n s e to a n in c r e a s e in th e in t e r e s t r a te
- 0 . 0 0 8
- 0 . 0 0 6
- 0 . 0 0 4
- 0 . 0 0 2
0
0 . 0 0 2
0 . 0 0 4
0 . 0 0 6
0 . 0 0 8
0 .0 1
0 . 0 1 2
1 2 3 4 5 6 7 8 9 1 0 1 1 1 2 1 3 1 4 1 5 1 6 1 7 1 8 1 9 2 0 2 1 2 2 2 3 2 4 2 5 2 6 2 7 2 8 2 9 3 0
I n te r e s t R a te G r o w th P r im a r y D e f ic i tD e b t S h o c k R E R In f la t io n
F ig u re 2Im p u ls e r e s p o n s e to a n in c r e a s e in th e g r o w th r a te o f m o n th ly o u tp u t
- 0 .0 0 3
- 0 .0 0 2
- 0 .0 0 1
0
0 .0 0 1
0 .0 0 2
0 .0 0 3
0 .0 0 4
1 2 3 4 5 6 7 8 9 1 0 1 1 1 2 1 3 1 4 1 5 1 6 1 7 1 8 1 9 2 0 2 1 2 2 2 3 2 4 2 5 2 6 2 7 2 8 2 9 3 0
In te r e s t R a te G ro w th P r im a r y D e f ic i tD e b t S h o c k R E R In f la t io n
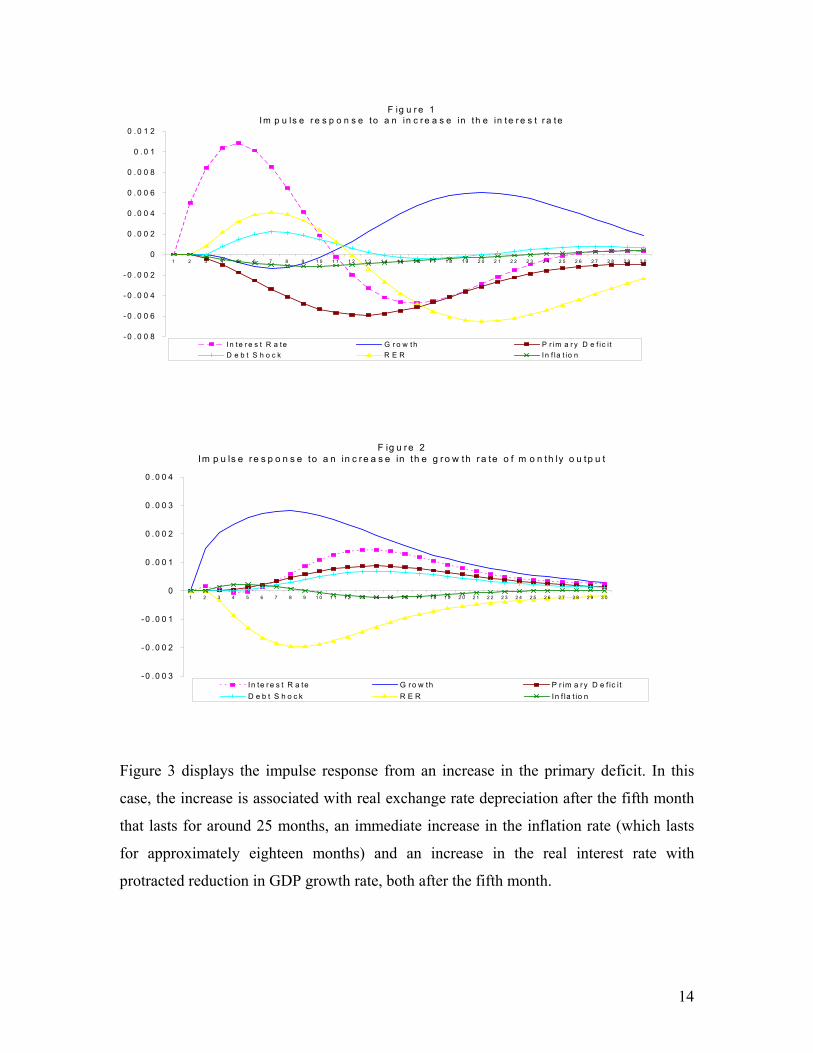
Figure 3 displays the impulse response from an increase in the primary deficit. In this
case, the increase is associated with real exchange rate depreciation after the fifth month
that lasts for around 25 months, an immediate increase in the inflation rate (which lasts
for approximately eighteen months) and an increase in the real interest rate with
protracted reduction in GDP growth rate, both after the fifth month.
14
F ig u re 3Im p u ls e re s p o n s e to a n in c re a s e in th e P r im a ry D e f ic it
-0 .0 0 4
-0 .0 0 3
-0 .0 0 2
-0 .0 0 1
0
0 .0 0 1
0 .0 0 2
0 .0 0 3
0 .0 0 4
0 .0 0 5
1 2 3 4 5 6 7 8 9 1 0 1 1 1 2 1 3 1 4 1 5 1 6 1 7 1 8 1 9 2 0 2 1 2 2 2 3 2 4 2 5 2 6 2 7 2 8 2 9 3 0
In te re s t R a te G ro w th P r im a ry D e f ic itD e b t S h o c k R E R In f la t io n
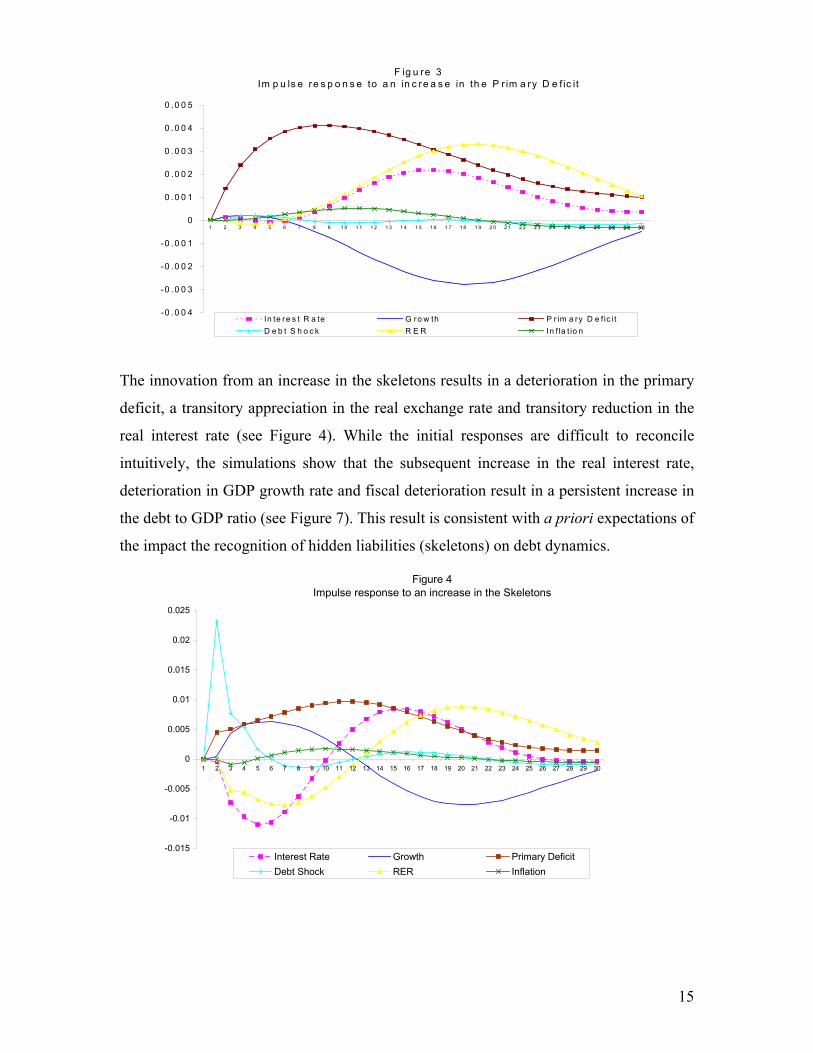
The innovation from an increase in the skeletons results in a deterioration in the primary
deficit, a transitory appreciation in the real exchange rate and transitory reduction in the
real interest rate (see Figure 4). While the initial responses are difficult to reconcile
intuitively, the simulations show that the subsequent increase in the real interest rate,
deterioration in GDP growth rate and fiscal deterioration result in a persistent increase in
the debt to GDP ratio (see Figure 7). This result is consistent with a priori expectations of
the impact the recognition of hidden liabilities (skeletons) on debt dynamics.
Figure 4Impulse response to an increase in the Skeletons
-0.015
-0.01
-0.005
0
0.005
0.01
0.015
0.02
0.025
1 2 3 4 5 6 7 8 9 10 11 12 13 14 15 16 17 18 19 20 21 22 23 24 25 26 27 28 29 30
Interest Rate Growth Primary DeficitDebt Shock RER Inflation
15
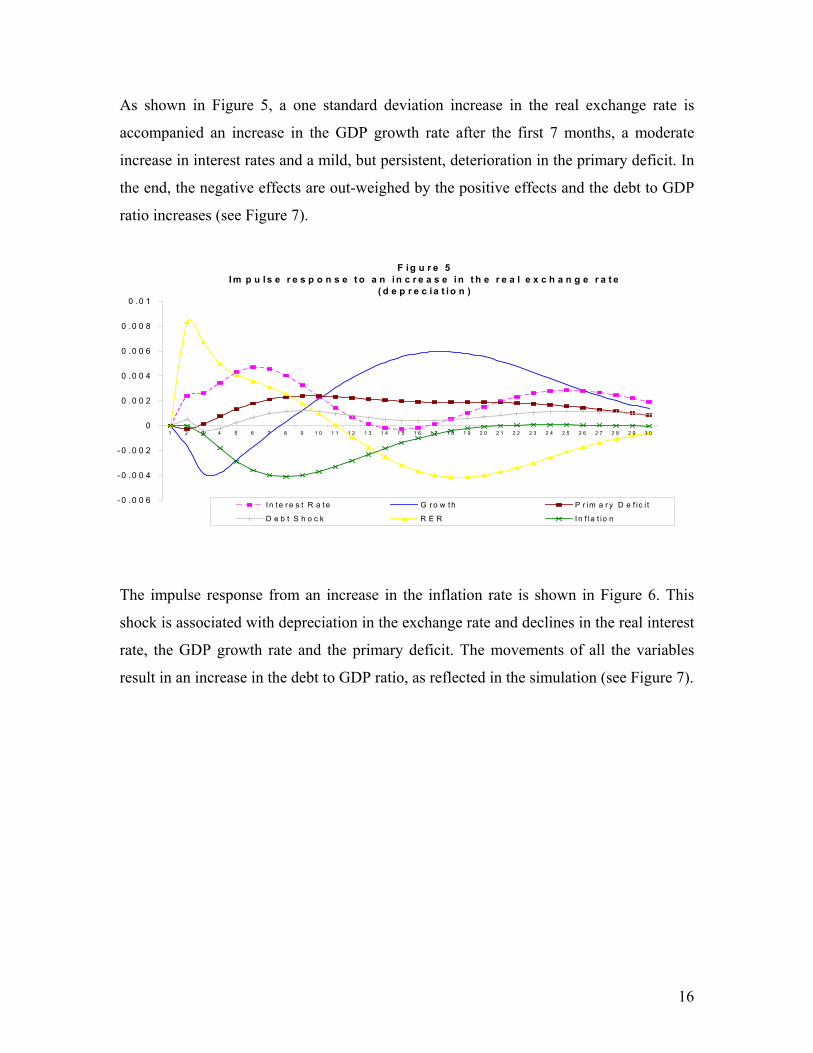
As shown in Figure 5, a one standard deviation increase in the real exchange rate is
accompanied an increase in the GDP growth rate after the first 7 months, a moderate
increase in interest rates and a mild, but persistent, deterioration in the primary deficit. In
the end, the negative effects are out-weighed by the positive effects and the debt to GDP
ratio increases (see Figure 7).
F i g u r e 5I m p u l s e r e s p o n s e t o a n i n c r e a s e i n t h e r e a l e x c h a n g e r a t e
( d e p r e c ia t i o n )
- 0 . 0 0 6
- 0 . 0 0 4
- 0 . 0 0 2
0
0 . 0 0 2
0 . 0 0 4
0 . 0 0 6
0 . 0 0 8
0 . 0 1
1 2 3 4 5 6 7 8 9 1 0 1 1 1 2 1 3 1 4 1 5 1 6 1 7 1 8 1 9 2 0 2 1 2 2 2 3 2 4 2 5 2 6 2 7 2 8 2 9 3 0
I n t e r e s t R a t e G r o w t h P r im a r y D e f ic i t
D e b t S h o c k R E R I n f la t io n
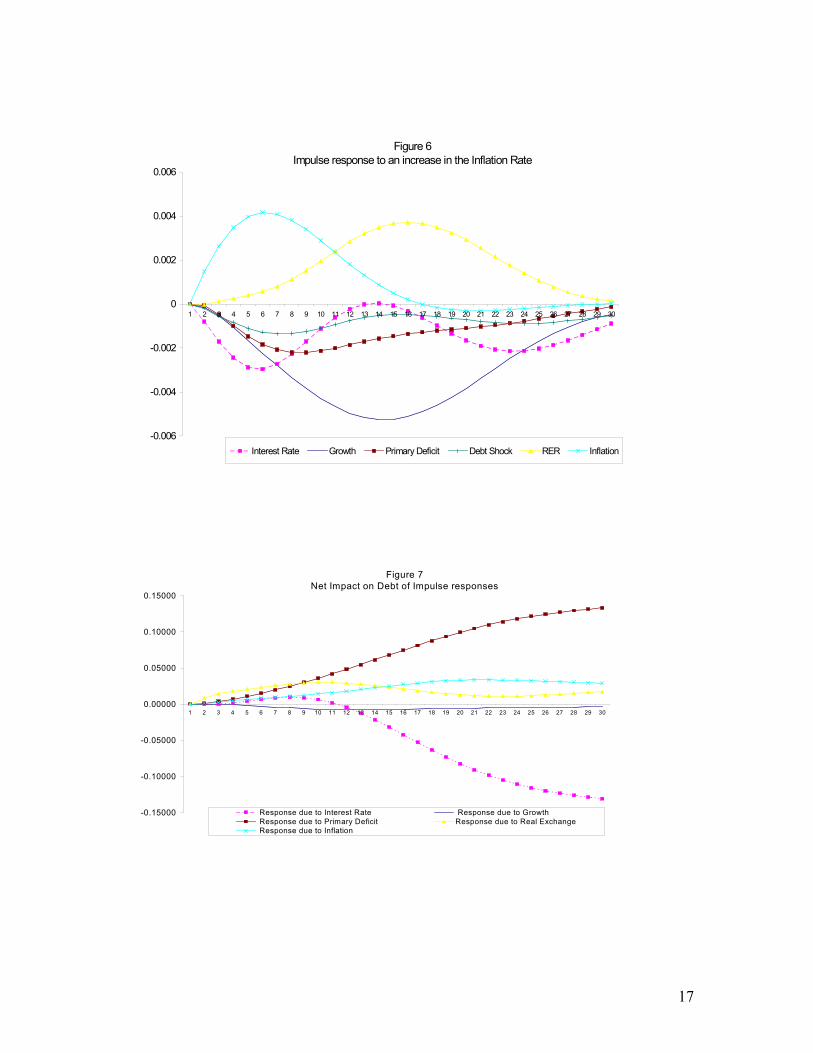
The impulse response from an increase in the inflation rate is shown in Figure 6. This
shock is associated with depreciation in the exchange rate and declines in the real interest
rate, the GDP growth rate and the primary deficit. The movements of all the variables
result in an increase in the debt to GDP ratio, as reflected in the simulation (see Figure 7).
16
-0.006
-0.004
-0.002
0
0.002
0.004
0.006
1 2 3 4 5 6 7 8 9 10 11 12 13 14 15 16 17 18 19 20 21 22 23 24 25 26 27 28 29 30
Interest Rate Growth Primary Deficit Debt Shock RER Inflation
Figure 6Impulse response to an increase in the Inflation Rate
-0.15000
-0.10000
-0.05000
0.00000
0.05000
0.10000
0.15000
1 2 3 4 5 6 7 8 9 10 11 12 13 14 15 16 17 18 19 20 21 22 23 24 25 26 27 28 29 30
Response due to Interest Rate Response due to Growth Response due to Primary Deficit Response due to Real Exchange Response due to Inflation
Figure 7Net Impact on Debt of Impulse responses
17
The co-movements observed in the variables of interest and the debt dynamics are
consistent with a priori expectations. The innovations to the primary deficit and the real
interest rate have the largest impact on the debt dynamics, followed by the innovation to
inflation and the real exchange rate.
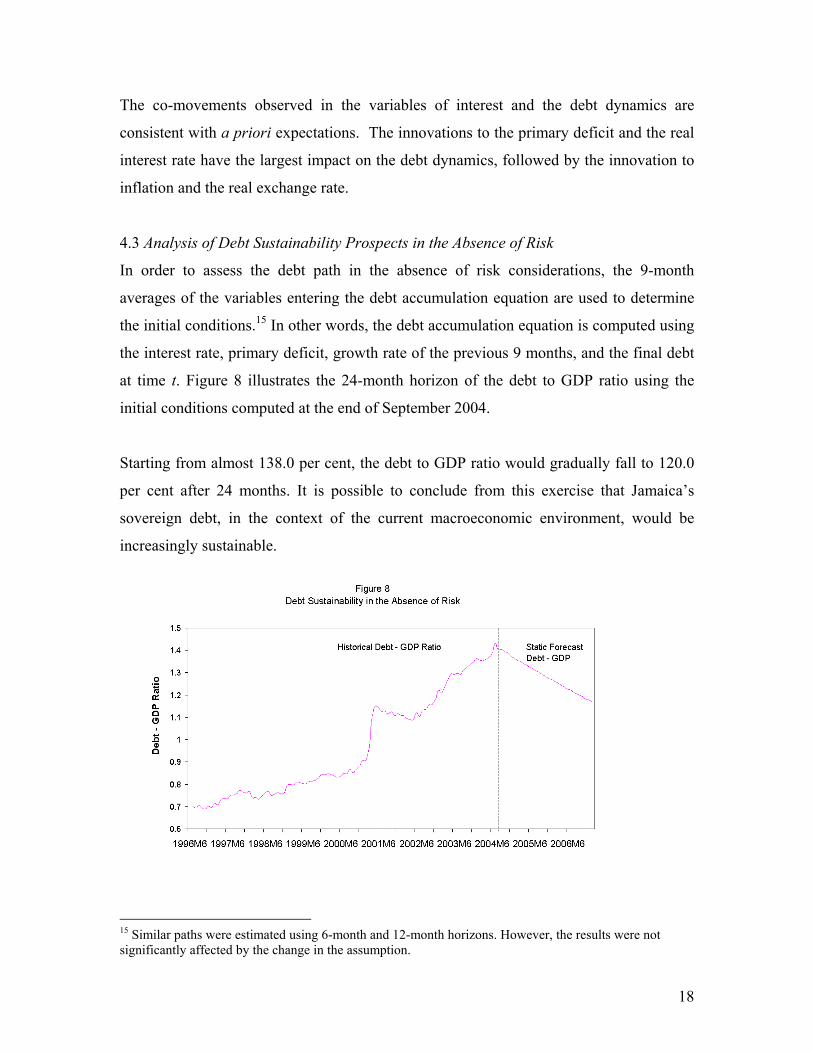
4.3 Analysis of Debt Sustainability Prospects in the Absence of Risk In order to assess the debt path in the absence of risk considerations, the 9-month
averages of the variables entering the debt accumulation equation are used to determine
the initial conditions.15 In other words, the debt accumulation equation is computed using
the interest rate, primary deficit, growth rate of the previous 9 months, and the final debt
at time t. Figure 8 illustrates the 24-month horizon of the debt to GDP ratio using the
initial conditions computed at the end of September 2004.
Starting from almost 138.0 per cent, the debt to GDP ratio would gradually fall to 120.0
per cent after 24 months. It is possible to conclude from this exercise that Jamaica’s
sovereign debt, in the context of the current macroeconomic environment, would be
increasingly sustainable.
18
15 Similar paths were estimated using 6-month and 12-month horizons. However, the results were not significantly affected by the change in the assumption.
Goldfajn and Guardia (2003) argue, however, that the numerous future possibilities for
.4 Risk based Analysis of Debt Sustainability – Monte Carlo Simulations
e preceding
the relevant variables -- GDP growth, real interest rates, and real exchange rates -- may
lead to different assessments. In addition, the estimates may overstate the case for
increasing sustainability of the debt by not taking into account the uncertainties that face
governments in emerging market economies. Conversely, the estimates may understate
the case for increasing sustainability by invoking assumptions for key parameters which
are based on transitory adverse market swings resulting in an equally biased assessment.
4
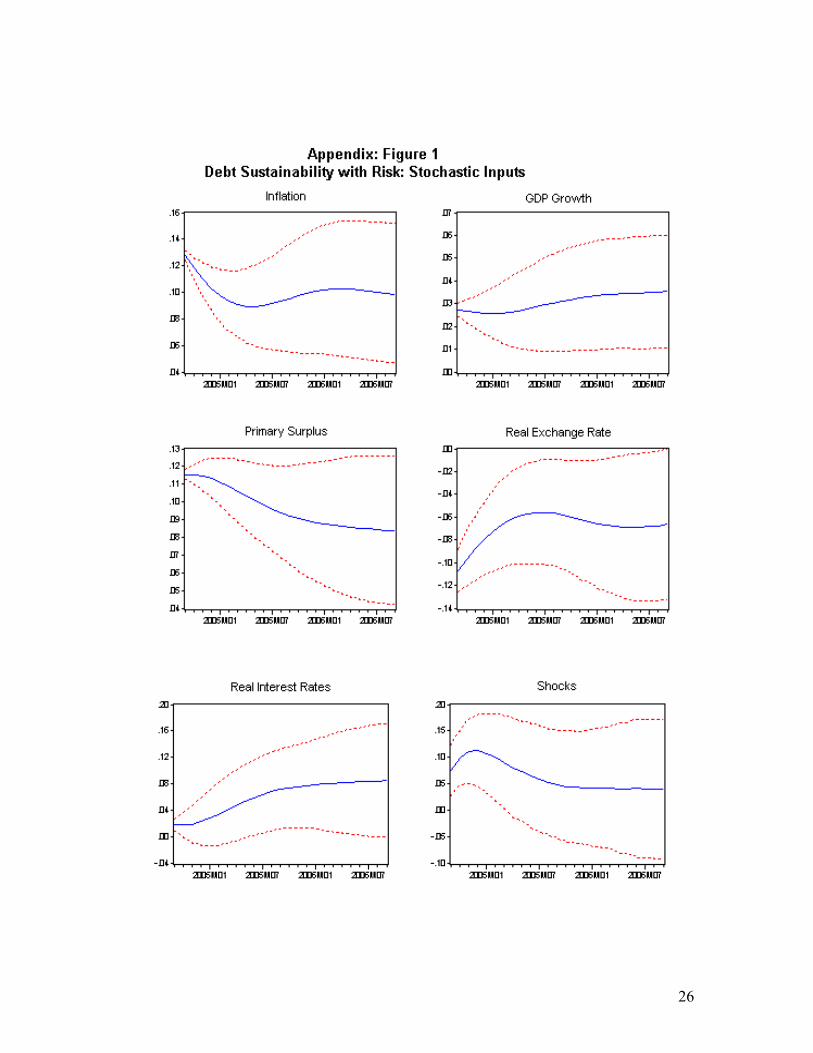
The application of Monte Carlo analysis to the debt model described in th
section provides an alternate approach to the assessment of debt dynamics in the
medium-term. The analysis utilizes the VAR estimates, with data up to September 2004,
to derive the covariance matrix of the shocks, as well as generates several possible paths
for the debt to GDP ratio using Monte Carlo simulations (1000 replications over 24
months). Figure 9 provides plausible paths of the debt to GDP ratio over the next 24
months, along with the maximum and the minimum debt within two standard deviations
of the average value. The juxtaposition of Figure 8 and Figure 9 shows the marked
difference in the projections of the sustainability of the debt between the two approaches.
The former approach assumes that the inputs into the debt accummulation equation
remain constant, are not dynamically interrelated, and that the economy will not be
exposed to random exogenous shocks over the period of concern. In short, the analysis
invokes the ceteris paribus assumption for the variables entering the debt accumulation
model. On the other hand, the latter approach utilizes the impact of all data up to that
point to estimate the VAR and the covariance matrix in order to compute the debt
dynamics going forward. The analysis, by concentrating on the contemporaneous
covariance of the residuals, determines the impact on debt arising from a typical mixture
of shocks that hit the Jamaican economy in the past.
19
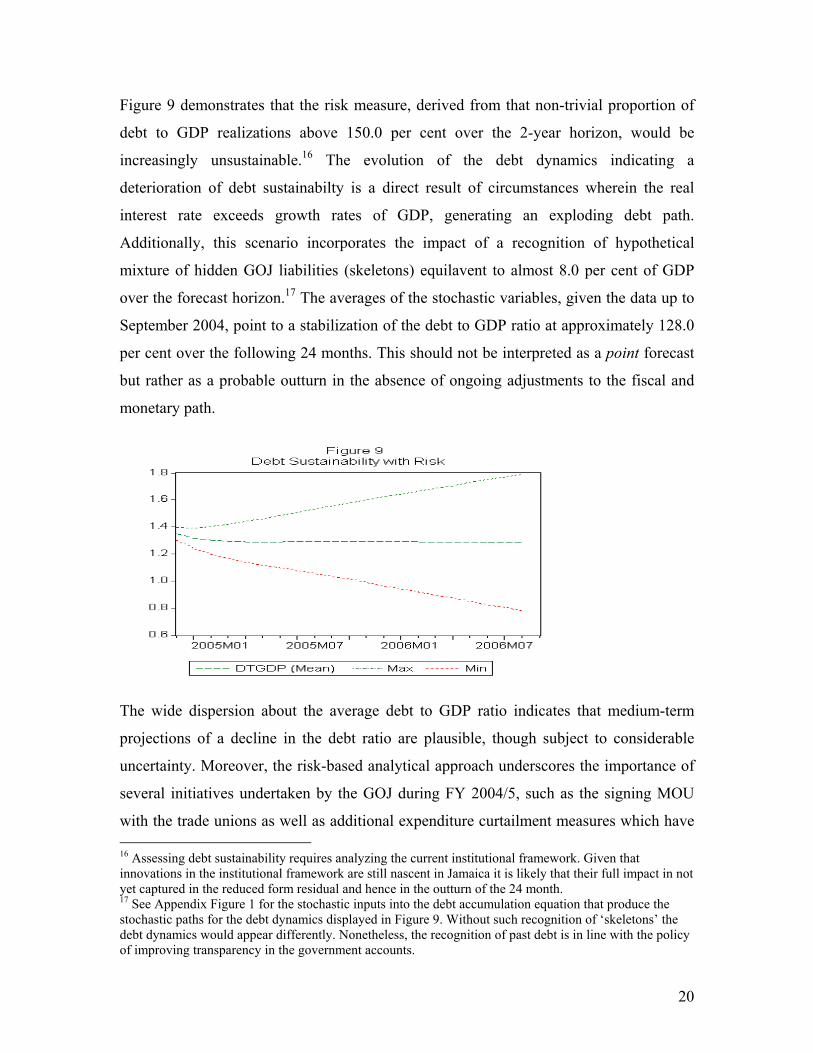
Figure 9 demonstrates that the risk measure, derived from that non-trivial proportion of
debt to GDP realizations above 150.0 per cent over the 2-year horizon, would be
increasingly unsustainable.16 The evolution of the debt dynamics indicating a
deterioration of debt sustainabilty is a direct result of circumstances wherein the real
interest rate exceeds growth rates of GDP, generating an exploding debt path.
Additionally, this scenario incorporates the impact of a recognition of hypothetical
mixture of hidden GOJ liabilities (skeletons) equilavent to almost 8.0 per cent of GDP
over the forecast horizon.17 The averages of the stochastic variables, given the data up to
September 2004, point to a stabilization of the debt to GDP ratio at approximately 128.0
per cent over the following 24 months. This should not be interpreted as a point forecast
but rather as a probable outturn in the absence of ongoing adjustments to the fiscal and
monetary path.
The wide dispersion about the average debt to GDP ratio indicates that medium-term
projections of a decline in the debt ratio are plausible, though subject to considerable
uncertainty. Moreover, the risk-based analytical approach underscores the importance of
several initiatives undertaken by the GOJ during FY 2004/5, such as the signing MOU
with the trade unions as well as additional expenditure curtailment measures which have 16 Assessing debt sustainability requires analyzing the current institutional framework. Given that innovations in the institutional framework are still nascent in Jamaica it is likely that their full impact in not yet captured in the reduced form residual and hence in the outturn of the 24 month. 17 See Appendix Figure 1 for the stochastic inputs into the debt accumulation equation that produce the stochastic paths for the debt dynamics displayed in Figure 9. Without such recognition of ‘skeletons’ the debt dynamics would appear differently. Nonetheless, the recognition of past debt is in line with the policy of improving transparency in the government accounts.
20

brought about improvement in the fiscal stance. These developments, as well as the
Bank’s commitment to macro-economic stability, have promoted a path towards
improving the debt-sustainability prospects going forward.
4.5 Sensitivity Analysis 18
Several hypothetical scenarios of debt shocks are evaluated in this section to examine
their impact on debt dynamics and hence its sensitivity to unanticipated shocks. The
tables below show the different paths followed by the debt to GDP ratio under alternative
initial debt shocks of 7.4 per cent, 7.6 per cent, and 12.2 per cent, respectively.19 Table 2
shows the impact of the assumed shock of 7.4 per cent of GDP on the other variables
entering into debt accumulation process as determined by the VAR model, as well as its
impact on the debt to GDP ratio over the next 24 months.
Table 2. Initial Debt Shock of 7.4 per cent of GDP and Constant Primary Surpluses
2004M9 2004M12 2005M3 2005M6 2005M9 2005M12 2006M3 2006M6Inflation 12.73 10.30 8.86 8.42 8.67 9.07 9.27 9.15 GDP Growth 2.71 2.59 2.67 2.95 3.31 3.60 3.78 3.85 Primary (% of GDP) 11.46 11.46 11.46 11.46 11.46 11.46 11.46 11.46 Real Exchange Rate (10.74) (8.08) (6.05) (4.88) (4.85) (5.19) (5.44) (5.30) Real Interest Rate 1.70 2.21 3.64 4.65 4.79 4.50 4.42 4.64 Shock to Debt (% of GDP) 7.42 11.17 10.32 9.25 9.33 9.89 10.30 10.12
Debt GDP Ratio 1.35 1.29 1.29 1.29 1.29 1.29 1.28 1.28
The analysis shows that the initial debt shock of 7.4 per cent of GDP, coupled with
constant primary surpluses of 11.4 per cent, would still be consistent with increasingly
sustainable levels of debt although the debt would decline at a relatively slow pace. This
scenario would be consistent with continued stability in the foreign exchange market, a
sound fiscal framework, a healthy banking system, as well as a low interest rate
environment.
18 Sensitivity analysis involves changing an input (independent) variable to see how sensitive the dependent variable is to the input variable. In this section the independent variables are shocks to the debt stocks and primary surpluses and the dependent variable is the debt to GDP ratio. The simulation framework allows for internally consistent paths for the other independent variables entering into the debt accumulation process. 19 These shocks were generated based on the historical evolution of shocks over the sample period.
21
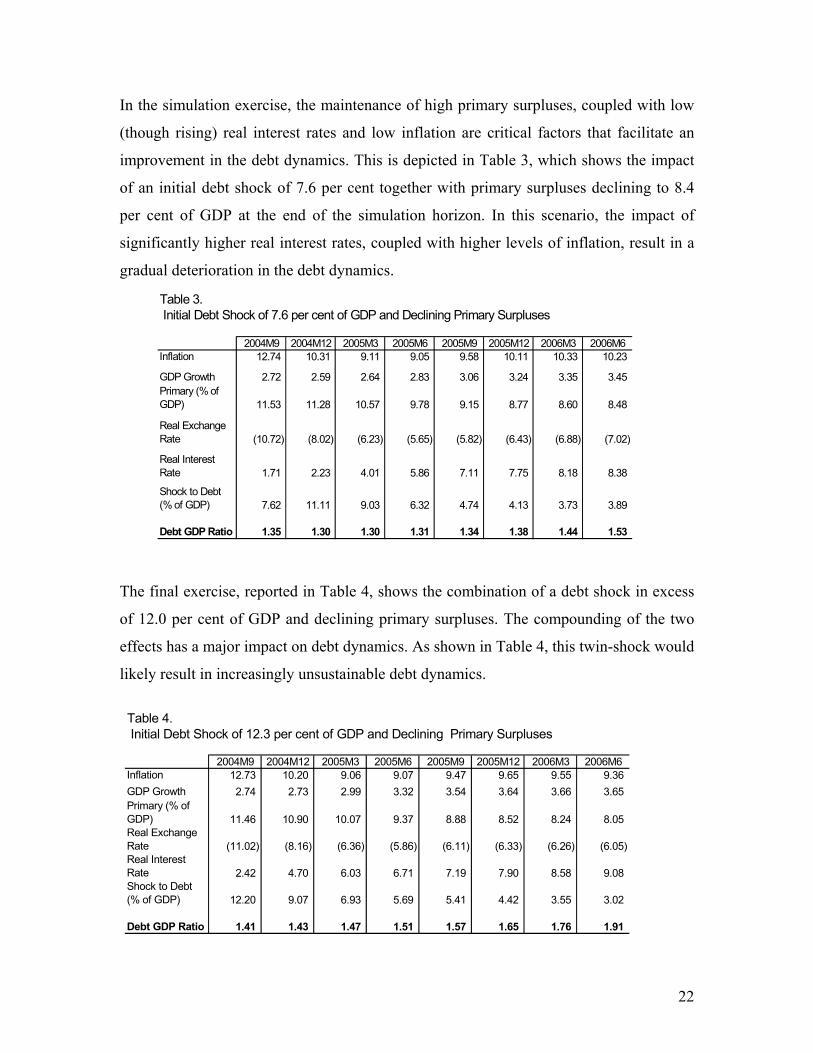
In the simulation exercise, the maintenance of high primary surpluses, coupled with low
(though rising) real interest rates and low inflation are critical factors that facilitate an
improvement in the debt dynamics. This is depicted in Table 3, which shows the impact
of an initial debt shock of 7.6 per cent together with primary surpluses declining to 8.4
per cent of GDP at the end of the simulation horizon. In this scenario, the impact of
significantly higher real interest rates, coupled with higher levels of inflation, result in a
gradual deterioration in the debt dynamics.
Table 3. Initial Debt Shock of 7.6 per cent of GDP and Declining Primary Surpluses
2004M9 2004M12 2005M3 2005M6 2005M9 2005M12 2006M3 2006M6Inflation 12.74 10.31 9.11 9.05 9.58 10.11 10.33 10.23
GDP Growth 2.72 2.59 2.64 2.83 3.06 3.24 3.35 3.45 Primary (% of GDP) 11.53 11.28 10.57 9.78 9.15 8.77 8.60 8.48
Real Exchange Rate (10.72) (8.02) (6.23) (5.65) (5.82) (6.43) (6.88) (7.02)
Real Interest Rate 1.71 2.23 4.01 5.86 7.11 7.75 8.18 8.38
Shock to Debt (% of GDP) 7.62 11.11 9.03 6.32 4.74 4.13 3.73 3.89
Debt GDP Ratio 1.35 1.30 1.30 1.31 1.34 1.38 1.44 1.53
The final exercise, reported in Table 4, shows the combination of a debt shock in excess
of 12.0 per cent of GDP and declining primary surpluses. The compounding of the two
effects has a major impact on debt dynamics. As shown in Table 4, this twin-shock would
likely result in increasingly unsustainable debt dynamics.
Table 4. Initial Debt Shock of 12.3 per cent of GDP and Declining Primary Surpluses
2004M9 2004M12 2005M3 2005M6 2005M9 2005M12 2006M3 2006M6Inflation 12.73 10.20 9.06 9.07 9.47 9.65 9.55 9.36 GDP Growth 2.74 2.73 2.99 3.32 3.54 3.64 3.66 3.65 Primary (% of GDP) 11.46 10.90 10.07 9.37 8.88 8.52 8.24 8.05 Real Exchange Rate (11.02) (8.16) (6.36) (5.86) (6.11) (6.33) (6.26) (6.05) Real Interest Rate 2.42 4.70 6.03 6.71 7.19 7.90 8.58 9.08 Shock to Debt (% of GDP) 12.20 9.07 6.93 5.69 5.41 4.42 3.55 3.02
Debt GDP Ratio 1.41 1.43 1.47 1.51 1.57 1.65 1.76 1.91
22
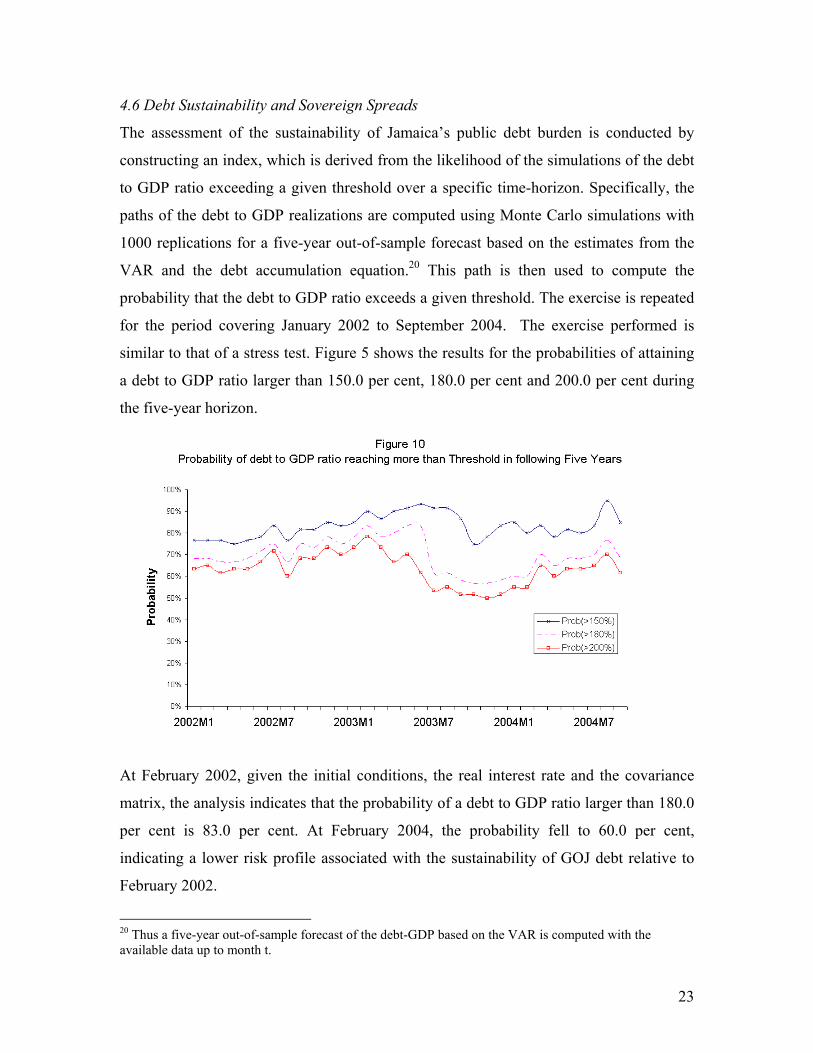
4.6 Debt Sustainability and Sovereign Spreads
The assessment of the sustainability of Jamaica’s public debt burden is conducted by
constructing an index, which is derived from the likelihood of the simulations of the debt
to GDP ratio exceeding a given threshold over a specific time-horizon. Specifically, the
paths of the debt to GDP realizations are computed using Monte Carlo simulations with
1000 replications for a five-year out-of-sample forecast based on the estimates from the
VAR and the debt accumulation equation.20 This path is then used to compute the
probability that the debt to GDP ratio exceeds a given threshold. The exercise is repeated
for the period covering January 2002 to September 2004. The exercise performed is
similar to that of a stress test. Figure 5 shows the results for the probabilities of attaining
a debt to GDP ratio larger than 150.0 per cent, 180.0 per cent and 200.0 per cent during
the five-year horizon.
t February 2002, given the initial conditions, the real interest rate and the covariance
February 2002.
A
matrix, the analysis indicates that the probability of a debt to GDP ratio larger than 180.0
per cent is 83.0 per cent. At February 2004, the probability fell to 60.0 per cent,
indicating a lower risk profile associated with the sustainability of GOJ debt relative to
23
20 Thus a five-year out-of-sample forecast of the debt-GDP based on the VAR is computed with the available data up to month t.
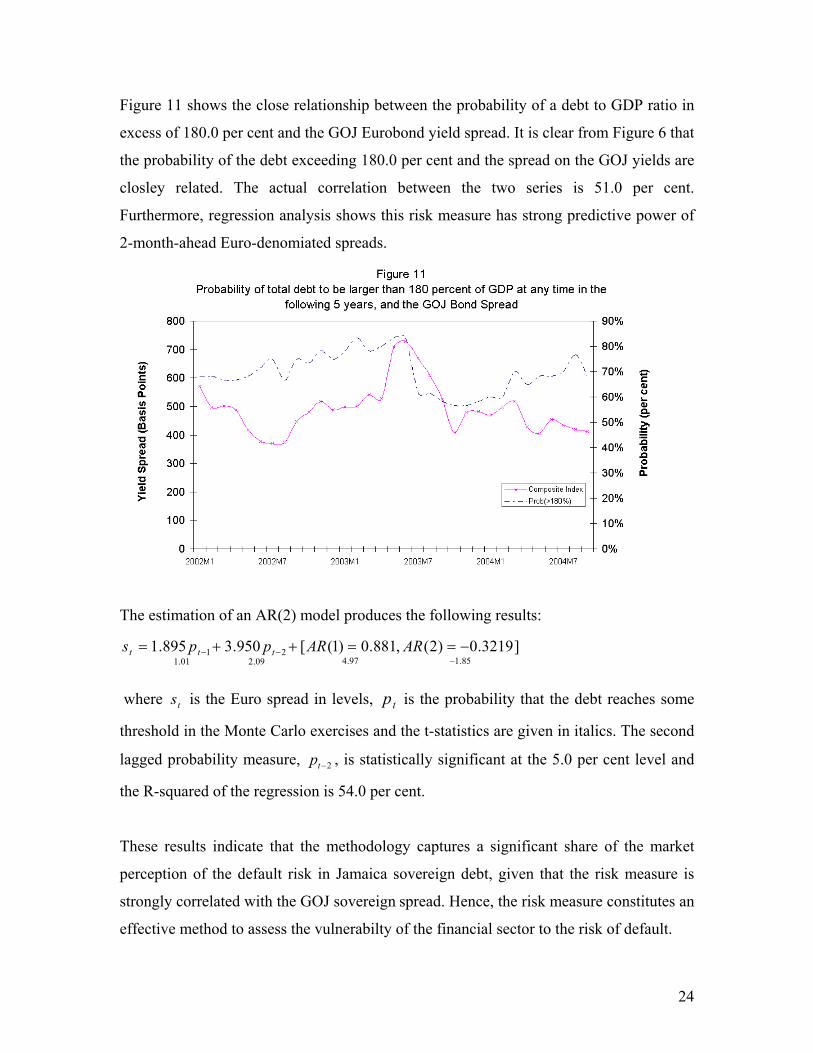
Figure 11 shows the close relationship between the probability of a debt to GDP ratio in
excess of 180.0 per cent and the GOJ Eurobond yield spread. It is clear from Figure 6 that
he debt reaches some
e t-statistics are given in italics. The second
gged bability measure, , is statistically significant at the 5.0 per cent level and
gn debt, given that the risk measure is
rongly correlated with the GOJ sovereign spread. Hence, the risk measure constitutes an
effective method to assess the vulnerabilty of the financial sector to the risk of default.
85.197.409.201.1]3219.0)2(
−
the probability of the debt exceeding 180.0 per cent and the spread on the GOJ yields are
closley related. The actual correlation between the two series is 51.0 per cent.
Furthermore, regression analysis shows this risk measure has strong predictive power of
2-month-ahead Euro-denomiated spreads.
21 ,881.0)1([950.3895.1 −− =++= ARpps ttt
The estimation of an AR(2) model produces the following results:
AR −=
where ts is the Euro spread in levels, tp is the probability that t
threshold in the Monte Carlo exercises and th
la pro 2−tp
the R-squared of the regression is 54.0 per cent.
These results indicate that the methodology captures a significant share of the market
perception of the default risk in Jamaica soverei
st
24
5. Conclusion Changes in the primary deficit and the real interest rate have the largest impact on the
debt dynamics in Jamaica. These are followed by changes in the inflation rate and the real
exchange rate. This analysis therefore underscores the importance of the co-ordination
onetary policies, as a critical driver in attaining increasing levels of
ebt sustainability. Futhermore, the analysis shows that small improvements in
macroeconomic economic conditions and a continuation of the country’s recent fiscal
improvements could push Jamaica’s debt stock in the right direction.
Moreover, sensitivity analysis conducted within the risk-based framework presented in
surpluses maintained at 11.4 per cent, would still be consistent with increasingly
sustainable levels of debt. However, a debt shock in excess of 12.0 per cent of GDP,
ary surpluses declining to approximately 8.0 per cent of GDP, would
lead to increasingly unsustainable debt dynamics. However, should the trends in real
interest rates, growth rate of GDP and primary surpluses over the previous 9 months be
maintained, the debt to GDP ratio should start declining over the next few years. This
outlook is corrobarated by the risk-based assessment showing a non-trivial portion of
realizations which indicate that this ratio could steadily decline over the medium-term.
shows that are many paths in which the debt to GDP ratio is unsustainable. This poses a
threat to, among others things, the health of the financial sector given its large exposure
forward a stochastic measure reflecting the underlying relations among the variables that
affect the debt accumulation process in order to compute future paths for the debt to
GDP ratio. The significant correlation and predictive power of the ‘risk probabilities’ on
GOJ Euro-bond spreads indicates that the risk measure constitutes an effective method to
assess debt sustainability going forward.
between fiscal and m
d
this paper suggests that a debt shock of approximately 7.0 of GDP, together with primary
coupled with prim
Nonetheless, the application of the risk-based approach to debt-sustainabiltiy for Jamaica
to GOJ default risk, as well as to the effectiveness of monetary policy. This paper puts
25
26
27
Bibliography Aiyagari, S.R., and E.R. McGrattan, 1998, “The Optimum Quantity of Debt,” Journal of
Monetary Economics 42, 447-469. Enders, Walter., 1995, “Applied Econometric Time Series”, Iowa State University, John
Wiley and Sons, Inc. Garcia, M. and R. Rigobon, 2004, “A Risk Management Approach to Emerging Market’s
Sovereign Debt Sustainability with an Application to Brazilian Data”, Working Paper 10336, NBER Working Paper Series. Available via the Internet: http://www.nber.org/papers/w10336
Goldfajn, Ilan. 2002, “Are there reasons to doubt fiscal sustainability in Brazil?”
Technical Note 25, Brasilia: Central Bank of Brazil. Available via the Internet: http://www.bcb.gov.br/
Goldfajn, I. and E. Guardia, 2003, “Fiscal Rules and Debt Sustainability in Brazil”, Technical Notes, no. 39 (July), Brasilia: Central Bank of Brazil Hamilton, James D., 1994, “Time Series Analysis”, United States of America, Princeton
University Press. International Monetary Fund, 2003, World Economic Outlook, September. Available via
the Internet:http://www.imf.org/external/pubs/ft/weo/2003/02/index.thm International Monetary Fund, 2002, Assessing sustainability. Available via the Internet:
http://www.imf.org/external/np/pdr/sus/2002/eng/052802.pdf Lewis, Jide, 2004, “The Implications of Jamaica’s Debt Burden for Financial Stability:
A System Dynamics Approach", (March), Working Paper, Bank of Jamaica