south sudan - greater equatoria south sudan displacement ... · morobo magwi ikotos yei lainya...
TRANSCRIPT
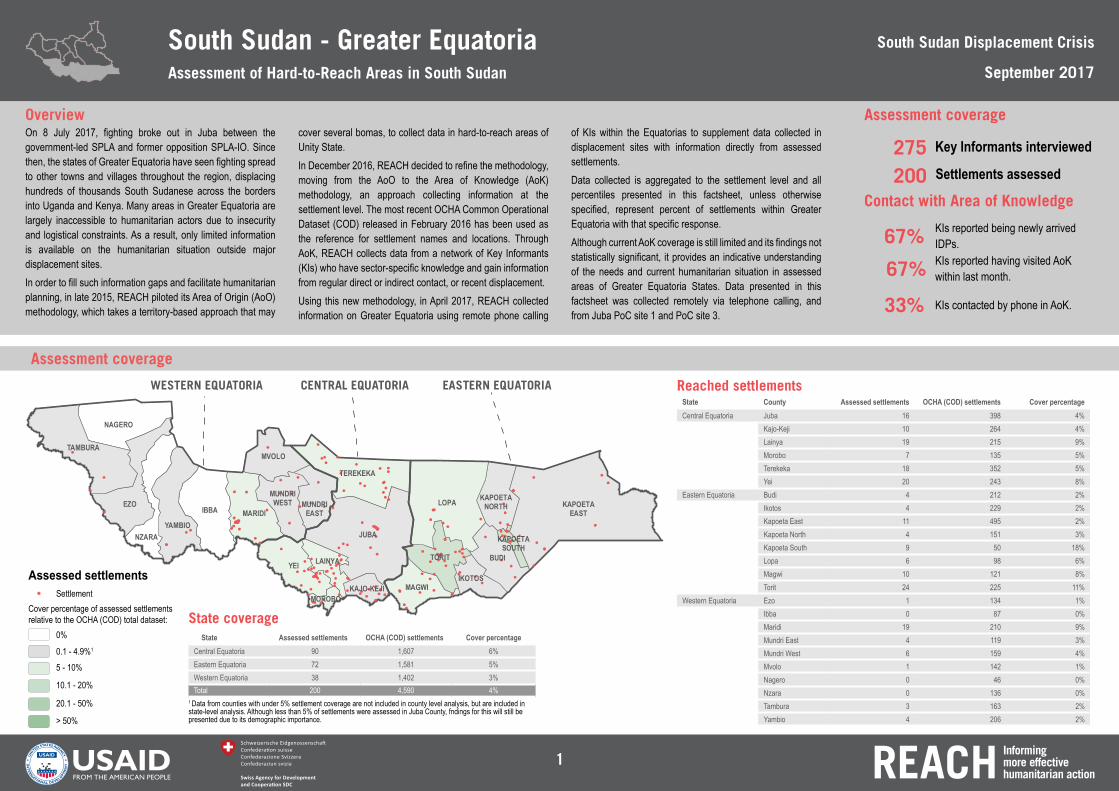
State County Assessed settlements OCHA (COD) settlements Cover percentageCentral Equatoria Juba 16 398 4%
Kajo-Keji 10 264 4%Lainya 19 215 9%Morobo 7 135 5%Terekeka 18 352 5%Yei 20 243 8%
Eastern Equatoria Budi 4 212 2%Ikotos 4 229 2%Kapoeta East 11 495 2%Kapoeta North 4 151 3%Kapoeta South 9 50 18%Lopa 6 98 6%Magwi 10 121 8%Torit 24 225 11%
Western Equatoria Ezo 1 134 1%Ibba 0 87 0%Maridi 19 210 9%Mundri East 4 119 3%Mundri West 6 159 4%Mvolo 1 142 1%Nagero 0 46 0%Nzara 0 136 0%Tambura 3 163 2%Yambio 4 206 2%
State Assessed settlements OCHA (COD) settlements Cover percentageCentral Equatoria 90 1,607 6%Eastern Equatoria 72 1,581 5%Western Equatoria 38 1,402 3%Total 200 4,590 4%
CENTRAL EQUATORIA EASTERN EQUATORIAWESTERN EQUATORIA
MOROBOMAGWI
IKOTOS
LAINYAYEI
KAPOETASOUTH
BUDITORIT
JUBA
MUNDRIWEST
MARIDIIBBAMUNDRI
EAST
KAPOETANORTHLOPA
YAMBIO
TEREKEKA
NZARA
MVOLO
EZO
TAMBURA
NAGERO
KAPOETAEAST
KAJO-KEJI
SUDAN
Assessed settlements
0%
Settlement
0.1 - 4.9%1
10.1 - 20%
20.1 - 50%
> 50%
Cover percentage of assessed settlements relative to the OCHA (COD) total dataset:
5 - 10%
1 Data from counties with under 5% settlement coverage are not included in county level analysis, but are included in state-level analysis. Although less than 5% of settlements were assessed in Juba County, fndings for this will still be presented due to its demographic importance.
Assessment coverage
Contact with Area of Knowledge
Key Informants interviewed275
KIs reported having visited AoK within last month.67%
Settlements assessed 200
KIs contacted by phone in AoK.33%
KIs reported being newly arrived IDPs.67%
On 8 July 2017, fighting broke out in Juba between the government-led SPLA and former opposition SPLA-IO. Since then, the states of Greater Equatoria have seen fighting spread to other towns and villages throughout the region, displacing hundreds of thousands South Sudanese across the borders into Uganda and Kenya. Many areas in Greater Equatoria are largely inaccessible to humanitarian actors due to insecurity and logistical constraints. As a result, only limited information is available on the humanitarian situation outside major displacement sites.In order to fill such information gaps and facilitate humanitarian planning, in late 2015, REACH piloted its Area of Origin (AoO) methodology, which takes a territory-based approach that may
cover several bomas, to collect data in hard-to-reach areas of Unity State.In December 2016, REACH decided to refine the methodology, moving from the AoO to the Area of Knowledge (AoK) methodology, an approach collecting information at the settlement level. The most recent OCHA Common Operational Dataset (COD) released in February 2016 has been used as the reference for settlement names and locations. Through AoK, REACH collects data from a network of Key Informants (KIs) who have sector-specific knowledge and gain information from regular direct or indirect contact, or recent displacement. Using this new methodology, in April 2017, REACH collected information on Greater Equatoria using remote phone calling
of KIs within the Equatorias to supplement data collected in displacement sites with information directly from assessed settlements.Data collected is aggregated to the settlement level and all percentiles presented in this factsheet, unless otherwise specified, represent percent of settlements within Greater Equatoria with that specific response.Although current AoK coverage is still limited and its findings not statistically significant, it provides an indicative understanding of the needs and current humanitarian situation in assessed areas of Greater Equatoria States. Data presented in this factsheet was collected remotely via telephone calling, and from Juba PoC site 1 and PoC site 3.
Overview
Reached settlements
State coverage
Assessment coverage
South Sudan - Greater EquatoriaAssessment of Hard-to-Reach Areas in South Sudan
South Sudan Displacement Crisis
September 2017
1
●
●
●
●
●
●
●
●
●
●
●
●
●
●
●
●
●
●
●
●
●
●
●
●
●
●
●●
●
●
●
●
●●
●
●
●
●
●
●
●
●
●
●●●
●
●
●
●
●
●
●●
●
●
●●
●
●
●
●
●
●
●
●
●●
●
●
●
●
●
●
●
●
●
●
●
●
●
●
● ●
●
●
●
●
●
●
●
●
●●
●
●
●
●
●
●
●
●
●
●
●
●
●
●
●
●●
●
●
●
●
●
●
●
● ●
●
●
●
●
●
●
●
●
●
●
●
●●
●
●
●●
●
●
●
●
●
●
●
●
●
●
●
●
●
● ●
●
●
●
●●
●
●
●
●
●
●
●
●
●
●
●
●●●
●
●
●
●
●
●
●●
●
●
●
●
●
●
●●
●
●
MOROBO
MAGWIIKOTOS
LAINYAYEI
KAPOETA SOUTH
BUDITORIT
JUBA
MUNDRI WESTMARIDIIBBA
MUNDRI EAST KAPOETA NORTHLOPA
TEREKEKA
MVOLO
KAJO−KEJI●
●
●
●
●
●
●
●
●
●
●
●
●
●
●
●
●
●
●
●
●
●
●
●
●
●
●●
●
●
●
●
●●
●
●
●
●
●
●
●
●
●
●●●
●
●
●
●
●
●
●●
●
●
●●
●
●
●
●
●
●
●
●
●●
●
●
●
●
●
●
●
●
●
●
●
●
●
●
● ●
●
●
●
●
●
●
●
●
●●
●
●
●
●
●
●
●
●
●
●
●
●
●
●
●
●●
●
●
●
●
●
●
●
● ●
●
●
●
●
●
●
●
●
●
●
●
●●
●
●
●●
●
●
●
●
●
●
●
●
●
●
●
●
●
● ●
●
●
●
●●
●
●
●
●
●
●
●
●
●
●
●
●●●
●
●
●
●
●
●
●●
●
●
●
●
●
●
●●
●
●
MOROBO
MAGWIIKOTOS
LAINYAYEI
KAPOETA SOUTH
BUDITORIT
JUBA
MUNDRI WESTMARIDIIBBA
MUNDRI EAST KAPOETA NORTHLOPA
TEREKEKA
MVOLO
KAJO−KEJI
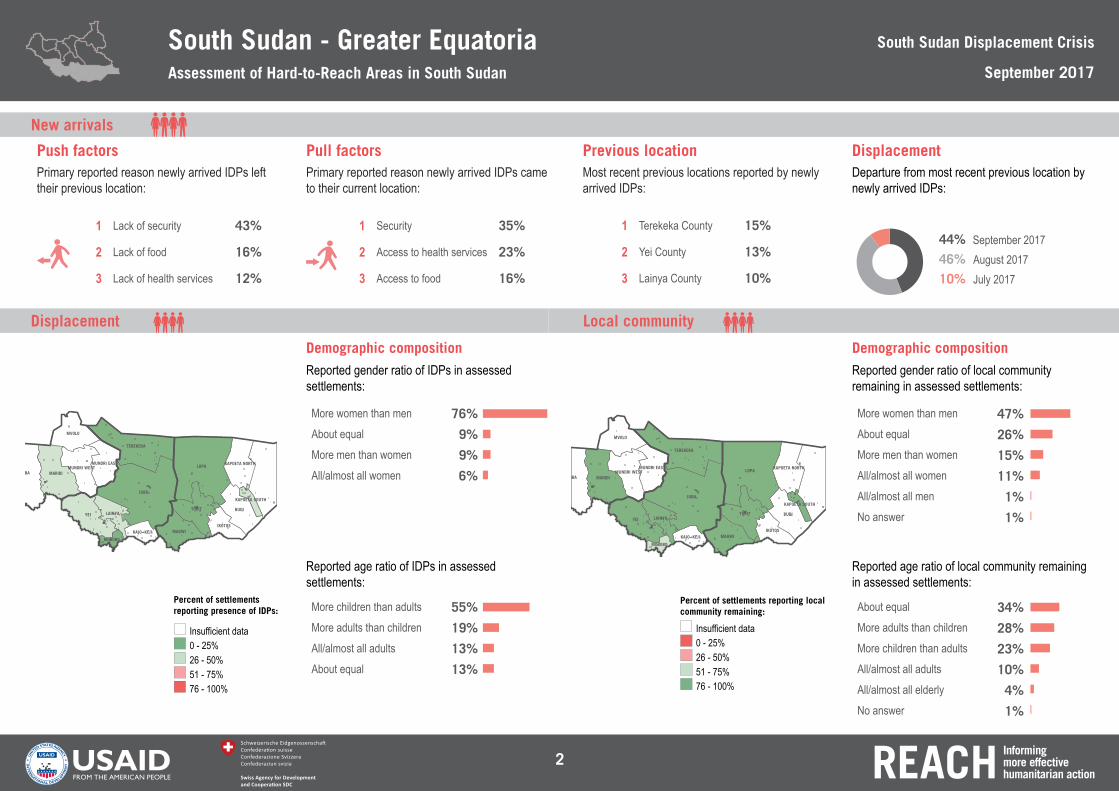
47+26+15+11+1+134+28+23+10+4+1
44% September 201746% August 201710% July 201744+46+10+0+A
More women than men 47%About equal 26%More men than women 15%All/almost all women 11%All/almost all men 1%No answer 1%
About equal 34%More adults than children 28%More children than adults 23%All/almost all adults 10%All/almost all elderly 4%No answer 1%
55+19+13+1376+9+9+6More women than men 76%
About equal 9%More men than women 9%All/almost all women 6%
More children than adults 55%More adults than children 19%All/almost all adults 13%About equal 13%
1 Security 35%
2 Access to health services 23%
3 Access to food 16%
1 Terekeka County 15%
2 Yei County 13%
3 Lainya County 10%
1 Lack of security 43%
2 Lack of food 16%
3 Lack of health services 12%
0 - 25%26 - 50%51 - 75%76 - 100%
Insufficient data
Percent of settlements reporting local community remaining:
0 - 25%26 - 50%51 - 75%76 - 100%
Insufficient data
Percent of settlements reporting presence of IDPs:
Reported gender ratio of local community remaining in assessed settlements:
Reported age ratio of local community remaining in assessed settlements:
Reported gender ratio of IDPs in assessed settlements:
Reported age ratio of IDPs in assessed settlements:
Primary reported reason newly arrived IDPs left their previous location:
Primary reported reason newly arrived IDPs came to their current location:
Most recent previous locations reported by newly arrived IDPs:
Departure from most recent previous location by newly arrived IDPs:
Demographic compositionDemographic composition
Push factors Pull factors Previous location Displacement
Local community Displacement
New arrivals
South Sudan - Greater EquatoriaAssessment of Hard-to-Reach Areas in South Sudan
South Sudan Displacement Crisis
September 2017
2
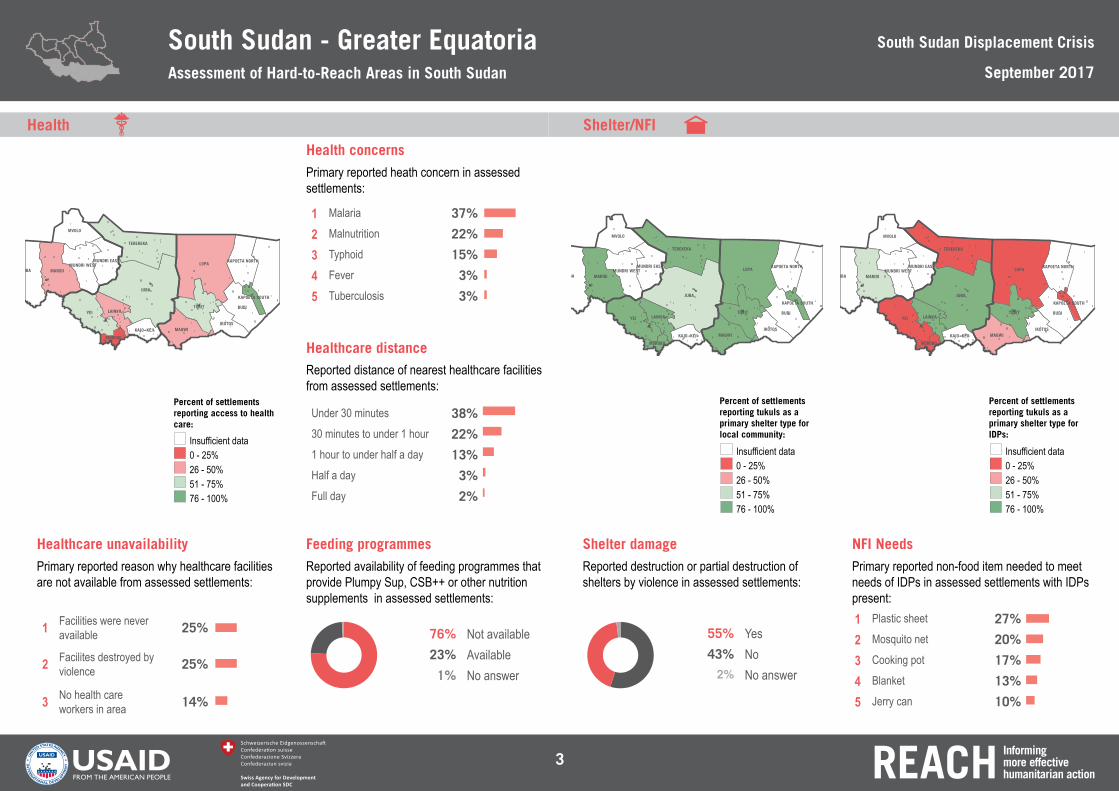
1 Facilities were never available 25%
2 Facilites destroyed by violence 25%
3 No health care workers in area 14%
76+23+1+A
Under 30 minutes 38%30 minutes to under 1 hour 22%1 hour to under half a day 13%Half a day 3%Full day 2%
38+22+13+3+237+22+15+3+3
2525
1 Malaria 37%
2 Malnutrition 22%
3 Typhoid 15%
4 Fever 3%
5 Tuberculosis 3%
76% Not available23% Available1% No answer14
●
●
●
●
●
●
●
●
●
●
●
●
●
●
●
●
●
●
●
●
●
●
●
●
●
●
●●
●
●
●
●
●●
●
●
●
●
●
●
●
●
●
●●●
●
●
●
●
●
●
●●
●
●
●●
●
●
●
●
●
●
●
●
●●
●
●
●
●
●
●
●
●
●
●
●
●
●
●
● ●
●
●
●
●
●
●
●
●
●●
●
●
●
●
●
●
●
●
●
●
●
●
●
●
●
●●
●
●
●
●
●
●
●
● ●
●
●
●
●
●
●
●
●
●
●
●
●●
●
●
●●
●
●
●
●
●
●
●
●
●
●
●
●
●
● ●
●
●
●
●●
●
●
●
●
●
●
●
●
●
●
●
●●●
●
●
●
●
●
●
●●
●
●
●
●
●
●
●●
●
●
MOROBO
MAGWIIKOTOS
LAINYAYEI
KAPOETA SOUTH
BUDITORIT
JUBA
MUNDRI WESTMARIDIIBBA
MUNDRI EAST KAPOETA NORTHLOPA
TEREKEKA
MVOLO
KAJO−KEJI●
●
●
●
●
●
●
●
●
●
●
●
●
●
●
●
●
●
●
●
●
●
●
●
●
●
●●
●
●
●
●
●●
●
●
●
●
●
●
●
●
●
●●●
●
●
●
●
●
●
●●
●
●
●●
●
●
●
●
●
●
●
●
●●
●
●
●
●
●
●
●
●
●
●
●
●
●
●
● ●
●
●
●
●
●
●
●
●
●●
●
●
●
●
●
●
●
●
●
●
●
●
●
●
●
●●
●
●
●
●
●
●
●
● ●
●
●
●
●
●
●
●
●
●
●
●
●●
●
●
●●
●
●
●
●
●
●
●
●
●
●
●
●
●
● ●
●
●
●
●●
●
●
●
●
●
●
●
●
●
●
●
●●●
●
●
●
●
●
●
●●
●
●
●
●
●
●
●●
●
●
MOROBO
MAGWIIKOTOS
LAINYAYEI
KAPOETA SOUTH
BUDITORIT
JUBA
MUNDRI WESTMARIDIIBBA
MUNDRI EAST KAPOETA NORTHLOPA
TEREKEKA
MVOLO
KAJO−KEJI ●
●
●
●
●
●
●
●
●
●
●
●
●
●
●
●
●
●
●
●
●
●
●
●
●
●
●●
●
●
●
●
●●
●
●
●
●
●
●
●
●
●
●●●
●
●
●
●
●
●
●●
●
●
●●
●
●
●
●
●
●
●
●
●●
●
●
●
●
●
●
●
●
●
●
●
●
●
●
● ●
●
●
●
●
●
●
●
●
●●
●
●
●
●
●
●
●
●
●
●
●
●
●
●
●
●●
●
●
●
●
●
●
●
● ●
●
●
●
●
●
●
●
●
●
●
●
●●
●
●
●●
●
●
●
●
●
●
●
●
●
●
●
●
●
● ●
●
●
●
●●
●
●
●
●
●
●
●
●
●
●
●
●●●
●
●
●
●
●
●
●●
●
●
●
●
●
●
●●
●
●
MOROBO
MAGWIIKOTOS
LAINYAYEI
KAPOETA SOUTH
BUDITORIT
JUBA
MUNDRI WESTMARIDIIBBA
MUNDRI EAST KAPOETA NORTHLOPA
TEREKEKA
MVOLO
KAJO−KEJI
0 - 25%26 - 50%51 - 75%76 - 100%
Insufficient data
0 - 25%26 - 50%51 - 75%76 - 100%
Insufficient data0 - 25%26 - 50%51 - 75%76 - 100%
Insufficient data
Percent of settlements reporting access to health care:
Percent of settlements reporting tukuls as a primary shelter type for local community:
Percent of settlements reporting tukuls as a primary shelter type for IDPs:
Primary reported heath concern in assessed settlements:
Reported availability of feeding programmes that provide Plumpy Sup, CSB++ or other nutrition supplements in assessed settlements:
Reported distance of nearest healthcare facilities from assessed settlements:
Primary reported reason why healthcare facilities are not available from assessed settlements:
55+43+2+A 55% Yes43% No
2% No answer
27+20+17+13+101 Plastic sheet 27%
2 Mosquito net 20%
3 Cooking pot 17%
4 Blanket 13%
5 Jerry can 10%
Primary reported non-food item needed to meet needs of IDPs in assessed settlements with IDPs present:
Reported destruction or partial destruction of shelters by violence in assessed settlements:
NFI Needs Shelter damage
Health concerns
Feeding programmes
Healthcare distance
Healthcare unavailability
Health Shelter/NFI
South Sudan - Greater EquatoriaAssessment of Hard-to-Reach Areas in South Sudan
South Sudan Displacement Crisis
September 2017
3
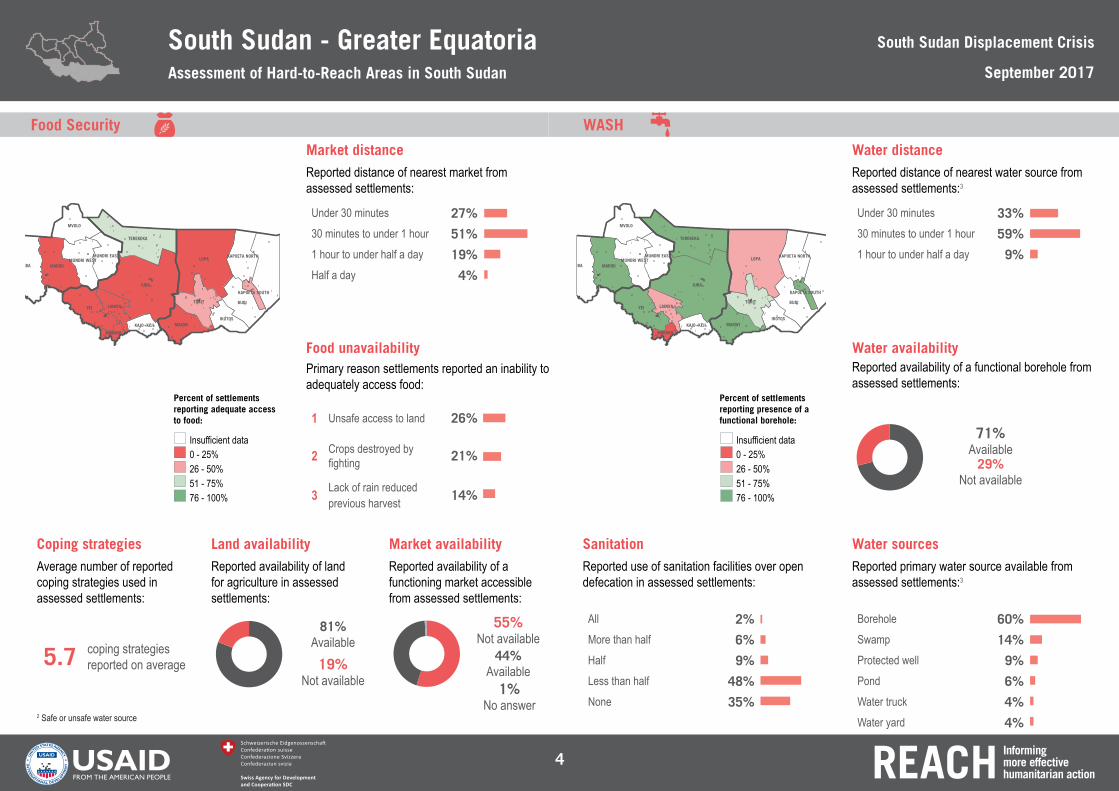
2+6+9+48+35
All 2%More than half 6%Half 9%Less than half 48%None 35%
Under 30 minutes 33%30 minutes to under 1 hour 59%1 hour to under half a day 9%
Under 30 minutes 27%30 minutes to under 1 hour 51%1 hour to under half a day 19%Half a day 4%
33+59+927+51+19+455%
Not available44%
Available55+44+1+A
1 Unsafe access to land 26%
2 Crops destroyed by fighting 21%
3 Lack of rain reduced previous harvest 14%
262114
60+14+9+6+4+4
Borehole 60%Swamp 14%Protected well 9%Pond 6%Water truck 4%Water yard 4%
Reported primary water source available from assessed settlements:3
Water sources
71+29+0+AReported availability of a functional borehole from assessed settlements:
Water availability
29% Not available
71% Available
81+19+A 19% Not available
81% Available
5.7 coping strategies reported on average
1% No answer
2 Safe or unsafe water source
●
●
●
●
●
●
●
●
●
●
●
●
●
●
●
●
●
●
●
●
●
●
●
●
●
●
●●
●
●
●
●
●●
●
●
●
●
●
●
●
●
●
●●●
●
●
●
●
●
●
●●
●
●
●●
●
●
●
●
●
●
●
●
●●
●
●
●
●
●
●
●
●
●
●
●
●
●
●
● ●
●
●
●
●
●
●
●
●
●●
●
●
●
●
●
●
●
●
●
●
●
●
●
●
●
●●
●
●
●
●
●
●
●
● ●
●
●
●
●
●
●
●
●
●
●
●
●●
●
●
●●
●
●
●
●
●
●
●
●
●
●
●
●
●
● ●
●
●
●
●●
●
●
●
●
●
●
●
●
●
●
●
●●●
●
●
●
●
●
●
●●
●
●
●
●
●
●
●●
●
●
MOROBO
MAGWIIKOTOS
LAINYAYEI
KAPOETA SOUTH
BUDITORIT
JUBA
MUNDRI WESTMARIDIIBBA
MUNDRI EAST KAPOETA NORTHLOPA
TEREKEKA
MVOLO
KAJO−KEJI ●
●
●
●
●
●
●
●
●
●
●
●
●
●
●
●
●
●
●
●
●
●
●
●
●
●
●●
●
●
●
●
●●
●
●
●
●
●
●
●
●
●
●●●
●
●
●
●
●
●
●●
●
●
●●
●
●
●
●
●
●
●
●
●●
●
●
●
●
●
●
●
●
●
●
●
●
●
●
● ●
●
●
●
●
●
●
●
●
●●
●
●
●
●
●
●
●
●
●
●
●
●
●
●
●
●●
●
●
●
●
●
●
●
● ●
●
●
●
●
●
●
●
●
●
●
●
●●
●
●
●●
●
●
●
●
●
●
●
●
●
●
●
●
●
● ●
●
●
●
●●
●
●
●
●
●
●
●
●
●
●
●
●●●
●
●
●
●
●
●
●●
●
●
●
●
●
●
●●
●
●
MOROBO
MAGWIIKOTOS
LAINYAYEI
KAPOETA SOUTH
BUDITORIT
JUBA
MUNDRI WESTMARIDIIBBA
MUNDRI EAST KAPOETA NORTHLOPA
TEREKEKA
MVOLO
KAJO−KEJI
0 - 25%26 - 50%51 - 75%76 - 100%
Insufficient data0 - 25%26 - 50%51 - 75%76 - 100%
Insufficient data
Percent of settlements reporting adequate access to food:
Percent of settlements reporting presence of a functional borehole:
Reported use of sanitation facilities over open defecation in assessed settlements:
Reported distance of nearest water source from assessed settlements:3
Reported availability of a functioning market accessible from assessed settlements:
Primary reason settlements reported an inability to adequately access food:
Reported distance of nearest market from assessed settlements:
Reported availability of land for agriculture in assessed settlements:
Average number of reported coping strategies used in assessed settlements:
SanitationMarket availabilityLand availabilityCoping strategies
Food unavailability
Water distanceMarket distance
Food Security WASH
South Sudan - Greater EquatoriaAssessment of Hard-to-Reach Areas in South Sudan
South Sudan Displacement Crisis
September 2017
4
About REACHREACH facilitates development of information tools and products that enhance capacity of aid actors to make evidence-based decisions in emergency, recovery and development contexts. All REACH activities are conducted through inter-agency aid coordination mechanisms. For more information, you can write to our in-country office: [email protected] or to our global office: [email protected] www.reach-initiative.org and follow us @REACH_info.
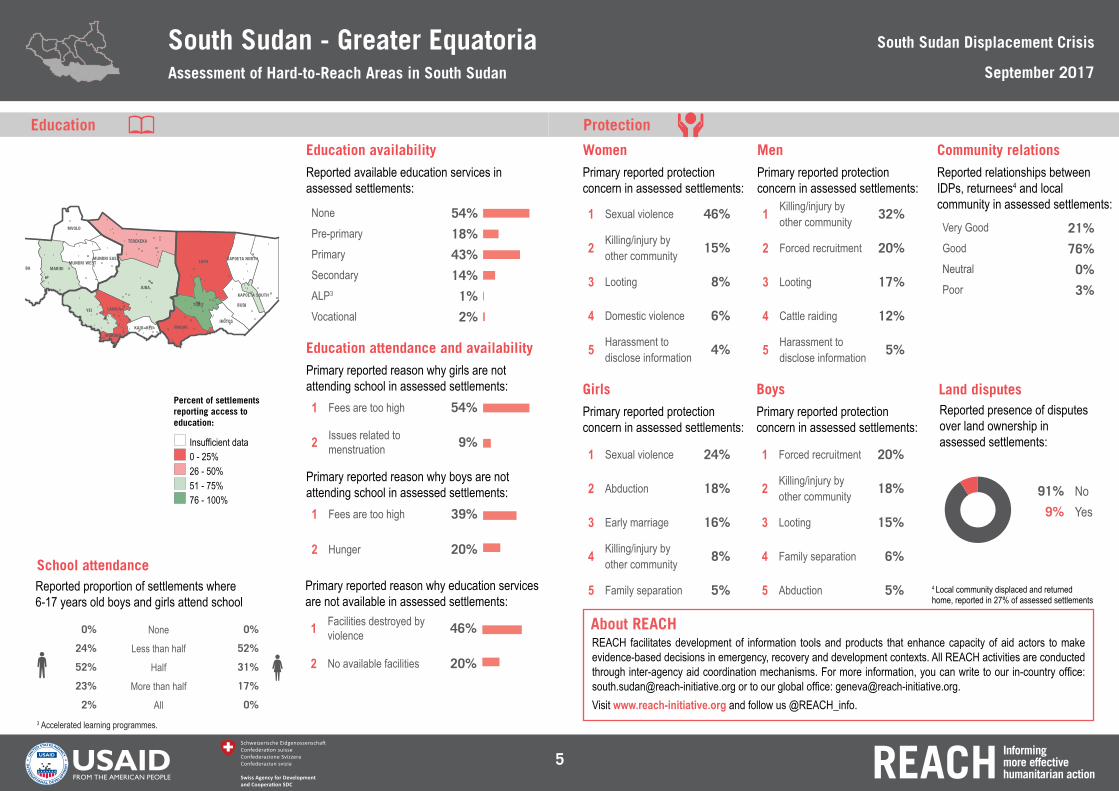
Very Good 21%Good 76%Neutral 0%Poor 3%
91+9+0+A
1 Sexual violence 46%
2 Killing/injury by other community 15%
3 Looting 8%
4 Domestic violence 6%
5 Harassment to disclose information 4%
1 Killing/injury by other community 32%
2 Forced recruitment 20%
3 Looting 17%
4 Cattle raiding 12%
5 Harassment to disclose information 5%
1 Sexual violence 24%
2 Abduction 18%
3 Early marriage 16%
4 Killing/injury by other community 8%
5 Family separation 5%
91% No9% Yes
Primary reported protection concern in assessed settlements:
Primary reported protection concern in assessed settlements:
Primary reported protection concern in assessed settlements:
Reported relationships between IDPs, returnees4 and local community in assessed settlements:
Reported presence of disputes over land ownership in assessed settlements:
Women Men
Girls
Community relations
Land disputes
1 Forced recruitment 20%
2 Killing/injury by other community 18%
3 Looting 15%
4 Family separation 6%
5 Abduction 5%
Primary reported protection concern in assessed settlements:
Boys
None 54%Pre-primary 18%Primary 43%Secondary 14%ALP3 1%Vocational 2%
54+18+43+14+1+21 Fees are too high 39%
2 Hunger 20%
39200% None 0%
24% Less than half 52%
52% Half 31%
23% More than half 17%
2% All 0%
1 Fees are too high 54%
2 Issues related to menstruation 9%
5491 Facilities destroyed by
violence 46%
2 No available facilities 20%
4620Reported proportion of settlements where 6-17 years old boys and girls attend school
3 Accelerated learning programmes.
Reported available education services in assessed settlements:
Primary reported reason why boys are not attending school in assessed settlements:
Primary reported reason why girls are not attending school in assessed settlements:
Education availability
School attendance
Education attendance and availability
Primary reported reason why education services are not available in assessed settlements:
4 Local community displaced and returned home, reported in 27% of assessed settlements
●
●
●
●
●
●
●
●
●
●
●
●
●
●
●
●
●
●
●
●
●
●
●
●
●
●
●●
●
●
●
●
●●
●
●
●
●
●
●
●
●
●
●●●
●
●
●
●
●
●
●●
●
●
●●
●
●
●
●
●
●
●
●
●●
●
●
●
●
●
●
●
●
●
●
●
●
●
●
● ●
●
●
●
●
●
●
●
●
●●
●
●
●
●
●
●
●
●
●
●
●
●
●
●
●
●●
●
●
●
●
●
●
●
● ●
●
●
●
●
●
●
●
●
●
●
●
●●
●
●
●●
●
●
●
●
●
●
●
●
●
●
●
●
●
● ●
●
●
●
●●
●
●
●
●
●
●
●
●
●
●
●
●●●
●
●
●
●
●
●
●●
●
●
●
●
●
●
●●
●
●
MOROBO
MAGWIIKOTOS
LAINYAYEI
KAPOETA SOUTH
BUDITORIT
JUBA
MUNDRI WESTMARIDIIBBA
MUNDRI EAST KAPOETA NORTHLOPA
TEREKEKA
MVOLO
KAJO−KEJI
0 - 25%26 - 50%51 - 75%76 - 100%
Insufficient data
Percent of settlements reporting access to education:
Education Protection
South Sudan - Greater EquatoriaAssessment of Hard-to-Reach Areas in South Sudan
South Sudan Displacement Crisis
September 2017
5