south sudan country profile 2014 - enterprise surveys · the country profile for south sudan is...
TRANSCRIPT
South Sudan
Country Profile 2014
Region: Sub-Saharan Africa
Income Group: Lower middle income
Population: 11,296,173
GNI per capita: US$1,120.00
Co
nte
nts
3
4
5
6
7
8
9
10
11
12
13-15
Introduction
Business Environment Obstacles
Average Firm
Infrastructure
Trade
Regulations, Taxes, and Business Licensing
Corruption
Crime and Informality
Finance
Innovation and Workforce
Summary of Enterprise Survey Indicators
Introduction
Enterprise Surveys
The Enterprise Surveys focus on the many factors that shape the business environment. These factors can be
accommodating or constraining for firms and play an important role in whether a country will prosper or not. An
accommodating business environment is one that encourages firms to operate efficiently. Such conditions
strengthen incentives for firms to innovate and to increase productivity—key factors for sustainable development.
A more productive private sector, in turn, expands employment and contributes taxes necessary for public
investment in health, education, and other services. In contrast, a poor business environment increases the
obstacles to conducting business activities and decreases a country ’s prospects for reaching its potential in
terms of employment, production, and welfare.
The Enterprise Surveys are conducted by the World Bank and its partners across all geographic regions and
cover small, medium, and large companies. The surveys are administered to a representative sample of firms in
the non-agricultural formal private economy. The sample is consistently defined in all countries and includes the
entire manufacturing sector, the services sector, and the transportation and construction sectors. Public utilities,
government services, health care, and financial services sectors are not included in the sample.* The Enterprise
Surveys collect a wide array of qualitative and quantitative information through face to face interviews with firm
managers and owners regarding the business environment in their countries and the productivity of their firms .
The topics covered in Enterprise Surveys include infrastructure, trade, finance, regulations, taxes and business
licensing, corruption, crime and informality, finance, innovation, labor, and perceptions about obstacles to doing
business.
The qualitative and quantitative data collected through the surveys connect a country ’s business environment
characteristics with firm productivity and performance. The Enterprise Survey is useful for both policymakers and
researchers. The surveys are repeated over time to track changes and benchmark the effects of reforms on firms
performance.
Country Profiles
Enterprise Surveys: SOUTH SUDAN -2014 3 http://www.enterprisesurveys.org
The Country Profiles produced by the Enterprise Analysis Unit of the World Bank Group provide an overview of
key business environment indicators in each country, comparing them to their respective geographic region and
group of countries with similar incomes.** Breakdowns by firm size are presented in the Appendix of the
document along with all indicators used to make the graphs. The same topics are covered for all countries with
slight variations in indicators, subject to data availability. This format allows cross country comparisons. All
indicators are based on the responses of firms.
To learn more about the firms sampled for this Country Profile, tabulations for these and other indicators
presented by firm size, industry, national region, etc., or to obtain profiles of other countries, please visit
www.enterprisesurveys.org.
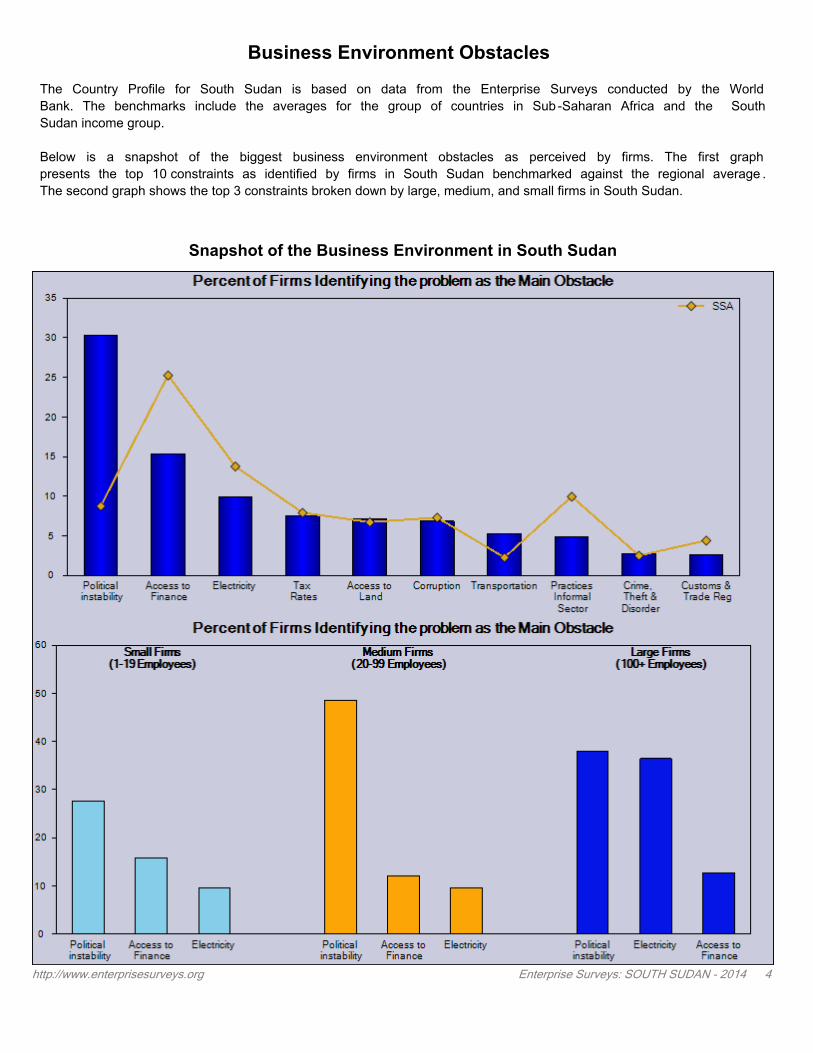
The Country Profile for South Sudan is based on data from the Enterprise Surveys conducted by the World
Bank. The benchmarks include the averages for the group of countries in Sub -Saharan Africa and the South
Sudan income group.
Below is a snapshot of the biggest business environment obstacles as perceived by firms. The first graph
presents the top 10 constraints as identified by firms in South Sudan benchmarked against the regional average .
The second graph shows the top 3 constraints broken down by large, medium, and small firms in South Sudan.
Enterprise Surveys: SOUTH SUDAN - 2014 4 http://www.enterprisesurveys.org
Snapshot of the Business Environment in South Sudan
Business Environment Obstacles
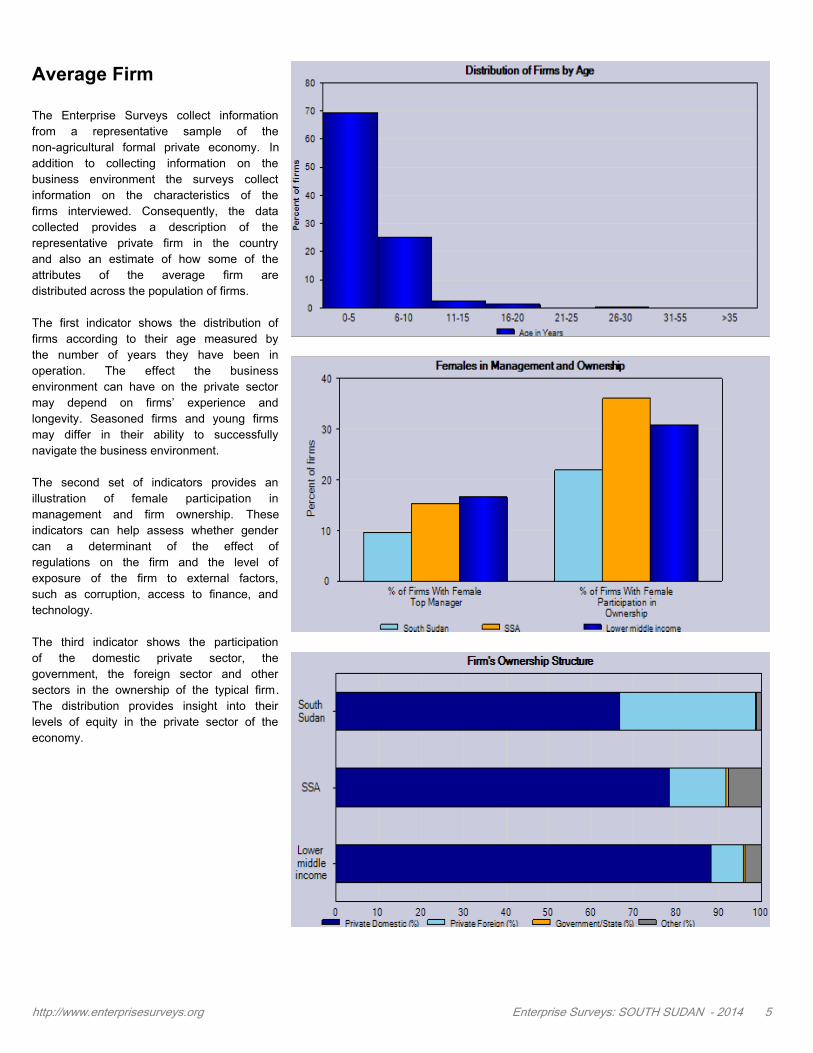
Average Firm
The Enterprise Surveys collect information
from a representative sample of the
non-agricultural formal private economy. In
addition to collecting information on the
business environment the surveys collect
information on the characteristics of the
firms interviewed. Consequently, the data
collected provides a description of the
representative private firm in the country
and also an estimate of how some of the
attributes of the average firm are
distributed across the population of firms.
The first indicator shows the distribution of
firms according to their age measured by
the number of years they have been in
operation. The effect the business
environment can have on the private sector
may depend on firms’ experience and
longevity. Seasoned firms and young firms
may differ in their ability to successfully
navigate the business environment.
The second set of indicators provides an
illustration of female participation in
management and firm ownership. These
indicators can help assess whether gender
can a determinant of the effect of
regulations on the firm and the level of
exposure of the firm to external factors,
such as corruption, access to finance, and
technology.
The third indicator shows the participation
of the domestic private sector, the
government, the foreign sector and other
sectors in the ownership of the typical firm.
The distribution provides insight into their
levels of equity in the private sector of the
economy.
http://www.enterprisesurveys.org Enterprise Surveys: SOUTH SUDAN - 2014 5
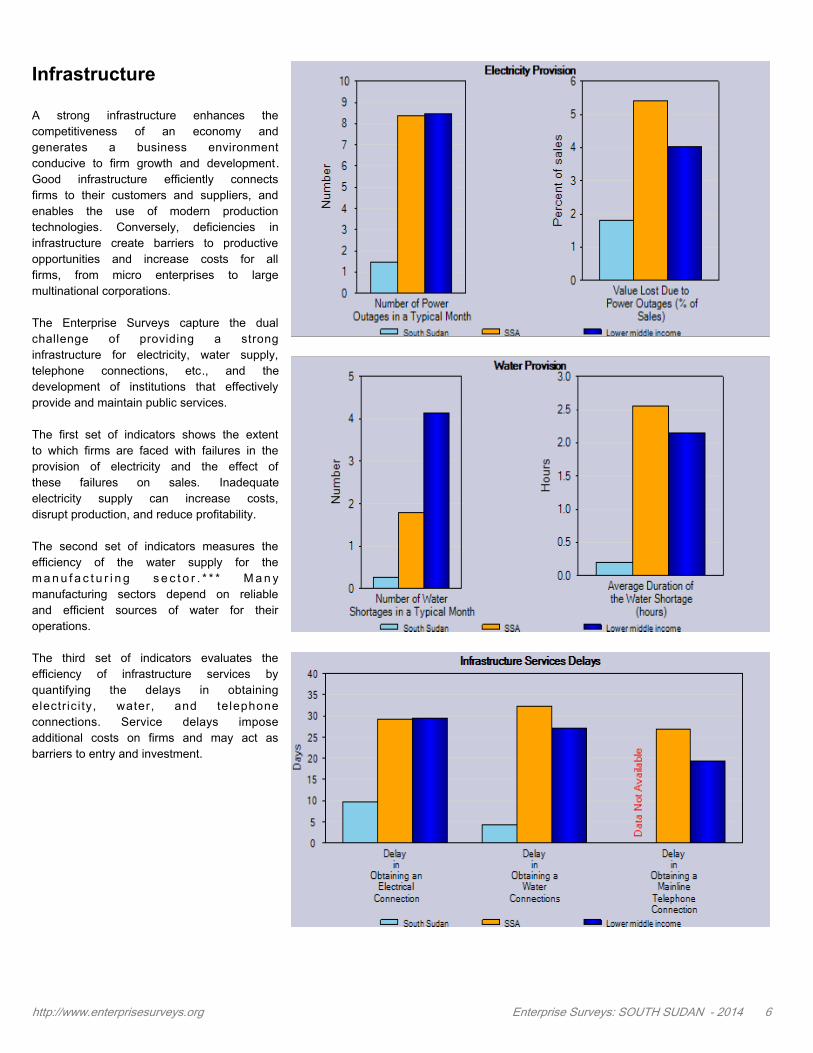
Infrastructure
A strong infrastructure enhances the
competitiveness of an economy and
generates a business environment
conducive to firm growth and development.
Good infrastructure efficiently connects
firms to their customers and suppliers, and
enables the use of modern production
technologies. Conversely, deficiencies in
infrastructure create barriers to productive
opportunities and increase costs for all
firms, from micro enterprises to large
multinational corporations.
The Enterprise Surveys capture the dual
challenge of providing a strong
infrastructure for electricity, water supply,
telephone connections, etc., and the
development of institutions that effectively
provide and maintain public services.
The first set of indicators shows the extent
to which firms are faced with failures in the
provision of electricity and the effect of
these failures on sales. Inadequate
electricity supply can increase costs,
disrupt production, and reduce profitability.
The second set of indicators measures the
efficiency of the water supply for the
m a n u f a c t u r i n g s e c t o r . * * * M a n y
manufacturing sectors depend on reliable
and efficient sources of water for their
operations.
The third set of indicators evaluates the
efficiency of infrastructure services by
quantifying the delays in obtaining
electrici ty, water, and telephone
connections. Service delays impose
additional costs on firms and may act as
barriers to entry and investment.
http://www.enterprisesurveys.org Enterprise Surveys: SOUTH SUDAN - 2014 6
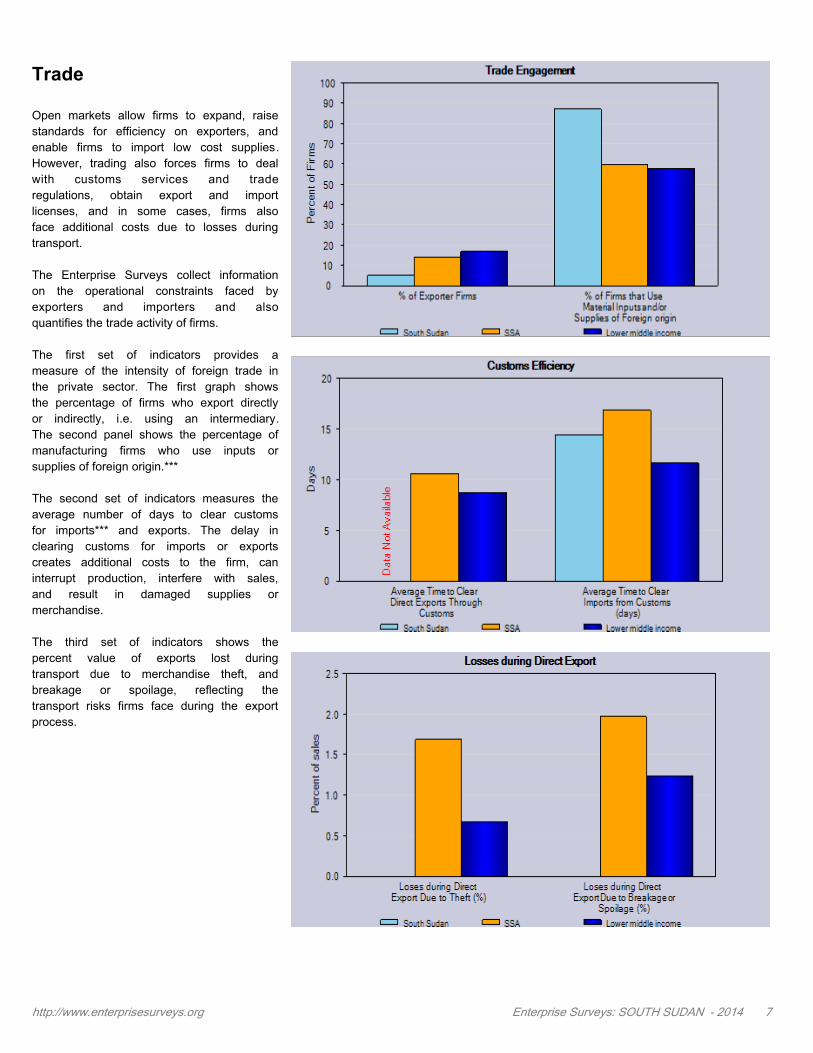
Trade
Open markets allow firms to expand, raise
standards for efficiency on exporters, and
enable firms to import low cost supplies.
However, trading also forces firms to deal
with customs services and trade
regulations, obtain export and import
licenses, and in some cases, firms also
face additional costs due to losses during
transport.
The Enterprise Surveys collect information
on the operational constraints faced by
exporters and importers and also
quantifies the trade activity of firms.
The first set of indicators provides a
measure of the intensity of foreign trade in
the private sector. The first graph shows
the percentage of firms who export directly
or indirectly, i.e. using an intermediary.
The second panel shows the percentage of
manufacturing firms who use inputs or
supplies of foreign origin.***
The second set of indicators measures the
average number of days to clear customs
for imports*** and exports. The delay in
clearing customs for imports or exports
creates additional costs to the firm, can
interrupt production, interfere with sales,
and result in damaged supplies or
merchandise.
The third set of indicators shows the
percent value of exports lost during
transport due to merchandise theft, and
breakage or spoilage, reflecting the
transport risks firms face during the export
process.
http://www.enterprisesurveys.org Enterprise Surveys: SOUTH SUDAN - 2014 7
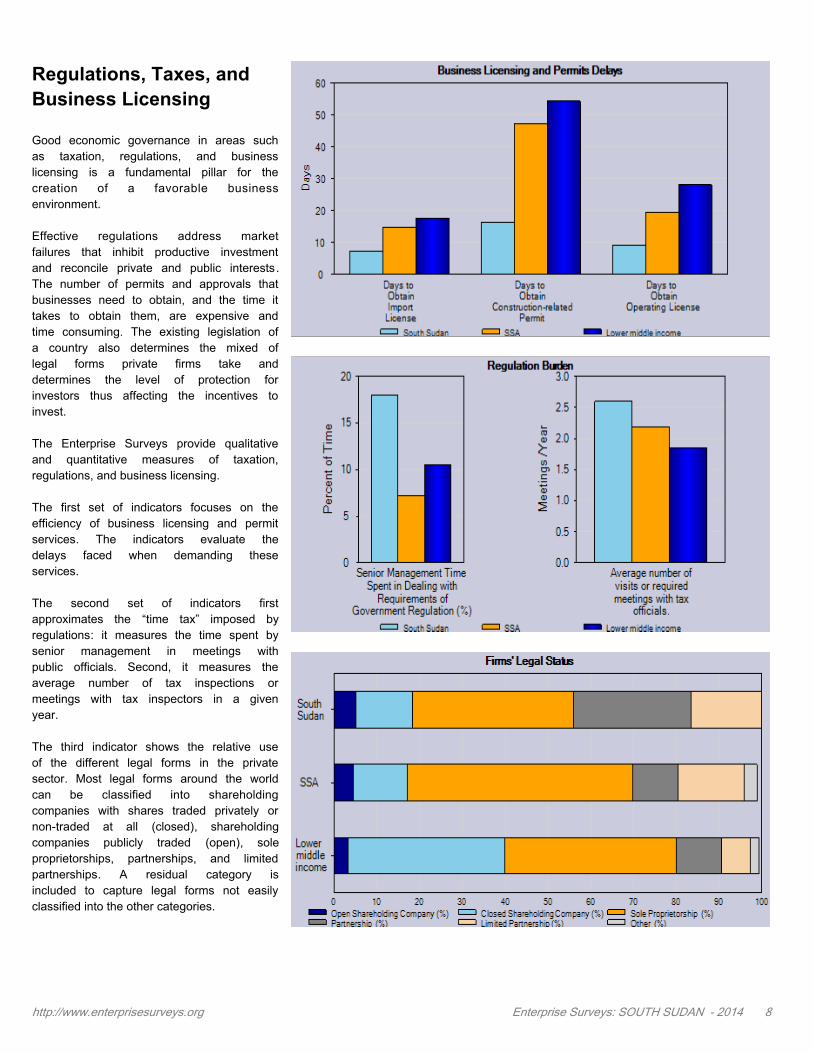
Regulations, Taxes, and
Business Licensing
Good economic governance in areas such
as taxation, regulations, and business
licensing is a fundamental pillar for the
creation of a favorable business
environment.
Effective regulations address market
failures that inhibit productive investment
and reconcile private and public interests.
The number of permits and approvals that
businesses need to obtain, and the time it
takes to obtain them, are expensive and
time consuming. The existing legislation of
a country also determines the mixed of
legal forms private firms take and
determines the level of protection for
investors thus affecting the incentives to
invest.
The Enterprise Surveys provide qualitative
and quantitative measures of taxation,
regulations, and business licensing.
The first set of indicators focuses on the
efficiency of business licensing and permit
services. The indicators evaluate the
delays faced when demanding these
services.
The second set of indicators first
approximates the “time tax” imposed by
regulations: it measures the time spent by
senior management in meetings with
public officials. Second, it measures the
average number of tax inspections or
meetings with tax inspectors in a given
year.
The third indicator shows the relative use
of the different legal forms in the private
sector. Most legal forms around the world
can be classified into shareholding
companies with shares traded privately or
non-traded at all (closed), shareholding
companies publicly traded (open), sole
proprietorships, partnerships, and limited
partnerships. A residual category is
included to capture legal forms not easily
classified into the other categories.
http://www.enterprisesurveys.org Enterprise Surveys: SOUTH SUDAN - 2014 8
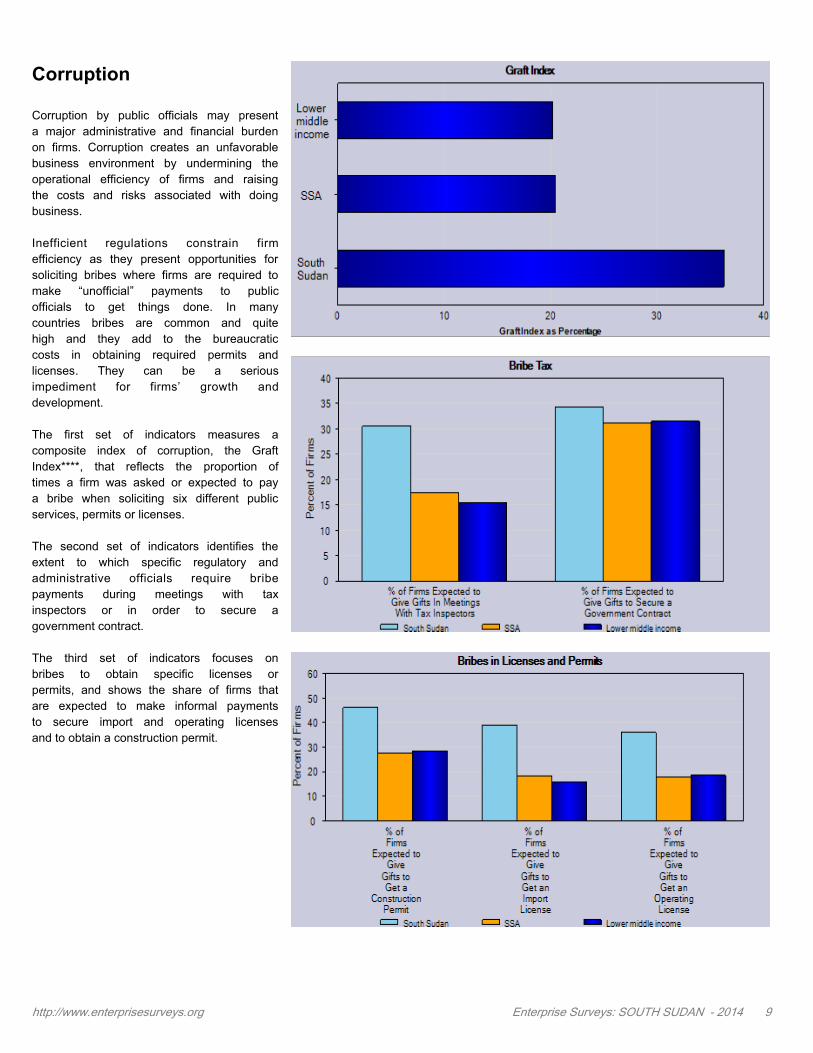
Corruption
Corruption by public officials may present
a major administrative and financial burden
on firms. Corruption creates an unfavorable
business environment by undermining the
operational efficiency of firms and raising
the costs and risks associated with doing
business.
Inefficient regulations constrain firm
efficiency as they present opportunities for
soliciting bribes where firms are required to
make “unofficial” payments to public
officials to get things done. In many
countries bribes are common and quite
high and they add to the bureaucratic
costs in obtaining required permits and
licenses. They can be a serious
impediment for firms’ growth and
development.
The first set of indicators measures a
composite index of corruption, the Graft
Index****, that reflects the proportion of
times a firm was asked or expected to pay
a bribe when soliciting six different public
services, permits or licenses.
The second set of indicators identifies the
extent to which specific regulatory and
administrative officials require bribe
payments during meetings with tax
inspectors or in order to secure a
government contract.
The third set of indicators focuses on
bribes to obtain specific licenses or
permits, and shows the share of firms that
are expected to make informal payments
to secure import and operating licenses
and to obtain a construction permit.
http://www.enterprisesurveys.org Enterprise Surveys: SOUTH SUDAN - 2014 9
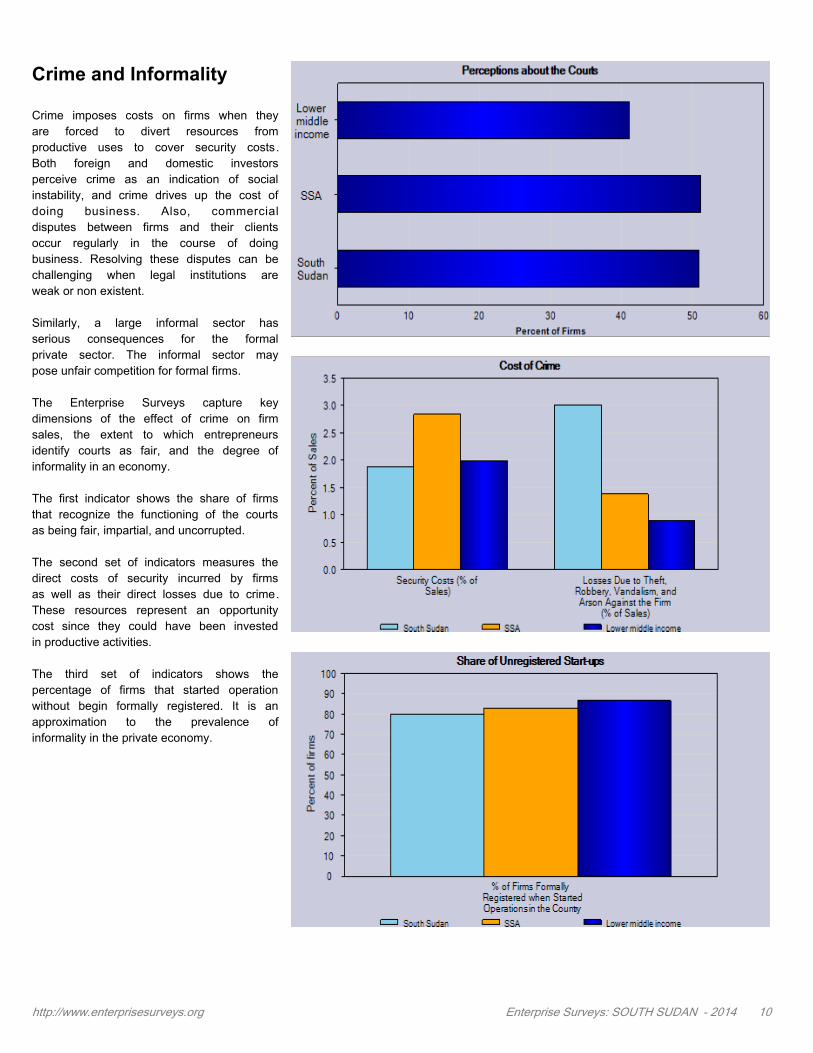
Crime and Informality
Crime imposes costs on firms when they
are forced to divert resources from
productive uses to cover security costs.
Both foreign and domestic investors
perceive crime as an indication of social
instability, and crime drives up the cost of
doing business. Also, commercial
disputes between firms and their clients
occur regularly in the course of doing
business. Resolving these disputes can be
challenging when legal institutions are
weak or non existent.
Similarly, a large informal sector has
serious consequences for the formal
private sector. The informal sector may
pose unfair competition for formal firms.
The Enterprise Surveys capture key
dimensions of the effect of crime on firm
sales, the extent to which entrepreneurs
identify courts as fair, and the degree of
informality in an economy.
The first indicator shows the share of firms
that recognize the functioning of the courts
as being fair, impartial, and uncorrupted.
The second set of indicators measures the
direct costs of security incurred by firms
as well as their direct losses due to crime.
These resources represent an opportunity
cost since they could have been invested
in productive activities.
The third set of indicators shows the
percentage of firms that started operation
without begin formally registered. It is an
approximation to the prevalence of
informality in the private economy.
http://www.enterprisesurveys.org Enterprise Surveys: SOUTH SUDAN - 2014 10
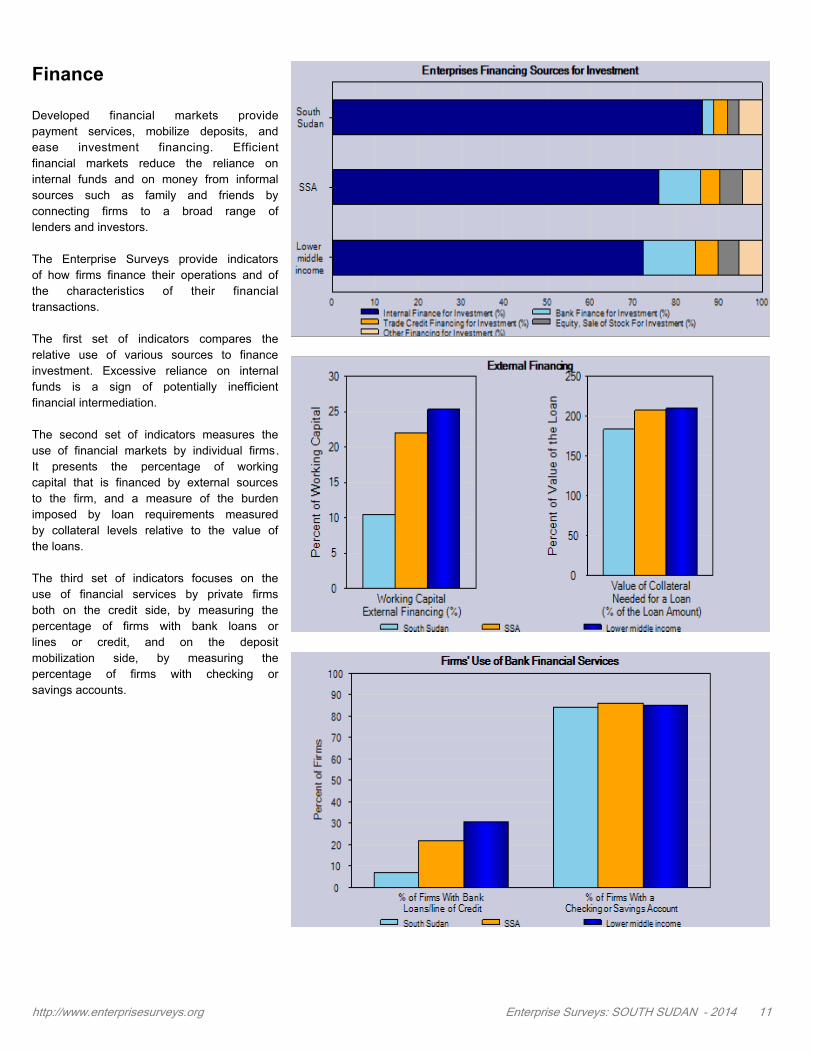
Finance
Developed financial markets provide
payment services, mobilize deposits, and
ease investment financing. Efficient
financial markets reduce the reliance on
internal funds and on money from informal
sources such as family and friends by
connecting firms to a broad range of
lenders and investors.
The Enterprise Surveys provide indicators
of how firms finance their operations and of
the characteristics of their financial
transactions.
The first set of indicators compares the
relative use of various sources to finance
investment. Excessive reliance on internal
funds is a sign of potentially inefficient
financial intermediation.
The second set of indicators measures the
use of financial markets by individual firms.
It presents the percentage of working
capital that is financed by external sources
to the firm, and a measure of the burden
imposed by loan requirements measured
by collateral levels relative to the value of
the loans.
The third set of indicators focuses on the
use of financial services by private firms
both on the credit side, by measuring the
percentage of firms with bank loans or
lines or credit, and on the deposit
mobilization side, by measuring the
percentage of firms with checking or
savings accounts.
http://www.enterprisesurveys.org Enterprise Surveys: SOUTH SUDAN - 2014 11
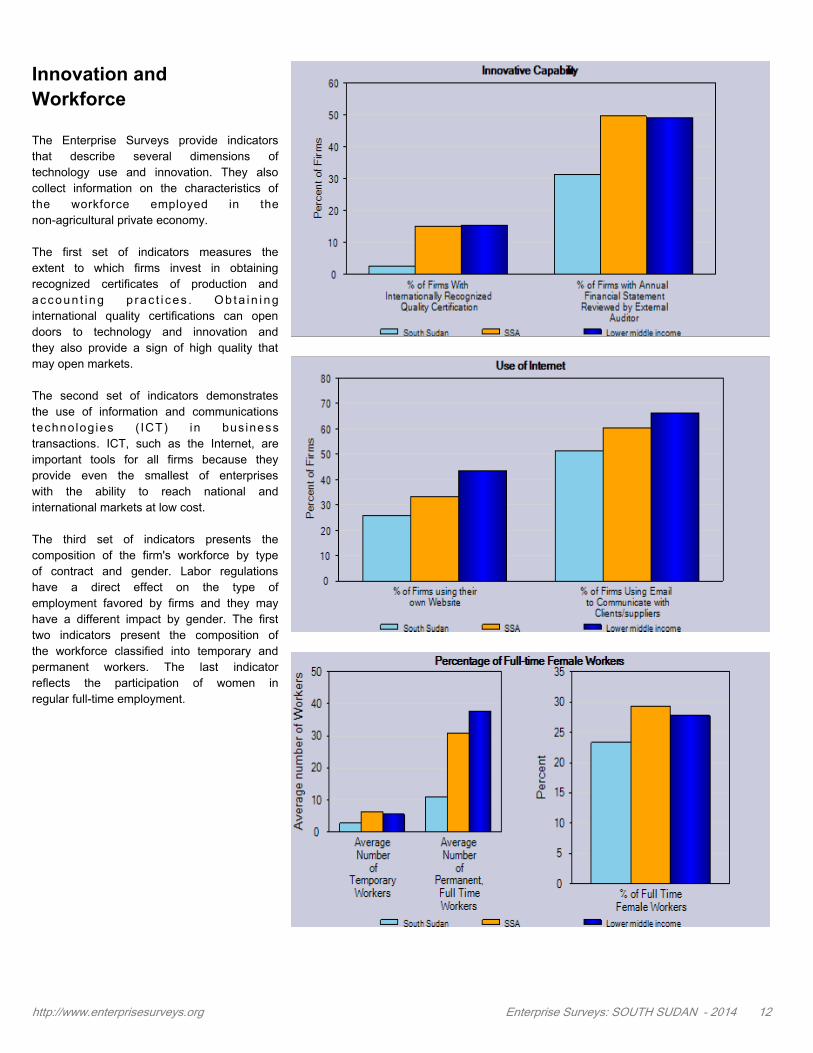
Innovation and
Workforce
The Enterprise Surveys provide indicators
that describe several dimensions of
technology use and innovation. They also
collect information on the characteristics of
the workforce employed in the
non-agricultural private economy.
The first set of indicators measures the
extent to which firms invest in obtaining
recognized certificates of production and
accoun t i ng p rac t i ces . O b t a i n i n g
international quality certifications can open
doors to technology and innovation and
they also provide a sign of high quality that
may open markets.
The second set of indicators demonstrates
the use of information and communications
technolog ies ( ICT) in bus iness
transactions. ICT, such as the Internet, are
important tools for all firms because they
provide even the smallest of enterprises
with the ability to reach national and
international markets at low cost.
The third set of indicators presents the
composition of the firm's workforce by type
of contract and gender. Labor regulations
have a direct effect on the type of
employment favored by firms and they may
have a different impact by gender. The first
two indicators present the composition of
the workforce classified into temporary and
permanent workers. The last indicator
reflects the participation of women in
regular full-time employment.
http://www.enterprisesurveys.org Enterprise Surveys: SOUTH SUDAN - 2014 12
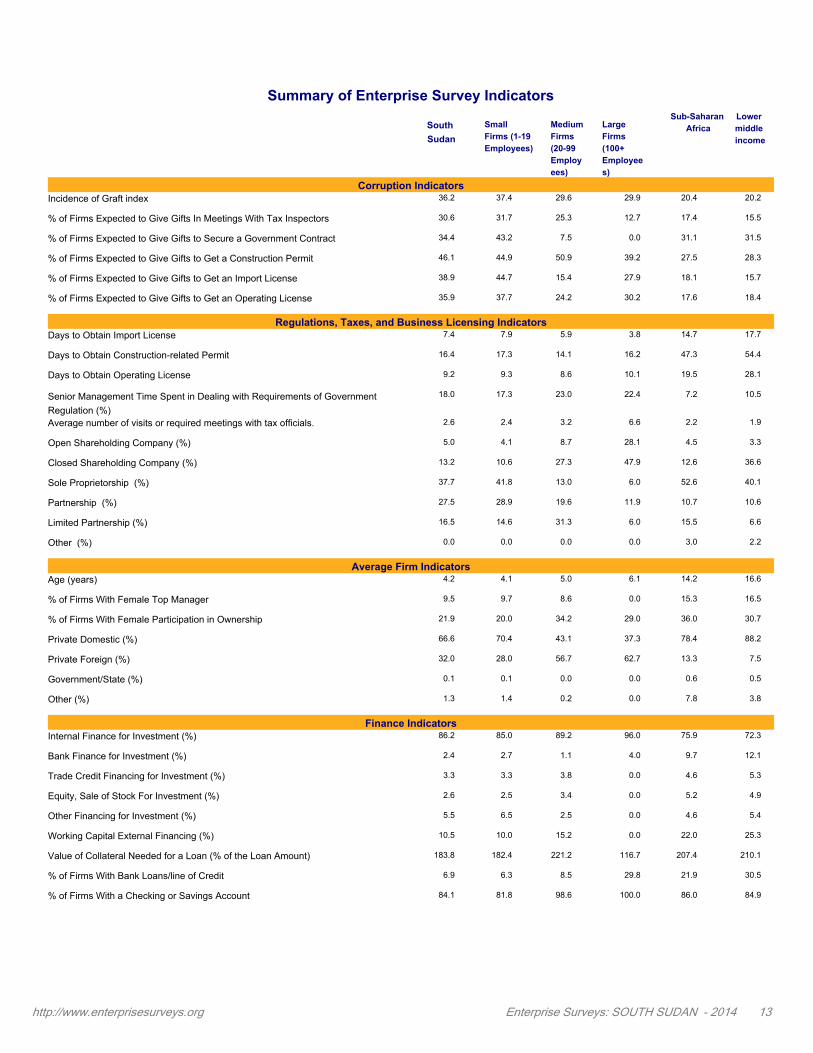
Summary of Enterprise Survey Indicators
Sub-Saharan
Africa
Lower
middle
income
South
Sudan
Small
Firms (1-19
Employees)
Medium
Firms
(20-99
Employ
ees)
Large
Firms
(100+
Employee
s)
Corruption IndicatorsIncidence of Graft index 36.2 37.4 29.6 29.9 20.4 20.2
% of Firms Expected to Give Gifts In Meetings With Tax Inspectors 30.6 31.7 25.3 12.7 17.4 15.5
% of Firms Expected to Give Gifts to Secure a Government Contract 34.4 43.2 7.5 0.0 31.1 31.5
% of Firms Expected to Give Gifts to Get a Construction Permit 46.1 44.9 50.9 39.2 27.5 28.3
% of Firms Expected to Give Gifts to Get an Import License 38.9 44.7 15.4 27.9 18.1 15.7
% of Firms Expected to Give Gifts to Get an Operating License 35.9 37.7 24.2 30.2 17.6 18.4
Regulations, Taxes, and Business Licensing IndicatorsDays to Obtain Import License 7.4 7.9 5.9 3.8 14.7 17.7
Days to Obtain Construction-related Permit 16.4 17.3 14.1 16.2 47.3 54.4
Days to Obtain Operating License 9.2 9.3 8.6 10.1 19.5 28.1
Senior Management Time Spent in Dealing with Requirements of Government
Regulation (%)
18.0 17.3 23.0 22.4 7.2 10.5
Average number of visits or required meetings with tax officials. 2.6 2.4 3.2 6.6 2.2 1.9
Open Shareholding Company (%) 5.0 4.1 8.7 28.1 4.5 3.3
Closed Shareholding Company (%) 13.2 10.6 27.3 47.9 12.6 36.6
Sole Proprietorship (%) 37.7 41.8 13.0 6.0 52.6 40.1
Partnership (%) 27.5 28.9 19.6 11.9 10.7 10.6
Limited Partnership (%) 16.5 14.6 31.3 6.0 15.5 6.6
Other (%) 0.0 0.0 0.0 0.0 3.0 2.2
Average Firm IndicatorsAge (years) 4.2 4.1 5.0 6.1 14.2 16.6
% of Firms With Female Top Manager 9.5 9.7 8.6 0.0 15.3 16.5
% of Firms With Female Participation in Ownership 21.9 20.0 34.2 29.0 36.0 30.7
Private Domestic (%) 66.6 70.4 43.1 37.3 78.4 88.2
Private Foreign (%) 32.0 28.0 56.7 62.7 13.3 7.5
Government/State (%) 0.1 0.1 0.0 0.0 0.6 0.5
Other (%) 1.3 1.4 0.2 0.0 7.8 3.8
Finance IndicatorsInternal Finance for Investment (%) 86.2 85.0 89.2 96.0 75.9 72.3
Bank Finance for Investment (%) 2.4 2.7 1.1 4.0 9.7 12.1
Trade Credit Financing for Investment (%) 3.3 3.3 3.8 0.0 4.6 5.3
Equity, Sale of Stock For Investment (%) 2.6 2.5 3.4 0.0 5.2 4.9
Other Financing for Investment (%) 5.5 6.5 2.5 0.0 4.6 5.4
Working Capital External Financing (%) 10.5 10.0 15.2 0.0 22.0 25.3
Value of Collateral Needed for a Loan (% of the Loan Amount) 183.8 182.4 221.2 116.7 207.4 210.1
% of Firms With Bank Loans/line of Credit 6.9 6.3 8.5 29.8 21.9 30.5
% of Firms With a Checking or Savings Account 84.1 81.8 98.6 100.0 86.0 84.9
http://www.enterprisesurveys.org Enterprise Surveys: SOUTH SUDAN - 2014 13
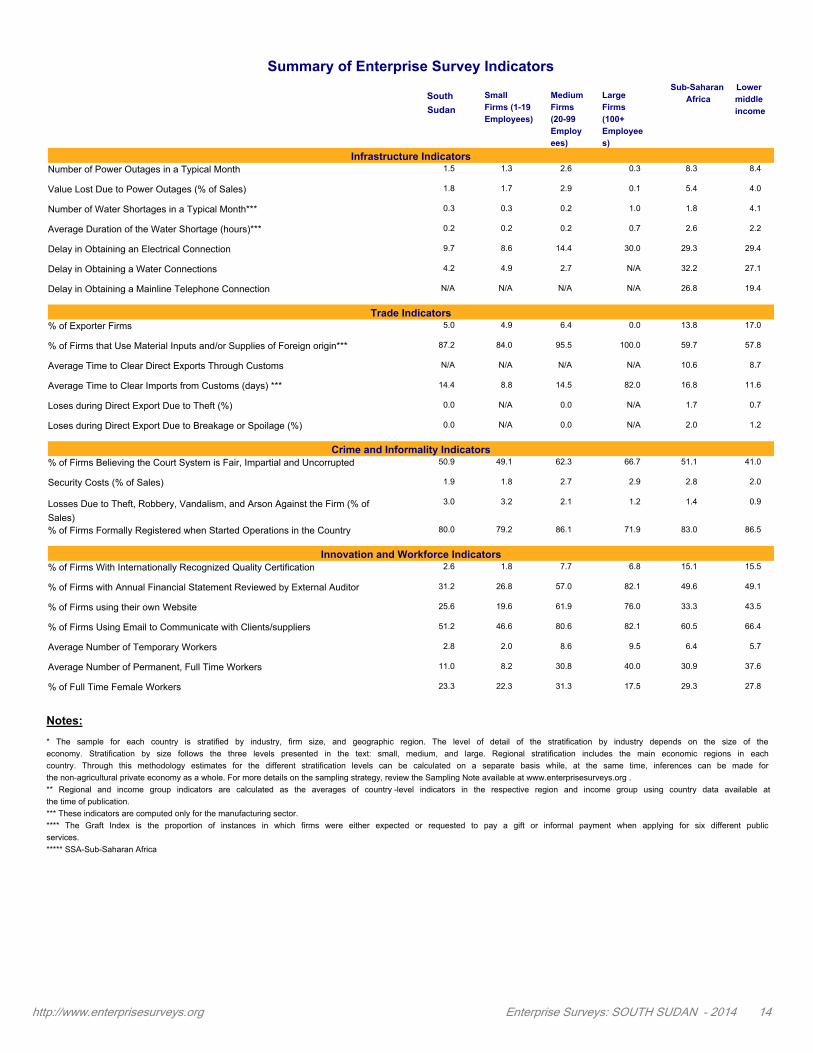
Summary of Enterprise Survey Indicators
Sub-Saharan
Africa
Lower
middle
income
South
Sudan
Small
Firms (1-19
Employees)
Medium
Firms
(20-99
Employ
ees)
Large
Firms
(100+
Employee
s)
Infrastructure IndicatorsNumber of Power Outages in a Typical Month 1.5 1.3 2.6 0.3 8.3 8.4
Value Lost Due to Power Outages (% of Sales) 1.8 1.7 2.9 0.1 5.4 4.0
Number of Water Shortages in a Typical Month*** 0.3 0.3 0.2 1.0 1.8 4.1
Average Duration of the Water Shortage (hours)*** 0.2 0.2 0.2 0.7 2.6 2.2
Delay in Obtaining an Electrical Connection 9.7 8.6 14.4 30.0 29.3 29.4
Delay in Obtaining a Water Connections 4.2 4.9 2.7 N/A 32.2 27.1
Delay in Obtaining a Mainline Telephone Connection N/A N/A N/A N/A 26.8 19.4
Trade Indicators% of Exporter Firms 5.0 4.9 6.4 0.0 13.8 17.0
% of Firms that Use Material Inputs and/or Supplies of Foreign origin*** 87.2 84.0 95.5 100.0 59.7 57.8
Average Time to Clear Direct Exports Through Customs N/A N/A N/A N/A 10.6 8.7
Average Time to Clear Imports from Customs (days) *** 14.4 8.8 14.5 82.0 16.8 11.6
Loses during Direct Export Due to Theft (%) 0.0 N/A 0.0 N/A 1.7 0.7
Loses during Direct Export Due to Breakage or Spoilage (%) 0.0 N/A 0.0 N/A 2.0 1.2
Crime and Informality Indicators% of Firms Believing the Court System is Fair, Impartial and Uncorrupted 50.9 49.1 62.3 66.7 51.1 41.0
Security Costs (% of Sales) 1.9 1.8 2.7 2.9 2.8 2.0
Losses Due to Theft, Robbery, Vandalism, and Arson Against the Firm (% of
Sales)
3.0 3.2 2.1 1.2 1.4 0.9
% of Firms Formally Registered when Started Operations in the Country 80.0 79.2 86.1 71.9 83.0 86.5
Innovation and Workforce Indicators% of Firms With Internationally Recognized Quality Certification 2.6 1.8 7.7 6.8 15.1 15.5
% of Firms with Annual Financial Statement Reviewed by External Auditor 31.2 26.8 57.0 82.1 49.6 49.1
% of Firms using their own Website 25.6 19.6 61.9 76.0 33.3 43.5
% of Firms Using Email to Communicate with Clients/suppliers 51.2 46.6 80.6 82.1 60.5 66.4
Average Number of Temporary Workers 2.8 2.0 8.6 9.5 6.4 5.7
Average Number of Permanent, Full Time Workers 11.0 8.2 30.8 40.0 30.9 37.6
% of Full Time Female Workers 23.3 22.3 31.3 17.5 29.3 27.8
* The sample for each country is stratified by industry, firm size, and geographic region. The level of detail of the stratification by industry depends on the size of the
economy. Stratification by size follows the three levels presented in the text: small, medium, and large. Regional stratification includes the main economic regions in each
country. Through this methodology estimates for the different stratification levels can be calculated on a separate basis while, at the same time, inferences can be made for
the non-agricultural private economy as a whole. For more details on the sampling strategy, review the Sampling Note available at www.enterprisesurveys.org .
** Regional and income group indicators are calculated as the averages of country -level indicators in the respective region and income group using country data available at
the time of publication.
*** These indicators are computed only for the manufacturing sector.
**** The Graft Index is the proportion of instances in which firms were either expected or requested to pay a gift or informal payment when applying for six different public
services.
***** SSA-Sub-Saharan Africa
Notes:
http://www.enterprisesurveys.org Enterprise Surveys: SOUTH SUDAN - 2014 14
© 2011 The International Bank for Reconstruction and Development / The World Bank
1818 H Street NW
Washington, DC 20433
Enterprise Analysis Unit (GIAEA)
MSN-F4P-400
Fax: 001 202-522-2029
Telephone 202-473-1000
Internet :
e-mail :
All rights reserved.
Updated May, 2015
A co-publication of the World Bank and the International Finance Corporation.
This volume is a product of the staff of the World Bank Group. The findings, interpretations and conclusions expressed in
this volume do not necessarily reflect the views of the Executive Directors of The World Bank or the governments they
represent. The World Bank Group does not guarantee the accuracy of the data included in this work.
Rights and Permissions
The material in this publication is copyrighted. Copying and/or transmitting portions or all of this work without permission
may be a violation of applicable law. The World Bank Group encourages dissemination of its work and will normally grant
permission to reproduce portions of the work promptly. For permission to photocopy or reprint any part of this work,
please send a request with complete information to the Copyright Clearance Center Inc., 222 Rosewood Drive, Danvers,
MA 01923, USA; telephone: 978-750-8400; fax: 978-750-4470; Internet:
www.enterprisesurveys.org
www.copyright.com
http://www.enterprisesurveys.org Enterprise Surveys: SOUTH SUDAN - 2014 15