south florida wading bird report 2011
DESCRIPTION
I was co-editor of the most comprehensive wading bird report produced in the United States. Covering all wading bird breeding colonies in the southern half of Florida. Research report.TRANSCRIPT

Wading Bird Report 1
INSIDE THIS ISSUE
3 Hydrology 2011
7 Regional Nesting Reports
31 Regional Bird Abundance
41 Special Topics
44 Literature Cited
SOUTH FLORIDA WADING BIRD REPORT
Volume 17 Mark I. Cook and Mac Kobza, Editors December 2011
SYSTEM-WIDE SUMMARY
Hydrology Water-level stages through the early- and mid-phases of the 2010 wet season (June –August) were close to or above average for most regions of the Greater Everglades. Thereafter, unseasonal low rainfall prompted an early start to the dry-season such that marsh water-levels were declining as early as September 2010 in some areas. By November (the typical start of the dry season) stages in most regions were relatively low, particularly in northern WCA 3A where they ranged between 0.5 – 1.0 ft below average. These initial low stages, followed by continued dry conditions and rapid water-level recession rates, provided excellent foraging conditions for wading birds during the pre-breeding and early nesting periods (November – early April 2011), particularly in WCAs 3A and 2A. Foraging conditions deteriorated when the drought intensified and stages went below ground over most of the system during the later part of the nesting season (mid April –June).
Nest Numbers An estimated 26,452 wading bird nests were initiated throughout south Florida during the 2011 nesting season; a mediocre nesting effort relative to recent nesting seasons. While this represents a 21 % increase relative to last year’s relatively poor nesting season, it was 40 % less than the average of the last ten years. It was also 66 % less than the 77,505 nests of 2009, which was the best nesting year on record in south Florida since the 1940s. All species of wading birds suffered reduced nest numbers relative to the past ten years, but the extent of the decrease varied considerably among species. Great Egrets and Wood Storks exhibited only minor reductions in nest numbers relative to their ten year averages (5 % and 12 % respectively), while White Ibises (40 %) and Snowy Egrets (60 %) suffered greater declines. Of particular note was the limited nesting by Little Blue Herons and Tricolored Herons (only 32 and 175 nests, respectively), which continues a steep decline in nesting activity by these two species during the past seven years. Roseate Spoonbill nesting effort in Florida Bay was also very limited (the lowest number of
nests since records began in 1957), but this was largely countered by an unusual nesting effort in WCA 3A. Evidence from banded individuals suggests that birds moved colony location from Florida Bay to WCA-3A, although the cause of this move is unclear at this time. The majority of wading bird nesting in south Florida occurs in the Greater Everglades. In 2011, an estimated 25,284 nests (96 % of all south Florida nests) were initiated either in the Water Conservation Areas (WCAs) or Everglades National Park (ENP). This estimate is 65 % lower than in 2009 when a record high of 73,096 nests was recorded in the Everglades. Most other regions of south Florida experienced similar declines in nest numbers during 2011. Of particular note is the reduction in wood stork nesting at Corkscrew Swamp Sanctuary. Wood Storks typically nest there annually in relatively large numbers, yet the 2011 nesting season was the fourth year of the past five when storks failed to breed there. Such an unprecedented decline in nesting activity may reflect a serious reduction in the extent or quality of Wood Stork foraging habitat in southwest Florida during recent years.
Locations of wading bird colonies with ≥ 50 nests in South Florida, 2011.

Wading Bird Report 2
On Lake Okeechobee wading bird nesting effort was relatively high in 2011, with the eighth highest nest count (5,636) since surveys started in 1957 (31 survey years). While this was slightly reduced from the 6,737 nests counted last year, it is a marked improvement on 2008 when only 39 nests were recorded around the lake. On the recently restored section of the Kissimmee River floodplain wading birds are not yet nesting in significant numbers, and this year only 92 nests were recorded. Nesting effort is not expected to increase until hydrologic conditions have been fully restored. [Note that for comparative purposes with prior years, nest counts for these three regions are not included in the above system-wide total.]
Nesting Locations in the Everglades ENP historically supported the largest proportion of nests in the Greater Everglades system, but in recent decades most nesting has occurred in the WCAs. A goal of the Comprehensive Everglades Restoration Plan (CERP) is to restore the hydrologic conditions that will re-establish prey densities and concentrations across the landscape. This, in turn, will support the return of large successful wading bird colonies to the traditional estuarine rookeries downstream of Shark Slough. In 2011, ENP supported a low proportion of the nesting in the Everglades (18%), and most nesting was located in the water conservation areas (WCA-1: 28%; WCA-3: 54%). This spatial distribution of nesting is similar to that observed over the past decade when either WCA-1 or WCA-3A held the greatest proportion of nests in the Everglades, while ENP (supporting on average 13 % of nests) was relatively unattractive for nesting. Although ENP has supported relatively more nesting birds in recent years, with the proportion of nests increasing to 20% and 21% in 2006 and 2009, and then jumping to almost 40% in 2010, this may have been due to a temporary decline in nesting conditions in the WCAs rather than an overall improvement in habitat conditions along the marsh-mangrove ecotone.
Nest Success in the Everglades Nest success varied considerably by species and region in 2011. Generally, species that completed nesting relatively early in the season, prior to the extreme dry conditions, exhibited relatively high reproductive output. Species that continued to rear young into the heart of the drought in April and May fared less well. Roseate Spoonbills and Great Egrets were probably the most successful species during 2011; of 110 Great Egret nests examined in the WCAs, 79 % produced at least one successful fledgling and the average number of fledglings per nest was 2.5 (from 49 nests). Nests success data are not yet available for the spoonbills that nested in WCA 3A but District survey flights reported large numbers of fledgling birds at the 6th Bridge colony. The small herons - Tricolored Herons, Little Blue Herons and Snowy Egrets - were moderately successful in 2011, with about half of all nests producing at least one fledgling, while 43% of White Ibis nests fledged young. Wood Stork production was relatively low in 2011; many stork nests initially hatched large numbers of nestlings, but the number of nests that fledged young was lower than average. Stork nestlings likely died as a result of starvation after critical foraging habitat dried out, or from predation after the colonies dried and mammalian predators (raccoons) were able to use dry land to access nests.
Wading Bird Abundance Data on the abundance and distribution of foraging wading birds are collected monthly during Systematic Reconnaissance Flight (SRF) surveys. During the 2011 nesting season, ENP supported low numbers of foraging birds relative to recent years; the total count was 30 % lower than in 2010 and the lowest recorded since 2008. The maximum number of birds was recorded in January (87,003) and the least (17,905) in May. Equivalent SRF surveys of the Water Conservation Areas were discontinued in 2011.
Mark I. Cook Everglades Division South Florida Water Management District 3301 Gun Club Road, West Palm Beach, FL 33406 561-686-8800 ext. 4539 [email protected]
ABBREVIATIONS
Species: Great Egret (GREG), Snowy Egret (SNEG), Reddish Egret (REEG), Cattle Egret (CAEG), Great Blue Heron (GBHE), Great White Heron (GWHE), Little Blue Heron (LBHE), Tricolored Heron (TRHE), Green Heron (GRHE), Black-crowned Night-Heron (BCNH), Yellow-crowned Night-Heron (YCNH), Roseate Spoonbill (ROSP), Wood Stork (WOST), White Ibis (WHIB), Glossy Ibis (GLIB), Anhinga (ANHI), Double-crested Cormorant (DCCO), Brown Pelican (BRPE), Osprey (OSPR), Bald Eagle (BAEA), Magnificent Frigatebird (MAFR), Fish Crow (FICR), small dark herons (SML DRK), and small white herons (SML WHT).
Regions, Agencies, and Miscellaneous: Water Conservation Area (WCA), Everglades National Park (ENP), Wildlife Management Area (WMA), A.R.M. Loxahatchee National Wildlife Refuge (LNWR), Lake Worth Drainage District (LWDD), Solid Waste Authority (SWA), South Florida Water Management District (SFWMD), U.S. Army Corp of Engineers (USACOE), Systematic Reconnaissance Flights (SRF), Comprehensive Everglades Restoration Plan (CERP), and Natural Systems Model (NSM).
SFWMD, Patrick Lynch

Wading Bird Report 3
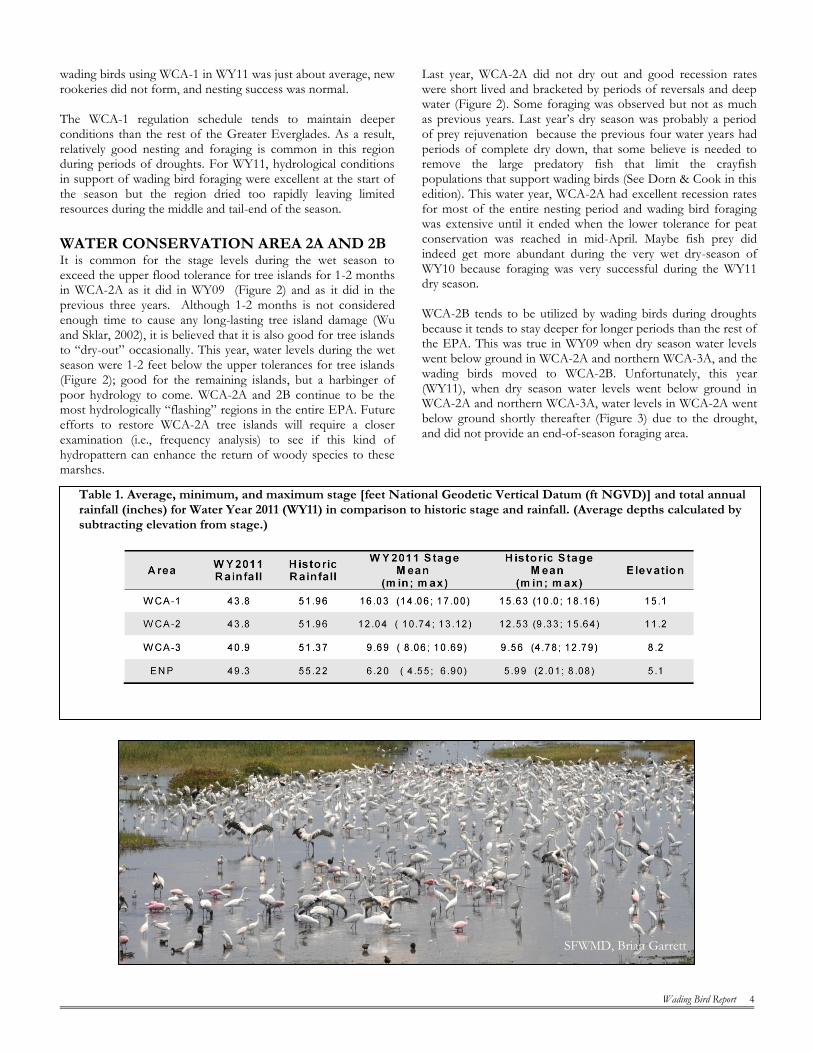
HYDROLOGIC PATTERNS FOR WATER YEAR 2011 The amount of rain in the Everglades Protection Area (EPA) for Water Year 2011 (WY11) (May 1, 2009 through April 30, 2010) was substantially less than last year and similar to the drought conditions the year previous to last year (WY09). This year (WY11) rainfall amounts were significantly below average for all regions as shown in Table 1 below. In Everglades National Park (the Park), the rainfall was 5.9 inches less (10.7%) than the historical average, and 11.2 inches less (18.5%) than last year. Water Conservation Area (WCA) -3 experienced the most dramatic deviations from last year and from historic averages, of any region. The rainfall in WCA-3 was 10.5 inches less (20%) than the historical average, and 19.7 inches less (32.5%) than last year. In Water Conservation Area (WCA) -1 and -2 the rainfall was 4.13 inches less (8%) than the historical average, and 11.8 inches more (18.1%) than last year.
One would expect from these below average precipitation values that regional water depths would also be below average. However, average stage data did not show a significant difference from the historic averages (Table 1) and instead reveals the importance of examining actual time-series and the often meaninglessness of arithmetic means. Despite the 10.7% lower than historic average rainfall in the Park for WY11, the average water depth was 1.1 ft, which was 0.2 ft above the historical average. Lower rainfall than last year “resulting” in greater than average water depth than last year could be due to two reasons: 1) lag times associated with hydrologic responses to the high stages in WY10 ( a buffering characteristic at the landscape scale) and 2) desiccation resistance of Everglades peat. Both these features can be seen by examining the WY11 hydrographs for each region in comparison to WY10 and WY09.
This is the first time in the 15-yr history of writing this chapter that three water years are included in the discussion of the ecology of the Everglades. The purpose is to highlight the disconcerting return of a second drought in only three years and discuss the ecological implications of a rare hydrograph, especially in light of the fact that the WY09 drought was a fantastic year for many species of wading birds, WY10 flooding was a terrible year for most wading birds, but WY11 drought was not a good year for the nestlings despite similar dry season water depth changes as observed during the WY09 drought.
The following hydropattern figures highlight the average stage changes in each of the WCAs for the last 3 years in relation to the recent historic averages, flooding tolerances for tree islands, drought tolerances for wetland peat, and recession rates and depths that support both nesting initiation and foraging success by wading birds. These indices were used by the District to facilitate weekly operational discussions and decisions. Tree island flooding tolerances are considered exceeded when depths on the islands are greater than 1 foot for more than 120 days (Wu and Sklar, 2002). Drought tolerances are considered exceeded when water levels are greater than 1 foot below ground for more than 30 days, i.e., the criteria for Minimum Flows and Levels in the Everglades (SFWMD, 2003). Figures 1 through 7
show the ground elevations in the WCAs as being essentially the same as the threshold for peat conservation. Figures 1a through g show the ground elevations in the WCAs as being essentially the same as the threshold for peat conservation. The wading bird nesting period is divided into three categories based upon foraging observations in the Everglades (Gawlik, 2002).
A red label indicates poor conditions due to recession rates that are too fast (greater than 0.6 foot per week) or too slow (less than 0.04 foot for more than two weeks). A red label is also given when the average depth change for the week is positive rather than negative.
A yellow label indicates fair conditions due poor foraging depths (i.e., depths greater than 1.5 ft), or slow recession rate of 0.04 foot for a week, or rapid recessions between 0.17 foot and 0.6 foot per week.
A green/good label is assigned when water depth decreased between 0.05 foot and 0.16 foot per week and water depths are between 0.1 - 1.5 ft.
WATER CONSERVATION AREA 1 Right after an exceptionally smooth and steady recession rate from November 2008 until May 2009 in WY09 (Figure 1); a recession rate that fostered record-breaking nesting and foraging for WY09, water levels rose about one foot over a two month period; not an extreme rehydration rate, but just enough to bring optimum foraging conditions to an end. At this late stage in the nesting season, the invertivorous white ibises, the dominant species nesting in WCA-1, were able to weather the reversal by feeding in the EAA and urban environments, and very large numbers of nestlings fledged successfully. Water depths in WCA-1 for the WY11 dry-season followed the same smooth and steady recession rates seen in WY09, producing highly favorable foraging conditions. However, in WY11 the dry season began at a lower stage than in WY09 and depths typically were about 0.4 feet lower in WY11 for a given point in time. As a consequence, the northern and central region of WCA-1, an area that typically supports very large numbers of nesting birds, dried out prior to the start of the nesting season in March/April, and nesting was limited to colonies in the longer hydroperiod southern third of WCA-1. The water level changes in WCA-1 during the WY11 dry season and wading bird nesting season were almost a perfect opposite to that in WY10. Recession rates starting in December of 2010 were excellent and it appeared that there would be a hydrologic pattern in support of early nesting by Wood Storks, a goal of CERP restoration. This recession, along with the fact that the dry season of WY10 was too wet to support extensive foraging and was instead conducive to the recruitment of wading bird prey (small fishes), set the stage for another record-breaking nesting and foraging for WY11. However, populations of
Wading Bird Report 4
wading birds using WCA-1 in WY11 was just about average, new rookeries did not form, and nesting success was normal. The WCA-1 regulation schedule tends to maintain deeper conditions than the rest of the Greater Everglades. As a result, relatively good nesting and foraging is common in this region during periods of droughts. For WY11, hydrological conditions in support of wading bird foraging were excellent at the start of the season but the region dried too rapidly leaving limited resources during the middle and tail-end of the season.
WATER CONSERVATION AREA 2A AND 2B It is common for the stage levels during the wet season to exceed the upper flood tolerance for tree islands for 1-2 months in WCA-2A as it did in WY09 (Figure 2) and as it did in the previous three years. Although 1-2 months is not considered enough time to cause any long-lasting tree island damage (Wu and Sklar, 2002), it is believed that it is also good for tree islands to “dry-out” occasionally. This year, water levels during the wet season were 1-2 feet below the upper tolerances for tree islands (Figure 2); good for the remaining islands, but a harbinger of poor hydrology to come. WCA-2A and 2B continue to be the most hydrologically “flashing” regions in the entire EPA. Future efforts to restore WCA-2A tree islands will require a closer examination (i.e., frequency analysis) to see if this kind of hydropattern can enhance the return of woody species to these marshes.
Last year, WCA-2A did not dry out and good recession rates were short lived and bracketed by periods of reversals and deep water (Figure 2). Some foraging was observed but not as much as previous years. Last year’s dry season was probably a period of prey rejuvenation because the previous four water years had periods of complete dry down, that some believe is needed to remove the large predatory fish that limit the crayfish populations that support wading birds (See Dorn & Cook in this edition). This water year, WCA-2A had excellent recession rates for most of the entire nesting period and wading bird foraging was extensive until it ended when the lower tolerance for peat conservation was reached in mid-April. Maybe fish prey did indeed get more abundant during the very wet dry-season of WY10 because foraging was very successful during the WY11 dry season. WCA-2B tends to be utilized by wading birds during droughts because it tends to stay deeper for longer periods than the rest of the EPA. This was true in WY09 when dry season water levels went below ground in WCA-2A and northern WCA-3A, and the wading birds moved to WCA-2B. Unfortunately, this year (WY11), when dry season water levels went below ground in WCA-2A and northern WCA-3A, water levels in WCA-2A went below ground shortly thereafter (Figure 3) due to the drought, and did not provide an end-of-season foraging area.
Table 1. Average, minimum, and maximum stage [feet National Geodetic Vertical Datum (ft NGVD)] and total annual rainfall (inches) for Water Year 2011 (WY11) in comparison to historic stage and rainfall. (Average depths calculated by subtracting elevation from stage.)
SFWMD, Brian Garrett

Wading Bird Report 5
WCA 1 – Site 9 WCA 2A – Site 17
WCA 2B – Site 99 WCA 3A – Site 63
WCA 3A – Site 64 WCA 3B – Site 71
NE Shark River Slough
A B
G
F E
D C
Figure 1. Hydrology in the WCAs and ENP in relation to recent average water depths (A: 14yr ave, B: 14 yr ave, C: 16 yr ave, D: 17 yr ave, E: 17 yr ave, F: 12 yr ave, G: 25 yr ave) and indices for tree islands, peat conservation, and wading bird foraging depths.
Hydrologic reversal or no surface water
Median daily statistic
Daily mean gage height
Period of approved data
Period of provisional data Average ground elevation in major vegetation community near gage
Good recession rates
Poor recession or depths
Lower Tolerance for Peat Conservation
Upper Tolerance for Tree Islands
Good Recession Rates
Hydrologic Deficit
Poor Foraging Depths
Water Year 2011
Lower Tolerance for Peat Conservation
Upper Tolerance for Tree Islands
Good Recession RatesHydrologic Deficit
Water Year 2011
Poor Foraging Depths
Lower Tolerance for Peat Conservation
Good Recession RatesHydrologic Deficitl
Water Year 2011
Poor Recession or Depths
Lower Tolerance for Peat Conservation
Upper Tolerance for Tree Islands
Good Recession Rates
Hydrologic Deficit
Water Year 2011
Lower Tolerance for Peat Conservation
Upper Tolerance for Tree Islands
Good Recession Rates
Hydrologic Deficit
Water Year 2011
Poor Recession or Depths
Lower Tolerance for Peat Conservation
Upper Tolerance for Tree Islands
Good Recession RatesHydrologic Deficit Poor Recession or Depths
Water Year 2011
Lower Tolerance for Peat Conservation
Upper Tolerance for Tree Islands
Good Recession RatesHydrologic Deficit Poor Recession or Depths
Water Year 2011

Wading Bird Report 6
WATER CONSERVATION AREA 3A In the northeastern region of WCA-3A (Gage-63) the WY11 began with a relatively deep May and June (Figure 4). It looked liked like it was going to be a very wet wet-season. However, La Nina stabilized, causing rainfall to drop and water levels to stay below average for almost the entire water year. This provided perfect wading bird foraging conditions. Recession rates were excellent starting in December (good for Wood Storks) and optimum depths started to appear around January 2011. Avian scientists recorded extremely large numbers of foraging birds in this important NE section of WCA-3A from early January until March 2011, when surface water disappeared. Unfortunately, as a consequence of the dry conditions, birds did not initiate nesting at Alley North colony where annual nesting during the past decade has frequently exceeded 20,000 nests. Soil moisture during the month of April, May and June got critically low and posed a muck fire threat to the Alley North colony. Fortunately, there were no muck fires and the July rain removed the forest fire hazard in the region. Birds responded to the dry conditions at Alley North by nesting at another local colony to the south of I-75, 6th Bridge colony, where hydroperiods are longer. However, nest numbers were much reduced relative to those typical at Alley North. Of particular interest was the large number of Roseate Spoonbills that nested successfully at this colony. This species typically nests in the coastal habitats of Florida Bay and nesting of this magnitude has not previously been detected in the fresh water Everglades. The hydrologic pattern last year in Central WCA-3A (Gage-64) was not very conducive for wading bird foraging. Like most of the Everglades, WY10 in central Everglades was probably a good year for prey rejuvenation. Moving into WY11, water depths were average and did not exceed the upper tolerances for Tree islands (Figure 5). Good recession rates, supporting maximum foraging behavior and nesting started in November 2010 and lasted for a full five months, just like it did during the drought conditions of WY09. Large flocks of wading birds were observed following the receding dry-downs fronts in Central WCA-3A during both droughts (i.e., WY09 and WY11). However, 2009 was a record year and 2011 was below average. In WY11, the region dried down sooner than in WY09 leaving less available foraging habitat at critical stages of the nesting season. By mid April, when many birds are close to hatch their eggs, most of the system was already dry. As the prey density data are processed over the next year or so, it will be valuable to see if these differences were due to lack of prey or lack of hydrological buffering capacity in the extant system or both.
WATER CONSERVATION AREA 3B During the WY09 drought, in WCA-3B, water levels fell at an almost steady perfect 0.10 ft per week during the dry season. The set-up for optimum March and April foraging by wading birds could not have been better. Water Year 2010 was a very different story. Like everywhere else in the EPA, there was an abrupt water level rise in May and June 2009, followed by an almost flat and deep dry season with numerous reversals and a very poor recession rate. Water year 2011 depths were about a half a foot lower than water year 2009, but as in WY09, water levels fell at an almost steady perfect 0.10 ft per week during the dry season. Foraging in support of nesting was initially outstanding. However, late season dry-downs were almost two feet below
ground and lasted for months (Figure 6), and late-season foraging was very limited. Again, as the prey density data are processed over the next year or so, it will be valuable to see if these differences between drought years were due to lack of prey or lack of hydrological buffering capacity in the extant system or both.
NORTHEAST SHARK RIVER SLOUGH Last year (WY10), the dry season had good recession rates for one month (January). The rest of the time and despite the relatively good water depths, the water levels in NE Shark River Slough did not decrease and did not support wading bird foraging. Like the rest of the EPA, this might have been a period of prey rejuvenation due to the lack of predation intensity from foraging wading birds. Although not all the WY11 data has been processed yet, it appears that the nesting and foraging in this region of the Park was average despite the excellent dry-season recession rates and the similar water level changes observed during the drought of WY09 (Figure 7), when high numbers of Wood Storks and Ibis were found foraging throughout the Park and nesting success in the NE Shark River Slough was also high. The 2009 and 2011 hydrographs for this section of the Park were extremely similar. Wet season water depths were about 1.2 ft both years, and dry-season water levels were below ground for almost the same amount of time. However, wading bird nesting success was significantly different, especially for the Wood Storks. It is likely that nesting was successful in WY09 and not in WY11 because WCA-3A and WCA-3B dried down too rapidly in WY11. Fred Sklar Everglades Division South Florida Water Management District 3301 Gun Club Road West Palm Beach, Fl 33406 561-682-6504 [email protected]
SFWMD, James Beerens

Wading Bird Report 7
REGIONAL NESTING REPORTS
WATER CONSERVATION AREAS 2 AND 3, AND A.R.M. LOXAHATCHEE NATIONAL WILDLIFE REFUGE The University of Florida Wading Bird Project carried on its long-term monitoring of wading bird nests throughout the WCAs 2, 3 and Loxahatchee NWR in 2011. We focused primarily on counts for Great Egrets, White Ibises, Snowing Egrets, and Wood Storks, the species most readily located and identified through aerial searches. Additional estimates for other species were gleaned from ground surveys and visits to nesting colonies.
Methods We performed two types of systematic surveys in 2011: aerial and ground surveys. The primary objective of both kinds of surveys
is to locate and evaluate nesting colonies. On or about the 15th
of each month from February through June, we performed aerial surveys to find active colonies using observers on both sides of a Cessna 182. A flight altitude of 800 feet AGL and east-west oriented flight transects spaced 1.6 nautical miles apart have been used continuously since 1986 and shown to result in overlapping coverage under a variety of weather and visibility conditions. In addition to contemporaneous visual estimates of nesting birds, we took aerial digital photos of all colonies. We made subsequent detailed counts of nesting birds observed in these digital photos. The reported numbers of nest starts are usually peak counts, in which the highest count for the season is used as the estimate of nests for each species within each colony. Since 2005, we have performed systematic ground surveys in parts of WCA 3 that give an index of abundance for small colonies and dark-colored species not easily located during aerial surveys. In the case of ground surveys, all tree islands within sixteen 500m-wide belt transects were approached closely enough to flush nesting birds, and nests were either counted directly, or estimated from flushed birds. These totals were added to the totals reported in Table 2. Note that because ground surveys were conducted on a subset of the total area, the figures should be used mainly for year-to-year comparisons and do not reflect the total number of nesting pairs for species like Little Blue, Tricolored, and Great Blue herons. Estimates for ANHI were not reliable (and thus excluded) since they nested early in the season, well before the heron nesting (and our in-colony nest checks, as well as ground surveys) began. Results Nesting Effort: We estimated a total of 20,816 wading bird nests were initiated at colonies within LNWR, WCA 2, and WCA 3 (Tables 1 and 2). An additional 1500 wading bird nests were observed in the Tamiami West colony, including 400 WOST. Since these nests were outside of WCA 3, they are counted in the ENP totals.
Nesting effort was significantly higher than last season (12,432 nests observed in 2010), but considerably lower than either the average of the preceding five (68%) or ten years 61%. While rapidly drying conditions allowed the birds to initiate, drying may have been too rapid to generate and attract large numbers of nesting birds. We found large colonies of White Ibises in both WCA 3 (6th Bridge) and WCA 2 (Weldon, Lox 99) with about half in each water management unit (Table 1). The total numbers of ibis nest starts did not exceed the minimum required for a “supernormal” nesting, and we now have recorded two years in a row without supernormal nesting. We also had a total of 470 Wood Storks initiate nesting in the WCAS, the majority at Jetport South colony (350). However, this colony failed entirely during March and did not produce young. Perhaps the largest change and biggest surprise was a large increase in numbers of Roseate Spoonbills nesting in the WCAs. While there have been regular nestings of 20 – 60 pairs in Alley North for over 10 years, we found over 160 pairs in 6th Bridge colony in February. These birds must have largely come from colonies in Florida Bay, where the nesting totals were considerably reduced (see Florida Bay section). Spoonbills were largely successful at 6th Bridge, and it is unclear why they may have moved to the WCAs in such large numbers this year. Spoonbills were first recorded nesting in the WCAs in recent history in 1992 – another year in which water levels fell rapidly. Perhaps spoonbills are particularly attracted to sudden pulses of food during these conditions. Food availability indices in Florida Bay were reported to be favorable for nesting in winter 2010/11, so it seems unlikely that they had moved because of poor foraging there. We also continued long-term monitoring of small colonies, primarily small dark herons, in WCA 3. All tree islands are investigated closely by airboat during April using 16, 0.5 km wide belt-transects oriented north to south in WCA 3, comprising approximately 336 km2. All islands are approached, and sometimes entered, to determine numbers of nesting birds and species composition. These same transects have been systematically surveyed annually since 1996 (Figure 1). There is a clear trend towards much smaller numbers of Tricolored Heron and Little Blue Heron nests in the study area. The
SFWMD, Mac Kobza

Wading Bird Report 8
average number seen in 2005 – 2011 is reduced by 76% for LBHE and 53% for TCHE by comparison with 1996 – 2004 averages. This pattern could be the result of a general reduction in nesting by these species throughout the Everglades, or it could indicate that these species are generally nesting elsewhere in the system in recent years. In any case, this trend should serve as an alarm for potential widespread declines of these two state-listed species. Reproductive Success. Wood Stork and Great Egret nests were initiated in February and continued through early June. We monitored nest success for 9 species in 4 colonies; Tamiami West, Vacation, Joule, and Yonteau. GREG (n=110) nested in all 4 colonies monitored, while WHIB (n=126) nested in Tamiami West and Yonteau, with WOST (n=19) present only Tamiami West. Small herons (n=108) nested in all 4 colonies, however identification to species was not possible in Vacation and Joule.
We could no longer access these colonies by mid-April due to drying, and at this time many small herons were indistinguishable. In an effort to provide unbiased estimates of
nest success, unidentified small herons were pooled within each species for analysis. As a result nest success was estimated for BCNH (n=103), LBHE (n=72), SNEG (n=80), and TRHE (n=93) combining data for all colonies.
Overall nest success (P; probability of fledging at least one young) was highest for Great Egrets (P=0.79; SD=0.046), TRHE (P=0.54; SD=0.054), SNEG (P=0.48; SD=0.058), LBHE (P=0.45; SD=0.060), WHIB (P=0.43; SD=0.044) and WOST (P=0.43; SD=0.125). Nest Success varied between colonies for species, particularly GREG. In Joule and Tamiami West, GREG nest success (n=69) was < 60%, while in Yonteau and Vacation nest success (n=41) was > 80%. WHIB estimates were slightly higher in Tamiami West (P=0.45) than in Yonteau (0.40).
Table 1. Number of nesting pairs found in Loxahatchee NWR during systematic surveys, February through June of 2011.
Latitude Longitude WCA Colony GREG WHIB WOST ROSP SNEG GBHE LBHE TRHE GLIB BCNH
Unid. Large
Wht.
Unid. Small
Wht.
Unid. Small
Dark. ANHI
Colony
Total*
26.53280 -80.27620 1 Lox NC-4 100 0 0 0 0 0 0 0 0 0 0 0 0 0 100
26.43822 -80.39053 1 Lox 99 250 3,000 0 0 0 0 0 0 0 0 0 0 0 0 3,250
26.55014 -80.44268 1 Lox West 0 0 0 0 0 0 0 0 0 0 0 0 0 0 0
26.39895 -80.24992 1 Venus 0 0 0 0 0 0 0 0 0 0 0 0 0 0 0
26.45857 -80.24032 1 Lox NC-2 300 0 0 0 0 0 0 0 0 0 0 0 0 0 300
26.46838 -80.37229 1 Welt 200 0 0 8 0 0 0 0 0 0 0 0 0 0 208
26.51169 -80.35949 1 Wist 0 0 0 0 0 0 0 0 0 0 0 0 0 0 0
26.46266 -80.37251 1 Wonton 0 0 0 0 0 0 0 0 0 0 0 0 0 0 0
26.36849 -80.25431 1 Tyche 0 0 0 0 0 0 0 0 0 0 0 0 0 0 0
26.49117 -80.26712 1 Weldon 150 3,000 0 0 0 0 0 0 0 0 0 0 0 0 3,150
26.37217 -80.26020 1 Lox 73 0 0 0 0 0 0 0 0 0 0 0 0 0 0 0
26.37197 -80.31035 1 Utu 58 0 0 0 0 0 0 0 0 0 0 0 0 0 58
Air Surveys > 50 0 0 0 0 0 0 0 0 0 0 0 0 0 0 0
Air Surveys < 50 144 0 0 0 0 0 0 0 0 0 0 0 0 0 144
Totals By Species 1,202 6,000 0 8 0 0 0 0 0 0 0 0 0 0 7,210
* Excludes ANHI
SFWMD, Brian Garrett

Wading Bird Report 9
Table 2. Number of nesting pairs found in WCAs 2 and 3 during systematic surveys, February through June of 2011.
In addition to nest success, we calculated average brood size and mean number fledged for each species that was monitored to the end of their respective fledgling period. Mean brood size was highest for WOST (3.07; n=14), followed by BCNH (2.84; n=43), GBHE (2.75; n=8), GREG (2.64; n=99), TRHE (2.59; n=53), SNEG (2.50; n=40); WHIB (2.06; n=80) and ROSP (2.00; n=2). Mean number fledged was highest for GREG (2.54; n=46), followed by BCNH (2.41; n=34), SNEG (2.3; n=27), TRHE (2.18; n=40), LBHE (2.15; n=20) and WHIB (1.23; n=71). While Wood Stork nest success in Tamiami West was reasonably high (43%), and brood size was quite high (3.07), it is important to note that the colony at Jetport South failed entirely and nest success was essentially zero there. It is unclear why the storks abandoned at Jetport, though food sources on the west side of the WCAS may have dried up earlier than on the east side, based solely on elevation gradients. If storks nesting in freshwater (ENP and WCAs) are tallied together (870 nests), 470 were known to have failed at Jetport South, and 228 of those at
Tamiami are estimated to have failed. This indicates that almost 80% of all the stork nests in freshwater marshes failed in 2011. Nest success at Tamiami may also give an overly optimistic picture, since we only estimated success through 65 days of nesting. A trip into the colony after young had left the nest but had not fledged (need date) found appreciable numbers of dead young and scavenged carcasses in and near nests. So the numbers of chicks actually fledged from any of the freshwater colonies was almost certainly very low. This suggests that the 2011 season was only marginally successful for storks, with about the same number of nest starts as the ten-year average, but poorer nest success than usual.
During ground surveys, we also noted that the marsh surrounding a number of colonies of small herons experienced drying, to the point that raccoons consistently were able to access the areas and cause heavy nest losses. This was evidenced by feathers of nestlings in raccoon scat, high nest loss/abandonment, and large numbers of partially eaten chick carcasses. It seems likely that nest success was generally lower in
Latitude Longitude WCA Colony GREG WHIB WOST ROSP SNEG GBHE LBHE TRHE GLIB BCNH
Unid. Large
Wht.
Unid. Small
Wht.
Unid. Small
Dark. ANHI
Colony
Total*
26.24335 -80.35072 2 Shiva 40 0 0 0 0 0 0 0 0 0 0 0 0 0 40
26.14478 -80.39014 2 Opus 0 0 0 0 0 0 0 0 0 0 0 0 0 0 0
26.20132 -80.52873 3 Alley North** 350 0 0 50 0 3 0 0 0 0 0 165 0 0 568
25.77353 -80.83722 3 Hidden** 137 400 0 0 0 0 0 0 0 0 0 0 0 0 537
25.86302 -80.83874 3 Jetport 0 0 0 0 0 0 0 0 0 0 0 0 0 0 0
26.12428 -80.54148 3 6th Bridge 523 5,000 0 105 0 6 0 0 0 0 0 0 0 0 5,634
26.01230 -80.63233 3 Joule 125 0 0 3 0 0 0 0 0 0 0 0 0 0 128
26.12408 -80.50438 3 Cypress City 180 0 0 0 0 2 0 0 0 0 0 0 0 0 182
26.04602 -80.62586 3 Big Melaleuca 60 0 0 0 0 0 0 0 0 0 0 0 0 0 60
26.10064 -80.45485 3 Nammu 0 0 0 0 0 0 0 0 0 0 0 0 0 0 0
25.80133 -80.49000 3 3B Mud East 0 0 0 0 0 0 0 0 0 0 0 0 0 0 0
25.80510 -80.84902 3 Jetport South 100 0 350 0 0 0 0 0 0 0 0 0 0 0 450
25.96052 -80.57207 3 L-67 (Horus) 0 0 0 0 0 0 0 0 0 0 0 0 0 0 0
25.91565 -80.63022 3 Vacation 250 0 0 0 0 4 0 0 0 0 0 0 0 0 254
26.01557 -80.56272 3 Jupiter 200 0 0 0 0 5 0 0 0 0 0 0 0 0 205
26.02563 -80.53917 3 Vulture 0 0 0 0 0 0 0 0 0 0 0 0 0 0 0
25.78654 -80.84958 3 Brodin 0 0 0 0 0 0 0 0 0 0 0 0 0 0 0
26.10715 -80.49802 3 Nanse 220 0 0 0 0 3 0 0 0 0 0 0 0 0 223
26.00377 -80.59762 3 Jerrod 40 0 0 0 0 0 0 0 0 0 0 0 0 0 40
25.88937 -80.56263 3 Freya 0 0 0 0 0 0 0 0 0 0 0 0 0 0 0
26.13125 -80.70168 3 Odin 0 0 0 0 0 0 0 0 0 0 0 0 0 0 0
25.92347 -80.51858 3 Ganga 91 0 0 0 0 0 0 0 0 0 0 0 0 0 91
26.00012 -80.59513 3 Janus 0 0 0 0 0 0 0 0 0 0 0 0 0 0 0
25.87413 -80.65365 3 Enlil 400 0 0 0 0 5 0 0 0 0 0 0 0 0 405
25.94672 -80.63782 3 Starter Mel 0 0 0 0 0 0 0 0 0 0 0 0 0 0 0
25.79073 -80.85390 3 Budda 0 0 0 0 0 0 0 0 0 0 0 0 0 0 0
25.95365 -80.65352 3 Hermes 0 0 0 0 0 0 0 0 0 0 0 0 0 0 0
26.04250 -80.50308 3 Kinich 35 0 120 0 0 0 0 0 0 0 0 0 0 0 155
26.15734 -80.48511 3 Potter 0 0 0 0 0 0 0 0 0 0 0 0 0 0 0
25.82346 -80.64074 3 Chac 0 0 0 0 0 0 0 0 0 0 0 0 0 0 0
25.92517 -80.83500 3 Crossover 0 0 0 0 0 0 0 0 0 0 0 0 0 0 0
25.92517 -80.78003 3 Garuda 0 0 0 0 0 0 0 0 0 0 0 0 0 0 0
Air Surveys > 50 981 1,900 0 0 165 0 0 0 0 0 0 0 0 0 3,046
Air and Ground < 50 *** 438 79 0 5 77 177 32 36 0 744 0 0 0 386 1,974
Totals by Species 4,170 7,379 470 163 242 205 32 36 0 744 0 165 0 386 13,992
* Excludes ANHI
** Estimates of subcanopy nests adjusted based on ground visits
*** Includes COUNT wading bird nesting pairs from ground surveys

Wading Bird Report 10
the northernmost of the colonies which dried first. Since we could only measure nest success in colonies that we could reach with airboats, we believe our nest success estimates for Tricolored Herons, Little Blue Herons, and Great Egrets may be biased high for the WCAs.
In summary, the 2011 nesting season produced mediocre numbers of nest starts, with highly variable nest success across colonies. The tradeoff was clearly that food was abundant for much of the season through rapid drying, but that the rapid drying also contributed considerably to nest failure, much of it through predation.
Peter Frederick Chris Winchester Department of Wildlife Ecology and Conservation P.O. Box 110430 University of Florida Gainesville, Florida 32611-0430 352-846-0565 [email protected] [email protected]
EVERGLADES NATIONAL PARK (MAINLAND)
Status of Wading Bird Colonies in Everglades National Park, 2010 Nesting Season
This summary report addresses colony monitoring within the mainland slough and estuarine areas of Everglades National Park using data collected during the 2011 wading bird breeding season. Wading bird nesting colonies in Everglades National Park (ENP) are surveyed as part of a regional monitoring program to track wading bird nesting effort and success throughout the greater Everglades ecosystem. Data collected during surveys and monitoring flights help guide ongoing ecosystem restoration projects. The long-term monitoring objectives for wading bird nesting colonies in ENP are:
Collect data on wading bird nesting effort, locations, numbers of colonies, and timing of colony nesting.
Compile and share data with other agencies that monitor wading birds in South Florida with the ultimate goal of restoring and sustaining wading bird populations in the Florida Everglades.
Methods We started our survey flights of known colonies in October 2010 in order to detect the earlier nesting of Roseate Spoonbills. Established colony sites were spot-checked monthly while conducting other wildlife project flights until birds were seen roosting in any of the colonies. At that point, dedicated colony flights were flown monthly to document nesting activity in detail. Usually 1 or 2 observers checked all known colony locations using a Cessna 182 fixed-wing aircraft. Altitude was maintained at about 800 feet above ground level. Flights were conducted starting 20 October 2010 and ending on 15 July 2011 when all young were observed to be fledged. During each flight, visual estimates of nest numbers by species were made and photos were taken of colonies using a Canon digital SLR camera with a 70-200mm lens. Photos were later compared to visual estimates to assist with determining nest numbers, nesting stage, and species composition. Birds that were difficult to see or tend to nest under vegetation (i.e., Roseate Spoonbills, Little Blue Herons, Tri-colored Herons and Black-crowned Night Herons,) were noted as present and assumed nesting if adults were seen flying in and out of the colonies. We conducted a systematic colony survey on 15 April of Shark River Slough and Taylor Slough. Timing for this flight was determined by spot-checking egret colony sites in Shark River Slough. Two observers, with 1 observer sitting on each side of a Cessna 182 fixed-wing aircraft, searched for colonies along 20 established transects oriented east to west and spaced 1.6 nautical miles apart. Flight altitude was maintained at 800 feet above ground level throughout the survey. Coordinates were recorded and photos were taken of each colony site. Species monitored include Great Egret (Ardea alba), Wood Stork (Mycteria americana), White Ibis (Eudocimus albus), Snowy Egret
SFWMD, James Beerens

Wading Bird Report 11
(Egretta thula), Roseate Spoonbill (Ajaia ajaja), Tri-colored Heron (Egretta tricolor), Little Blue Heron (Egretta caerulea), Cattle Egret (Bubulcus ibis), and Black-Crowned Night Heron (Nycticorax nycticorax). Other birds found nesting in colonies such as the Great White and Great Blue Heron (Ardea herodias), Anhinga (Anhinga anhinga), Brown Pelican (Pelecanus occidentalis) and Double-Crested Cormorant (Phalacrocorax auritus) are noted as well. Results We observed a 37% reduction in overall nesting effort between 2010 and 2011. Thirty wading bird colonies were located within ENP with a total pooled species nest estimate of 4,468 (Figure 1). The nest estimate for Wood Storks was 1,257, an increase of 26% over last season. Great Egret nest counts were nearly identical to the 2010 season with just a 1% increase in numbers. Snowy Egret nest counts were up considerably, an increase of 51% over last season. Noticeably absent this season in most ENP colonies was the lack of nesting White Ibis. Estimates for White Ibis were down by 94% compared to the 2010 season. Many colonies had just started to form when checked on 18 February and most colonies were active when surveyed on 17 March. On that date, about a quarter to a half of Wood Storks and most of the Great Egrets were sitting on nests as if incubating eggs. During the 15 April systematic survey, most stork nests contained small to medium-sized young. When checked again on 19 May, medium-sized young storks sitting in nests and many larger young standing up in the nests were spotted. Great and Snowy Egret nests were a little farther along with large young seen in most nests. Despite the dry conditions seen throughout Shark Slough and Taylor slough, most species appeared to successfully fledge young, however some nest failure did occur. More than half of the Wood Stork and Great Egret nests at Grossman Ridge West, Cabbage Bay, and Rodgers River failed. This appeared to occur sometime between the 15 April and 19 May surveys. Wood Storks at Paurotis Pond and Cuthbert Lake also had some nest abandonment between 19 May and 23 June, probably in response to the start of afternoon thunderstorms and increasing water levels in the southern reaches of the park. And finally, while flying one last time over Paurotis Pond on 15 July, the remaining large stork young that had not yet left the colony were found to be dead in nests. Lori Oberhofer & Oron L. (Sonny) Bass Everglades National Park South Florida Natural Resources Center 40001 State Road 9336 Homestead, FL 33034 Telephone: 305-242-7833 [email protected] [email protected]
EVERGLADES NATIONAL PARK, FRANK KEY (FLORIDA BAY) Colony Location: 25.10243, -80.90667 (NAD83)
The colony of Great Egrets, White Ibis, and Brown Pelicans on Frank Key did not form this season. Lori Oberhofer & Oron L. (Sonny) Bass Everglades National Park South Florida Natural Resources Center 40001 State Road 9336 Homestead, FL 33034 Telephone: 305-242-7833 [email protected] [email protected]
SFWMD, James Beerens

Wading Bird Report 12
Table 1. Peak numbers of wading bird nests found in Everglades National Park colonies through July 23, 2011.
Colony name
Latitude
NAD83
Longitude
NAD83 GREG WOST WHIB SNEG ROSP TRHE LBHE GBHE BCNH Total
Tamiami West 25.75784 -80.54484 200 400 + + 0 + + + + 600
Paurotis Pond 25.28150 -80.80300 200 500 + 100 + + + + 0 800
Rookery Branch 25.46356 -80.85256 170 25 100 300 10 + + + 0 605
Otter Creek 25.46781 -80.93772 150 0 + 400 + + + + 0 550
Broad River 25.50293 -80.97440 160 30 0 200 20 + + + 0 410
Cabbage Bay 25.62000 -81.05612 50 70 100 50 + + + + 0 270
Madeira (Lower Taylor 25.22697 -80.68428 100 0 20 130 + + + 0 0 250
Cuthbert Lake 25.20933 -80.77500 70 90 0 + 0 0 0 0 0 160
Rodgers River Bay 25.55975 -81.07026 70 80 0 0 0 0 0 0 0 150
Lostmans Creek 25.58723 -80.97204 50 0 0 75 20 0 0 0 0 145
Grossman Ridge West 25.63511 -80.65130 70 60 0 0 0 0 0 0 + 130
Alligator Bay 25.67099 -81.14714 40 0 0 75 0 0 0 0 0 115
2011_Col-006 25.54530 -80.78012 73 0 0 0 0 0 0 0 0 73
2011_Col-003 25.70752 -80.59087 50 0 0 0 0 0 0 0 0 50
2011_Col-009 25.52150 -80.80508 35 0 0 0 0 0 0 0 0 35
2011_Col-002 25.60620 -80.69381 30 0 0 0 0 0 0 0 + 30
2011_Col-001 25.60194 -80.76585 25 0 0 0 0 0 0 2 0 27
2011_Col-010 25.63617 -80.72717 25 0 0 0 0 0 0 0 0 25
2011_Col-012 25.51550 -80.82511 8 0 0 10 0 0 0 0 0 18
2011_Col-011 25.63083 -80.98917 5 0 0 0 0 0 0 0 0 5
2011_Col-013 25.51995 -80.84463 5 0 0 0 0 0 0 0 0 5
2011_Col-005 25.54751 -80.86879 4 0 0 0 0 0 0 0 0 4
2011_Col-007 25.53790 -80.75435 4 0 0 0 0 0 0 0 0 4
2011_Col-004 25.68805 -80.69501 3 0 0 0 0 0 0 0 0 3
2011_Col-008 25.51835 -80.77418 2 0 0 0 0 0 0 0 0 2
Colony-18, Lower Taylor 25.22697 -80.68428 0 2 0 0 0 0 0 0 0 2
East River Rookery 25.26860 -80.86785 0 0 0 0 0 0 0 0 0 0
Grossman Ridge Willowhead 25.62613 -80.64582 0 0 0 0 0 0 0 0 0 0
Tamiami East1 25.75762 -80.50801 0 0 0 0 0 0 0 0 0 0
Tamiami East2 25.75935 -80.52457 0 0 0 0 0 0 0 0 0 0
Total 1,599 1,257 220 1,340 50 + + 2 + 4,468
+ Indicates species present and nesting, but unable to determine numbers
SFWMD, Patrick Lynch

Wading Bird Report 13
Locations of wading bird nesting colonies in Everglades National Park, February – July, 2011

Wading Bird Report 14
2010 WOOD STORK NESTING IN SOUTHWEST FLORIDA Audubon of Florida gathered nesting data at five rookeries in 2011, Corkscrew Swamp Sanctuary (CSS), Lenore Island (LI), Caloosahatchee East (CE), Collier/Hendry Line (CHL) and Barron Collier 29 (BC29). While Wood Storks were the primary focus of the monitoring effort, we were able to gather data on other wading birds at some of the colonies. Methods Surveys were conducted in a fixed wing Cessna 172. Nesting effort was recorded by taking digital aerial photographs of the colonies for later analysis. We used a Canon 30D equipped with a 70-300mm zoom lens with an image stabilizer. An altitude of between 800’-1000’ was maintained during the survey. Images were examined to quantify the number of nest starts. In each survey set there were a varying number of image features that we were unable to identify. While some of these features may have been active nests, they were not included in the analysis. Therefore, the results of the analysis are conservative as only verifiable nests were counted. Due to a procedural change in the aircraft operations, we were not able to open the window in the Cessna this season, and image quality suffered as a result. Hydrology Wet-season rainfall and peak water levels attained near the colony site prior to the 2010-11 breeding season were very close to the average for the 51 year period of record for the CSS colony location. Rainfall was slightly higher than average over the course of the breeding season, and the onset of rainy season did not occur until the last week of June. According to totals recorded at the Corkscrew Swamp Sanctuary visitor center rain gauge, 42.56 inches of rain fell near the colony site from June through October of 2010. That is within a 1 ½ inches of the average (41.44”) for those 5 months. The largest single rainfall event recorded at the colony site over a 24 hour period occurred on June 18-19th dropping 4 inches. Water levels at the gauge beneath the colony reached a peak of 18.44’ NGVD on October 1st, which is slightly above the average (18.21’ NGVD). A very dry October caused a rapid decline in water levels, falling 10.08 inches by November 1st. Breeding season rainfall was above average, registering 18.94 inches from November 2010 through May 2011, (average is 17.17” for that period). Results Three aerial survey flights were conducted; January 24, March 16th and April 20th. Of the five colonies surveyed, three supported wading bird nesting activity in 2011 (LI, CE and BC29). Colony development was entirely absent during the January flight at all sites. By March, colonies were forming at LI, CE and BC29. Nests at the LI location were farther along in development by several weeks than the other two active locations suggesting LI was the first to initiate nesting. There were 42 Wood Stork nest starts visible in March, and 20 in April. Of the 33 chicks visible in the April photo set, only 7 chicks in five of the nests were
estimated to be at least seven weeks old. This suggests the number of fledged storks from LI could be as low as 7 birds. Given the late onset of the rainy season, more of the 33 total chicks present on April 20th may have fledged. Many other stork pairs were observed during the April and May flights to be loafing on or near empty nest platforms. In addition to the wood stork nests, another 66 wading bird nests were verified to be nesting at LI (Table 1). Given the image quality, these numbers are believed to be conservative. CE showed the largest aggregation of wading birds. Several hundred Wood Storks, Great Egrets, Great Blue Herons, and smaller white wading birds were observed loafing or standing on nest platforms with no eggs or chicks present. Eight Wood Stork nests were documented at CE. Three nests containing five chicks estimated to be at least 7 weeks old were observed during the April flight. Another five visibly younger chicks were observed during this flight suggesting that the number fledged may have been as high as 10 storks. In addition to the Wood Stork nests, another 16 wading bird nests were visible during the April flight. Ten of these were Great Egrets (Table 1). Numerous Great Egrets and smaller white wading birds were observed during the March and April flights at the Barron Collier 29 site; however, only 14 nests were confirmed, mostly Great Egrets, none were Wood Storks (Table 1). No wading bird activity was observed at the CHL colony in either the January or March flights. CHL was not checked in the April flight, but given it’s inactivity since 2006 it is presumed inactive for 2011. Wood storks did not nest at the Corkscrew Swamp colony during the 2011 season, and no other wading bird nests were visible during the aerial surveys. Herons, egrets, ibis and spoonbills often nest within the cypress canopy at Corkscrew and may go undetected, so while no evidence of wading bird nesting was observed, we cannot conclude nesting did not occur. Wood Storks have skipped the occasional nesting season at CSS throughout the period of record, however prior to 2008 this had never occurred in successive years. Storks have failed to nest in four out of the past five years. Large scale land use changes, punctuated by significant losses of early season foraging opportunity, appear to have narrowed the hydrologic tolerance for nesting at Corkscrew. Lately wood storks appear only to nest under ideal conditions. Current hydrologic conditions do not appear exceptional, as water levels are well below the seasonal average, suggesting a strong likelihood of another poor nesting season. Jason Lauritsen Corkscrew Swamp Sanctuary 375 Sanctuary Road West Naples, FL 34120 [email protected]
SFWMD, Pat Lynch

Wading Bird Report 15
Table 1. Maximum wading bird nest counts recorded in Southwest Florida, 2011.
Table 2. Wood stork nesting in Southwest Florida, 2011.
SOLID WASTE AUTHORITY OF PALM BEACH COUNTY ROOKERY
Methods Typically, Breeding Bird Censuses (BBCs) are conducted from February – July in the SWA Roost by two observers every 8-10 weeks, representing approximately 12 man-hours. During the BBC, all islands from three abandoned shell pits are systematically surveyed from a small boat, and the identified bird species and nest numbers are recorded. Surveys are conducted during the morning hours so as to minimize any burden caused by the presence of observers. The peak nest numbers are a compilation of early season boat counts and visual counts from the observation towers.
Location & Study Area The SWA roost is located on spoil islands in abandoned shell pits that were mined in the early 1960’s in Palm Beach County, Florida (Lat. 26o46’42.22”N: Long. 80o08’31.15”W NAD83). The spoil islands consist of overburden material and range from 5 to 367 m in length, with an average width of 5 m. Islands are separated by 5-6.5 m with vegetation touching among close islands. The borrow pits are flooded with fresh water to a depth of 3 m. Dominant vegetation is Brazilian pepper (Schinus terebinthifolius), Australian pine (Casurina spp.), and Melaleuca (Melaleuca quinquenervia), all non-native species. Local features influencing the roost include: 1) the North County Resource Recovery Facility and landfill and 2) the City of West Palm Beach’s Grassy Waters (=Water Catchment Area), a 44 km2 remnant of the Loxahatchee Slough.
Results This report presents a partial data set for the 2011 breeding season. Because of drought conditions and engine malfunctions, only one survey was conducted this year in March. Typically, nesting activities have been observed at this colony February through September. Wood Stork monitoring and productivity was conducted by Rena Borkhataria and the results of that study
can be found in a separate section of this report. Wood Storks peaked at 386 nests in April.
The estimated total number of wading bird nests for the SWA Colony is 720. There were nests of the following bird species: Great Egrets, Cattle Egrets, Wood Storks, White Ibis, Tricolor Herons, and Anhinga. Even though Little Blue Herons were not observed nesting in March, there were quite a few fledglings observed throughout the season during the dawn counts of this colony.
Mary Beth (Mihalik) Morrison, David Broten & Michael Tyson Solid Waste Authority of Palm Beach County 7501 North Jog Road West Palm Beach, FL 33412 (561) 640-4000 ext. 4613 [email protected]
Colony Latitude Longitude WOST GREG GBHE LBHE ANHI BRPE
LG
WHT
SML
WT
SML
DRK CAEG Total
Corkscrew 26 22.502 -81 36.985 0 0 0 0 0 0 0 0 0 0 0
Lenore Isl (Caloosahatchee West) 26 41.332 -81 49.809 42 10 12 0 0 14 0 19 11 0 108
Caloosahatchee East 26 41.795 -81 47.697 8 10 2 0 0 0 0 4 0 0 24
Collier/Hendry Line 26 22.223 -81 16.363 0 0 0 0 0 0 0 0 0 0 0
Barron Collier 29 26 16.383 -81 20.633 0 12 0 0 0 0 0 2 0 0 14
Totals 50 32 14 0 0 14 0 25 11 0 146
Colony Latitude Longitude Total
neststarts successful fledged
Corkscrew 26 22.502 -81 36.985 0 0 0 0
Lenore Isl
(Caloosahatchee West) 26 41.332 -81 49.809 42 5 7 42
Caloosahatchee East 26 41.795 -81 47.697 8 3 5 8
Collier/Hendry Line 26 22.223 -81 16.363 0 0 0 0
Barron Collier 29 26 16.383 -81 20.633 0 0 0 0
Totals 50 8 12 50
WOST
Table 1. Peak number of wading bird nests in SWA Rookery from February to July 2011.
SFWMD, Patrick Lynch

Wading Bird Report 16
ROSEATE SPOONBILL NESTING IN FLORIDA BAY ANNUAL REPORT 2010-2011
Methods Between Oct 2010 and May 2011 nest surveys were conducted, within the five regions of Florida Bay (Figure 1 as per Lorenz et al. 2002), at all forty of the Keys that have been used by Roseate Spoonbills as nesting colonies. Nest success was estimated through mark and revisit surveys at the most active (focal) colony or colonies within each region. A colony was considered successful if it averaged at least one chick to 21 days (the age at which chicks begin branching and can no longer be assigned to a nest) per nesting attempt (chicks per nest or c/n). We present our results in the context of spoonbill nesting in Florida Bay since 1984, the year that the South Dade Conveyance System (SDCS), which has direct water management implications on Florida Bay, was completed (Lorenz 2000, Lorenz et al. 2002). Resights of banded chicks, prior to abandoning their natal colonies, are also included to compare with our productivity estimates. Spoonbill Monitoring Results Northwest Region: Sandy Key Three of the five colonies in the Northwest region were active producing a total of 48 nests, well below the mean of 215 nests in the last 26 years (Table 1). There were only 38 nests on Sandy Key, the focal colony for the region, which is well below the mean of 149 nests since 1984-85 (Table 1). Of the 10 nests monitored, 65% were successful, producing a mean of 0.90 c/n (Table 2). No chicks were banded at Sandy Key this season (Table 3). Total production for Sandy Key was estimated at 34 young (Table 4). Northeast Region: Duck Key Only one of the nine colonies in the Northeast region was active producing only three nests, well below the mean of 168 nests since 1984-85 and the lowest nest count for the region during that period (Table 1). The Duck Key colony was successful, producing an average of 2.00 c/n (Table 2). All three nest attempts were successful. Total production for the colony was estimated at eight young (Table 4). Southeast Region: Stake and Bottle Keys Only 13 nests were initiated in three of the 12 colonies in the Southeast region, well below the mean of 72 nests since 1984-85 (Table 1). Eleven of the 13 nests were located on Stake and Bottle Keys. The Stake Key colony was not successful, producing an average of only 0.33 c/n. Two chicks were banded at Stake Key this season, one of which was observed as a fledgling (Table 3). The Bottle Key colony was successful, producing an average of 1.20 c/n. Three chicks were banded at Bottle Key this season, one of which was observed as a fledgling (Table 3). Central Region: Calusa Key There were only three nests initiated at one colony in the Central region this season, extremely low when compared to a mean of 50 nests since 1984-85 (Table 1). Calusa Key was successful, producing an average of 1.00 c/n (Table 2). Two nestlings were
banded in the Central region, one of which was observed as a fledgling (Table 4). A small second nesting event (n=2) occurred at Calusa Key in late March. Both nests were successful and together produced four young. Southwest Region: Twin Key All four colonies in the Southwest region were surveyed in 2010-11 but only one, Twin Key, was active (Table 1). Two nests were initiated on Twin Key but the fate of the nests is unknown. Bay-wide Synthesis Overall, this was an extremely disappointing year for spoonbills nesting in Florida Bay, with fewer nests than we have seen since the early 1950’s. An unusually large number of spoonbills nested to the north of the Bay this season, mainly in Water Conservation Area 3, which may explain the low nesting effort. The reason for this potential shift in nesting range is unknown. Our prey fish sampling indicated that prey were abundant and available to the point of setting records at some sites. This was especially true on the foraging grounds for the Northeastern Region. This may explain the high success rate at Duck Key but adds to the confusion as to why there was a record number of spoonbill nesting in WCA3 and so few in Florida Bay. Shortly after the nesting season, approximately 300 to 400 spoonbills were observed roosting on the islands in Snake Bight near the end of the Snake Bight Trail. Eighteen more nests were found on the largest of these islands (these are not reported in Table 1). Out of the 400, only ten adults in breeding plumage were seen and we also identified 10 birds that were obviously young of the year. All others were in various stages of sub-adult or non-breeding plumage. It is quite possible that this colony was much larger than 18 nests and some of the sub-adults might have been older young of the year. It is also possible that these are birds that were hatched in the four consecutive successful nesting years from 2005-06 to 2008-09. If so, these birds should be reaching the age of sexual maturity and may begin to nest in Florida Bay next year. This site will be monitored in the 2011-2012 season.
SFWMD, Gaea Crozier

Wading Bird Report 17
Table 1. Number of Roseate Spoonbill nests in Florida Bay November 2010 through March 2011. An asterisk indicates a colony where nesting success surveys were conducted. Second nesting attempts are not included.
Jerome J. Lorenz Karen Dyer Audubon of Florida’s Tavernier Science Center 115 Indian Mound Trail Tavernier, FL 33070 305-852-5092 [email protected]
Region Colony 2010-11 Min Mean Max
Northwest Clive 7 6 22.44 52
Frank 0 0 47.53 125
Oyster 0 0 5.47 45
Palm 3 9 38.43 87
Sandy* 38 62 148.80 250
Subtotal 48 65 214.63 325
Northeast Deer 0 2 5.80 15
Duck* 3 0 10.95 100
Little Betsy 0 0 8.33 21
North Nest 0 0 0.67 8
North Park 0 0 16.20 50
Pass 0 0 0.83 7
Porjoe 0 0 26.09 118
South Nest 0 0 18.78 59
Tern 0 0 96.20 184
Subtotal 3 41 167.63 333
Southeast Bottle* 5 0 10.47 40
Cotton 0 0 0.00 0
Cowpens 0 0 5.22 15
Crab 0 0 1.88 8
Crane 0 0 11.39 27
East 0 0 2.95 13
East Butternut 0 0 5.35 27
Low 0 0 0.00 0
Middle Butternut 2 1 18.85 66
Pigeon 0 0 9.61 56
Stake* 6 0 5.50 19
West 0 0 2.75 9
Subtotal 13 5 71.61 117
Central Calusa* 3 0 11.00 21
Captain 0 0 3.25 9
East Bob Allen 0 0 12.50 35
First Mate* 0 1 5.00 15
Jimmie Channel 0 0 18.35 47
Little Jimmie 0 0 3.00 12
Manatee 0 0 0.17 3
North Jimmie 0 1 1.50 2
Pollock 0 0 2.00 13
South Park 0 0 10.15 39
Subtotal 3 9 50.11 96
Southwest Barnes 0 0 0.24 3
East Buchanan 0 0 5.44 27
Twin 2 0 1.71 8
West Buchanan 0 0 3.00 9
Subtotal 2 0 9.18 35
Florida Bay Total 69 233 513.83 880
Summary since 1984-85
Table 2. Mean number of chicks to 21 days per nesting attempt and the percentage of nests that were successful. Success is defined as a mean of at least one chick to 21 days per nesting attempt. Summary figures refer to the focal colony or colonies surveyed in each year. Numbers in parentheses indicate how many years each region has been surveyed since 1984-85. Second nesting attempts are not included.
SFWMD, Patrick Lynch

Wading Bird Report 18
Figure 1. Map of Florida Bay indicating spoonbill colony locations (red circles) and nesting regions (blue circles). Arrows indicate the primary foraging area for each region. The dashed lines from the central region are speculative.
Table 4. Estimated dates of nesting events for focal colonies surveyed in the 2010-11 nesting season. All dates refer to the first egg laid in each clutch or the first egg to hatch in each clutch. The estimated number of chicks fledged from each focal colony is also presented.
Lower
Matecumbe Key
NW
NE
SE
SW
Region Colony
Earliest
Nest
Latest
Nest
Mean
Lay
Mean
Hatch
Est. # of
chicks fledged
Northwest Sandy 17-Nov-10 23-Nov-10 21-Nov-10 14-Dec-10 34
Northeast Duck 8
Southeast Stake 12-Dec-10 26-Dec-10 19-Dec-10 11-Jan-11 2
Bottle 7-Jan-11 20-Jan-11 14-Jan-11 6-Feb-11 6
Region-
Total 12-Dec-10 20-Jan-11 31-Dec-10 23-Jan-11 8
Central Calusa 15-Nov-10 19-Nov-11 16-Nov-10 9-Dec-10 3
Nest Initiation Dates
Table 3. Roseate Spoonbill chicks banded in Florida Bay between December 2010 and May 2011.
Region Colony
# nests
banded
# chicks
banded
# resighted
as fledglings
% resighted
as fledglings
# found
dead
% found
dead
# unknown
fate
% unknown
fate
Southeast Bottle 2 3 1 33% 0 0% 2 67%
Central Calusa 1 2 1 50% 1 50% 0 0%
Florida Bay Total 3 5 2 40% 1 20% 2 40%

Wading Bird Report 19
WADER NESTING COASTAL SOUTH SOUTHWEST FLORIDA 2011
The wader nesting season started early with fair numbers of Great Egrets moving into the ABC Colony at Marco Island at the beginning of February. By April numbers had increased considerably but most of them eventually left without fledging any young. The small waders started late and in low numbers this year with very few birds nesting at ABC colony and less at Smoke House (Caxambas Pass). Neither Rookery Bay nor East River had any nesting activity this year. At Rookery Bay a few Great Egrets initiated nesting but they left and the night roosting moved to another nearby island; it is possible that the constant disturbance by large groups of kayak tours (12-21, observed most days going past the island) did not help. In all it was a very poor wader nesting season; for the 29 years of nesting information recorded in the area, numbers of nests were down 67% on average for all wader species. Hydrology This year rainfall was down 50% (Jan-July); the coastal wetlands at Rookery Bay were almost completely dry in June but seasonal spring high-tides prevented total dry down. Subsequently, the rains arrived and water levels returned to normal. There were few wading birds using the coastal ponds this year.
Location and Methods
Rookery Bay: 26 01.721’N 81 44.573’W. Nesting occurred on a single red mangrove island, 0.14 ha. Nest censuses were conducted on 4/16, 5/20, 6/17 by boat with 2 observers for 0.5 hour. Marco Colony (ABC) (named, ABC Islands by State of Florida):
25 57.389’N 81 42.232’W. Comprises three red mangrove islands, 2.08 ha. Nest censuses were conducted on 4/13, 5/27, 6/27 by one observer, by boat for 1.5 hours. Smokehouse Key: 25°54.562’N-81°43.885’W. One island in Caxambas Pass, 0.86 ha (red mangrove; a little terrestrial vegetation on sand ridge in center). Censuses were conducted on 4/22, 5/14, 6/12 by boat for one hour by one observer.
East River: 25 55.886’N 81 26.667’W. Nesting occurred on three red mangrove islands, ~0.25 ha. A nest census was conducted on 6/13 by canoe, complete coverage, by three observers for two hours.
Chokoloskee Bay: 25 50.834’N 81 24.71 0.’W. Nesting occurred on four red Mangrove islands, ~0.2 ha. Censuses were conducted by boat on 3/30, 4/28, 5/29 by two people for one hour. Note: Table 1 represents the peak numbers of nests from the above censuses.
Sundown Censusing For two of the colonies above, birds coming in to roost for the night are censused at sundown. The goal is to get an index of the numbers of each species in the area, year round. References below as to the use of the area by the different species are derived from these projects.
Marco Colony (ABCSD): Censused monthly with two boats and various numbers of volunteers (4-8). Boats are anchored in the two major flyways (North and East). The numbers of birds of each species flying in (and out during the nesting season) are recorded one hour before sunset to one half hour after sunset. This project is ongoing and started in 1979.
Rookery Bay (RBSD): Censused every two weeks with one boat and two observers (one a volunteer). The boat is anchored so that most of the birds can be observed flying in one hour before sunset to one half hour after sunset. The number and species of birds flying in (and out during the nesting season) are recorded. This project is ongoing and started in 1977.
Species Accounts The introduction just about says it all; I do not see any necessity in discussing each individual species as most had a terrible year. Reddish Egret: Did better than last year with a few more nests (8) than usual which all fledged young.
White Ibis: Although no ibis attempted to nest on the coast again this year, those that left the coast to nest inland (as usual) did not have a very productive year. This was evident from by the ABC sundown data for adult and juvenile white ibis in July. The proportion of fledgling birds to adult birds at the island in July (when fledglings start to show up) is typically about 13% (based on an average of 22 years); this year it was only 4%.
Oh Well! Another different and interesting year.
Theodore H. Below Avian Ecologist 3697 North Rd. Naples, FL 34104 [email protected]
Table 1. Peak Wader Nests Counts in Coastal Southwest Florida 2011.
SFWMD, James Beerens

Wading Bird Report 20
WADING BIRD NESTING AT LAKE OKEECHOBEE Introduction The first aerial survey of Lake Okeechobee wading bird colonies was completed in 1957 (David 1994, Smith and Collopy 1995, Zaffke 1984). Thereafter surveys were conducted sporadically through 1976 and were usually done once during the breeding season which may have underestimated peak nest effort. From 1977- 1992 more systematic monthly surveys throughout the breeding season were conducted by the South Florida Water Management District to assess the effects of water management on wading bird populations (David 1994, Smith and Collopy 1995). In 2005, Florida Atlantic University continued the wading bird nesting surveys to determine location and size of colonies as part of the CERP Monitoring and Assessment Plan. We reported the highest nesting effort on record in 2006 with 11,310 nests, and the lowest nesting effort on record in 2008, with 38 nests. Herein we report our findings for 2011. Methods During the dry season of 2011, Florida Atlantic University conducted wading bird nesting surveys to determine timing and location of breeding populations as a part of the CERP Monitoring and Assessment Plan. Once a month from February through June, two observers, one on each side of a single engine Cessna 182, surveyed wading bird nests along aerial transects at an altitude of 244 m (800 ft) at a speed of 185 km/h (100 knots). One transect was flown from Eagle Bay Island and followed the eastern rim of the Lake to Ritta Island. The remainder of transects were East- West and spaced at a distance of 3 km (1.6 nautical miles). When one or more white wading birds were detected, the airplane lowered to an elevation of 122 m (400 ft) and circled the location to verify if birds were nesting. If the birds represented a colony, defined as any assemblage of at least two nests that were separated by greater than 200 m (Erwin et al 1981, Smith and Collopy 1995), nests were counted and species composition recorded. Photographs were taken for later analysis and geographic location was noted. The colonies accessible by airboat were visited to improve count accuracy. The January flight was delayed so the January count was based on airboat reconnaissance and a flight on 4 February. The February flight was conducted on 27 February.
Rainfall and hydrology data were obtained from the South Florida Water Management District’s DBHYDRO database. The lake stage was calculated as themean of four principle gages in the pelagic zone of Lake Okeechobee (L001, L005, L006, and LZ40). All elevation data are presented in National Geodetic Vertical Datum 1929 (NGVD 1929) and locations are in North American Datum 1983 (NAD 1983). Historical stage data are from 1977 to the present, which corresponds to the time period of systematic aerial surveys. Hydrology Water levels in the 2011 dry season were extremely low (Fig. 1). During a normal dry season, lake levels start high (average 4.42 m; 14.5 ft) in January with a recession lowering lake levels during the following months until the start of the next wet season. In 2011, lake levels began low at approximately 3.8 meters (12.5 ft) in January and combined with below normal rainfall proceeded to drydown particularly fast in April once ET began. In late March storms occurred throughout the system and caused a slight increase in water levels, peaking at approximately 3.54 m (11.6 ft) on 30 March. Thereafter water levels receded in typical fashion reaching the lowest point on 24 June at 2.89 m (9.5 ft) and producing lower than average water levels throughout the dry season.
Results and Discussion Locations and Size Twelve colonies were detected (Fig. 2); nine on-lake and three off-lake, with an estimated total of 5,636 nests. This number was derived by summing the peak nesting month for each species except for Anhingas (ANHI) and Cattle Egrets (CAEG; Table 1). A new off-lake CAEG colony was detected in Buckhead Ridge during the June survey. For historical comparisons, the cumulative total for Great Egrets (GREG), Great Blue Herons (GBHE), White Ibises (WHIB), and Snowy Egrets (SNEG) was 4,167 nests, making 2011 the sixth largest nesting year of the 23 years monitored since 1977 and the eighth largest of the 31 years monitored since 1957 (Fig. 3). Bird Island is a historical nesting site but has not been used since 2007 (Smith and Collopy 1995, Marx and Gawlik 2007). All other colony locations were at established sites, and were detected last year, except for Ritta Island New. However, this colony was small, having only 4 GBHE nests.
UPCOMING MEETINGS
American Ornithologists' Union, 130th Stated Meeting. 14-18, August 2012. Vancouver, British Columbia, Canada.
http://www.aou.org/meetings
Cooper Ornithological Society Annual Meeting. 14-18, August 2012. Vancouver, British Columbia, Canada.
http:// http://www.naoc-v2012.com/
The Wildlife Society Annual Conference. 2-6, October. 2012. Snowbird, Utah.
http://joomla.wildlife.org/
FAU, Jennifer Chastant

Wading Bird Report 21
The majority of nests (80% excluding ANHI and CAEG), were detected at the Eagle Bay East colony. This multi-species colony was comprised of willow and bulrush surrounded by water, which is the typical structure favored by wading birds for nesting on the Lake (David 1994).The next two largest colonies, Bird Island and Clewiston Channel - both under 300 nests, were covered in Phragmites, primarily inhabited by SNEG and GREG and comprised a mere 8% of the total nesting effort. During routine airboat reconnaissance, both Moonshine Bay 3 and Ritta Island New were found with <5 nesting GBHE but were inaccessible after February due to dry conditions, and were never detected during aerial surveys. The five remaining colonies were all under 100 nests (excluding ANHI and CAEG) and were primarily SNEG, GREG and TRHE.
Timing and Success With the lake stage around 3.7 m (12.4 ft) during the first two months of the dry season, most of the traditional marsh colony locations were surrounded by little or no water, making them unattractive to wading birds. High lake stages inundate the marsh and allow small fish and macroinvertibrates to disperse and proliferate throughout the littoral zone. Wading birds prefer nesting habitat surrounded by water not only to reduce the risk of predators but to ensure there will be suitable foraging habitat throughout the nesting season. Airboat surveys during January detected only GBHE nests (Table 2). In late February, GREG began their nesting displays at Clewiston Spit and the Rock Islands. Both Clewiston Spit and the Rock Islands are spoil islands with minimal vegetation surrounded by water. Bird Island, a natural island located in Fish Eating Bay, was first detected during the late February aerial survey with 13 SNEG roosting in the Phragmites. In March there was a marked increase in nest effort with the initiation of Eagle Bay East, estimated at 1250 nests of primarily SNEG and WHIB. Additional ground visits confirmed the initiation of nesting by all focal species except GREG in Eagle Bay East. The Clewiston Channel colony, also a spoil island, was first detected in March as well. Storms with high winds and heavy rain in late March knocked down all the GREG nests on the Rock Islands and the majority of the GREG nests on Clewiston Spit, leaving only 12 nests in a lone Australian pine. By early April, all the colonies around Clewiston, Fish Eating Bay, and Eagle Bay contained active nests. CAEG began invading the Lakeport Marina colony in April and the Gator Farm and Eagle Bay East colonies in May. A new CAEG colony was detected in Buckhead Ridge during the June survey. Despite low lake levels and minimal rain with an extended recession, the majority of nests monitored on our colony transects fledged at least one chick by the end of May. Given how little of the littoral zone was available during such dry conditions, there may have been a considerable amount of foraging off lake. On lake foraging was limited to the periphery of the littoral zone along the receding edge of the water. By late May and June, the birds were feeding in the open pelagic zone. Wood Storks and Roseate Spoonbills Since 2007, a small colony of Wood Storks (WOST) has developed at an alligator farm about 4 km N of Harney Pond along Highway 21. Although WOST were seen roosting at the site on 24 March, they did not initiate nesting. A flock of
roughly 100 mostly sub-adult ROSP was seen foraging from Cochran’s Pass to Eagle Bay throughout the dry season. In late May a group of 30 ROSP roosted in the Eagle Bay Trail colony. A subsequent ground visit showed no evidence of nesting. Nesting in 2011 compared to other years In January, we anticipated meager amounts of nesting on the lake for 2011. This year had similar water levels with three of the five worst nesting years on record (1971, 1981 and 2007; Fig. 4), yet this year’s nest effort fell within the top ten on record (Fig. 3). Similar hydrology was also seen in 1990, but produced only half the nest effort of this year. We are currently developing predictive models that link nesting and hydrology on the lake but at this point we can only speculate as to why this year's nesting was higher than expected. Perhaps the long uninterrupted water level recession played a key role in augmenting nest effort. As many of the surrounding wetlands dried up, the lake remained as a last resort; providing at least sub-optimal foraging when no other foraging habitat was available. Another possibility is that the vegetation and aquatic fauna are adjusting to lower lake levels, and adapting to what seems to have become the new normal. Developing predictive models requires information on the mechanisms and pathways by which hydrology acts to influence wading bird nesting patterns. This year we began intensive throw-trapping throughout the littoral zone to advance our understanding of the relationship between lake hydrology and wading bird prey (i.e. small fish and macroinvertebrates) communities. Wading bird chick physiology is another tool we are using to explore the connection between habitat conditions (hydrology and prey availability) and reproductive output. Understanding the link between landscape level prey availability and wading bird resource use, physiological condition in response to prey availability, and chick growth and survival as result of adult responses to the habitat conditions, will significantly increase the certainty of how wading birds will respond to changes in hydrology. Acknowledgments Funding for this research was provided by the U.S. Army Engineer Research and Development Center. We appreciate the support from our technician Bridie Farmer for her help with field work and Bryan Botson, Tyler Beck, Rich Botta, and Michelle Petersen for their input and ideas. We also benefited from discussions with Don Fox, Paul Gray, Bruce Sharfstein, Rachael Pierce, Chuck Hanlon, Garth Herring, and Mark Cook. Jennifer E Chastant Dale E Gawlik Department of Biological Sciences Florida Atlantic University 777 Glades Road Boca Raton, FL 33431-0991 561-297-3333 [email protected] [email protected]

Wading Bird Report 22
Table 1. Geographic coordinates (NAD 83) and species-specific peak nest efforts in detected colonies during the 2011 breeding season at Lake Okeechobee.
Table 2. Timing and nest effort for species breeding in wading bird colonies during 2011 at Lake Okeechobee. Italics denote peak nest effort for species included in grand total.
Figure 1. Comparisons of 2011 lake stage (meters) and daily precipitation totals (cm) with the mean daily lake stage average from 1977 to the present.

Wading Bird Report 23
Figure 2. Map of wading bird colonies observed at Lake Okeechobee from January to June 2011.
FAU, Jennifer Chastant

Wading Bird Report 24
Figure 3. Complete historic record of wading bird nesting on Lake Okeechobee (four species include GBHE, GREG, SNEG, WHIB).
Figure 4. Comparisons of years with hydrographs similar to 2011 and their respective nest efforts with the mean daily lake stage average from 1977 to the present.
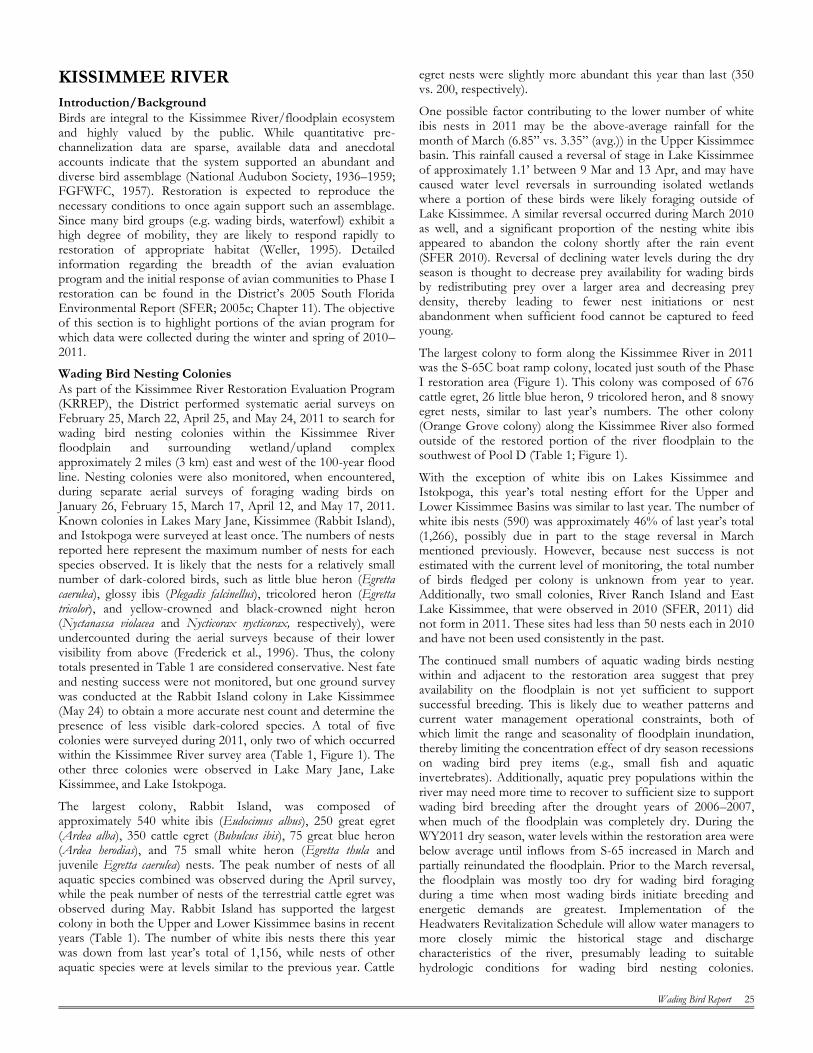
Wading Bird Report 25
KISSIMMEE RIVER
Introduction/Background
Birds are integral to the Kissimmee River/floodplain ecosystem and highly valued by the public. While quantitative pre-channelization data are sparse, available data and anecdotal accounts indicate that the system supported an abundant and diverse bird assemblage (National Audubon Society, 1936–1959; FGFWFC, 1957). Restoration is expected to reproduce the necessary conditions to once again support such an assemblage. Since many bird groups (e.g. wading birds, waterfowl) exhibit a high degree of mobility, they are likely to respond rapidly to restoration of appropriate habitat (Weller, 1995). Detailed information regarding the breadth of the avian evaluation program and the initial response of avian communities to Phase I restoration can be found in the District’s 2005 South Florida Environmental Report (SFER; 2005c; Chapter 11). The objective of this section is to highlight portions of the avian program for which data were collected during the winter and spring of 2010–2011.
Wading Bird Nesting Colonies
As part of the Kissimmee River Restoration Evaluation Program (KRREP), the District performed systematic aerial surveys on February 25, March 22, April 25, and May 24, 2011 to search for wading bird nesting colonies within the Kissimmee River floodplain and surrounding wetland/upland complex approximately 2 miles (3 km) east and west of the 100-year flood line. Nesting colonies were also monitored, when encountered, during separate aerial surveys of foraging wading birds on January 26, February 15, March 17, April 12, and May 17, 2011. Known colonies in Lakes Mary Jane, Kissimmee (Rabbit Island), and Istokpoga were surveyed at least once. The numbers of nests reported here represent the maximum number of nests for each species observed. It is likely that the nests for a relatively small number of dark-colored birds, such as little blue heron (Egretta caerulea), glossy ibis (Plegadis falcinellus), tricolored heron (Egretta tricolor), and yellow-crowned and black-crowned night heron (Nyctanassa violacea and Nycticorax nycticorax, respectively), were undercounted during the aerial surveys because of their lower visibility from above (Frederick et al., 1996). Thus, the colony totals presented in Table 1 are considered conservative. Nest fate and nesting success were not monitored, but one ground survey was conducted at the Rabbit Island colony in Lake Kissimmee (May 24) to obtain a more accurate nest count and determine the presence of less visible dark-colored species. A total of five colonies were surveyed during 2011, only two of which occurred within the Kissimmee River survey area (Table 1, Figure 1). The other three colonies were observed in Lake Mary Jane, Lake Kissimmee, and Lake Istokpoga.
The largest colony, Rabbit Island, was composed of approximately 540 white ibis (Eudocimus albus), 250 great egret (Ardea alba), 350 cattle egret (Bubulcus ibis), 75 great blue heron (Ardea herodias), and 75 small white heron (Egretta thula and juvenile Egretta caerulea) nests. The peak number of nests of all aquatic species combined was observed during the April survey, while the peak number of nests of the terrestrial cattle egret was observed during May. Rabbit Island has supported the largest colony in both the Upper and Lower Kissimmee basins in recent years (Table 1). The number of white ibis nests there this year was down from last year’s total of 1,156, while nests of other aquatic species were at levels similar to the previous year. Cattle
egret nests were slightly more abundant this year than last (350 vs. 200, respectively).
One possible factor contributing to the lower number of white ibis nests in 2011 may be the above-average rainfall for the month of March (6.85” vs. 3.35” (avg.)) in the Upper Kissimmee basin. This rainfall caused a reversal of stage in Lake Kissimmee of approximately 1.1’ between 9 Mar and 13 Apr, and may have caused water level reversals in surrounding isolated wetlands where a portion of these birds were likely foraging outside of Lake Kissimmee. A similar reversal occurred during March 2010 as well, and a significant proportion of the nesting white ibis appeared to abandon the colony shortly after the rain event (SFER 2010). Reversal of declining water levels during the dry season is thought to decrease prey availability for wading birds by redistributing prey over a larger area and decreasing prey density, thereby leading to fewer nest initiations or nest abandonment when sufficient food cannot be captured to feed young.
The largest colony to form along the Kissimmee River in 2011 was the S-65C boat ramp colony, located just south of the Phase I restoration area (Figure 1). This colony was composed of 676 cattle egret, 26 little blue heron, 9 tricolored heron, and 8 snowy egret nests, similar to last year’s numbers. The other colony (Orange Grove colony) along the Kissimmee River also formed outside of the restored portion of the river floodplain to the southwest of Pool D (Table 1; Figure 1).
With the exception of white ibis on Lakes Kissimmee and Istokpoga, this year’s total nesting effort for the Upper and Lower Kissimmee Basins was similar to last year. The number of white ibis nests (590) was approximately 46% of last year’s total (1,266), possibly due in part to the stage reversal in March mentioned previously. However, because nest success is not estimated with the current level of monitoring, the total number of birds fledged per colony is unknown from year to year. Additionally, two small colonies, River Ranch Island and East Lake Kissimmee, that were observed in 2010 (SFER, 2011) did not form in 2011. These sites had less than 50 nests each in 2010 and have not been used consistently in the past.
The continued small numbers of aquatic wading birds nesting within and adjacent to the restoration area suggest that prey availability on the floodplain is not yet sufficient to support successful breeding. This is likely due to weather patterns and current water management operational constraints, both of which limit the range and seasonality of floodplain inundation, thereby limiting the concentration effect of dry season recessions on wading bird prey items (e.g., small fish and aquatic invertebrates). Additionally, aquatic prey populations within the river may need more time to recover to sufficient size to support wading bird breeding after the drought years of 2006–2007, when much of the floodplain was completely dry. During the WY2011 dry season, water levels within the restoration area were below average until inflows from S-65 increased in March and partially reinundated the floodplain. Prior to the March reversal, the floodplain was mostly too dry for wading bird foraging during a time when most wading birds initiate breeding and energetic demands are greatest. Implementation of the Headwaters Revitalization Schedule will allow water managers to more closely mimic the historical stage and discharge characteristics of the river, presumably leading to suitable hydrologic conditions for wading bird nesting colonies.

Wading Bird Report 26
Table. 2. Post-restoration abundance (three-year running averages (± SE)) of long-legged wading birds excluding cattle egrets (Bubulcus ibis) during the dry season (December–May) within the Phase I, IVA, and IVB restoration areas of the Kissimmee River. The restoration expectation for wading bird abundance is 30.6 birds/km² (three-year running average).
Period3-year running
average (±SE)Period
3-year running
average (±SE)Period
3-year running
average (±SE)
2002-2005 53.6 (7.6) 2007-2009 21.4 (7.0) 2008-2010 33.9 (8.6)
2004-2006 74.9 (13.7) 2006-2008 49.3 (27.4) 2009-2011 29.0 (9.8)
2005-2007 58.4 (26.4)
Table 1. Peak numbers of wading bird nests inside or within 2 miles of the Kissimmee River 100-year flood line (between the S-65 and S-65D structures) and within Lakes Mary Jane, Kissimmee, and Istokpoga. Surveys were conducted March–June 2004 and 2005, February–June 2006, May–July 2007, January–May 2008, February–April 2009, February–May 2010, and Feb-May 2011.

Wading Bird Report 27
Figure 1. Aerial survey transect routes and nesting colony sites within the Kissimmee River floodplain and surrounding wetland/upland complex during 2011. The Lake Mary Jane colony (not shown) is approximately 30 miles to the north-northeast of Lake Kissimmee and 16 miles southeast of Orlando.

Wading Bird Report 28
Kissimmee River Foraging Abundance Monthly aerial surveys were used to estimate the abundance of foraging wading birds. Prior to the restoration project, dry season abundance of long-legged wading birds in the Phase I restoration area averaged [± standard error (S.E.)] 3.6 (± 0.9) birds/km² in 1997 and 14.3 (± 3.4) birds/km² in 1998. Since post-restoration monitoring began in 2001, abundance has exceeded the restoration expectation of 30.6 birds/km² (evaluated as a three-year running average), except during 2007-2009 and 2009-2011(Table 2, Figure 2). Mean monthly wading bird abundance (19.9 birds/km²) within the restored portions of the river during the 2010-2011 season was below the long term (9-year) average (≈44.0 birds/km²), and less than half of last year’s mean of 48.5 birds/km². Numbers were below the long-term monthly averages at the start of the dry season in November and continued well below average until February, when abundance peaked for the season at 38.6 birds/km². March is traditionally the month when most birds are observed, but numbers decreased significantly after February and reached the lowest monthly abundance ever recorded post-restoration during April at 6.4 birds/km². The dry season 2010-2011 began early and floodplain foraging habitat was already beginning to dry out by November, thereby limiting foraging opportunities for wading birds by December. The large stage reversal on the river in March/April caused much of the floodplain to be unseasonally reinundated after having nearly dried out completely. While the reversal created new foraging areas in some cases, many areas became too deep, and the remaining prey base was dispersed across a much larger area, thereby reducing foraging efficiency.
White ibis and glossy ibis dominated numerically, followed in order of abundance by great blue herons, cattle egrets, great egrets, small white herons [snowy egrets (Egretta thula) and juvenile little blue herons], small dark herons (tricolored herons and adult little blue herons), black-crowned night-herons (Nycticorax nycticorax), roseate spoonbills (Platalea ajaja), yellow-crowned night herons (Nyctanassa violacea), and wood storks (Mycteria americana).
Michael D. Cheek Kissimmee Division South Florida Water Management District 3301 Gun Club Road West Palm Beach, FL 33406 561.682.6616 [email protected]
Figure 2. Baseline and post-Phases I, IVA, and IVB mean abundance (± S.E.) of long-legged wading birds [excluding cattle egrets (Bubulcus ibis)] during the dry season (December–May) within the 100-year flood line of the Kissimmee River.
SFWMD, Patrick Lynch

Wading Bird Report 29
ESTERO BAY AQUATIC PRESERVE COLONIAL WADING BIRD NEST MONITORING AND PROTECTION PROGRAM
Introduction The Florida Department of Environmental Protections’ Estero Bay Aquatic Preserve (EBAP) was designated Florida’s first aquatic preserve in 1966. EBAP consists of 11,000 acres of sovereign submerged lands and is located in southwest Florida, extending from Fort Myers Beach to Bonita Springs. The shallow estuary is designated as an Outstanding Florida Waterbody and is fed by five fresh water tributaries and four passes connecting to the Gulf of Mexico. Estero Bay contains mangrove islands that are used as breeding colonies by a variety of bird species. EBAP started monitoring colonial nesting birds in 1977. A variety of survey methods have been employed over the history of the program. Brown Pelicans were monitored in the month of May between 1977 and 1982. May surveys from 1983 through 1989 included all wading and diving birds. Survey schedules were changed in 1998, with surveys conducted in April of that year and again in 2001 and 2007. Monthly nest counts of all active and historically active islands have been performed since 2008 using a direct count method.
Methods Islands within the aquatic preserve and state owned islands bordering the aquatic preserve were monitored for nesting birds once a month, starting in January and continuing through the end of nesting season. Nineteen islands were monitored during the 2011 season.
A 17’ Boston Whaler was used to conduct surveys. Each island was circled at a consistent speed while keeping a distance of approximately 100 feet from the island. Two observers conducted counts indicating the number of nests by species and nesting stage. Nests were recorded as empty if no birds or eggs were observed (those numbers were not included in the analyses); unknown if an adult was present at the nest but no eggs or chicks were visible or if the pair was copulating; incubating if the adult was in an incubating posture or if eggs were visible; or chicks if chicks were present in the nest or the vicinity of the nest.
Survey data collected between January and June were analyzed for this report. Surveys were conducted on January 18, 24 & 31; February 15 & 17; March 7, 9 & 16; April 11, 14 & 19; May 11 & 12; June 7 & 8.
Results Fourteen of the 19 islands surveyed contained active colonies with a peak nest count of 331 (Table 1). Peak nest counts in EBAP have decreased annually since 2008; between 2008 (N=531) and 2011 (N=332) a 38% change in nesting activity was recorded. Nest numbers on active islands in 2011 ranged from one nest on Big Carlos Pass W-52 to 131 nests on Matanzas. Nesting in EBAP peaked in April with 207 active nests. In June, 173 nests were still active in nine colonies. Surveys will continue through the end of nesting season.
Species Summaries Double-crested Cormorant (DCCO) nests were documented on 6 islands with a peak of 72 active nests. Nests were active between January and June; nesting peaked in March.
Brown Pelican (BRPE) nests were recorded in three colonies with a peak nest count of 92. BRPE nests were active between January and June and peaked in June.
Great Blue Heron (GBHE) nested on 11 islands with a peak nest count of 78. GBHE nests were at their peak, with 59 active nests, when surveys began in January and 11 nests were active in June. Great White Heron (GWHE) were documented at five nest locations on four islands. Adult GWHE were documented at four of the nests and GWHE chicks were documented in three nests; two nests contained one blue and one white morph.
Great Egret (GREG) nests were documented on four islands with a peak nest count of 34. GREG were documented between January and June, with nest counts peaking in May.
Snowy Egret (SNEG) nests were documented on two islands with a peak nest count of 14. SNEG nests were documented between March and June.
Little Blue Heron (LBHE) had a peak nest count of five in one colony in EBAP. Nesting peaked in May.
Tri-colored Heron (TRHE) were documented on two islands with a peak count of 6 nests. TRHE nests were documented between April and June.
Reddish Egret (REEG) were documented on one island with a peak nest count of three. REEG nests were documented on Matanzas Island between March and June.
Black-crowned Night-Heron (BCNH) were documented on four islands with a peak nest count of ten. Nesting was documented between April and June.
Yellow-crowned Night-Heron (YCNH) nested on seven islands with a peak nest count of 13. YCNH nesting was documented between April and June.
Green Heron (GRHE) nested on two islands within the bay; one nest was documented on each island in June.
Cattle Egret (CAEG) were documented on one island with a peak nest count of two in April.
Staff also recorded one nesting pair of American Oyster Catchers and one Osprey pair on the islands surveyed.
Acknowledgments Thank you to all the volunteers that have donated countless hours to this program; your knowledge, skills and passion have made this program a success. Thank you to Lover’s Key State Park for providing launching and parking facilities.
Cheryl Parrott Clark Environmental Specialist I Estero Bay Aquatic Preserve Coastal and Aquatic Managed Areas Department of Environmental Protection 700-1 Fisherman’s Wharf Fort Myers Beach, Florida 33931 (239) 463-3240 [email protected]

Wading Bird Report 30
Table 1. Peak numbers of nests found in Estero Bay Aquatic Preserve colonies between January and June 2011.
SFWMD, Brian Garrett
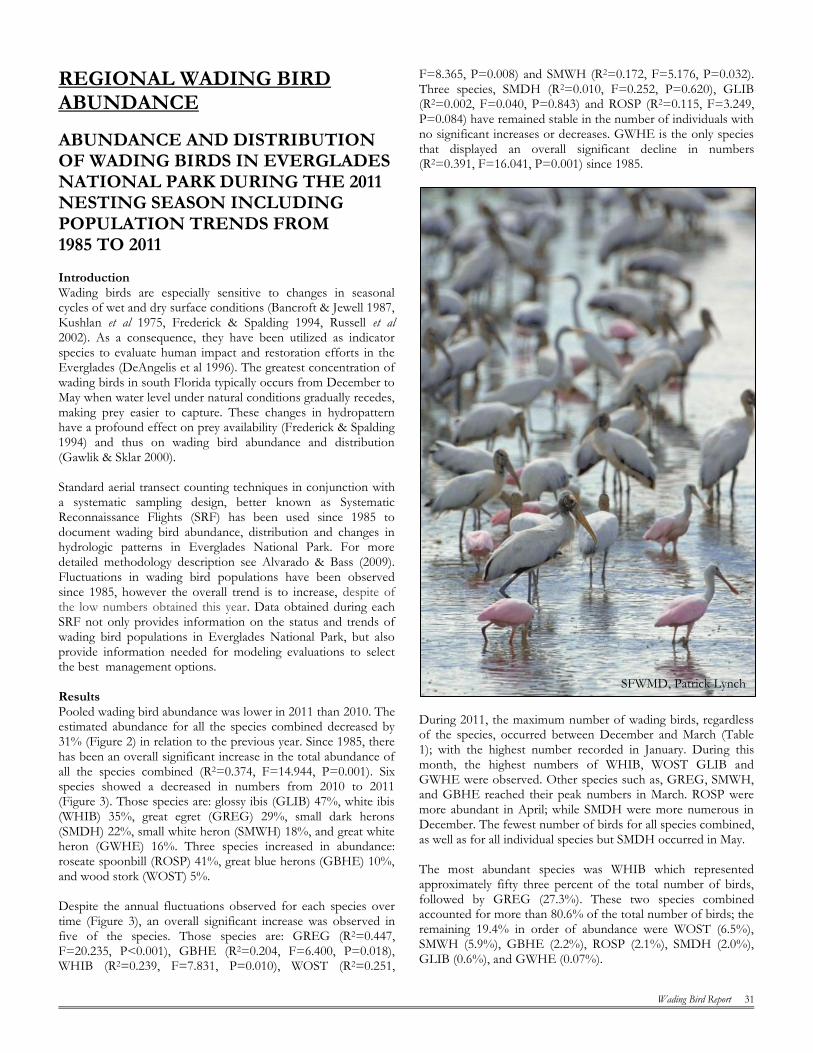
Wading Bird Report 31
REGIONAL WADING BIRD ABUNDANCE
ABUNDANCE AND DISTRIBUTION OF WADING BIRDS IN EVERGLADES NATIONAL PARK DURING THE 2011 NESTING SEASON INCLUDING POPULATION TRENDS FROM 1985 TO 2011 Introduction Wading birds are especially sensitive to changes in seasonal cycles of wet and dry surface conditions (Bancroft & Jewell 1987, Kushlan et al 1975, Frederick & Spalding 1994, Russell et al 2002). As a consequence, they have been utilized as indicator species to evaluate human impact and restoration efforts in the Everglades (DeAngelis et al 1996). The greatest concentration of wading birds in south Florida typically occurs from December to May when water level under natural conditions gradually recedes, making prey easier to capture. These changes in hydropattern have a profound effect on prey availability (Frederick & Spalding 1994) and thus on wading bird abundance and distribution (Gawlik & Sklar 2000). Standard aerial transect counting techniques in conjunction with a systematic sampling design, better known as Systematic Reconnaissance Flights (SRF) has been used since 1985 to document wading bird abundance, distribution and changes in hydrologic patterns in Everglades National Park. For more detailed methodology description see Alvarado & Bass (2009). Fluctuations in wading bird populations have been observed since 1985, however the overall trend is to increase, despite of the low numbers obtained this year. Data obtained during each SRF not only provides information on the status and trends of wading bird populations in Everglades National Park, but also provide information needed for modeling evaluations to select the best management options. Results Pooled wading bird abundance was lower in 2011 than 2010. The estimated abundance for all the species combined decreased by 31% (Figure 2) in relation to the previous year. Since 1985, there has been an overall significant increase in the total abundance of all the species combined (R2=0.374, F=14.944, P=0.001). Six species showed a decreased in numbers from 2010 to 2011 (Figure 3). Those species are: glossy ibis (GLIB) 47%, white ibis (WHIB) 35%, great egret (GREG) 29%, small dark herons (SMDH) 22%, small white heron (SMWH) 18%, and great white heron (GWHE) 16%. Three species increased in abundance: roseate spoonbill (ROSP) 41%, great blue herons (GBHE) 10%, and wood stork (WOST) 5%. Despite the annual fluctuations observed for each species over time (Figure 3), an overall significant increase was observed in five of the species. Those species are: GREG (R2=0.447, F=20.235, P<0.001), GBHE (R2=0.204, F=6.400, P=0.018), WHIB (R2=0.239, F=7.831, P=0.010), WOST (R2=0.251,
F=8.365, P=0.008) and SMWH (R2=0.172, F=5.176, P=0.032). Three species, SMDH (R2=0.010, F=0.252, P=0.620), GLIB (R2=0.002, F=0.040, P=0.843) and ROSP (R2=0.115, F=3.249, P=0.084) have remained stable in the number of individuals with no significant increases or decreases. GWHE is the only species that displayed an overall significant decline in numbers (R2=0.391, F=16.041, P=0.001) since 1985.
During 2011, the maximum number of wading birds, regardless of the species, occurred between December and March (Table 1); with the highest number recorded in January. During this month, the highest numbers of WHIB, WOST GLIB and GWHE were observed. Other species such as, GREG, SMWH, and GBHE reached their peak numbers in March. ROSP were more abundant in April; while SMDH were more numerous in December. The fewest number of birds for all species combined, as well as for all individual species but SMDH occurred in May. The most abundant species was WHIB which represented approximately fifty three percent of the total number of birds, followed by GREG (27.3%). These two species combined accounted for more than 80.6% of the total number of birds; the remaining 19.4% in order of abundance were WOST (6.5%), SMWH (5.9%), GBHE (2.2%), ROSP (2.1%), SMDH (2.0%), GLIB (0.6%), and GWHE (0.07%).
SFWMD, Patrick Lynch
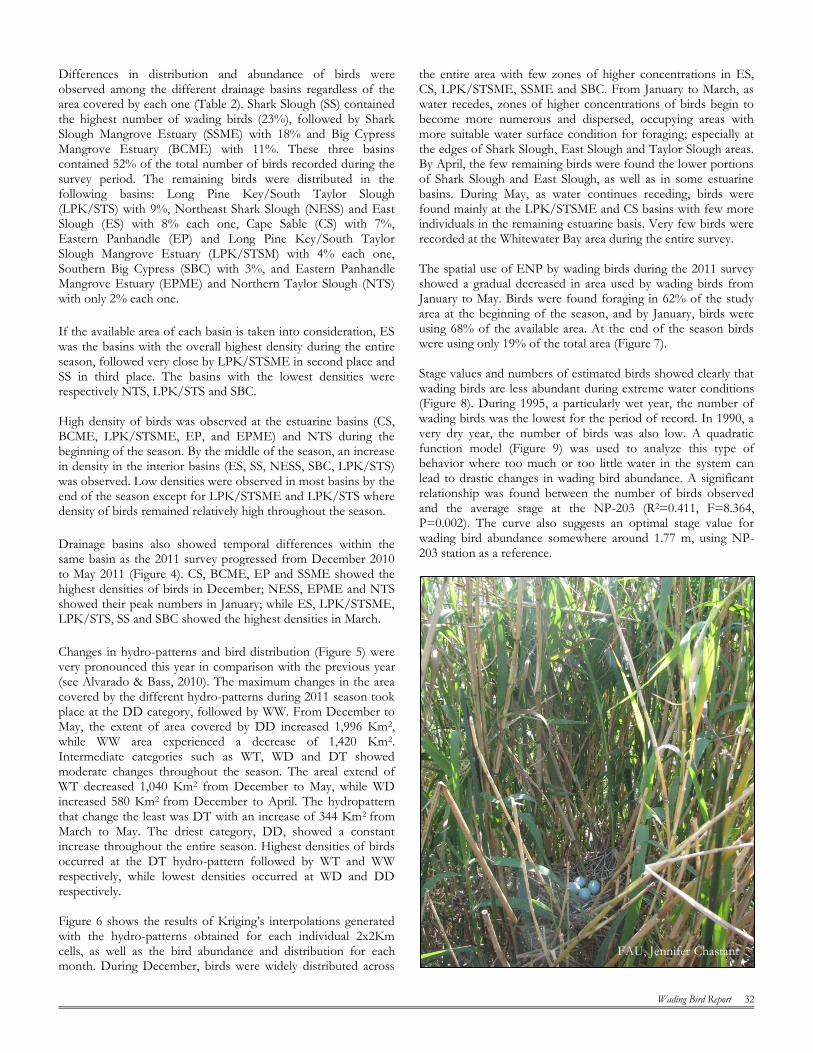
Wading Bird Report 32
Differences in distribution and abundance of birds were observed among the different drainage basins regardless of the area covered by each one (Table 2). Shark Slough (SS) contained the highest number of wading birds (23%), followed by Shark Slough Mangrove Estuary (SSME) with 18% and Big Cypress Mangrove Estuary (BCME) with 11%. These three basins contained 52% of the total number of birds recorded during the survey period. The remaining birds were distributed in the following basins: Long Pine Key/South Taylor Slough (LPK/STS) with 9%, Northeast Shark Slough (NESS) and East Slough (ES) with 8% each one, Cape Sable (CS) with 7%, Eastern Panhandle (EP) and Long Pine Key/South Taylor Slough Mangrove Estuary (LPK/STSM) with 4% each one, Southern Big Cypress (SBC) with 3%, and Eastern Panhandle Mangrove Estuary (EPME) and Northern Taylor Slough (NTS) with only 2% each one.
If the available area of each basin is taken into consideration, ES was the basins with the overall highest density during the entire season, followed very close by LPK/STSME in second place and SS in third place. The basins with the lowest densities were respectively NTS, LPK/STS and SBC. High density of birds was observed at the estuarine basins (CS, BCME, LPK/STSME, EP, and EPME) and NTS during the beginning of the season. By the middle of the season, an increase in density in the interior basins (ES, SS, NESS, SBC, LPK/STS) was observed. Low densities were observed in most basins by the end of the season except for LPK/STSME and LPK/STS where density of birds remained relatively high throughout the season.
Drainage basins also showed temporal differences within the same basin as the 2011 survey progressed from December 2010 to May 2011 (Figure 4). CS, BCME, EP and SSME showed the highest densities of birds in December; NESS, EPME and NTS showed their peak numbers in January; while ES, LPK/STSME, LPK/STS, SS and SBC showed the highest densities in March.
Changes in hydro-patterns and bird distribution (Figure 5) were very pronounced this year in comparison with the previous year (see Alvarado & Bass, 2010). The maximum changes in the area covered by the different hydro-patterns during 2011 season took place at the DD category, followed by WW. From December to May, the extent of area covered by DD increased 1,996 Km2, while WW area experienced a decrease of 1,420 Km2. Intermediate categories such as WT, WD and DT showed moderate changes throughout the season. The areal extend of WT decreased 1,040 Km2 from December to May, while WD increased 580 Km2 from December to April. The hydropattern that change the least was DT with an increase of 344 Km2 from March to May. The driest category, DD, showed a constant increase throughout the entire season. Highest densities of birds occurred at the DT hydro-pattern followed by WT and WW respectively, while lowest densities occurred at WD and DD respectively. Figure 6 shows the results of Kriging’s interpolations generated with the hydro-patterns obtained for each individual 2x2Km cells, as well as the bird abundance and distribution for each month. During December, birds were widely distributed across
the entire area with few zones of higher concentrations in ES, CS, LPK/STSME, SSME and SBC. From January to March, as water recedes, zones of higher concentrations of birds begin to become more numerous and dispersed, occupying areas with more suitable water surface condition for foraging; especially at the edges of Shark Slough, East Slough and Taylor Slough areas. By April, the few remaining birds were found the lower portions of Shark Slough and East Slough, as well as in some estuarine basins. During May, as water continues receding, birds were found mainly at the LPK/STSME and CS basins with few more individuals in the remaining estuarine basis. Very few birds were recorded at the Whitewater Bay area during the entire survey. The spatial use of ENP by wading birds during the 2011 survey showed a gradual decreased in area used by wading birds from January to May. Birds were found foraging in 62% of the study area at the beginning of the season, and by January, birds were using 68% of the available area. At the end of the season birds were using only 19% of the total area (Figure 7). Stage values and numbers of estimated birds showed clearly that wading birds are less abundant during extreme water conditions (Figure 8). During 1995, a particularly wet year, the number of wading birds was the lowest for the period of record. In 1990, a very dry year, the number of birds was also low. A quadratic function model (Figure 9) was used to analyze this type of behavior where too much or too little water in the system can lead to drastic changes in wading bird abundance. A significant relationship was found between the number of birds observed and the average stage at the NP-203 (R2=0.411, F=8.364, P=0.002). The curve also suggests an optimal stage value for wading bird abundance somewhere around 1.77 m, using NP-203 station as a reference.
FAU, Jennifer Chastant

Wading Bird Report 33
Figure 1. Map of ENP and southern Big Cypress National Preserve with sampling transects and drainage basins.

Wading Bird Report 34
Figure 2. Estimated number of wading birds (all species pooled) observed from the months of December to May from 1985 to 2011. Red marks represent years with estimated missing data for one month.
Figure 3. General trends in wading bird populations based on the total number of birds estimated during the surveys performed each year in the Everglades National Park from 1985 to the present.

Wading Bird Report 35
Table 1. Estimated abundance of wading birds in the Everglades National Park and adjacent areas, December 2010 to May 2011.
Table 2. Estimated abundance of wading birds (all species combined) for the different drainage basins in the Everglades National Park, December 2010 to May 2011.
SFWMD, Patrick Lynch

Wading Bird Report 36
Figure 4. Spatial and temporal changes in wading bird density among the different drainage basins between Dec-10 and May-11.
SFWMD, Patrick Lynch

Wading Bird Report 37
Figure 5. The 2011 areal extent and density of wading birds (all species pooled) in each surface water category: WW = continuous surface water; WT = mostly wet with scattered dry areas; DT = mostly dry with small scattered pools of water; WD = dry with water only in solution holes; DD = dry surface.

Wading Bird Report 38
Figure 6. Kriging’s interpolation of changes in hydropatterns observed between December 2010 and May 2011 and correspondent wading bird distribution.

Wading Bird Report 39
Figure 7. Monthly changes in wading bird areal utilization in the Everglades National Park from December 2010 to May 2011.
Figure 8. Relationship between numbers of birds observed for every year since 1985 to 2011 and the stage elevation in meters at the NP-203 hydrological station.

Wading Bird Report 40
Discussion:
Everglades populations of wading birds in general, based on SRF data over a 27-year period, still indicates an overall significant increase despite the low numbers observed during this year. A general trend to increase or to remain stable has been observed in most species. Unfortunately for GEWH, that is not the case, where the overall trend shows a significant population decrease. The 2011 survey represents the first decrease in number of wading birds observed since 2008, perhaps as a consequence of the extreme dry conditions observed this year.
Long and short term temporal and spatial data analysis, also supports the importance of hydrological conditions in the distributions of wading birds and areal utilization. Even though the population of wading birds decreased almost by one third this year, the increase observed in wading bird population during the previous years, suggest some success in the ongoing restoration efforts. However, more research is needed in order to fully support this statement.
Wading bird populations in the Everglades are dynamic, changing constantly and are influenced by many other aspects (Russell et al. 2002). However, the most influential aspect is perhaps human habitat alteration; particularly those that change the natural hydrological conditions. Food availability is consider the most important factor limiting populations of wading birds in the Everglades (Frederick & Spalding 1994); however hydrology is the factor that ultimately determines the availability of food.
Data obtained during each SRF over the years, support the important role that hydrological conditions plays on the abundance and distributions of wading bird populations in the lower Everglades. The concept of too much/too little or just the right amount of water and the too late/too early or just at the
right time seem to be of particular importance for wading birds. For example, rainfall deficit observed during the rainy season previous to the 2011 survey appears to be the cause of the early widespread distribution throughout the system. Because the SRF data are collected during the dry season (December 2010 to May 2011), the annual precipitation from the previous year best describes the water conditions and thus the birds foraging patterns in the area during the surveys. As water receded, later in the season, birds began to concentrate in those areas that still maintained the right water levels. By the end of the season, great numbers of birds left the system heading towards areas with longer hydroperiod and better foraging conditions such as the Water Conservation Areas (Cook & Herring 2007), while the ones that remained in the system concentrate in areas which probably provided them with the best foraging conditions.
Although this preliminary analysis can provide some general ideas of the trends in the number of individuals observed for each species or groups of birds through the years, additional studies and more data analysis will be necessary in order to evaluate the significance of these observations and its relevance to the wading bird populations occurring in Everglades National Park.
Mario A. Alvarado & Oron L. Bass Jr. South Florida Natural Resources Center Everglades National Park 40001 State Road 9336 Homestead, FL 33034 Telephone: 305-242-7884 [email protected]
Figure 9. Quadratic function model used to test the relationship between wading bird abundance and average stage height using the NP-203 hydrological station data.

Wading Bird Report 41
SPECIAL TOPICS
WOOD STORK NESTING AND PRODUCTIVITY AT THE PALM BEACH SOLID WASTE AUTHORITY
Methods We monitored nesting by wood storks (Mycteria americana) at the Palm Beach Solid Waste Authority from 02 February 11 through 22 July 11 (see preceding article for complete site description). The colony was visited every 5-8 days, and all observations were made from the northeast and southeast observations towers to minimize disturbance to the birds. We took high resolution digital photographs from both towers using either a digital SLR with a 300 mm telephoto lens or a digital camera with 12x optical zoom. We were able to distinguish wood stork nests from those of other wading birds by digitally zooming in on photos using Adobe Photoshop. We used the photos to count all wood stork nests visible from each tower and to follow the fates of a subset of 51 nests photographed from the northeast tower. A nest was considered to have been successful if it was still active at least 90 days after the day it was first observed. By this point in time it was apparent for chicks were capable of flight and could be considered to have fledged. Furthermore, this time period adequately encompassed the incubation and nestling period (28-30 days and 55-60 days, respectively). Daily nest survival probabilities were calculated using Program MARK (White and Burnham 1999). We tested 3 survival models: one in which daily nest survival was constant over the entire nesting period, one in which it varied daily over the entire period, and one in which the nesting period was divided into thirds (incubation, early nestling, late nestling/early fledgling) and nest survival was modeled separately for each phase. We compared models using Aikaike’s Information Criteria and selected the best model as the one with the lowest AICc (Burnham and Andersen 1998). We excluded from the analysis two nests that appeared to have been taken over by other wood storks at some point during the nesting cycle. We also banded 48 chicks in the colony, using aluminum bands and green and white alphanumeric bands. Results This report presents preliminary data for the 2011 nesting season. A total of 85 individual wood storks were counted in the colony on 02 Feb. No nests were visible at this time and birds appeared to be in the very early stages of pair formation. Numbers of wood storks started increasing in late February. There were 252 individual birds counted on 22 February, of which 21 appeared to be on nests. By the first week of March most birds appeared to be paired or nesting and we counted 170 nesting pairs on 04 March. This number increased by more than 100 nests the following week, with 281 nests counted on 09 March. Wood stork nests peaked at 386 nests on 12 April. Of 51 nests that were monitored over time from photographs, 33 were successful (64.7%). The two nests were taken over by other wood storks at some point in the study were considered to have failed. There was no evidence of temporal variability in nest
survival rates. The addition of a temporal component to the survival model did not improve model fit when compared to the model in which daily nest survival was constant, and no one phase of the nesting cycle appeared to have experienced higher nest losses. Based on the 49 nests that we analyzed, daily nest survival was 0.9962 (SE = 0.0011, 0.9929-0.9973). The probability of a nest surviving for at least 90 days was 0.6762 (SE = 0.0661, 0.5360-0.7906). The nests we monitored fledged between one and three chicks. No nests were observed to have more than three chicks at any time during the nesting period, although very small nestlings could not be seen from the observation towers and it is possible that some nests hatched more than three chicks. The majority of successful nests that we monitored fledged two chicks (20 nests), while 10 nests fledged one chick and three nests fledged three chicks. The average number of chicks fledged per successful nest was 1.79. Using a peak total nest count of 386 nests and estimated nest survival, we estimate that between 370 and 546 chicks fledged from the SWA colony in 2011. This estimate may be low, given that we did not enter the colony to count nests and likely undercounted the total number on any given date. Despite the drought, nest numbers were high relative to previous years, and in the history of wood stork nesting in the SWA rookery were surpassed only in the record nesting years of 2006 (508 nests) and 2009 (509 nests). Nests were active well into July and large numbers of fledged chicks were observed standing in tall trees near the rookery and along the road that borders the rookery. Sightings of banded wood storks can be reported to the Patuxent Wildlife Research Center Bird Banding Laboratory (http://www.reportband.gov/) or by contacting Rena Borkhataria ([email protected]).
Rena Borkhataria, Mary Beth Morrison, Edelberto Cabrera and Sebastian Ortiz Everglades Research and Education Center University of Florida 3200 E. Palm Beach Rd. Belle Glade, FL 33430 (561) 993-1599 [email protected]
SFWMD, Pat Lynch
SFWMD, James Beerens

Wading Bird Report 42
INCREASED CRAYFISH DENSITY FOLLOWING SIMULATED DROUGHT AND FISH REDUCTION AT LILA
Hydrology has at least two functional roles in regulating trophic transfer of biomass to wading birds and other megafauna in the Everglades. As Gawlik (2002) points out, appropriate nesting season water depths are crucial for making the prey in the sloughs available for foraging birds. But hydrology plays another function during the prey production phase, prior to concentrating prey; drying events, the time since drying and flooding extent can affect prey species composition and abundance (Trexler et al. 2005, Dorn and Trexler 2007, Trexler and Goss 2009). In short, historical hydro-patterns and appropriate seasonal depths together determine food web interactions, and therefore, wading bird nesting success. Resolving the relationship between hydro-pattern and prey production is therefore fundamental for the development of restoration targets and associated hydro-management objectives.
One of the goals of CERP includes the maintenance of large numbers of nesting wading birds and the frequent return of exceptionally large White Ibis (Eudocimus albus) nesting events (Frederick et al. 2009). Frederick and Ogden (2001) argued that the historical wading bird supercolonies typically followed 1-2 years after strong regional droughts. They hypothesized that either aquatic predator reduction and/or nutrient release were responsible for prey enhancement following extensive wetland drying. While they were uncertain how prey might be enhanced by drying, Ogden et al. (2003) later suggested that crayfish might be dynamically linked to drought and formation of exceptionally large nesting events. All of the evidence for pulsed production up to this time has been correlative and the understanding of the mechanisms leading to pulsed-production has been generally unstudied.
Over the past two years we have been quantifying the aquatic animal communities in the LILA experimental impoundments as part of a multi-year investigation of the effects of drying, and predatory fish reduction, on crayfish population sizes and densities of other prey (Cook et al. 2010). We hypothesized that drying-related reductions of predatory fishes (Parkos et al. 2011) will allow crayfish populations to recruit more successfully (Dorn 2008, Kellogg and Dorn in review) and achieve higher densities during the following year. In turn this is hypothesized to provide better foraging opportunities for birds that feed on crayfish, like the White Ibis (Dorn et al. 2011). Smaller-bodied fishes (e.g., smaller killifishes) could also be enhanced after predator reduction (Frederick and Ogden 2001) although other observations suggest this is not likely (Trexler et al. 2005).
Methods From July 2009 to March 2011 we quantified large-bodied fishes and small animal densities in all four macrocosms at LILA. In two seasons (July and March) of each water year we set and recovered trap nets (i.e., fyke nets) for three consecutive nights in the sloughs of each macrocosm to estimate predatory fish activity-density (catch per unit effort). One trap effort was defined as the sum of the average catch for each of the three trap types on a given night and nights were treated as replicates in the analysis. We also used 1-m2 throw traps to quantify the
population sizes of smaller animals (fish and crayfish) in the LILA sloughs. In the same sample seasons we collected 15 throw trap samples from each of the wetland macrocosms. Traps were placed in both deep (n=11) and shallow (n=4) slough habitats each season. The sampling was conducted at times when the water was 0-10 cm deep on the ridges but at depths too deep for extensive wading bird foraging in the sloughs (~25-60 cm depending on the slough).
In May 2010 we dried the sloughs of two macrocosms (M3 and M4) and experimentally reduced the fish populations remaining in the deep-water ponds and ditches. The fish removal served to simulate depression of large-bodied fish populations as would be expected during a drought in the Everglades ridge and slough landscape where deep-water habitats are less prevalent.
We analyzed predatory fish catches to determine whether our manipulation significantly reduced the predatory fish abundances in the dried cells and to determine the temporal scale of the reduction. All fish > 5 cm (standard length, SL) were treated as predators in the analysis. Log-transformed predatory fish abundance (nightly catch) was analyzed with repeated measures ANOVA (rm-ANOVA) following a Before-After-Control-Impact (BACI) design with nested factors in Proc Mixed (SAS 9.2, SAS Institute). In this experiment we had two control sites (i.e., wetland macrocosms) and two impacted sites (Underwood and Chapman 2003). The models included terms to partition variation to macrocosms within treatments, treatments (control or dried designations), periods (water years before vs. after experimental drought), and time within each period (July vs. March). The focal interaction terms in the BACI design are the treatment x period interaction and the treatment x time(period) interaction; the two terms testing for differences between the treatments that change through time as a function of the impact (i.e., experimental drying). For the large fish catches we were interested in whether catches were indeed reduced in the dried wetlands compared to the controls sometime after the experimental drought.
Crayfish and small fish are prey of the larger fishes and we analyzed their densities using individual throw trap counts as the response variables (i.e., replicates within sites, sensu Underwood and Chapman 2003). Within-macrocosm spatial variation was not modeled explicitly except that we included a term for the slough where the trap was placed (deep vs. shallow) because crayfish densities were believed to be generally higher in the shallower and more densely-vegetated shallow sloughs. The other terms in the model were similar to those explained in the analyses of the large-fish catches. Again, we were interested in changes in fish or crayfish densities in dried vs. control wetlands from Before to After the simulated drought. Small fish throw trap counts were square-root transformed before analysis and crayfish counts were analyzed using Proc GENMOD which allowed us to specify the response distribution as a negative binomial (i.e., over-dispersed counts).
Results and Discussion Large fish catches were variable between macrocosms and through time (P-values < 0.001) and fish catches in the dried macrocosms were reduced in July (treatment x time(period): P < 0.001; Fig. 1), but not for the entire water year after drought (treatment x period: P = 0.21). In fact, large fishes were somewhat more abundant in dried macrocosms by the following

Wading Bird Report 43
March (March contrast: P = 0.02, Fig. 1). In July 2010, after the simulated drought the predatory fish catches were reduced 42% and 90% in the two dried macrocosms relative to the mean of the controls.
The model results also indicated that the two dried macrocosms differed from one another on average during the after period (period x macrocosm(treatment): P = 0.05); predatory fish were more abundant in M3 than in M4 after the simulated drought (P = 0.005, Fig. 1); other contrasts between macrocosms within treatments were non-significant in both periods (P-values > 0.1).
Small fish densities (all species combined) varied between macrocosms (P = 0.01, Fig. 2A), but dried macrocosms did not vary systematically from control macrocosms through time (treatment x period: P = 0.14; treatment x time(period): P = 0.71). The simulated drought and pulsed predatory fish reduction neither stimulated nor reduced densities of small fishes in LILA. In contrast, the crayfish density was higher in dried macrocosms after simulated drought (Fig. 2B) (treatment*period: P < 0.001, treatment x time(period): P = 0.02). There was also significant variation among the macrocosms within a treatment after the drought, but primarily in March. The crayfish densities remained the highest in March (Fig. 2B) in M4 and this was the same macrocosm where predatory fishes were most effectively reduced by the simulated drought (Fig. 1). Crayfish densities did not differ between treatments in the year leading up to the drought (contrast: P = 0.93), but were nearly 3X higher on average in the dried macrocosms (μ = 7.8/m2) compared to the controls (μ = 2.7/m2) in the year after the simulated drought (contrast: P < 0.001).
The results in this study indicate that we achieved a significant, but modest, large fish reduction in the early wet season through a simulated drought; something expected to accompany natural droughts in the Everglades (Parkos et al. 2011). The seasonal “pulsed” reduction in large-bodied fishes appears to have been responsible for a significant and substantial increase in crayfish densities in the water year following the drought.
Nathan J. Dorn Department of Biological Sciences Florida Atlantic University 3200 College Ave., Davie, FL 33314 (954) 236-1315 [email protected]
Mark I. Cook, Mac Kobza and Eric Cline Everglades Division, SFWMD 3301 Gun Club Rd. West Palm Beach, FL 33406 (561) 686 – 8800 x4539 [email protected]
Figure 1. Mean standardized nightly catch of large-bodied fishes (>5 cm SL) in four wetland macrocosms at LILA. The fish were captured in three different gear types set in the sloughs and were released each day. The standard error is a temporal standard error based on three consecutive nights of trapping each sample season. The vertical dashed line indicates the time of the experimental drying and fish reduction.
Figure 2. Densities (#/m2) of (A) small fish (all species combined) and (B) crayfish (Procambarus fallax) in the four wetland macrocosms at LILA over two water years. The error bars are standard errors for 15 throw traps taken from each of the macrocosms on each date. The dotted line indicates the timing of the experimental drought when large-bodied fishes were reduced.
0.1
1
10
100
Mar-09 Sep-09 Mar-10 Sep-10 Mar-11
DateLa
rge
fish
Sta
nd
ard
ized
Cat
ch p
er
Nig
ht (
Mea
n ±
SE)
Before After
Control Wetland (M1)
Dried Wetland (M3)
Control Wetland (M2)
Dried Wetland (M4)
0
5
10
15
20
25
30
35
40
45
50
0
2
4
6
8
10
12
14
16
Mar-09 Sep-09 Mar-10 Sep-10 Mar-11
A.
B.
Date
Smal
l Fis
h D
ensi
ty
(mea
n #
/m2
±SE
)C
rayf
ish
Den
sity
(m
ean
#/m
2±
SE)
Before After
Control Wetland (M1)
Dried Wetland (M3)
Control Wetland (M2)
Dried Wetland (M4)
SFWMD, Mac Kobza

Wading Bird Report 44
LITERATURE CITED Alvarado, M. A. and S. Bass. 2010. Abundance and distribution of wading birds in Everglades National Park during the 2009 nesting season including
population trends from 1985 to 2009. In: South Florida wading bird report 16: 30-39. (eds. Cook, M. I. & Kobza, .) South Florida Water Management District.
Bancroft, G. T. and S. D. Jewell. 1987. Foraging habitat of Egretta herons relative to stage in the nesting cycle and water conditions. (Second Annual Report) West Palm Beach: South Florida Water Management District.
Burnham, K. P. and D. R. Andersen. 1998. Model selection and inference: a practical information-theoretic approach. Springer-Verlag, New York, NY.
Cook, M. I. and H. K. Herring. 2007. South Florida Wading Bird Report. South Florida Water Management District. West Palm Beach, FL Vol. 13 (1) Cook, M., N. Dorn, R. Shuford, and M. Kobza. 2010. Wildlife Ecology section in Chapter 6 of the South Florida Environmental Report (eds. Sklar,
Dreschel & Warren). Pp. 15-22. David, P.G. 1994. Wading bird nesting at Lake Okeechobee, Florida: An historic perspective. Colonial Waterbirds 17:69-77. DeAngelis D., L. J. Gross, S. Hartley, J. Johnston, F. J. Mazzotti, L. Pearlstine and K. G. Rice. 1996. Across Trophic Level System Simulation
(ATLSS) Program. Unpublished manuscript. Dorn, N. J. 2008. Colonization and reproduction of large macroinvertebrates are enhanced by drought-related fish reductions. Hydrobiologia 605:
209-218. Dorn, N. J. and J. C. Trexler. 2007. Crayfish assemblage shifts in a large drought-prone wetland: the roles of hydrology and competition. Freshwater
Biology 52: 2399-2411. Dorn, N. J., M. I. Cook, G. Herring, R. A. Boyle, J. Nelson, and D. E. Gawlik. 2011. Aquatic prey switching and urban foraging by the White Ibis
Eudocimus albus are determined by wetland hydrological conditions. Ibis 153: 323-335. Erwin, R.M., J. Galli and J. Burger. 1981. Colony site dynamics and habitat use in Atlantic Coast seabirds. Auk 98:550-561. Frederick, P. C. and J. C. Ogden. 2001. Pulsed breeding of long-legged wading birds and the importance of infrequent severe drought conditions in
the Florida Everglades. Wetlands 21: 484-491. Frederick, P. C., D. E. Gawlik, J. C. Ogden, M. I. Cook and M. Lusk. 2009. The White Ibis and Wood Stork as indicators for restoration of the
everglades ecosystem. Ecological Indicators 9S: S83-S95. Frederick, P.C. and M.G. Spalding. 1994. Factors affecting reproductive success of wading birds (Ciconiiformes) in the Everglades ecosystem. Pgs.
659 - 691 in: Everglades: the ecosystem and its restoration. S. Davis and J. C. Ogden (eds.) St. Lucie Press, Delray Beach, Florida. Gawlik, D. E. 2002. The effects of prey availability on the numerical response of wading birds. Ecological Monographs 72: 329-346. Gawlik, D.E. and F.H. Sklar. 2000. Effects of Hydrology on Wading Bird Foraging Parameters. In: Higer, A.L. (Ed.). Greater Everglades Ecosystem
Restoration (GEER) Conference, December 11-15, 2000, Naples, Florida. Section III p. 95-97. Kellogg, C. M. and N. J. Dorn. In review. Consumptive effects of fish reduce wetland crayfish recruitment and drive species turnover. Oecologia Kushlan, J. A., J. C. Ogden, and J. L. Tilmant, 1975. Relation of water level and fish availability to wood stork reproduction in the southern
Everglades, Florida. (Open File Report 75-434). Tallahassee: US Geological Survey. Kushlan, J.A. 1976. Wading bird predation in a seasonally fluctuating pond. Auk 93:464-476. Lorenz, J.J. 2000. Impacts of water management on Roseate Spoonbills and their piscine prey in the coastal wetlands of Florida Bay. Dissertation,
University of Miami, Coral Gables, FL, USA. Lorenz, J.J., J.C. Ogden, R.D. Bjork, and G.V.N. Powell. 2002. Nesting patterns of Roseate Spoonbills in Florida Bay 1935-1999: Implications of
landscape scale anthropogenic impacts. Pp. 563-606 in J.W. Porter and K.G. Porter (eds.). The Everglades, Florida Bay, and coral reefs of the Florida Keys: An ecosystem sourcebook. CRC Press, Boca Raton, FL.
Marx, D.E., and D.E. Gawlik. 2007. Wading bird colony location and size at Lake Okeechobee. Pp. 23-28 in M. I. Cook and H.K. Herring (Eds.). South Florida Wading Bird Report, Vol 13. South Florida Water Management District, West Palm Beach, Florida.
Ogden, J. C., S. M. Davis and L. Brandt. 2003. Science strategy for a regional ecosystem monitoring and assessment program: the Florida Everglades example. Pages 135-163 in D. E. Busch and J. C. Trexler. Monitoring Ecosytems. Island Press, Washington, DC.
Parkos, J. J., C. R. Ruetz, and J. C. Trexler. 2011. Disturbance regime and limits on benefits of refuge use for fishes in a fluctuating hydroscape. Oikos doi: 10.1111/j.1600-0706.2011.19178.x
Russell, G. J., Bass, O. L. and Pimm, S. L. 2002. The effect of hydrological patterns and breeding-season flooding on the numbers and distribution of wading birds in Everglades National Park. Anim. Conserv. 5: 185-199.
Sklar, F., R. Bennett, and C. Madden 2011 Chapter 6: Ecology of the Everglades Protection Area. In: 2012 South Florida Environmental Report–Volume I, South Florida Water Management District, West Palm Beach, FL.
Sklar, F.H. and A. van der Valk. 2002. Tree Islands of the Everglades. Springer, New York. Smith, J.P. and M.W. Collopy. 1995. Colony turnover, nest success and productivity, and causes of nest failure among wading birds (Ciconiformes) at
Lake Okeechobee, Florida (1989-1992). Archiv fur Hydrobiologie, Advances in Limnology 45:287-316. Trexler, J. C. and C. Goss. 2009. Aquatic fauna as indicators for Everglades restoration: applying dynamic targets in assessments. Ecological Indicators
9S: S2-S16. Trexler, J. C., W. F. Loftus, and S. Perry. 2005. Disturbance frequency and community structure in a twenty-five year intervention study. Oecologia
145: 140-152. Underwood, A. J. and M. G. Chapman. 2003. Power, precaution, Type II error and sampling design in assessment of environmental impacts. Journal
of Experimental Marine Biology and Ecology 296: 49-70. White, G. and K. P. Burnham. 1999. MARK: Survival estimation from populations of marked animals. Bird Study 46:120-138. Wu, Y., K. Rutchey, W. Guan, L. Vilchek and F.H. Sklar. 2002. Spatial Simulations Of Tree Islands For Everglades Restoration. Pp 469-498. In: Tree
Islands of the Everglades. F. Sklar and A. van der Valk, eds. Kluwer Academic Publishers, Boston, MA. Zaffke, M. 1984. Wading bird utilization of Lake Okeechobee marshes 1977-1981. Technical Publication 84-9. South Florida Water Management
District, Environmental Sciences Division, West Palm Beach, Florida, USA.

Wading Bird Report 45
This document is the result of continued cooperation among a diverse group of ecologists. It is not a peer-reviewed scientific publication; narratives reflect the views of individual authors rather than the collective participants. Photos provided by James Beerens, Jennifer Chastant, Gaea Crozier, Brian Garrett, Dale Gawlik, Mac Kobza and Patrick Lynch. The South Florida Wading Bird Report is available on the web at www.sfwmd.gov.
Mark I. Cook Everglades Division, SFWMD 3301 Gun Club Rd. West Palm Beach, Florida 33406 (561) 686 – 8800 x4539 [email protected] Mac Kobza Boulder County Parks and Open Space 5201 St. Vrain Rd. Longmont, Colorado 80503 (303) 678-6203 [email protected]
SFWMD, James Beerens
SFWMD, Mac Kobza