south asia: journal of south asian studies caste... · castes’ or dalits. the government of india...
TRANSCRIPT
This article was downloaded by:[Flinders University of South Australia][Flinders University of South Australia]
On: 8 May 2007Access Details: [subscription number 767966226]Publisher: RoutledgeInforma Ltd Registered in England and Wales Registered Number: 1072954Registered office: Mortimer House, 37-41 Mortimer Street, London W1T 3JH, UK
South Asia: Journal of South AsianStudiesPublication details, including instructions for authors and subscription information:http://www.informaworld.com/smpp/title~content=t713445348
Caste, inequality and the nation-state: The impact ofreservation policies in India, c. 1950-2000Lance Brennan a; John McDonald a; Ralph Shlomowitz aa Flinders University.
To cite this Article: Lance Brennan, John McDonald and Ralph Shlomowitz , 'Caste,inequality and the nation-state: The impact of reservation policies in India, c.1950-2000', South Asia: Journal of South Asian Studies, 29:1, 117 - 162To link to this article: DOI: 10.1080/00856400600550831URL: http://dx.doi.org/10.1080/00856400600550831
PLEASE SCROLL DOWN FOR ARTICLE
Full terms and conditions of use: http://www.informaworld.com/terms-and-conditions-of-access.pdf
This article maybe used for research, teaching and private study purposes. Any substantial or systematic reproduction,re-distribution, re-selling, loan or sub-licensing, systematic supply or distribution in any form to anyone is expresslyforbidden.
The publisher does not give any warranty express or implied or make any representation that the contents will becomplete or accurate or up to date. The accuracy of any instructions, formulae and drug doses should beindependently verified with primary sources. The publisher shall not be liable for any loss, actions, claims, proceedings,demand or costs or damages whatsoever or howsoever caused arising directly or indirectly in connection with orarising out of the use of this material.
© Taylor and Francis 2007
Dow
nloa
ded
By: [
Flin
ders
Uni
vers
ity o
f Sou
th A
ustra
lia] A
t: 02
:26
8 M
ay 2
007
Caste, Inequality and the Nation-State:
The Impact of Reservation Policies
in India, c. 1950–2000
Lance Brennan, John McDonald and Ralph Shlomowitz
Flinders University
Since Independence, a significant question for India has been how to manage the
relationship between socio-ritual status—caste—and inequality.
Initially concern in this context focused on the Untouchables—now the ‘Scheduled
Castes’ or dalits. The Government of India accepted that social identity con-
strained the welfare of the Scheduled Castes and Scheduled Tribes and reserved
for them specific shares of legislative and bureaucratic offices and educational
places. Shortly after these provisions had been settled, pressure grew to extend
affirmative action to those castes that came to be called ‘the Other Backward
Classes’, or OBCs.
Subsequent attempts to reserve positions and places for the OBCs resulted in
political conflict and occasionally, serious rioting. In south India the issue of
‘reservation’, a staple of politics since the 1920s, remained tendentious into the
late 1980s.1 In the north, political pressure on the issue reached its climax in
1990 when V.P. Singh, as prime minister, said his government would implement
the Mandal Commission’s recommendations on reservations for OBCs in the
central administration.2 Upper-caste hostility to all reservations provoked by this
announcement drew the lower castes together to mobilise more effectively for
the political contest.3
1 Paul Brass, Politics Of India Since Independence (Cambridge: CUP, 2nd ed., 1994), pp.254–5.2 Ibid., pp.247–53.3 Christophe Jaffrelot, ‘The Rise Of the Other Backward Classes in the Hindi Belt’, in Journal Of Asian Studies,
Vol.59, no.1 (Feb.2000), p.97.
South Asia: Journal of South Asian Studies,
n.s., Vol.XXIX, no.1, April 2006
ISSN 0085-6401 print; 1479-0270 online/06/010117-46 # 2006 South Asian Studies Association of Australia
DOI: 10.1080/00856400600550831

Dow
nloa
ded
By: [
Flin
ders
Uni
vers
ity o
f Sou
th A
ustra
lia] A
t: 02
:26
8 M
ay 2
007
Christophe Jaffrelot explains how the educated elite of the intermediate castes
adroitly exploited the OBC label to include the great majority of castes between
the Scheduled Castes and the high castes.4 Their manipulation of the OBC category
raises the question whether the case for an improvement in the welfare of the
OBCs—however defined—was justified, or was an artefact of political ambition.
This paper examines the extent and trends of inequality since Independence in
four Indian states: Andhra Pradesh; Tamil Nadu; Bihar; and Uttar Pradesh.
These were chosen because they are located, respectively, in the south and
north of the country, and have large, multi-caste populations. But since the
states and their sample populations are large we have attempted to establish
whether the state-based trends are replicated in their constituent regions. The
paper (1) relates the distribution of inequality to the nature of caste politics,
and (2) tests whether the policy on reservations has affected the degree of
inequality between castes.
Caste and Politics in Colonial IndiaFrom the beginning of electoral politics in India, caste has been used by politicians to
mobilise support. The first presidency-wide contests in Madras Presidency (now
Andhra and Tamil Nadu states) in which caste was important occurred in the
1920s, when the British made a modicum of political power available to elected
Indian ministers. Previously, the Brahmins (about three percent of the population)
had dominated the society and politics of the Presidency as landowners, pro-
fessionals, civil servants, and leaders of the Indian National Congress. From the
1920s their political pre-eminence was challenged by the Justice Party, a loose
and shifting coalition formed by men from the wealthy-peasant and commercial
classes. In Andhra many of the latter were Reddys and Kammas; in Tamil Nadu,
Vellalas were significant. Their rhetoric was anti-Brahmin, though in essence they
were pragmatic politicians using local and regional connections to seek power and
position.5 The Justice Party established itself in the politics of the Presidency in
the 1920s and pushed, with some success, for the implementation of policies increas-
ing the recruitment of non-Brahmins to the public service. But its leaders were
mainly concerned with personal patronage, and especially with making appoint-
ments to important positions in the administration. They failed in these ambitions.6
The Madras Provincial Congress, though led by Brahmins, had become sensitised to
the importance of the rural castes and in the 1930s actively recruited leaders from
4 Ibid., p.101.5 C.J. Baker, The Politics Of South India, 1920–1937 (Cambridge: CUP, 1976), pp.81–4.6 Ibid., pp.50–8.
118 SOUTH ASIA
Dow
nloa
ded
By: [
Flin
ders
Uni
vers
ity o
f Sou
th A
ustra
lia] A
t: 02
:26
8 M
ay 2
007
among them. In 1937 K. Kamaraj, a non-Brahmin, was elected president of the
provincial committee (PCC). Still, as leaders of the nationalist movement, the
Brahmins were able to maintain their influence in Madras (and then Tamil Nadu)
politics down to Independence and beyond.
Next door to Madras was the princely state of Hyderabad. Its ruler, the nizam,
controlled his vast dominion through the medium of jagirdars (usually Muslim)
who enjoyed the land-revenue from specific villages in return for their
services to the state, and deshmukhs, landlords who wielded considerable local
administrative, economic and social power. In the Telengana region of
Hyderabad, adjacent to Andhra, the latter were usually from the Reddy,
Velama and Brahmin castes.
Looking now to north India, caste was an element of political life in Bihar province
as early as the 1920s, when competition was largely confined to the high castes such
as the Brahmins, Thakurs (Rajputs), Kayasthas and Bhumihars. Walter Hauser
quotes the nationalist and peasant leader, Swami Sahajanand: ‘Even the most promi-
nent Congress leaders were talking and mobilizing themselves in terms of caste’.7 As
Rajendra Prasad explained when confirming that caste was important in the selection
of candidates for the 1937 provincial elections in Bihar, ‘the success of candidates
there depended upon such considerations’.8
Between 1937 and 1947 the main internal political contest in the United Provinces
(now Uttar Pradesh or UP) was between the Congress and the Muslim League.
During this period support for the Indian National Congress was widespread
across the Hindu community,9 and its electoral victories were grounded in ideologi-
cal (nationalist) and personal factors rather than caste loyalties.10 But in the districts,
educated rural caste leaders brought their caste-fellows into the Congress movement
and their participation began to influence its internal dynamics, especially after the
party won government in 1937.11
7 Walter Hauser, ‘Bihar—Changing Image Of Caste and Politics’, in Seminar, No.450 (Feb. 1997), p.50.8 Ibid.9 Brahmins, especially Jawaharlal Nehru, Acharya Narendra Dev and Pandit Pant, dominated the provincial Con-
gress leadership, which also included members of other castes and Muslims.10 See Paul R. Brass, Factional Politics in an Indian State: The Congress Party in Uttar Pradesh (Bombay: OUP,
1966), pp.33–43.11 Lance Brennan, ‘From One Raj to Another: Congress Politics in Rohilkhand, 1930–50’, in D.A. Low (ed.),
Congress and the Raj (London: Heinemann, 1977), pp.479–84.
CASTE, INEQUALITY AND THE NATION-STATE 119
Dow
nloa
ded
By: [
Flin
ders
Uni
vers
ity o
f Sou
th A
ustra
lia] A
t: 02
:26
8 M
ay 2
007
DataAshwini Deshpande addresses the association of caste with relative well-being in her
recent articles. She maps the regional variation in the extent of inequality between
Scheduled Castes and ‘Others’, and has gone on to demonstrate, using the National
Sample Survey (NSS) of 1994, that caste differentiation remains a potent element of
inequality in Kerala, the state with the best egalitarian credentials.12 One aim of this
paper is to extend the temporal scale and depth of her work by using different
measures of well-being and by employing a finer-grained caste analysis.
Our analysis first establishes the general trends in poverty and inequality in the four
states from 1958 to 1994, using Poverty Head Count and Gini coefficient data
derived from the National Sample Surveys and compiled by the World Bank.13
Change in the social composition of poverty and inequality in the four states is
traced using two sets of data from the second National Family Health Survey of
1998–1999 (NFHS-2).14 This survey, conducted throughout India (other than in
the Union territories), examined the health and welfare of mothers and infants,
and the socio-economic situation of their families. The survey included the measure-
ment of the height of women who were or had been married: we use this information
as our proxy of the well-being of their families during their infancy.
Final adult height is determined by a combination of genetic and environmental
factors. Genetic potential is most important in determining final adult height in popu-
lations that have ample food and live in sanitary conditions. In countries like India
where, for many, the food supply and sanitary situation are problematic, the environ-
ment is crucial: and nutrition and health during the early years of life are the most
important determinants of final adult height.15 Therefore, the final adult height of
individual women in this sample indicates the nutritional and health conditions
12 Ashwini Deshpande, ‘Does Caste Still Define Disparity? A Look at Inequality in Kerala, India,’ in The American
Economic Review, Vol.90, no.2 (May 2000), p.322.13 Berk Ozler, Gaurav Datt and Martin Ravallion, A Database on Poverty and Growth in India (New York: Poverty
and Human Resources Division, Policy and Research Dept., World Bank, 1996) [http://www.worldbank.org/poverty/data/indiadata.htm, accessed 20 Feb. 2004].14 International Institute for Population Studies (IIPS) and ORC Macro, National Family Health Survey, 1998–99:
India (Mumbai: IIPS, 2000). The data on specific castes is on the Internet, and has been accessed from May 2000 at
the following address: http://www.measuredhs.com.15 K. Silvent, J. Kapprio and M. Koskenvuo, ‘Relative Effect Of Genetic and Environmental Factors on Body Height:
Differences Across Birth Cohorts Among Finnish Men and Women’, in American Journal of Public Health, Vol.90,
no.4 (2000), pp.627–8. Stunting is ‘frequently associated with poor overall economic conditions and/or repeated
exposure to adverse conditions’. J. Gorstein, K. Sullivan, R. Yip, M. de Onis, F. Trowbridge, P. Fajans et al.,
‘Issues in the Assessment Of Nutritional Status Using Anthropometry’, in Bulletin of the World Health Organization,
No.72 (1994), p.273. For general discussions of the relationship between height and well-being, and their historical
dimension, see P.B. Eveleth and J.M. Tanner, Worldwide Variation in Human Height (Cambridge: CUP, 2nd ed.,
1990); and R. Floud, K. Watcher and A. Gregory, Height, Health and History: Nutritional Status in the United
Kingdom (Cambridge: CUP, 1990).
120 SOUTH ASIA

Dow
nloa
ded
By: [
Flin
ders
Uni
vers
ity o
f Sou
th A
ustra
lia] A
t: 02
:26
8 M
ay 2
007
they experienced as infants.16 As the caste-cluster of each family was recorded,17 we
can compare the well-being of the women (and their families) as members of various
castes in the four states across the period from about 1950 to 1979. Trends in nutri-
tional and health conditions for the three decades between 1950 and 1979 are
reflected in the mean values of individual adult heights assembled by caste group
in ten-year birth cohorts.18
The NFHS-2 data also include an assessment of whether each family being surveyed
in 1998–1999 enjoyed a ‘high’, ‘medium’, or ‘low’ standard of living.19 We are
therefore able to continue our examination of the welfare of these caste-clusters
and groupings almost to the contemporary period.
Deshpande points out that the Others category she uses is very large and comprises
castes which are close to the Scheduled Castes in socio-ritual status as well as castes,
such as the Brahmins, that are not. Political contests over reservations include,
therefore, claims from within the Others group—so, for this analysis, the Hindu
caste-clusters are divided into four groups: ‘high’, ‘intermediate’, ‘backward’, and
‘Scheduled’. The position of the caste-clusters in this broad framework was deter-
mined initially by their socio-ritual ranking in the Census of India of 1901.20
To confirm and refine the allocation to groups we used the recent series by the
16 Childhood stunting generally produces a reduction in adult size. See WHO Expert Committee, Physical Status:
The Use and Interpretation Of Anthropometry, WHO Technical Report Series No.854 (Geneva: WHO, 1995),
p.180; and K. Satyanaryana, N.A. Nadamuni, and B.S.N. Rao, ‘Adolescent Growth Spurt Among Rural Indian
Boys in Relation to their Nutritional Status in Early Childhood’, in Annals of Human Biology, Vol.7 (1980),
pp.359–65.17 We follow Irawati Karve’s idea of caste-cluster in order to use the term the respondents gave for their identity
without implying that caste is homogenous. The cluster is of the endogamous jati that comprise the caste: e.g.
while Brahmins may identify themselves as such and occupy much the same status position relative to other
caste-clusters, they belong to a number of endogamous jati within the Brahmin cluster. See Irawati Karve, Hindu
Society—an Interpretation (Poona: Deshmukh, 2nd ed., 1968), p.29.18 For an analysis of male anthropometric data in north India from about 1886 to 1966 see L. Brennan, J. McDonald
and R. Shlomowitz, ‘Long-Term Change in Indian Health’, in South Asia, n.s., Vol.XXVI, no.1 (2003), pp.51–69.
Comparable individual level anthropometric measures for adult males for the last half of the twentieth century are
not available.19 The Standard of Living Index is based on the assessment of such items as type of house, toilet facility, source of
drinking water, and ownership of agricultural land, livestock, and durable goods. A family’s score for each of the
items was added, and the total used to allocate the family to the rank of low, medium, or high standard of living.
The process is described in IIPS, NFHS-2, pp.40–1.20 The initial fine-grained socio-ritual ranking was made by local informants—usually high caste and always elite—
based on the test of which other castes would receive water and food from a particular caste-cluster, and whether a
respectable Brahmin would officiate at their ceremonies. See especially Census Of India, 1901, Vol.XVI, pt.1
(Calcutta: Govt. of India, 1902), pp.216–58. For a discussion, based on his field work, of the taking and giving
of food as a guide to the ranking of castes, see McKim Marriott, ‘Caste Ranking and Food Transactions: A
Matrix Analysis’, in Milton Singer and Bernard S. Cohn (eds), Structure and Change in Indian Society (Chicago:
Aldine, 1968), pp.133–71.
CASTE, INEQUALITY AND THE NATION-STATE 121

Dow
nloa
ded
By: [
Flin
ders
Uni
vers
ity o
f Sou
th A
ustra
lia] A
t: 02
:26
8 M
ay 2
007
Anthropological Survey of India, The People Of India, and especially the National
List of Communities in Volume I. The latter is helpful because it indicates
whether a caste-cluster has been identified as an OBC.21 We also consulted the
list of Scheduled Castes, Scheduled Tribes, and Other Backward Classes in the
Mandal Commission Report.22
The allocation of castes between the intermediate and backward groups was the
most difficult task and, given that the OBC category includes castes from both
groups, the most significant.23 Castes-clusters such as the Kurmi and Ahir/Goala/Yadav, for example, have been referred to as backward largely in terms of
their post-Independence political influence or share of government jobs. But as
groups practising the commendable occupations of agriculture and pastoralism in
the early to mid twentieth century, they had no difficulty finding Brahmins for
their ceremonies, and most castes would take water and food from them. In
socio-ritual terms—in essence what caste claims to be about—they were accorded
a respectable status in rural society.24 We therefore placed these and similar caste-
clusters within the intermediate group. Caste-clusters which, while not untouchable,
had difficulty securing a respectable Brahmin for their rituals and from whom
‘clean’ castes were reluctant to accept food or water, we placed in the backward
group.
Poverty and InequalityThe changing extent of rural poverty in the four states from 1958 to 1994 is indicated
in Figure 1. Taken from successive National Sample Surveys, it traces the
21 K. Suresh Singh (ed.), People Of India: An Introduction, National Series (New Delhi: Anthropological Survey of
India & OUP, 1992), appendix G. Further information on individual communities is found in volumes IV–VI of the
National Series.22 Backward Classes Commission, Reservations for Backward Classes, 1980 (Delhi: Akalank Publications, 1991).23 The need to divide the castes between the high castes and Scheduled Castes into two groups has been felt by offi-
cials and academics alike. In a government investigation of the backward classes in Bihar (the Mungeri Lall Com-
mission) Middle Caste Hindus were divided into two groups, Annexure I castes and Annexure II castes. The former
(the backward castes) included the Dhanuk and Mallah castes, and the latter (our intermediate caste group) included
the Yadav, Kurmi, and Koeri. See Shaibal Gupta, ‘New Panchayats and Subaltern Resurgence’, in Economic and
Political Weekly, Vol.XXXVI, no.29 (21 July 2001), p.2742. Harry Blair used the terms Upper Shudras and
Lower Shudras to make the same differentiation in Voting, Caste, Community, Society (New Delhi: Young Asia,
1979), p.5. L.R. Naik uses the term ‘Depressed Backward’ in his ‘Minute of Dissent’ to the Mandal Committee
Report in order to differentiate the castes with the lowest level of access to economic and educational opportunity
outside the Scheduled castes. See L.R. Naik, Report Of the Backward Classes Commission 1980 (Delhi: Govt. of
India, 1991), pp355–6. Anand Chakravarti, ‘Caste and Agrarian Class: A View from Bihar’, in Economic and Pol-
itical Weekly, Vol.XXXVI, no.17 (28 April 2001), Table 1, p.1454, groups castes such as the Yadavs and Kurmis as
‘Upper middle’, and divides them from castes such as the Telis and Hajams that he places in the ‘Lower middle’.24 For example, see the references to Kurmis and Goalas (now Yadavs) in H.H. Risley, The Tribes and Castes Of
Bengal, Ethnographic Glossary, Vol.I (Calcutta: Bengal Secretariat Press, 1891), pp.290, 535.
122 SOUTH ASIA
Dow
nloa
ded
By: [
Flin
ders
Uni
vers
ity o
f Sou
th A
ustra
lia] A
t: 02
:26
8 M
ay 2
007
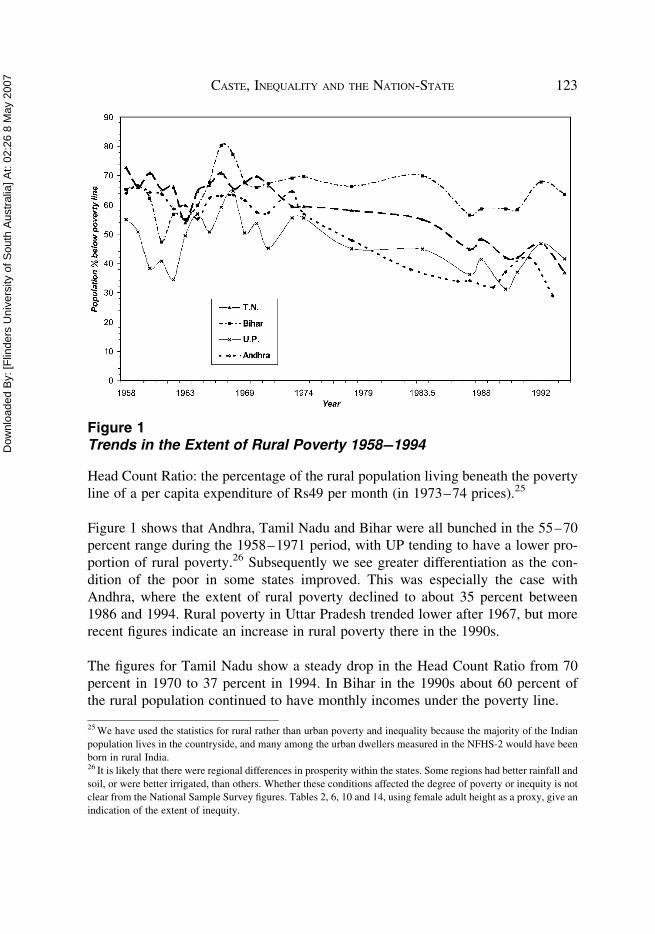
Head Count Ratio: the percentage of the rural population living beneath the poverty
line of a per capita expenditure of Rs49 per month (in 1973–74 prices).25
Figure 1 shows that Andhra, Tamil Nadu and Bihar were all bunched in the 55–70
percent range during the 1958–1971 period, with UP tending to have a lower pro-
portion of rural poverty.26 Subsequently we see greater differentiation as the con-
dition of the poor in some states improved. This was especially the case with
Andhra, where the extent of rural poverty declined to about 35 percent between
1986 and 1994. Rural poverty in Uttar Pradesh trended lower after 1967, but more
recent figures indicate an increase in rural poverty there in the 1990s.
The figures for Tamil Nadu show a steady drop in the Head Count Ratio from 70
percent in 1970 to 37 percent in 1994. In Bihar in the 1990s about 60 percent of
the rural population continued to have monthly incomes under the poverty line.
Figure 1Trends in the Extent of Rural Poverty 1958–1994
25 We have used the statistics for rural rather than urban poverty and inequality because the majority of the Indian
population lives in the countryside, and many among the urban dwellers measured in the NFHS-2 would have been
born in rural India.26 It is likely that there were regional differences in prosperity within the states. Some regions had better rainfall and
soil, or were better irrigated, than others. Whether these conditions affected the degree of poverty or inequity is not
clear from the National Sample Survey figures. Tables 2, 6, 10 and 14, using female adult height as a proxy, give an
indication of the extent of inequity.
CASTE, INEQUALITY AND THE NATION-STATE 123

Dow
nloa
ded
By: [
Flin
ders
Uni
vers
ity o
f Sou
th A
ustra
lia] A
t: 02
:26
8 M
ay 2
007
The pattern of change in the degree of rural inequality in the four states, measured by
the Gini coefficients in Figure 2, is somewhat different from the change in the extent
of rural poverty summarised in Figure 1.27 Between the late 1950s and the mid 1970s
there was a shallow reduction in rural inequality among all states. Subsequently, the
difference between the states increased. Andhra, the state showing the greatest
reduction in rural poverty, nevertheless retained much the same degree of inequality
in the mid 1990s as it had in the early 1960s, while Bihar, the poorest of the states,
gradually reduced its incidence of rural inequality over the same period. Tamil Nadu
generally experienced a higher degree of inequality than the other states. In Uttar
Pradesh inequality has varied within a wide range, but has usually been high and
greater than in Bihar.
Two points can be made about the trends of rural poverty and inequality in these four
states. First, until about 1970 there was little difference between the four states on
Figure 2Trends in Inequality 1958–1994
27 The larger the Gini coefficient the greater the inequality.
124 SOUTH ASIA

Dow
nloa
ded
By: [
Flin
ders
Uni
vers
ity o
f Sou
th A
ustra
lia] A
t: 02
:26
8 M
ay 2
007
either measure. From that time there was considerable differentiation. Second, no
common pattern emerges. In Andhra and Tamil Nadu the proportion of people sub-
sisting below the poverty line decreased, but a widening gap emerged between them
and those who had benefited from rural development. In Bihar, however, where rural
poverty continues at the same high levels, there is less inequality than previously. In
UP the incidence of rural poverty varied widely even as it gradually trended lower
overall—but rural inequality has remained substantial.
Politics, Caste and Standard of LivingIn this section of the paper we first discuss for each of the states the relationship
of caste and politics at the time of Independence. We then examine the trajectory
of well-being of the four caste groupings from 1950 to 1979, using trends in mean
adult female heights of females born in the period as our measuring rod, and
discuss the timing and nature of state reservation policy. The standard of living
of a sample of families is then used to assess the situation of each caste
group in 1998–99. We conclude with a consideration of contemporary caste
politics.
Tables 1, 5, 9 and 13 display for each of the four states the changing mean heights of
women from the four groupings of Hindu castes. The tables include tests for signifi-
cance of difference between the means of the high and intermediate groups with
those of the backward castes and Scheduled Castes, respectively. In Andhra and
Tamil Nadu the small numbers of high caste women in the sample is representative
of the size of the group in those states. Though the statistical measures take the size
of the sample into consideration, we think the figures should be seen, at best, as
indicative. In some cases there are insufficient observations to risk a calculation.
Tables 2, 6, 10 and 14 disaggregate the data on women’s heights among the
regions used by the National Sample Survey Organisation. In Tables 3, 7, 11 and
15 the data on the standard of living of the families assessed in 1998–99 allows
us to estimate the relative welfare of the different caste groupings and larger
caste-clusters for each of the states. This data is then disaggregated among the
regions in Tables 4, 8, 12 and 16.
Andhra Pradesh
Andhra Pradesh was formed in 1956 from the Telegu-speaking parts of Madras
Presidency (coastal Andhra and inland Rayalaseema) and the princely state of
Hyderabad (Telengana). In coastal Andhra, a well-irrigated and prosperous region,
the Kamma and Kapus (sometimes identified as Reddys) were the most important
CASTE, INEQUALITY AND THE NATION-STATE 125
Dow
nloa
ded
By: [
Flin
ders
Uni
vers
ity o
f Sou
th A
ustra
lia] A
t: 02
:26
8 M
ay 2
007
caste-clusters. In Rayalaseema, a less developed set of districts, the Reddys and
Kammas were the dominant landed groups.
After the accession of Hyderabad state to India, Reddys became the dominant caste-
cluster in Telengana. As tenant farmers in the 1940s they had led the agrarian agita-
tion against the nizam and his landlord supporters. The violence used to put down this
agitation, and the reluctance of the ruler to accede to India at Independence, led to a
‘police action’ by the Indian Army in 1948, the inclusion of Hyderabad in the Indian
Union, and a redistribution of the land. In the redistribution, the Kapu-Reddys
secured the better land, while some of the lower castes and dalits received land
that had previously been waste or used for common pastures. The Kapu-Reddys
gained further land by buying up land from the large landlords who moved out of
the villages. The dalits who had tilled the landlords’ land remained landless.28
During the early post-Independence period Reddys—mainly from Ryalaseema—
dominated the Congress organisation in the Telegu-speaking parts of Madras state,
and played a significant role in successive state Congress governments; whereas
many of the Kamma politicians were aligned with the Communist Party of India
(CPI)—some for ideological reasons, others possibly through their competition
with the Reddys.29 Yet it is unwise to make too much of Kamma–Reddy rivalry:
in the elections of 1952 and 1955 there were more Kamma candidates for Congress
than there were Reddys.30 But Party leadership remained in the hands of the Reddys.
As we saw in Figure 1, poverty declined substantially in Andhra Pradesh from the
early 1970s. The economy benefited from technological advances such as rural
electrification and tube-wells that opened up previously-dry regions to the intro-
duction of new commercial crops. The Andhra government was also, probably
of all the state governments, the most energetic in implementing the anti-poverty
policies of the central government; and it also initiated several measures of its
own in this respect, such as allowing (in 1968) the landless to encroach on and cul-
tivate small areas of government wasteland, and (in the early 1980s) subsidising a
quarter of each labouring households’ monthly rice needs at Rs2 per kilogram.31
But it is also clear from the trends in Figure 2 that the degree of inequality in
the state remained substantial. Table 1 indicates the share of the different groups
28 K.Srinivasulu, ‘Caste, Class and Social Articulation in Andhra Pradesh: Mapping Different Regional Trajec-
tories’, Working Paper 179 (London: Overseas Development Institute, 2002), p.6.29 Selig Harrison, India, the Most Dangerous Decades (Princeton: Princeton University Press, 1960), p.212.30 K.C. Suri, ‘Democratic Process and Electoral Politics in Andhra Pradesh, India’, Working Paper 180 (London:
Overseas Development Institute, Sept. 2002), p.59.31 Lucia Da Corta and Davuluri Venkatateshwarlu, ‘Unfree Relations and the Feminisation Of Agricultural Labour in
Andhra Pradesh, 1970–95’, in Journal of Peasant Studies, Vol.26, nos.2 & 3 (1999), pp.76, 83
126 SOUTH ASIA

Dow
nloa
ded
By: [
Flin
ders
Uni
vers
ity o
f Sou
th A
ustra
lia] A
t: 02
:26
8 M
ay 2
007
Table 1Mean Heights (in cms) of Females Aged 20–49 by Birth Cohort in Andhra Pradesh
Caste group
1950–59 1960–69 1970–79
n Mean s.d. n Mean s.d. n Mean s.d.
High 31 150.37 5.98 43 151.68 6.79 45 151.51 4.28
Intermediate 263 151.41 6.22 379 151.75 5.43 486 152.26 5.47
Backward 183 150.53 5.36 247 150.73 5.91 363 152.08 5.29
Muslim 48 151.40 5.51 57 151.68 5.56 89 151.96 6.10
Scheduled Caste 177 149.54 5.28 262 149.68 5.10 335 149.81 5.12
Difference of means
Md p Md p Md p
High & Backward 20.16 (20.13)a 0.95 (0.87) 20.57 (20.81)
High & Scheduled Caste 0.83 (0.72) 2.00 (1.86)�b 1.70 (2.44)��
Intermediate & Backward 0.88 (1.60) 1.02 (2.04)�� 0.18 (0.50)
Intermediate & Scheduled 1.88 (3.39)��� 2.07 (4.92)��� 2.45 (6.55)���
Notes: Md difference of means
p significance of difference of meansa t-ratios are shown in parenthesisb � indicates significant at the ten percent significance level, �� significant at the five percent level, and ��� significant at the one percent level.
Source: IIPS, NFHS-2, http://www.measuredhs.com
CA
ST
E,IN
EQ
UA
LIT
YA
ND
TH
EN
AT
ION
-ST
AT
E127
Dow
nloa
ded
By: [
Flin
ders
Uni
vers
ity o
f Sou
th A
ustra
lia] A
t: 02
:26
8 M
ay 2
007
of castes in the improved prosperity of Andhra over the period from 1950 to
1980.32
Three aspects of the data in Table 1 are important. First, the height of women from
most of the groups gradually increased, indicating that, during these thirty years, the
nutritional environment was improving.33 This supports the view that there was a
general improvement in well-being over the period from the 1950s to the early
1980s.34
Second, during the 1950–1979 period, the backward castes improved their welfare at a
similar rate to castes higher on the socio-ritual scale. There was no significant difference
between the mean heights of backward and high caste women for any of the birth
cohorts; and this was also the case for the backward and intermediate caste women,
apart from the 1960–69 birth cohort. Indeed, infant females from the backward group
experienced the greatest improvement in their living conditions over the period.
However the data shows that most of the improvement came in the 1970s. Srinivasulu
places ‘the emergence of an educated and peasant middle class’ from the backward caste
group in the late 1970s and early 1980s, and attributes this to the development activities
of the state, the technological advances in agriculture, and the availability of education in
rural areas.35 The reservations of government jobs for backward castes by Congress in
1950 fitted neatly with the increased availability of education in the villages. The
improvement of the condition of some among this group may also reflect benefits result-
ing from the ability of the landless to encroach on government land after 1968.
Finally, and most importantly, the difference between the mean heights of women in
the intermediate and Scheduled Caste groups is strongly significant and increasing.
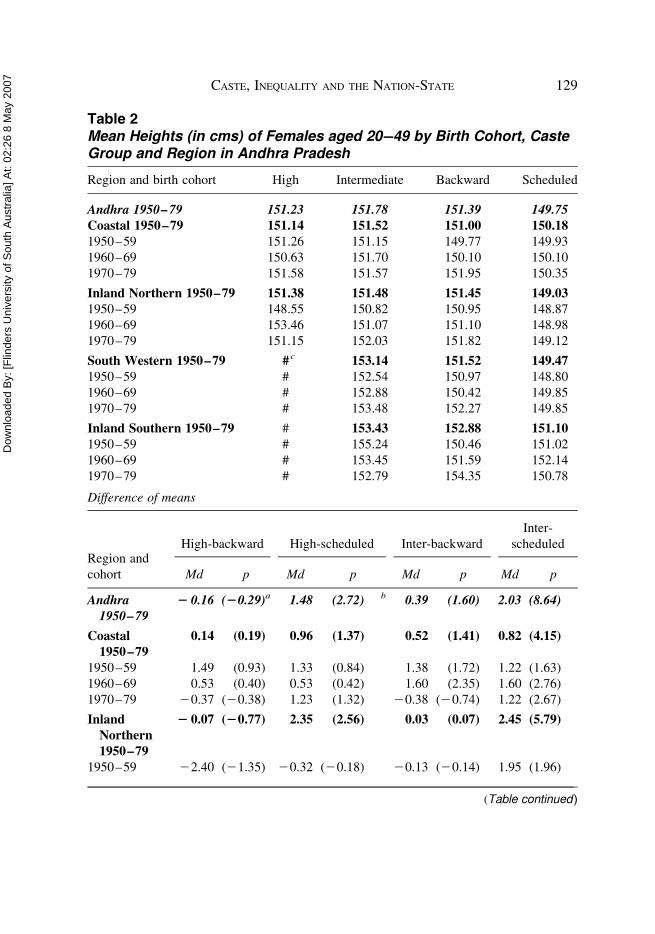
In the regional disaggregation in Table 2, the Inland Northern region corresponds to
Telengana; the South-Western and Inland Southern together comprise Rayalaseema;
and the Andhra Coastal corresponds to the coastal districts.36 The disaggregated
32 Because the means are so similar, variations in Standard Deviation and Coefficient of Variation are very similar.
We therefore entered only SD in the table. There appears to be no trend in dispersion for any of the caste groups.33 A small proportion of the apparent secular increase in height over the period is due to the decline in height that
occurs in humans after the age of 40.34 The mean height of high caste women, overwhelmingly Brahmins in the survey, only gradually became signifi-
cantly different from that of the Scheduled Caste women. This is reflected in the regional figures but the number
of high caste women was very small, and not too much can be made from the figures.35 Srinivasulu, ‘Caste, Class and Social Articulation’, p.13.36 The correspondence of the districts in Andhra (and in the other three states) with the National Sample Survey
regions used in this paper is derived from the work of Mamta Murthi, P.V. Srinivasan and S.V. Subramanian,
‘Linking Indian Census with National Sample Survey’, in Economic and Political Weekly, Vol.36, no.9 (3 Mar.
2001), pp.783–92.
128 SOUTH ASIA
Dow
nloa
ded
By: [
Flin
ders
Uni
vers
ity o
f Sou
th A
ustra
lia] A
t: 02
:26
8 M
ay 2
007
Table 2Mean Heights (in cms) of Females aged 20–49 by Birth Cohort, CasteGroup and Region in Andhra Pradesh
Region and birth cohort High Intermediate Backward Scheduled
Andhra 1950–79 151.23 151.78 151.39 149.75Coastal 1950–79 151.14 151.52 151.00 150.18
1950–59 151.26 151.15 149.77 149.93
1960–69 150.63 151.70 150.10 150.10
1970–79 151.58 151.57 151.95 150.35
Inland Northern 1950–79 151.38 151.48 151.45 149.031950–59 148.55 150.82 150.95 148.87
1960–69 153.46 151.07 151.10 148.98
1970–79 151.15 152.03 151.82 149.12
South Western 1950–79 # c 153.14 151.52 149.47
1950–59 # 152.54 150.97 148.80
1960–69 # 152.88 150.42 149.85
1970–79 # 153.48 152.27 149.85
Inland Southern 1950–79 # 153.43 152.88 151.10
1950–59 # 155.24 150.46 151.02
1960–69 # 153.45 151.59 152.14
1970–79 # 152.79 154.35 150.78
Difference of means
Region and
cohort
High-backward High-scheduled Inter-backward
Inter-
scheduled
Md p Md p Md p Md p
Andhra1950–79
2 0.16 (20.29)a 1.48 (2.72)���b 0.39 (1.60) 2.03 (8.64)���
Coastal
1950–79
0.14 (0.19) 0.96 (1.37) 0.52 (1.41) 0.82 (4.15)���
1950–59 1.49 (0.93) 1.33 (0.84) 1.38 (1.72)� 1.22 (1.63)
1960–69 0.53 (0.40) 0.53 (0.42) 1.60 (2.35)�� 1.60 (2.76)���
1970–79 20.37 (20.38) 1.23 (1.32) 20.38 (20.74) 1.22 (2.67)���
Inland
Northern
1950–79
2 0.07 (20.77) 2.35 (2.56)�� 0.03 (0.07) 2.45 (5.79)���
1950–59 22.40 (21.35) 20.32 (20.18) 20.13 (20.14) 1.95 (1.96)��
(Table continued )
CASTE, INEQUALITY AND THE NATION-STATE 129

Dow
nloa
ded
By: [
Flin
ders
Uni
vers
ity o
f Sou
th A
ustra
lia] A
t: 02
:26
8 M
ay 2
007
evidence reveals a pattern similar to the statewide one observed above. This is
especially marked in respect of the welfare gap between girls born into families
from the intermediate group over those from the Scheduled Castes—which reflects
both the economic and social dominance of castes such as the Kammas and Reddys,
who increased their landholdings during the early years of Independence, and
the persistently depressed situation of the Scheduled Castes during this period.
We can only suggest that the Scheduled Castes did not benefit as much as the back-
ward castes from reservations and the relaxation of the anti-encroachment policy
because their access to these measures was successfully resisted by the locally-
dominant groups.
This was certainly the case in Telengana. In northern Telengana in the late 1970s the
lower castes came under a great deal of stress. Competition with cheap manufactured
Table 2 Continued
Difference of means
Region and
cohort
High-backward High-scheduled Inter-backward
Inter-
scheduled
Md p Md p Md p Md p
1960–69 2.36 (1.19) 4.48 (2.27)�� 20.03 (20.04) 2.09 (2.87)���
1970–79 20.67 (20.68) 2.03 (1.99)�� 0.21 (0.37) 2.91 (4.81)���
South-
Western
1950–79
# # 1.62 (2.16)�� 3.67 (4.65)���
1950–59 # # 1.57 (0.92) 3.34 (2.08)��
1960–69 # # 2.46 (1.64) 3.60 (2.45)��
1970–79 # # 1.21 (1.21) 3.63 (3.32)���
Inland
Southern
1959–79
# # 0.55 (0.48) 2.33 (2.88)���
1950–59 # # 4.78 (2.13)�� 4.22 (1.93)�
1960–69 # # 1.86 (0.64) 1.31 (0.69)
1970–79 # # 21.56 (21.12) 2.01 (1.99)��
Notes: Md difference of means
p significance of difference of meansa t-ratios are shown in parenthesis.b � indicates significant at the ten percent significance level, �� significant at the five percent level, and ��� significant
at the one percent level.c # insufficient observations
Source: IIPS, NFHS-2, http://www.measuredhs.com
130 SOUTH ASIA

Dow
nloa
ded
By: [
Flin
ders
Uni
vers
ity o
f Sou
th A
ustra
lia] A
t: 02
:26
8 M
ay 2
007
footwear, cloth and utensils forced rural artisans into the agricultural labour market.
The Madigas, as leatherworkers, were especially affected. The landowners persisted
with traditional methods of exploitation, and an agrarian movement against them
gathered pace. The movement’s demands included the end of forced labour, the
return of illegally occupied land, and increased wages for workers. The organisations
working for the poor used demonstrations, social boycotts, and strikes as weapons.
However as the pressure from below increased, the landlords began resorting to vio-
lence, and the workers responded in kind. The breakdown in law and order brought
state repression against the workers.37
In 1982 N.T. Rama Rao (NTR) gained the support of his fellow Kammas when he set
up the Telegu Desam Party (TDP) during a period of increasing central interference
in Andhra Congress politics.38 He also gained the support of the backward castes
who, K.C. Suri points out, had become disenchanted with the Congress from the
1970s because they believed central government anti-poverty programs had been
focussed on the Scheduled Castes, to their detriment.39 NTR attempted to weld
the backward castes to his party in 1986 by increasing the reservations for them
Table 3Standard of Living of Caste Groups & Clusters inAndhra Pradesh 1998–99
Caste group & cluster
Percentage of group/cluster
by standard of living
Low Medium High
High 9.4 38.6 52.0
Brahmin 9.6 40.4 50.0
Intermediate 26.8 52.6 20.6
Kapu 22.8 55.9 21.3
Kamma 9.1 36.4 54.5
Backward 40.3 47.2 12.6
Goud/Setti-Balija 30.9 52.5 16.6
Scheduled Caste 56.9 38.8 4.3
Madiga 64.7 34.5 0.9
Mala 52.8 41.2 6.0
Source: IIPS, NFHS-2, http://www.measuredhs.com
37 Srinivasulu, ‘Caste, Class and Social Articulation’, pp.19–23.38 Suri, ‘Democratic Process’, pp.35, 77.39 Ibid., p.60.
CASTE, INEQUALITY AND THE NATION-STATE 131
Dow
nloa
ded
By: [
Flin
ders
Uni
vers
ity o
f Sou
th A
ustra
lia] A
t: 02
:26
8 M
ay 2
007
from the 25 percent introduced by the Congress in 1951 to 44 percent. As Andhra
descended into a welter of pro- and anti-reservation agitation, the state High Court
declared the new regulation unconstitutional and NTR withdrew it—an action
that, however, triggered further agitation.40
By 1983 the resentment of dominant groups in the districts of coastal Andhra against
Scheduled Caste assertiveness had reached boiling point. A series of well-planned
murderous attacks on dalits followed. Led by those within their ranks who had
managed to acquire an education, and who had gained secure employment under
the reservation system, the dalits responded by launching a campaign to dramatise
their oppression and economic exploitation.41 The result in both regions was that
caste conflict merged into class warfare.
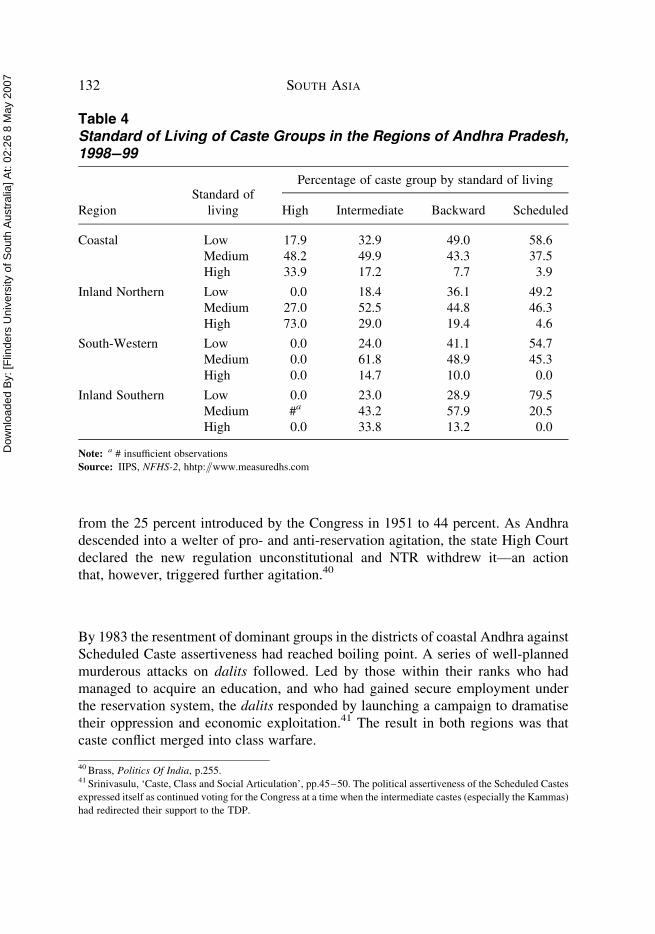
Table 4Standard of Living of Caste Groups in the Regions of Andhra Pradesh,1998–99
Region
Standard of
living
Percentage of caste group by standard of living
High Intermediate Backward Scheduled
Coastal Low 17.9 32.9 49.0 58.6
Medium 48.2 49.9 43.3 37.5
High 33.9 17.2 7.7 3.9
Inland Northern Low 0.0 18.4 36.1 49.2
Medium 27.0 52.5 44.8 46.3
High 73.0 29.0 19.4 4.6
South-Western Low 0.0 24.0 41.1 54.7
Medium 0.0 61.8 48.9 45.3
High 0.0 14.7 10.0 0.0
Inland Southern Low 0.0 23.0 28.9 79.5
Medium #a 43.2 57.9 20.5
High 0.0 33.8 13.2 0.0
Note: a # insufficient observations
Source: IIPS, NFHS-2, hhtp://www.measuredhs.com
40 Brass, Politics Of India, p.255.41 Srinivasulu, ‘Caste, Class and Social Articulation’, pp.45–50. The political assertiveness of the Scheduled Castes
expressed itself as continued voting for the Congress at a time when the intermediate castes (especially the Kammas)
had redirected their support to the TDP.
132 SOUTH ASIA
Dow
nloa
ded
By: [
Flin
ders
Uni
vers
ity o
f Sou
th A
ustra
lia] A
t: 02
:26
8 M
ay 2
007
Through the later 1990s the TDP-controlled government of Andhra inaugurated an
era of development, first in agriculture and later in technology. Table 3 enables us to
look directly at the relationship between caste and standard of living at the close of
the century.
Most of the high and intermediate caste groups in our sample enjoy high or medium
standards of living, while large proportions of the backward and Scheduled Caste
groups experience a low standard of living. However, the association between
caste and standard of living is not clear-cut. Nearly ten percent of the high caste
families in the sample live in poor circumstances and a smaller, but still notable, pro-
portion of Scheduled Caste families enjoy a high standard of living. That a consider-
able proportion of each group experiences a medium standard of living is also
important.
There is considerable variation between the four regions, but the pattern of relative
welfare outlined above remains intact. There are too few families in the regional
samples to make much of the figures for the high caste group, but the intermediate
caste group is stronger in each of the regions than the backward group, which in turn
is doing better than the Scheduled Caste group. The general poverty of the latter is
clear, but their dire situation in Rayalaseema is starkly obvious.
The situation in rural Andhra in the 1990s represents the mature phase of the intro-
duction of the high yielding varieties and the associated cultivation and irrigation
practices. Real wages improved in Andhra following the introduction of high yield-
ing varieties in the 1970s. But the standard of living of the lower castes did not make
a comparable improvement. Lucia da Corta and Davuluri Venkateshwarlu in their
study of a rural area in Rayalaseema, attribute this to changes in the strategies of
traders and big peasant farmers faced with higher prices and wages respectively.
The traders advanced loans to the small-holders in return for contracts to buy the
produce at lower than market prices; the landowners leased out land or extended
credit to the small-holders in return for tied (often female) labour at lower wages.
Another factor leading to the continued poverty of Scheduled Caste and backward
families was the alcohol consumption of the males—a practice initially encouraged
by government policy.42
The proliferation of dalit and agrarian movements in Andhra since the 1970s is not
surprising, given the distinction in well-being between the high and intermediate
caste groups and those in the backward and Scheduled Caste groups. The reservation
of government jobs for the latter for half a century, together with other policies
42 Da Costa and Venkateshwarlu, ‘Unfree Relations’, pp.75–6, 97, 107.
CASTE, INEQUALITY AND THE NATION-STATE 133
Dow
nloa
ded
By: [
Flin
ders
Uni
vers
ity o
f Sou
th A
ustra
lia] A
t: 02
:26
8 M
ay 2
007
targeted at the alleviation of poverty have improved the circumstances of some from
the lower caste groups, but only some—and even this is problematic. About a third of
Scheduled Caste families now enjoy medium standards of living, equivalent to a
similar proportion of the high and intermediate groups. This material improvement,
along with the more assertive behaviour that typically accompanies it, is bitterly
resented by the poorer sections of the latter caste-clusters. But over half the Sched-
uled Caste families are poor, and perceive the high and intermediate landholders as
the reason for their poverty. Caste and class are thus tightly linked in Andhra and
though, since the mid-1970s, the dalit and backward castes movements have
struggled to find a solution, they have not yet been able to find a suitable political
vehicle for their aspirations.
Tamil Nadu
The Congress under the leadership of C. Rajagopalachari returned to power in Madras
after the 1946 elections and almost immediately issued an order allocating govern-
ment jobs on a caste basis. For the first time this included a share (14 percent) for back-
ward castes, largely as a result of pressure from the Dravida Kazhagam led by Periyar
E.V. Ramaswamy. However the order was quashed by the Supreme Court in 1950 on
the petition of two Brahmins.43 The Dravida Kazhagam agitated against the decision
to such effect that the Government of India introduced an amendment to Article 15 of
the new constitution that had guaranteed that the State would not discriminate against
any citizen. The amendment provided that ‘Nothing in this article. . .shall prevent the
State from making any special provision for the advancement of any socially and edu-
cationally backward classes of citizens or from the Scheduled Castes and Tribes’.44
These amendments made it possible for the Congress government in Madras to
make an order in 1951 reserving 25 percent of state government posts for the back-
ward castes and 16 percent for the Scheduled Castes.45
But these provisions did not satisfy all of the backward castes: the Vanniars in
particular, numerous and with a history of vigorous associational activity, took
advantage of the introduction of adult franchise in the 1952 elections to force them-
selves into the electoral arena. Though divided into two parties, they were able to
capture a number of seats, to provide two ministers in Kamaraj’s cabinet, and to
use this influence to penetrate further into local-level politics. They sought greater
43 G.V.K. Aasaan, ‘Dravidar Kazhagam’, in The Modern Rationalist, Vol.26, no.7 (Oct. and Nov. 2001) [http://
www.themronline.com/2001iom1.html, accessed 2 May 2004].44 Article 15, clause 4, The Constitution Of India (Delhi: 1958), p.8. See also Article 16, clause 4 that enabled the
State to make ‘provision for the reservation of appointments or posts in favour of any backward class of citizens
which, in the opinion of the State, is not adequately represented in the services under the State.’ Ibid., p.9.45 Ghanshyam Shah, ‘Social Backwardness and Politics Of Reservations’, in Economic and Political Weekly, Vol.26
(Mar. 1991), p.606; and Brass, Politics Of India, pp.253–4.
134 SOUTH ASIA
Dow
nloa
ded
By: [
Flin
ders
Uni
vers
ity o
f Sou
th A
ustra
lia] A
t: 02
:26
8 M
ay 2
007
educational opportunities, secure jobs in the public service, and guaranteed positions
on the Congress electoral ticket.46
The politics born of the Non-Brahmin and Self-Respect movements of the first half
of the twentieth century, which created the Dravida Kazhagam, later found
expression in the Dravida Munnetra Kazhagam (DMK) and the breakaway All
India Annadurai Dravida Munnetra Kazhagam (AIADMK). These parties now
occupy the centre of the political stage in Tamil Nadu; and each seeks to attract back-
ward caste support by increasing their share of reservations in the state bureaucracy.
In 1970 the first DMK government extended the public service reservation for back-
ward caste members to 33 percent. It also lifted the Scheduled Castes and Tribes
allocation from 16 to 18 percent.
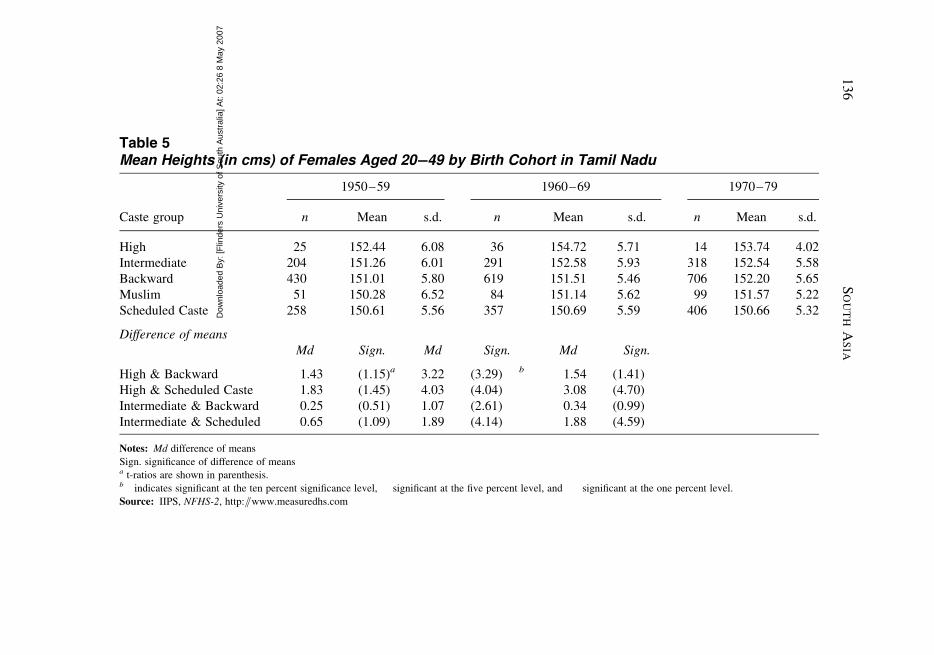
The improvement in the well-being of most groups in Tamil Nadu between the 1950s
and 1970s is captured in Table 5. But the lack of increase in the mean height of
Scheduled Caste females indicates that the benefits were not evenly spread—
confirming the message of Figure 2. Among those born in the 1950s there was no
significant difference between the mean adult heights of women from the intermedi-
ate caste and Scheduled Castes groupings but in the two subsequent decades the
difference became significant at the 1 percent level. One sees a similar divergence
in the heights of women from the high and Scheduled Caste groupings. This indi-
cates that during the 1960s, caste-clusters among the intermediate and high group-
ings were able to take advantage of the growth of the economy.
Second, only among the 1960s cohort is the mean height of women from the back-
ward caste group significantly different from that of high and intermediate caste
women. After this, the conditions in which infant girls from the backward castes
were nurtured improved faster, relative to those in which girls from the other
caste groups developed.47
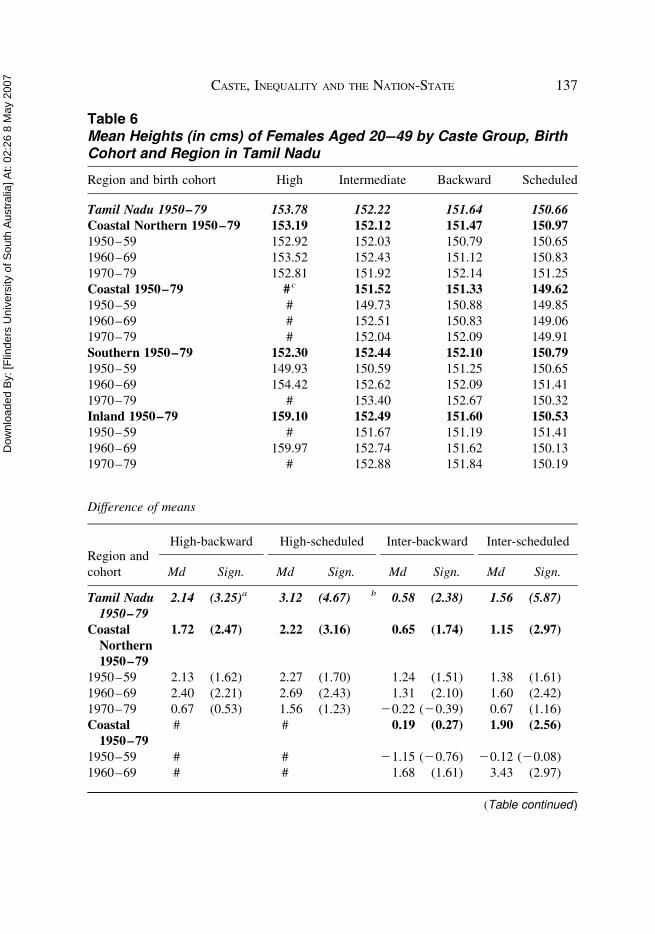
When the data is disaggregated into the main NSSO regions48 in Table 6, much the
same relationships appear, though they are not as clear-cut as in Table 5. In most
regions girls born into families from the intermediate caste groups at some point
experience significantly better conditions than Scheduled Caste girls from the
46 Lloyd I. Rudolph and Susanne Hoeber Rudolph, The Modernity Of Tradition (Chicago: University of Chicago
Press, 1967), pp.54–61.47 There is no evidence of increasing or decreasing variation within the caste groups.48 There have been a number of changes in district boundaries and names since Independence. The NSSO regions
used here relate to the following 1987–88 districts: ‘Coastal Northern’ to those around Chennai, and North and
South Arcot; ‘Coastal’ to Thanjavur, Pudukkotai and Tiruchirapalli; ‘Southern’ to Madurai, Tirunelveli, Kanniya-
kumari and Ramnad; and ‘Inland’ to Coimbatore, Nilgiri, Periyar, Salem and Dharampuri.
CASTE, INEQUALITY AND THE NATION-STATE 135
Dow
nloa
ded
By: [
Flin
ders
Uni
vers
ity o
f Sou
th A
ustra
lia] A
t: 02
:26
8 M
ay 2
007
Table 5Mean Heights (in cms) of Females Aged 20–49 by Birth Cohort in Tamil Nadu
Caste group
1950–59 1960–69 1970–79
n Mean s.d. n Mean s.d. n Mean s.d.
High 25 152.44 6.08 36 154.72 5.71 14 153.74 4.02
Intermediate 204 151.26 6.01 291 152.58 5.93 318 152.54 5.58
Backward 430 151.01 5.80 619 151.51 5.46 706 152.20 5.65
Muslim 51 150.28 6.52 84 151.14 5.62 99 151.57 5.22
Scheduled Caste 258 150.61 5.56 357 150.69 5.59 406 150.66 5.32
Difference of means
Md Sign. Md Sign. Md Sign.
High & Backward 1.43 (1.15)a 3.22 (3.29)���b 1.54 (1.41)
High & Scheduled Caste 1.83 (1.45) 4.03 (4.04)��� 3.08 (4.70)���
Intermediate & Backward 0.25 (0.51) 1.07 (2.61)��� 0.34 (0.99)
Intermediate & Scheduled 0.65 (1.09) 1.89 (4.14)��� 1.88 (4.59)���
Notes: Md difference of means
Sign. significance of difference of meansa t-ratios are shown in parenthesis.b � indicates significant at the ten percent significance level, �� significant at the five percent level, and ��� significant at the one percent level.
Source: IIPS, NFHS-2, http://www.measuredhs.com
136
SO
UT
HA
SIA
Dow
nloa
ded
By: [
Flin
ders
Uni
vers
ity o
f Sou
th A
ustra
lia] A
t: 02
:26
8 M
ay 2
007
Table 6Mean Heights (in cms) of Females Aged 20–49 by Caste Group, BirthCohort and Region in Tamil Nadu
Region and birth cohort High Intermediate Backward Scheduled
Tamil Nadu 1950–79 153.78 152.22 151.64 150.66Coastal Northern 1950–79 153.19 152.12 151.47 150.97
1950–59 152.92 152.03 150.79 150.65
1960–69 153.52 152.43 151.12 150.83
1970–79 152.81 151.92 152.14 151.25
Coastal 1950–79 # c 151.52 151.33 149.62
1950–59 # 149.73 150.88 149.85
1960–69 # 152.51 150.83 149.06
1970–79 # 152.04 152.09 149.91
Southern 1950–79 152.30 152.44 152.10 150.79
1950–59 149.93 150.59 151.25 150.65
1960–69 154.42 152.62 152.09 151.41
1970–79 # 153.40 152.67 150.32
Inland 1950–79 159.10 152.49 151.60 150.53
1950–59 # 151.67 151.19 151.41
1960–69 159.97 152.74 151.62 150.13
1970–79 # 152.88 151.84 150.19
Difference of means
Region and
cohort
High-backward High-scheduled Inter-backward Inter-scheduled
Md Sign. Md Sign. Md Sign. Md Sign.
Tamil Nadu1950–79
2.14 (3.25)a��� 3.12 (4.67)��� b 0.58 (2.38)�� 1.56 (5.87)���
Coastal
Northern
1950–79
1.72 (2.47)�� 2.22 (3.16)��� 0.65 (1.74)� 1.15 (2.97)���
1950–59 2.13 (1.62) 2.27 (1.70)� 1.24 (1.51) 1.38 (1.61)
1960–69 2.40 (2.21)�� 2.69 (2.43)�� 1.31 (2.10)�� 1.60 (2.42)��
1970–79 0.67 (0.53) 1.56 (1.23) 20.22 (20.39) 0.67 (1.16)
Coastal
1950–79
# # 0.19 (0.27) 1.90 (2.56)��
1950–59 # # 21.15 (20.76) 20.12 (20.08)
1960–69 # # 1.68 (1.61) 3.43 (2.97)���
(Table continued )
CASTE, INEQUALITY AND THE NATION-STATE 137
Dow
nloa
ded
By: [
Flin
ders
Uni
vers
ity o
f Sou
th A
ustra
lia] A
t: 02
:26
8 M
ay 2
007
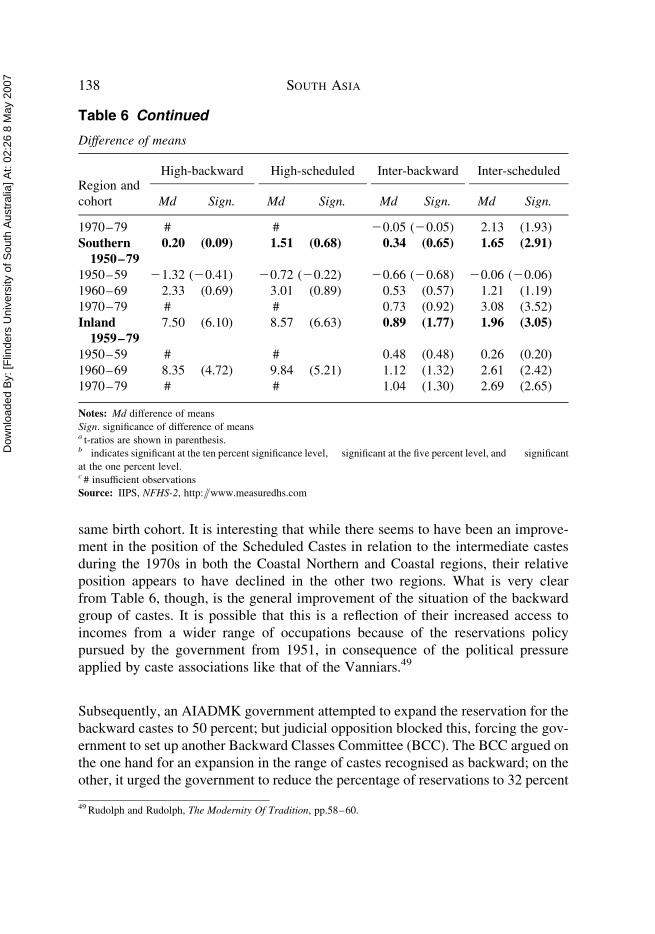
same birth cohort. It is interesting that while there seems to have been an improve-
ment in the position of the Scheduled Castes in relation to the intermediate castes
during the 1970s in both the Coastal Northern and Coastal regions, their relative
position appears to have declined in the other two regions. What is very clear
from Table 6, though, is the general improvement of the situation of the backward
group of castes. It is possible that this is a reflection of their increased access to
incomes from a wider range of occupations because of the reservations policy
pursued by the government from 1951, in consequence of the political pressure
applied by caste associations like that of the Vanniars.49
Subsequently, an AIADMK government attempted to expand the reservation for the
backward castes to 50 percent; but judicial opposition blocked this, forcing the gov-
ernment to set up another Backward Classes Committee (BCC). The BCC argued on
the one hand for an expansion in the range of castes recognised as backward; on the
other, it urged the government to reduce the percentage of reservations to 32 percent
Table 6 Continued
Difference of means
Region and
cohort
High-backward High-scheduled Inter-backward Inter-scheduled
Md Sign. Md Sign. Md Sign. Md Sign.
1970–79 # # 20.05 (20.05) 2.13 (1.93)�
Southern
1950–79
0.20 (0.09) 1.51 (0.68) 0.34 (0.65) 1.65 (2.91)���
1950–59 21.32 (20.41) 20.72 (20.22) 20.66 (20.68) 20.06 (20.06)
1960–69 2.33 (0.69) 3.01 (0.89) 0.53 (0.57) 1.21 (1.19)
1970–79 # # 0.73 (0.92) 3.08 (3.52)���
Inland
1959–79
7.50 (6.10)��� 8.57 (6.63)��� 0.89 (1.77)� 1.96 (3.05)���
1950–59 # # 0.48 (0.48) 0.26 (0.20)
1960–69 8.35 (4.72)��� 9.84 (5.21)��� 1.12 (1.32) 2.61 (2.42)��
1970–79 # # 1.04 (1.30) 2.69 (2.65)���
Notes: Md difference of means
Sign. significance of difference of meansa t-ratios are shown in parenthesis.b � indicates significant at the ten percent significance level, �� significant at the five percent level, and ��� significant
at the one percent level.c # insufficient observations
Source: IIPS, NFHS-2, http://www.measuredhs.com
49 Rudolph and Rudolph, The Modernity Of Tradition, pp.58–60.
138 SOUTH ASIA

Dow
nloa
ded
By: [
Flin
ders
Uni
vers
ity o
f Sou
th A
ustra
lia] A
t: 02
:26
8 M
ay 2
007
so that the total of reserved jobs would not exceed 50 percent. The government did
not respond to this politically difficult proposition.50 The next step, taken in 1989,
was the DMK government’s excision of 20 percent of the OBC quota reserved for
the Most Backward Castes in response to pressure exerted by the Vannia caste,
which remained large and well-organised, but backward. As Brass points out, this
process has resulted in substantial provisions for the backward castes and ‘a situation
in which the reserved list has become an open arena of contestation among the
majority of caste groups. . .both for recognition as “backward” and for a special
place on the reserved list’.51 The data in Tables 5 and 6 suggests a substantive ration-
ale. Why the Scheduled Castes were not as successful in the ‘arena’ remains,
however, unclear.
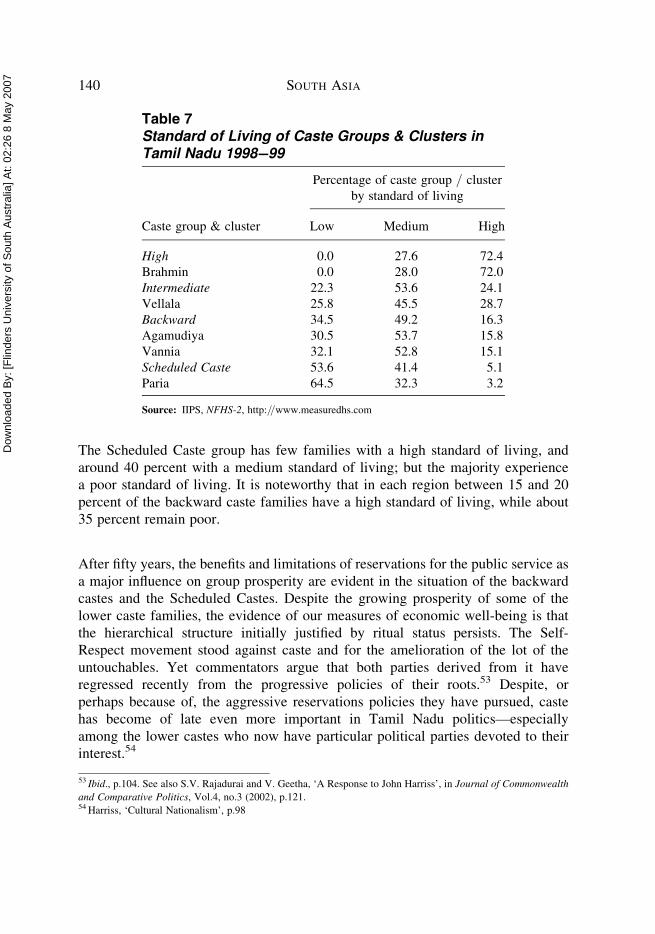
The decade following these changes to the reservation structure saw strong econ-
omic development in Tamil Nadu. Yet there does not appear to have been any sig-
nificant change over the decade in the distribution pattern of economic benefits as
between caste groupings (Table 7). Despite exercising little political or administra-
tive power, the high castes (mainly Brahmins) retained their economic position
through their pre-eminence in the professions and their growing strength in the
business world.52
The table reveals some differentiation between the intermediate and backward
groups, but the patterns are very similar, with the largest proportion of each of
these groups having a medium standard of living. A substantial number of Scheduled
Caste families are shown to enjoy these days a medium standard of living: but the
majority remain poor.
There is a remarkable consistency of the ranking of the caste groups across regions as
shown in Table 8. However there are insufficient members of high castes in the
sample to do anything but suggest that few are poor in any region, and the main
comparisons must be between the other groups. In the Coastal region the patterns
of well-being of the families from the intermediate and backward groups are
almost indistinguishable. But elsewhere the proportions of each group in the three
categories of standard of living are similar to the pattern of the state as a whole.
50 The 50 percent rule seems to have been applied by the courts as an ad hoc method of balancing the social justice
claims of the lower castes against the argument that only the best possible candidates should be selected. Justice Dr.
P. Venugopal, ‘The Drawbacks and Difficulties in Implementing the Reservation Policy by State Governments’, in
The Modern Rationalist, Vol.26, no.7 (Oct. and Nov., 2001), passim [http://www.themronline.com/2001iom1.html,
accessed 2 May 2004].51 Brass, Politics Of India, pp.254–5.52 See John Harriss, ‘Whatever Happened to Cultural Nationalism in Tamil Nadu?’, in Journal of Commonwealth
and Comparative Studies, Vol.4, no.3 (2002), pp.102–3.
CASTE, INEQUALITY AND THE NATION-STATE 139
Dow
nloa
ded
By: [
Flin
ders
Uni
vers
ity o
f Sou
th A
ustra
lia] A
t: 02
:26
8 M
ay 2
007
The Scheduled Caste group has few families with a high standard of living, and
around 40 percent with a medium standard of living; but the majority experience
a poor standard of living. It is noteworthy that in each region between 15 and 20
percent of the backward caste families have a high standard of living, while about
35 percent remain poor.
After fifty years, the benefits and limitations of reservations for the public service as
a major influence on group prosperity are evident in the situation of the backward
castes and the Scheduled Castes. Despite the growing prosperity of some of the
lower caste families, the evidence of our measures of economic well-being is that
the hierarchical structure initially justified by ritual status persists. The Self-
Respect movement stood against caste and for the amelioration of the lot of the
untouchables. Yet commentators argue that both parties derived from it have
regressed recently from the progressive policies of their roots.53 Despite, or
perhaps because of, the aggressive reservations policies they have pursued, caste
has become of late even more important in Tamil Nadu politics—especially
among the lower castes who now have particular political parties devoted to their
interest.54
Table 7Standard of Living of Caste Groups & Clusters inTamil Nadu 1998–99
Caste group & cluster
Percentage of caste group / cluster
by standard of living
Low Medium High
High 0.0 27.6 72.4
Brahmin 0.0 28.0 72.0
Intermediate 22.3 53.6 24.1
Vellala 25.8 45.5 28.7
Backward 34.5 49.2 16.3
Agamudiya 30.5 53.7 15.8
Vannia 32.1 52.8 15.1
Scheduled Caste 53.6 41.4 5.1
Paria 64.5 32.3 3.2
Source: IIPS, NFHS-2, http://www.measuredhs.com
53 Ibid., p.104. See also S.V. Rajadurai and V. Geetha, ‘A Response to John Harriss’, in Journal of Commonwealth
and Comparative Politics, Vol.4, no.3 (2002), p.121.54 Harriss, ‘Cultural Nationalism’, p.98
140 SOUTH ASIA
Dow
nloa
ded
By: [
Flin
ders
Uni
vers
ity o
f Sou
th A
ustra
lia] A
t: 02
:26
8 M
ay 2
007
Bihar
According to William Pinch, the seismic shift in Bihar politics during the twentieth
century was from a ‘cultural politics’ based on an ideology of martial power, to a
politics based on democratic, demographic realities.55 Cultural politics in Bihar
was centred on the attempts of intermediate castes like the Yadavs, Kurmis and
Koeris to emulate the identities of the high castes—especially the Rajputs and Bhu-
mihar Brahmins—in order to secure recognition of their ‘rightful’ place in Bihar
society.56
In the early years of Independence the high caste leaders of the Bihar Congress, who
competed amongst themselves for control of the government and its expanded
patronage, ensured that the administrative and police jobs went to their caste
fellows.57 That young high caste men took advantage of the new opportunities is
not surprising; they had long dominated the enrolments in the institutions of
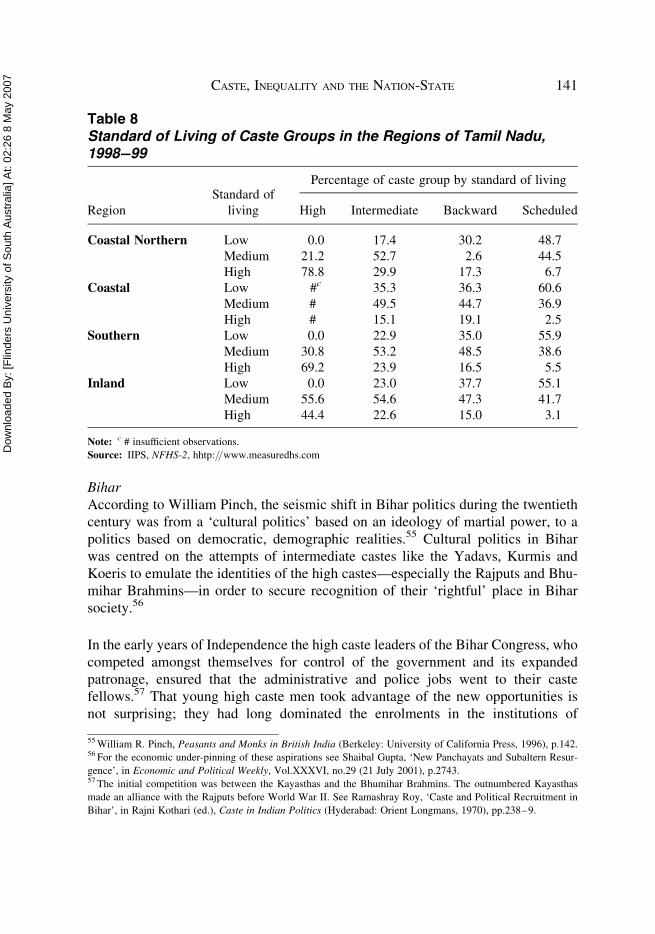
Table 8Standard of Living of Caste Groups in the Regions of Tamil Nadu,1998–99
Region
Standard of
living
Percentage of caste group by standard of living
High Intermediate Backward Scheduled
Coastal Northern Low 0.0 17.4 30.2 48.7
Medium 21.2 52.7 2.6 44.5
High 78.8 29.9 17.3 6.7
Coastal Low #c 35.3 36.3 60.6
Medium # 49.5 44.7 36.9
High # 15.1 19.1 2.5
Southern Low 0.0 22.9 35.0 55.9
Medium 30.8 53.2 48.5 38.6
High 69.2 23.9 16.5 5.5
Inland Low 0.0 23.0 37.7 55.1
Medium 55.6 54.6 47.3 41.7
High 44.4 22.6 15.0 3.1
Note: c # insufficient observations.
Source: IIPS, NFHS-2, hhtp://www.measuredhs.com
55 William R. Pinch, Peasants and Monks in British India (Berkeley: University of California Press, 1996), p.142.56 For the economic under-pinning of these aspirations see Shaibal Gupta, ‘New Panchayats and Subaltern Resur-
gence’, in Economic and Political Weekly, Vol.XXXVI, no.29 (21 July 2001), p.2743.57 The initial competition was between the Kayasthas and the Bhumihar Brahmins. The outnumbered Kayasthas
made an alliance with the Rajputs before World War II. See Ramashray Roy, ‘Caste and Political Recruitment in
Bihar’, in Rajni Kothari (ed.), Caste in Indian Politics (Hyderabad: Orient Longmans, 1970), pp.238–9.
CASTE, INEQUALITY AND THE NATION-STATE 141

Dow
nloa
ded
By: [
Flin
ders
Uni
vers
ity o
f Sou
th A
ustra
lia] A
t: 02
:26
8 M
ay 2
007
Table 9Mean Heights (in cms) of Females aged 20–49 by Birth Cohort in Bihar
Caste group
1950–59 1960–69 1970–79
n Mean s.d. n Mean s.d. n Mean s.d.
High 237 150.65 5.30 293 151.63 5.35 360 151.34 5.73
Intermediate 272 149.03 5.70 417 149.53 5.40 570 149.37 5.20
Backward 295 148.87 4.88 434 148.91 5.48 615 149.14 5.48
Muslim 53 149.63 5.46 120 149.46 5.54 139 149.98 5.84
Scheduled Caste 169 149.14 5.21 251 149.47 5.77 318 148.99 4.94
Difference of means
Md Sign. Md Sign. Md Sign.
High & Backward 1.77 (3.97) a��� 2.73 (6.67)��� b 2.20 (5.87)���
High & Scheduled Caste 1.51 (2.86)��� 2.16 (4.50)��� 2.35 (5.73)���
Intermediate & Backward 0.16 (0.36) 0.62 (1.66)� 0.23 (0.75)
Intermediate & Scheduled 20.11 (20.21) 0.06 (0.13) 0.39 (1.08)
Notes: Md difference of means
Sign. significance of difference of meansa t-ratios are shown in parenthesis.b� indicates significant at the 10 percent significance level, �� significant at the 5 percent level, and ��� significant at the 1 percent level.
Source: IIPS, NFHS-2, http://www.measuredhs.com
142
SO
UT
HA
SIA

Dow
nloa
ded
By: [
Flin
ders
Uni
vers
ity o
f Sou
th A
ustra
lia] A
t: 02
:26
8 M
ay 2
007
higher learning. After Independence brought universal suffrage, the number of fac-
tions in the Congress grew, as members of intermediate castes were incorporated
into the political arena and the mobilisation of voters on the grounds of caste
loyalty spread.58 The upper castes retained control of the party and government
but the ground was shifting under their feet. By the early 1960s, as young men
from the intermediate castes took advantage of the new opportunities for higher edu-
cation, their leaders, Pinch points out, shifted their ambitions from the politics of
culture to the new possibilities offered by their numerical advantages—opportunities
not only of political power, but also of ‘achieving an identifiable measure of social
and economic justice’.59
The trends in mean adult height of females indicate that most groups in Bihar—apart
from the high castes—made little progress between 1950 and 1979. The movement
against high caste dominance was firmly based in economic, as well as political,
disparity.
For instance the data reveals no significant difference between the mean heights of
women from the intermediate and Scheduled Caste groups. On the other hand, the
high caste women born in the period 1950–1979 appear to have been significantly
taller as adults than Scheduled Caste women and women from the backward
group. This reflects the strong position of the high castes in Bihar throughout this
period and the struggles of the other castes.60
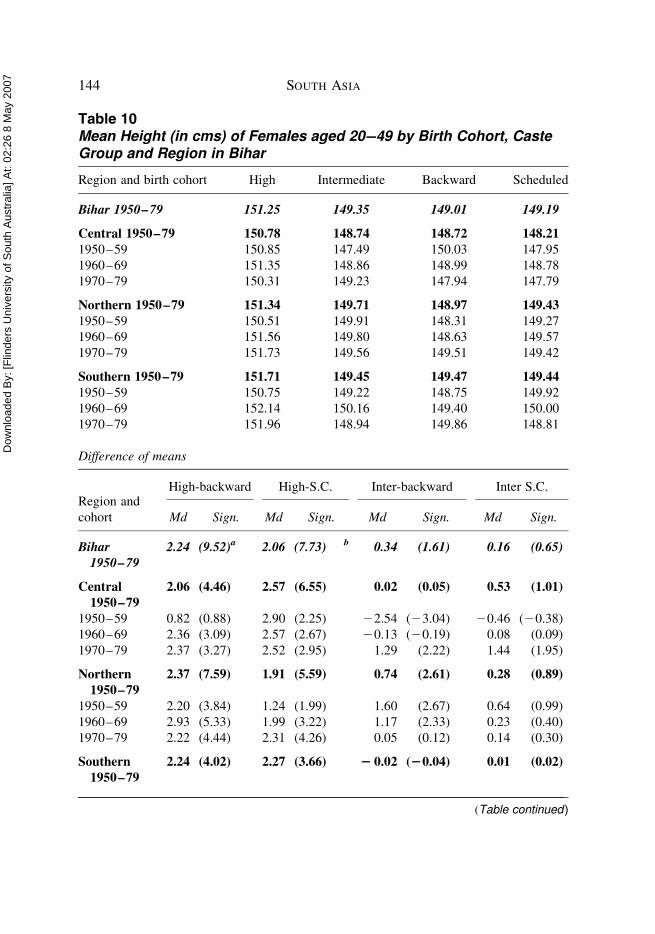
The above pattern largely remains when the state figures are disaggregated into the
National Sample Survey regions.61 There is in most regions a strong significant
difference between the mean heights of high caste women and their regional back-
ward and Scheduled Caste contemporaries. Similarly the absence of significant
difference between the means of intermediate and Scheduled Caste female heights
remains. There is less similarity though between the state and regional patterns of
mean female heights of the intermediate and backward castes in Central and
Northern Bihar. In the former, the mean heights of intermediate women show a
steady improvement while those from the backward castes decline by two
58 By 1963 there were about six groups in the Indian National Congress based on caste. Ibid., pp.219–20.59 Pinch, Peasants and Monks, p.143.60 There is no clear evidence of changes in variance within any of the caste groups. The general improvement in adult
heights of women born in the 1960s over those in the 1950s—common to most regions—may result from the free-
feeding and school-feeding programmes which catered for the children and mothers among those affected by the
1966–67 food crisis in Bihar (and parts of UP). K. Suresh Singh, The Indian Famine 1967: A Study in Crisis
and Change (New Delhi: People’s Publishing House, 1975), p.254.61 The National Sample Survey Organisation divided Bihar into three regions: Northern, comprising the districts
north of the river Ganga; Southern, the Chotanagpur plateau; and Central, those districts between the Ganga and
the plateau.
CASTE, INEQUALITY AND THE NATION-STATE 143
Dow
nloa
ded
By: [
Flin
ders
Uni
vers
ity o
f Sou
th A
ustra
lia] A
t: 02
:26
8 M
ay 2
007
Table 10Mean Height (in cms) of Females aged 20–49 by Birth Cohort, CasteGroup and Region in Bihar
Region and birth cohort High Intermediate Backward Scheduled
Bihar 1950–79 151.25 149.35 149.01 149.19
Central 1950–79 150.78 148.74 148.72 148.21
1950–59 150.85 147.49 150.03 147.95
1960–69 151.35 148.86 148.99 148.78
1970–79 150.31 149.23 147.94 147.79
Northern 1950–79 151.34 149.71 148.97 149.43
1950–59 150.51 149.91 148.31 149.27
1960–69 151.56 149.80 148.63 149.57
1970–79 151.73 149.56 149.51 149.42
Southern 1950–79 151.71 149.45 149.47 149.44
1950–59 150.75 149.22 148.75 149.92
1960–69 152.14 150.16 149.40 150.00
1970–79 151.96 148.94 149.86 148.81
Difference of means
Region and
cohort
High-backward High-S.C. Inter-backward Inter S.C.
Md Sign. Md Sign. Md Sign. Md Sign.
Bihar1950–79
2.24 (9.52)a��� 2.06 (7.73)���b 0.34 (1.61) 0.16 (0.65)
Central
1950–79
2.06 (4.46)��� 2.57 (6.55)��� 0.02 (0.05) 0.53 (1.01)
1950–59 0.82 (0.88) 2.90 (2.25)�� 22.54 (23.04)��� 20.46 (20.38)
1960–69 2.36 (3.09)��� 2.57 (2.67)��� 20.13 (20.19) 0.08 (0.09)
1970–79 2.37 (3.27)��� 2.52 (2.95)��� 1.29 (2.22)�� 1.44 (1.95)�
Northern
1950–79
2.37 (7.59)��� 1.91 (5.59)��� 0.74 (2.61)��� 0.28 (0.89)
1950–59 2.20 (3.84)��� 1.24 (1.99)�� 1.60 (2.67)��� 0.64 (0.99)
1960–69 2.93 (5.33)��� 1.99 (3.22)��� 1.17 (2.33)�� 0.23 (0.40)
1970–79 2.22 (4.44)��� 2.31 (4.26)��� 0.05 (0.12) 0.14 (0.30)
Southern
1950–79
2.24 (4.02)��� 2.27 (3.66)��� 2 0.02 (20.04) 0.01 (0.02)
(Table continued)
144 SOUTH ASIA
Dow
nloa
ded
By: [
Flin
ders
Uni
vers
ity o
f Sou
th A
ustra
lia] A
t: 02
:26
8 M
ay 2
007
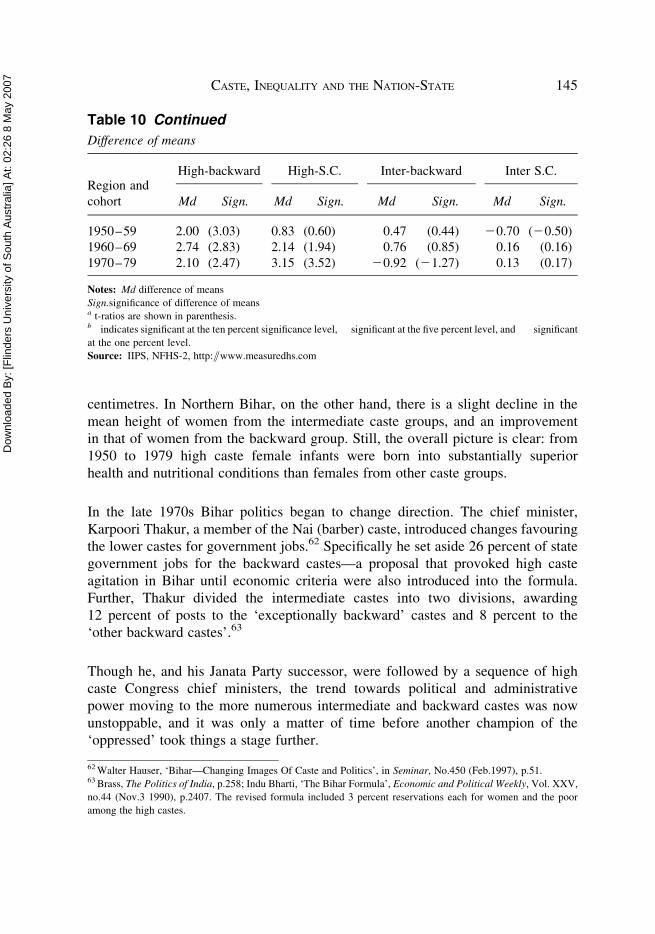
centimetres. In Northern Bihar, on the other hand, there is a slight decline in the
mean height of women from the intermediate caste groups, and an improvement
in that of women from the backward group. Still, the overall picture is clear: from
1950 to 1979 high caste female infants were born into substantially superior
health and nutritional conditions than females from other caste groups.
In the late 1970s Bihar politics began to change direction. The chief minister,
Karpoori Thakur, a member of the Nai (barber) caste, introduced changes favouring
the lower castes for government jobs.62 Specifically he set aside 26 percent of state
government jobs for the backward castes—a proposal that provoked high caste
agitation in Bihar until economic criteria were also introduced into the formula.
Further, Thakur divided the intermediate castes into two divisions, awarding
12 percent of posts to the ‘exceptionally backward’ castes and 8 percent to the
‘other backward castes’.63
Though he, and his Janata Party successor, were followed by a sequence of high
caste Congress chief ministers, the trend towards political and administrative
power moving to the more numerous intermediate and backward castes was now
unstoppable, and it was only a matter of time before another champion of the
‘oppressed’ took things a stage further.
Table 10 Continued
Difference of means
Region and
cohort
High-backward High-S.C. Inter-backward Inter S.C.
Md Sign. Md Sign. Md Sign. Md Sign.
1950–59 2.00 (3.03)��� 0.83 (0.60) 0.47 (0.44) 20.70 (20.50)
1960–69 2.74 (2.83)��� 2.14 (1.94)� 0.76 (0.85) 0.16 (0.16)
1970–79 2.10 (2.47)�� 3.15 (3.52)��� 20.92 (21.27) 0.13 (0.17)
Notes: Md difference of means
Sign.significance of difference of meansa t-ratios are shown in parenthesis.b � indicates significant at the ten percent significance level, �� significant at the five percent level, and ��� significant
at the one percent level.
Source: IIPS, NFHS-2, http://www.measuredhs.com
62 Walter Hauser, ‘Bihar—Changing Images Of Caste and Politics’, in Seminar, No.450 (Feb.1997), p.51.63 Brass, The Politics of India, p.258; Indu Bharti, ‘The Bihar Formula’, Economic and Political Weekly, Vol. XXV,
no.44 (Nov.3 1990), p.2407. The revised formula included 3 percent reservations each for women and the poor
among the high castes.
CASTE, INEQUALITY AND THE NATION-STATE 145
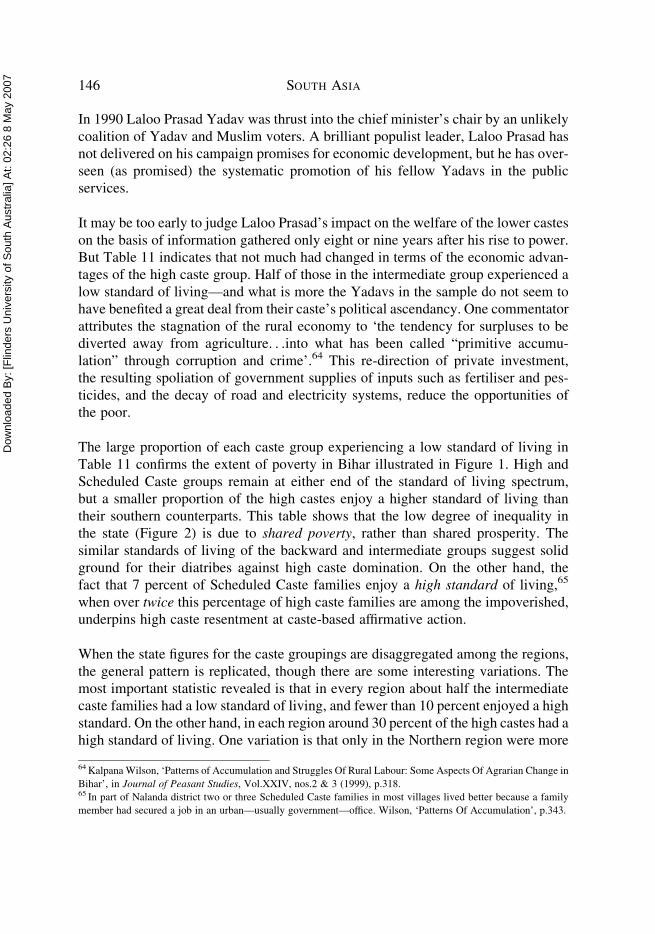
Dow
nloa
ded
By: [
Flin
ders
Uni
vers
ity o
f Sou
th A
ustra
lia] A
t: 02
:26
8 M
ay 2
007
In 1990 Laloo Prasad Yadav was thrust into the chief minister’s chair by an unlikely
coalition of Yadav and Muslim voters. A brilliant populist leader, Laloo Prasad has
not delivered on his campaign promises for economic development, but he has over-
seen (as promised) the systematic promotion of his fellow Yadavs in the public
services.
It may be too early to judge Laloo Prasad’s impact on the welfare of the lower castes
on the basis of information gathered only eight or nine years after his rise to power.
But Table 11 indicates that not much had changed in terms of the economic advan-
tages of the high caste group. Half of those in the intermediate group experienced a
low standard of living—and what is more the Yadavs in the sample do not seem to
have benefited a great deal from their caste’s political ascendancy. One commentator
attributes the stagnation of the rural economy to ‘the tendency for surpluses to be
diverted away from agriculture. . .into what has been called “primitive accumu-
lation” through corruption and crime’.64 This re-direction of private investment,
the resulting spoliation of government supplies of inputs such as fertiliser and pes-
ticides, and the decay of road and electricity systems, reduce the opportunities of
the poor.
The large proportion of each caste group experiencing a low standard of living in
Table 11 confirms the extent of poverty in Bihar illustrated in Figure 1. High and
Scheduled Caste groups remain at either end of the standard of living spectrum,
but a smaller proportion of the high castes enjoy a higher standard of living than
their southern counterparts. This table shows that the low degree of inequality in
the state (Figure 2) is due to shared poverty, rather than shared prosperity. The
similar standards of living of the backward and intermediate groups suggest solid
ground for their diatribes against high caste domination. On the other hand, the
fact that 7 percent of Scheduled Caste families enjoy a high standard of living,65
when over twice this percentage of high caste families are among the impoverished,
underpins high caste resentment at caste-based affirmative action.
When the state figures for the caste groupings are disaggregated among the regions,
the general pattern is replicated, though there are some interesting variations. The
most important statistic revealed is that in every region about half the intermediate
caste families had a low standard of living, and fewer than 10 percent enjoyed a high
standard. On the other hand, in each region around 30 percent of the high castes had a
high standard of living. One variation is that only in the Northern region were more
64 Kalpana Wilson, ‘Patterns of Accumulation and Struggles Of Rural Labour: Some Aspects Of Agrarian Change in
Bihar’, in Journal of Peasant Studies, Vol.XXIV, nos.2 & 3 (1999), p.318.65 In part of Nalanda district two or three Scheduled Caste families in most villages lived better because a family
member had secured a job in an urban—usually government—office. Wilson, ‘Patterns Of Accumulation’, p.343.
146 SOUTH ASIA
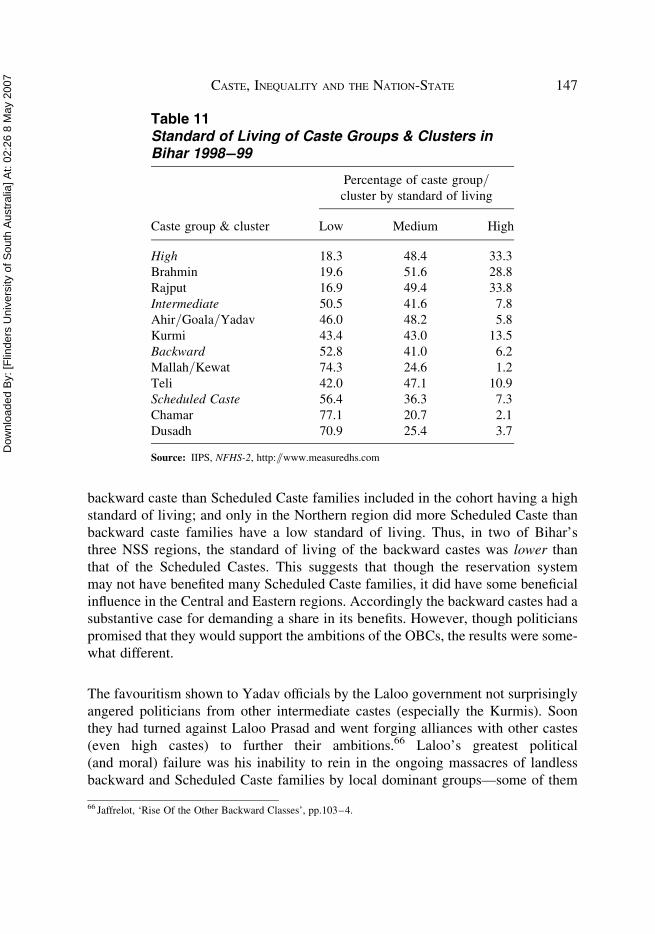
Dow
nloa
ded
By: [
Flin
ders
Uni
vers
ity o
f Sou
th A
ustra
lia] A
t: 02
:26
8 M
ay 2
007
backward caste than Scheduled Caste families included in the cohort having a high
standard of living; and only in the Northern region did more Scheduled Caste than
backward caste families have a low standard of living. Thus, in two of Bihar’s
three NSS regions, the standard of living of the backward castes was lower than
that of the Scheduled Castes. This suggests that though the reservation system
may not have benefited many Scheduled Caste families, it did have some beneficial
influence in the Central and Eastern regions. Accordingly the backward castes had a
substantive case for demanding a share in its benefits. However, though politicians
promised that they would support the ambitions of the OBCs, the results were some-
what different.
The favouritism shown to Yadav officials by the Laloo government not surprisingly
angered politicians from other intermediate castes (especially the Kurmis). Soon
they had turned against Laloo Prasad and went forging alliances with other castes
(even high castes) to further their ambitions.66 Laloo’s greatest political
(and moral) failure was his inability to rein in the ongoing massacres of landless
backward and Scheduled Caste families by local dominant groups—some of them
Table 11Standard of Living of Caste Groups & Clusters inBihar 1998–99
Caste group & cluster
Percentage of caste group/cluster by standard of living
Low Medium High
High 18.3 48.4 33.3
Brahmin 19.6 51.6 28.8
Rajput 16.9 49.4 33.8
Intermediate 50.5 41.6 7.8
Ahir/Goala/Yadav 46.0 48.2 5.8
Kurmi 43.4 43.0 13.5
Backward 52.8 41.0 6.2
Mallah/Kewat 74.3 24.6 1.2
Teli 42.0 47.1 10.9
Scheduled Caste 56.4 36.3 7.3
Chamar 77.1 20.7 2.1
Dusadh 70.9 25.4 3.7
Source: IIPS, NFHS-2, http://www.measuredhs.com
66 Jaffrelot, ‘Rise Of the Other Backward Classes’, pp.103–4.
CASTE, INEQUALITY AND THE NATION-STATE 147

Dow
nloa
ded
By: [
Flin
ders
Uni
vers
ity o
f Sou
th A
ustra
lia] A
t: 02
:26
8 M
ay 2
007
Yadavs.67 At the local level the high castes remain powerful, though locked in a
contest with intermediate castes.68 To defend their interests, in the 1990s they aban-
doned the Congress in favour of the Bharatiya Janata Party (BJP) that used broad
Hindu nationalist and, more recently, developmental appeals to bring other groups
under its umbrella—initially with some success.69
Despite the availability of reservations in state government service since 1978 and
their startling political success from the early 1990s, there has been little improve-
ment in the economic condition of Bihar’s intermediate castes—let alone of its back-
ward and Scheduled Castes. A recent study indicates that the incidence of poverty is
less in villages with access to irrigation, transport and marketing infrastructure.70
It is ironic that an outcome of Laloo Prasad and his party being more concerned
with manipulating caste identity for electoral purposes than with developing the
infrastructure of their state is the continued poverty of many of the group that
Table 12Standard of Living of Caste Groups in the Regions of Bihar 1998–99
Region
Standard of
living
Percentage of caste group by standard of living
High Intermediate Backward Scheduled
Central Low 16.9 48.0 60.9 44.7
Medium 49.0 42.2 32.6 42.7
High 34.1 9.8 6.5 12.7
Northern Low 14.8 51.6 49.4 62.9
Medium 49.3 41.6 44.3 32.6
High 35.9 6.8 6.3 4.5
Southern Low 28.0 56.0 54.6 50.7
Medium 42.3 35.9 37.9 41.8
High 29.7 8.2 7.5 7.5
Source: IIPS, NFHS-2, http://www.measuredhs.com
67 Prakash Louis, ‘Shankarbigha Revisited’, in Economic and Political Weekly, Vol.XXXV (12–18 Feb. 2000)
[http://www.epw.org.in, accessed 7 Apr. 2004]; Anand Chakravarti, ‘Caste and Agrarian Class: A View from
Bihar’, in Economic and Political Weekly, Vol.36, no.17 (28 Apr. 2001), pp.1449–50.68 For local political contests see Shaibul Gupta, ‘New Panchayats’, p.2742.69 Walter Hauser, ‘General Elections 1996 in Bihar’, in Economic and Political Weekly, Vol.32, no.41 (11 Oct.
1997), p.2601.70 Jawahar Thakur, Manik L.Bose, Mahabub Hossain and A.Janaiah, ‘Rural Income Distribution and Poverty in
Bihar’, in Economic and Political Weekly, Vol.35 (30 Dec. 2000), p.4657 [http://www.epw.org.in, accessed
7 Apr. 2004].
148 SOUTH ASIA

Dow
nloa
ded
By: [
Flin
ders
Uni
vers
ity o
f Sou
th A
ustra
lia] A
t: 02
:26
8 M
ay 2
007
gives them the greatest support.71 And yet Laloo Prasad Yadav and his party are still
supported.72 This may be a function of his ability to focus attention on the theme of
social justice,73 thereby addressing the reluctance of the intermediate and lower
castes to return to a situation where they are at the administrative as well as econ-
omic mercy of the high castes.74 Or it may just reflect the depth of caste hostility
in Bihar society.
Uttar Pradesh
Ideological conflict among the Congress leaders in UP largely ceased in 1948 with
the resignation of Acharya Narendra Dev and similarly committed Congress social-
ists. Henceforth, factional conflict was largely related to personal considerations and
the distribution of patronage.75 Brass argues caste played some role in the two main
factions at the provincial level—one led by a Bania, the other by a Brahmin—but
that they were in essence ‘loose coalitions of local, district faction leaders, tied
together at the state level partly by personal bonds of friendship, partly by caste
loyalties, and most of all by political interest’.76 On the other hand, Partition and
its horrors transformed the nature of Muslim politics in UP. The extensive
Muslim community that remained in the state was told in no uncertain terms that
its future lay in supporting the Congress.77 For a time the Republican Party
aspired to represent the interests of the Scheduled Castes, but the policy of reser-
vations and the socialist ambitions of Nehru drew many from the Scheduled
Castes to the Congress, where they became thought of as a vote bank.78 Until
71 Good roads to villages are infrastructure that assist the lower castes. Roads increase their opportunities to work in
other villages or in non-agricultural occupations in nearby towns and therefore support agricultural wages. See Ravi
S. Srivastava, ‘Rural Labour in Uttar Pradesh: Emerging Features Of Subsistence, Contradiction and Resistance’, in
Journal Of Peasant Studies, Vol.26, nos.2 & 3 (1999), p.283. For a description of the condition of roads (and caste-
based violence) in central Bihar, see People’s Union for Civil Liberties, ‘Killings at Rajebigha, Apsarh, and Mianpur
on June 3, 11, and 22, 2000’ [http://www.pucl.org/reports/Bihar/rajebigha, accessed 20 Jan. 2005].72 The latest sign of this was in the 2004 central elections with the success in Bihar of the alliance engineered by
Laloo Prasad.73 Hauser, ‘General Elections 1996’, p.2602.74 For an elegant description of the traditional linkage between the village elite and the state, and the way the (usually
high caste) elite controlled the other elements in rural society, see Harry Blair, ‘Success and Failure in Rural Devel-
opment: A Comparison Of Maharashtra, Bihar and Bangladesh,’ paper given at seminar in honour of Walter Hauser,
University of Virginia, 16 May 1997 [http://www.virginia.edu/soasia/symsem/kisan/papers/mabiba21.html; used
with permission and accessed 30 Jan. 2005].75 The main exceptions to this were the opposition of Nehru to Purushottam Das Tandon, partly over the latter’s pro-
Hindu/anti-secular propensities, and the antagonism of Chaudhuri Charan Singh to Nehru’s support for co-operative
farming.76 Brass, Factional Politics, pp.54–5. See Table 3 on p.57 for a caste breakdown of the various leadership groups
between 1958 and 1963. See also Angela Burger, Opposition in a Dominant-Party System (Berkeley: University
of California, 1969), pp.54–6.77 See the report of a speech in Lucknow by Pandit Pant, the premier, National Herald (9 Jan. 1948), p.3.78 Oliver Mendelsohn and Marika Vicziany, The Untouchables; Subordination, Poverty and the State in Modern
India (Cambridge: CUP, 1998), p.204.
CASTE, INEQUALITY AND THE NATION-STATE 149
Dow
nloa
ded
By: [
Flin
ders
Uni
vers
ity o
f Sou
th A
ustra
lia] A
t: 02
:26
8 M
ay 2
007
1975 core electoral support for the Congress in UP came from an alliance of Muslims
and Scheduled Castes led by high caste groups (mainly Brahmins). Following Indira
Gandhi’s Emergency of 1975–77 the Muslims and Scheduled Castes tended to
abandon the Congress; but their support shifted back after Janata Party rule from
1977 to 1980.
The following analysis examines the trajectory of the mean adult height of females
from the four caste-groups—and through this their relative well-being—from 1950
to 1979, first for the state as a whole and then for the three NSS plains regions.
The thirty years covered by the state-level data in Table 13 witnessed little change in
mean female height; but women from the intermediate and high caste groups
remained consistently (and significantly) taller than their Scheduled Caste contem-
poraries. But note that the mean adult height of women in the backward caste
group is, throughout, significantly inferior to that of both the high and intermediate
caste groups, apart from those born during the 1960s when there is no significant
difference from the intermediate group.79 No strong trend is apparent in the extent
of internal variation within caste groupings, but there appears to be a slight reduction
in the variance of the high and backward caste groupings.
However when the disaggregated data in Table 14 for the plains regions of the state
is factored in, an interesting pattern emerges.80 In the Western region, recognised as
the most prosperous part of the state, the mean heights of women born in all caste
groups declined over this period. This is also the region with the least statistically
significant differences between the heights of females from the high and intermediate
caste groupings, and those of the backward and Scheduled Castes. Only those born
between 1970 and 1979 among the high and intermediate castes were significantly
taller than their contemporaries among the backward castes; and in the same
period only women from the intermediate castes were significantly taller than Sched-
uled Caste women. The 1970s were the decade in which the Green Revolution made
its initial mark on the economy of Western UP. Women born in this decade in the
intermediate caste groups established a significant difference between their adult
heights and those of the backward and Scheduled Castes. This suggests that the
families from which they came benefited from the Green Revolution agrarian
79 The influence of the relief of the food crisis of 1965–67, when school children sometimes received a food ration,
possibly clouded the difference between the groups.80 The Western region comprises the old divisions of Meerut (less Dehra Dun), Rohilkhand, Agra, and the western
districts of Allahabad division; the Central region is made up of the Lucknow division plus Bara Banki, Fatehpur,
and the Kanpur districts; Faizabad, Gorakhpur and Varanasi divisions are the Eastern region. The samples in the
Himalayan region (now Uttaranchal) and the Southern region (old Jhansi division) were too small to give us confi-
dence in any comparisons.
150 SOUTH ASIA

Dow
nloa
ded
By: [
Flin
ders
Uni
vers
ity o
f Sou
th A
ustra
lia] A
t: 02
:26
8 M
ay 2
007
Table 13Mean Heights (in cms) of Females aged 20–49 yrs by Birth Cohort in Uttar Pradesh
Caste group
1950–59 1960–69 1970–79
n Mean s.d. n Mean s.d. n Mean s.d.
High 334 151.28 5.81 482 151.12 5.74 596 151.12 5.27
Intermediate 263 150.62 5.57 436 150.43 5.34 595 150.45 5.48
Backward 141 149.25 6.45 201 150.23 5.63 255 149.14 5.30
Muslim 68 151.51 7.35 124 151.19 5.96 169 150.39 5.34
Scheduled Caste 200 149.57 5.59 339 149.64 5.37 459 149.36 5.61
Difference of means
Md Sign. Md Sign. Md Sign.
High & Backward 2.03 (3.22)a��� 0.89 (1.86)�b 1.98 (4.99)���
High & Scheduled Caste 1.71 (3.37) ��� 1.48 (3.78)��� 1.76 (5.18)���
Intermediate & Backward 1.37 (2.13)�� 0.20 (0.41) 1.30 (3.25)���
Intermediate & Scheduled 1.05 (2.01)�� 0.79 (2.04)�� 1.08 (3.16)���
Notes: Md difference of means
Sign. significance of difference of meansa t-ratios are shown in parenthesis.b � indicates significant at the ten percent significance level, �� significant at the five percent level, and ��� significant at the one percent level.
Source: IIPS, NFHS-2, http://www.measuredhs.com
CA
ST
E,IN
EQ
UA
LIT
YA
ND
TH
EN
AT
ION
-ST
AT
E151

Dow
nloa
ded
By: [
Flin
ders
Uni
vers
ity o
f Sou
th A
ustra
lia] A
t: 02
:26
8 M
ay 2
007
Table 14Mean Height (in cms) of Women aged 20–49 by Birth Cohort, CasteGroup and Region in Uttar Pradesh
Region and birth cohort High Intermediate Backward Scheduled
Uttar Pradesh 1950–79d 151.16 150.48 149.54 149.50
Western 1950–79 151.14 151.85 149.89 150.55
1950–59 151.10 152.25 151.78 151.06
1960–69 151.59 151.76 150.62 150.92
1970–79 150.82 151.72 148.37 149.99
Central 1950–79 150.82 149.56 147.99 148.20
1950–59 150.34 149.28 146.07 147.93
1960–69 150.89 149.92 148.95 148.44
1970–79 151.01 149.43 148.32 148.10
Eastern 1950–79 150.58 149.49 148.99 149.05
1950–59 150.90 149.58 148.16 148.85
1960–69 150.30 149.33 149.29 148.73
1970–79 150.64 149.57 149.24 149.33
Difference of means
Region &
cohort
High-backward High-scheduled Inter-backward Inter-scheduled
Md Sign. Md Sign. Md Sign. Md Sign.
UP 1950–79 1.62 (5.86)a��� 1.66 (7.25)��� 0.94 (2.38 �� 0.98 (2.70)���
Western
1950–79
1.25 (2.18)�� b 0.59 (1.53) 1.96 (3.35)��� 1.30 (2.10)��
1950–59 20.68 (20.55) 0.04 (0.05) 0.47 (0.37) 1.19 (1.34)
1960–69 0.97 (0.86) 0.67 (1.01) 1.14 (1.80) 0.84 (1.23)
1970–79 2.45 (3.40)��� 0.83 (1.46) 3.35 (4.52)��� 1.73 (2.90)���
Central
1950–79
2.83 (4.13)��� 2.62 (4.98)��� 1.57 (2.37)�� 1.36 (2.73)���
1950–59 4.27 (3.18)��� 2.41 (2.09)�� 3.21 (2.47)�� 1.35 (1.22)
1960–69 1.94 (1.98)�� 2.45 (2.81)��� 0.97 (0.52) 1.48 (1.26)
1970–79 2.69 (2.19)�� 2.91 (3.50)��� 1.11 (0.91) 1.33 (1.63)
Eastern
1950–79
1.59 (3.67)��� 1.53 (3.80)��� 0.50 (1.17) 0.44 (1.14)
(Table continued)
152 SOUTH ASIA
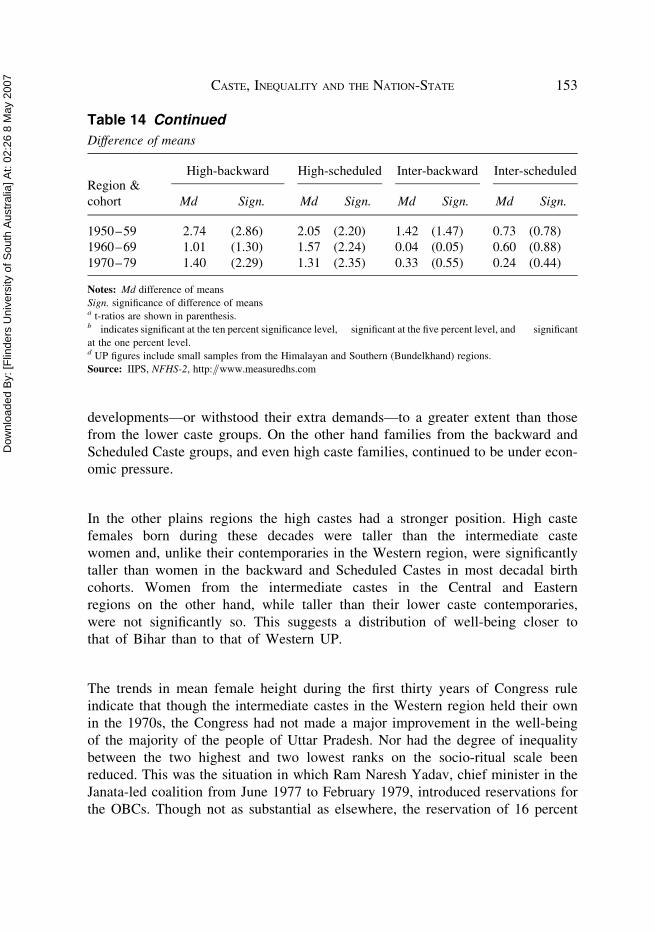
Dow
nloa
ded
By: [
Flin
ders
Uni
vers
ity o
f Sou
th A
ustra
lia] A
t: 02
:26
8 M
ay 2
007
developments—or withstood their extra demands—to a greater extent than those
from the lower caste groups. On the other hand families from the backward and
Scheduled Caste groups, and even high caste families, continued to be under econ-
omic pressure.
In the other plains regions the high castes had a stronger position. High caste
females born during these decades were taller than the intermediate caste
women and, unlike their contemporaries in the Western region, were significantly
taller than women in the backward and Scheduled Castes in most decadal birth
cohorts. Women from the intermediate castes in the Central and Eastern
regions on the other hand, while taller than their lower caste contemporaries,
were not significantly so. This suggests a distribution of well-being closer to
that of Bihar than to that of Western UP.
The trends in mean female height during the first thirty years of Congress rule
indicate that though the intermediate castes in the Western region held their own
in the 1970s, the Congress had not made a major improvement in the well-being
of the majority of the people of Uttar Pradesh. Nor had the degree of inequality
between the two highest and two lowest ranks on the socio-ritual scale been
reduced. This was the situation in which Ram Naresh Yadav, chief minister in the
Janata-led coalition from June 1977 to February 1979, introduced reservations for
the OBCs. Though not as substantial as elsewhere, the reservation of 16 percent
Table 14 Continued
Difference of means
Region &
cohort
High-backward High-scheduled Inter-backward Inter-scheduled
Md Sign. Md Sign. Md Sign. Md Sign.
1950–59 2.74 (2.86)��� 2.05 (2.20)�� 1.42 (1.47) 0.73 (0.78)
1960–69 1.01 (1.30) 1.57 (2.24)�� 0.04 (0.05) 0.60 (0.88)
1970–79 1.40 (2.29)�� 1.31 (2.35)�� 0.33 (0.55) 0.24 (0.44)
Notes: Md difference of means
Sign. significance of difference of meansa t-ratios are shown in parenthesis.b � indicates significant at the ten percent significance level, �� significant at the five percent level, and ��� significant
at the one percent level.d UP figures include small samples from the Himalayan and Southern (Bundelkhand) regions.
Source: IIPS, NFHS-2, http://www.measuredhs.com
CASTE, INEQUALITY AND THE NATION-STATE 153
Dow
nloa
ded
By: [
Flin
ders
Uni
vers
ity o
f Sou
th A
ustra
lia] A
t: 02
:26
8 M
ay 2
007
of government posts still provoked resistance from the Jana Sangh component of the
coalition.81
The analysis of relative standards of living twenty years later at the state level among
the four caste groups in the NFHS-2 sample in Table 15 enables us to see whether
there was any major shift in well-being during the intervening years.
The relative standard of living of the groups in the sample broadly follows their
socio-ritual status. The high castes as a group have a strong position. But
12 percent of upper caste families in the sample live in poor circumstances, while
nearly 5 percent of Scheduled Caste families and 6 percent of backward castes
enjoy a high standard of living, indicating that there is not a one-to-one relationship
here between caste and class. Yet that a few members of lower caste groups have
attained a high standard of living indicates that reservation policies in UP have
had some impact upon some of the latter group.82 Moreover, the largest proportion
of each of the first three groups now enjoys a medium standard of living, and even
the Scheduled Castes have 45 percent in this category. But caste differentiation
remains obvious. Nearly half the Scheduled Castes live in poor circumstances and
just over a third of the backward castes share this condition. Inequality within the
state continues to have a strong relationship with the caste structure.
The disaggregation into regional levels of the UP standard of living data does not
alter the picture. The substantially greater proportion of each caste group in the
Western region enjoying a high standard of living demonstrates that it is still the
most prosperous, while the Eastern region, on the same criterion, remains relatively
the poorest. But the general pattern holds: high and intermediate caste families have
a greater chance of being prosperous and backward and Scheduled Caste families are
more likely to be poor. It also remains the case that substantial numbers of all caste
groups have a medium standard of living.
An interesting variation is that in the Western region, the proportion of the backward
caste group enjoying a high standard of living is substantially larger than the corre-
sponding proportion of the Scheduled Caste group. On the other hand, in the other
plains regions the Scheduled Castes eclipse the backward castes in this regard.
It is unclear why these regional differences have occurred. It may reflect the
81 Jaffrelot, ‘The Rise Of the Other Backward Classes’, p.94; and Myron Weiner and Mary Fainsod Katzenstein,
India’s Preferential Policies (Chicago: University of Chicago Press, 1981), p.133.82 In his fieldwork in six UP villages in 1993–95, Ravi S. Srivastava noted that in some villages the Scheduled Castes
had members in salaried occupations such as teaching, the police, and medicine. This improved the welfare of the
family. Ravi S. Srivastava, ‘Rural Labour in Uttar Pradesh: Emerging Features Of Subsistence, Contradiction and
Resistance’, in The Journal of Peasant Studies, Vol.26, nos.2 & 3 (1999), p.274.
154 SOUTH ASIA
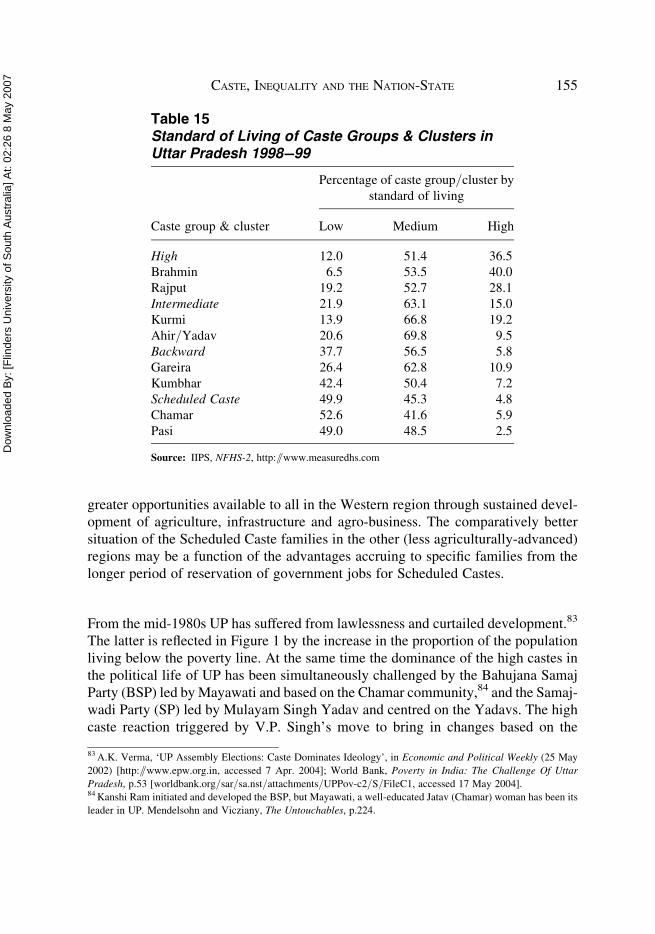
Dow
nloa
ded
By: [
Flin
ders
Uni
vers
ity o
f Sou
th A
ustra
lia] A
t: 02
:26
8 M
ay 2
007
greater opportunities available to all in the Western region through sustained devel-
opment of agriculture, infrastructure and agro-business. The comparatively better
situation of the Scheduled Caste families in the other (less agriculturally-advanced)
regions may be a function of the advantages accruing to specific families from the
longer period of reservation of government jobs for Scheduled Castes.
From the mid-1980s UP has suffered from lawlessness and curtailed development.83
The latter is reflected in Figure 1 by the increase in the proportion of the population
living below the poverty line. At the same time the dominance of the high castes in
the political life of UP has been simultaneously challenged by the Bahujana Samaj
Party (BSP) led by Mayawati and based on the Chamar community,84 and the Samaj-
wadi Party (SP) led by Mulayam Singh Yadav and centred on the Yadavs. The high
caste reaction triggered by V.P. Singh’s move to bring in changes based on the
Table 15Standard of Living of Caste Groups & Clusters inUttar Pradesh 1998–99
Caste group & cluster
Percentage of caste group/cluster by
standard of living
Low Medium High
High 12.0 51.4 36.5
Brahmin 6.5 53.5 40.0
Rajput 19.2 52.7 28.1
Intermediate 21.9 63.1 15.0
Kurmi 13.9 66.8 19.2
Ahir/Yadav 20.6 69.8 9.5
Backward 37.7 56.5 5.8
Gareira 26.4 62.8 10.9
Kumbhar 42.4 50.4 7.2
Scheduled Caste 49.9 45.3 4.8
Chamar 52.6 41.6 5.9
Pasi 49.0 48.5 2.5
Source: IIPS, NFHS-2, http://www.measuredhs.com
83 A.K. Verma, ‘UP Assembly Elections: Caste Dominates Ideology’, in Economic and Political Weekly (25 May
2002) [http://www.epw.org.in, accessed 7 Apr. 2004]; World Bank, Poverty in India: The Challenge Of Uttar
Pradesh, p.53 [worldbank.org/sar/sa.nst/attachments/UPPov-c2/S/FileC1, accessed 17 May 2004].84 Kanshi Ram initiated and developed the BSP, but Mayawati, a well-educated Jatav (Chamar) woman has been its
leader in UP. Mendelsohn and Vicziany, The Untouchables, p.224.
CASTE, INEQUALITY AND THE NATION-STATE 155
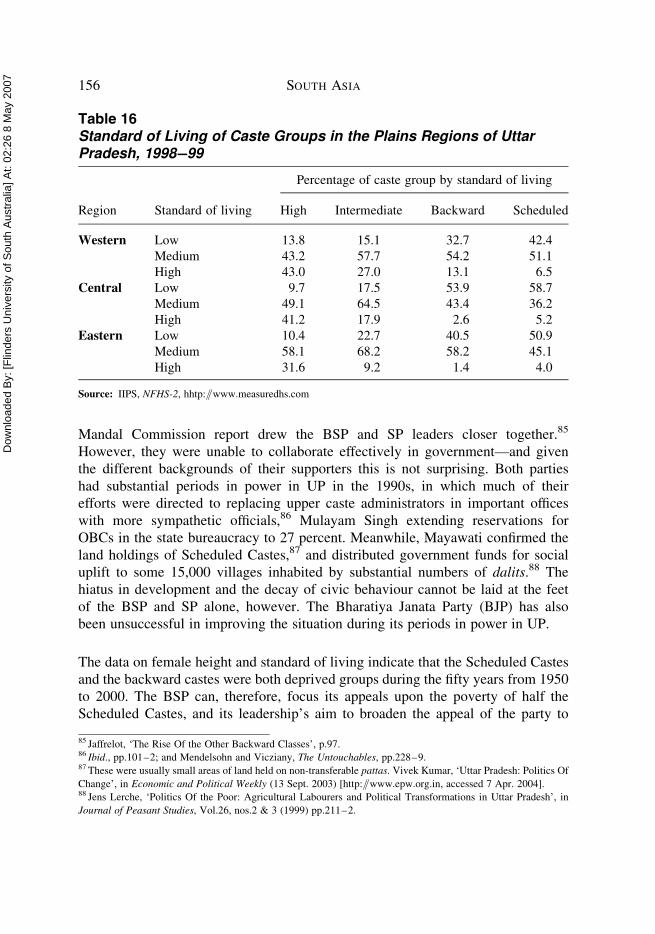
Dow
nloa
ded
By: [
Flin
ders
Uni
vers
ity o
f Sou
th A
ustra
lia] A
t: 02
:26
8 M
ay 2
007
Mandal Commission report drew the BSP and SP leaders closer together.85
However, they were unable to collaborate effectively in government—and given
the different backgrounds of their supporters this is not surprising. Both parties
had substantial periods in power in UP in the 1990s, in which much of their
efforts were directed to replacing upper caste administrators in important offices
with more sympathetic officials,86 Mulayam Singh extending reservations for
OBCs in the state bureaucracy to 27 percent. Meanwhile, Mayawati confirmed the
land holdings of Scheduled Castes,87 and distributed government funds for social
uplift to some 15,000 villages inhabited by substantial numbers of dalits.88 The
hiatus in development and the decay of civic behaviour cannot be laid at the feet
of the BSP and SP alone, however. The Bharatiya Janata Party (BJP) has also
been unsuccessful in improving the situation during its periods in power in UP.
The data on female height and standard of living indicate that the Scheduled Castes
and the backward castes were both deprived groups during the fifty years from 1950
to 2000. The BSP can, therefore, focus its appeals upon the poverty of half the
Scheduled Castes, and its leadership’s aim to broaden the appeal of the party to
Table 16Standard of Living of Caste Groups in the Plains Regions of UttarPradesh, 1998–99
Region Standard of living
Percentage of caste group by standard of living
High Intermediate Backward Scheduled
Western Low 13.8 15.1 32.7 42.4
Medium 43.2 57.7 54.2 51.1
High 43.0 27.0 13.1 6.5
Central Low 9.7 17.5 53.9 58.7
Medium 49.1 64.5 43.4 36.2
High 41.2 17.9 2.6 5.2
Eastern Low 10.4 22.7 40.5 50.9
Medium 58.1 68.2 58.2 45.1
High 31.6 9.2 1.4 4.0
Source: IIPS, NFHS-2, hhtp://www.measuredhs.com
85 Jaffrelot, ‘The Rise Of the Other Backward Classes’, p.97.86 Ibid., pp.101–2; and Mendelsohn and Vicziany, The Untouchables, pp.228–9.87 These were usually small areas of land held on non-transferable pattas. Vivek Kumar, ‘Uttar Pradesh: Politics Of
Change’, in Economic and Political Weekly (13 Sept. 2003) [http://www.epw.org.in, accessed 7 Apr. 2004].88 Jens Lerche, ‘Politics Of the Poor: Agricultural Labourers and Political Transformations in Uttar Pradesh’, in
Journal of Peasant Studies, Vol.26, nos.2 & 3 (1999) pp.211–2.
156 SOUTH ASIA

Dow
nloa
ded
By: [
Flin
ders
Uni
vers
ity o
f Sou
th A
ustra
lia] A
t: 02
:26
8 M
ay 2
007
the backward castes—who are almost as badly placed—is well-judged.89 But the
BSP appeals to more than the possibility of instituting policies that improve the
economic welfare of the lower castes. Police and officials as well as landlords and
other villagers have long coerced them. Vivek Kumar and Jens Lerche describe
the positive impact the advent of a government and officials sympathetic to their pos-
ition had on the relationships of the lower castes with both the official world and their
village employers.90 The potent combination of anticipated economic improvement
and social justice lay behind the enthusiasm with which the Scheduled Castes
responded to Kanshi Ram’s promotion of the BSP.
In UP the political strength of Mulayam Singh Yadav and the SP does not stem from
the poverty of its supporters: the great majority of families in the intermediate group
experience medium or high standards of living. Rather, it is an expression of their
numerical significance, their economic strength since the Green Revolution, and
the ambitions of their educated elite introduced to politics during the period of
Congress and—hence, a high caste—dominance.
Comparative DiscussionOur analysis shows that the big winners in terms of political power since the coming
of Independence have been the intermediate castes. This triumph occurred faster in
Andhra Pradesh and Tamil Nadu than in Bihar and Uttar Pradesh, because in the
south the intermediate castes already held much of the land, and there was a
strong non-Brahmin, pro-Dravidian ideology with an organisation ready to give it
expression. In the north there was no equivalent ideology and a larger proportion
of the population were of high caste than in the south. Some high caste families
had sufficient local political power from control over land to develop local vertical
clienteles.91
Our data shows too that there is a distinct temporal correspondence between the
accretion of political power and the improvement of standard of living. When we
compare the mean adult height of females born between 1950 and 1979, we find
the height of those from the intermediate groups in the southern states increasing
over the period, whereas in the northern states it stagnates. The progress of
those in the backward group of castes tends to echo that of the intermediate
89 Mendelsohn and Vicziany, The Untouchables, pp.218–9.90 Kumar, ‘Politics Of Change’; and Lerche, ‘Politics Of the Poor’, pp.212–5.91 Jaffrelot makes the point that in the north there is nothing similar to the Dravidian ideology. There is, indeed, the
opposite: not only are Ram and Krishna archetypal upper caste God-heroes, shared by caste Hindus, but the regional
nationalist heroes, particularly Nehru, Prasad and Jay Prakash Narayan, were from the high castes. Jaffrelot, ‘Rise Of
the Other Backward Classes’, p.107.
CASTE, INEQUALITY AND THE NATION-STATE 157

Dow
nloa
ded
By: [
Flin
ders
Uni
vers
ity o
f Sou
th A
ustra
lia] A
t: 02
:26
8 M
ay 2
007
group: steady improvement in the southern states, and stagnation in the north.
Among the Scheduled Castes, apart from a slight increase in mean height among
the sample from Andhra, there was either stagnation or regression.
Two trends stand out in these three decades. First, the living conditions of the high,
intermediate and the backward castes groups in the southern states all show an improve-
ment, whereas in the north only the situation of the high castes in Bihar improved.
Second, the welfare of the Scheduled Castes stagnates or regresses in every state.
In 1998–99 the majority of high caste families in the sample from the southern states
enjoyed a high standard of living, but only about a third was similarly placed in the
north. Most among the intermediate group from the southern states continued to do
well; though a quarter of families were poor, about the same proportion experienced
a high standard of living. In the north, however, those in the intermediate group were
less advantaged—especially this was the case in Bihar where, across all regions,
about 50 percent were poor, and only about 8 percent enjoyed a high standard of
living. At the state level in Uttar Pradesh the intermediate castes did better with
nearly 15 percent of families experiencing a high standard of living and less than
a quarter corralled among the poor—though those from the Western region were
more prosperous than those from the other regions. Among the families from the
backward group in the sample, those in the southern states also were better
placed. About twice as many as in the two northern states enjoyed a high standard
of living, and slightly less were numbered among the poor. The backward caste
group made some advances in all four states but between a half and a third remained
poor at the end of the century. The Scheduled Caste group shared a similar condition
in all four states: between 50 and 60 percent remained poor while only about
5 percent had reached a high standard of living.
Whereas the pattern of relative prosperity of the four caste groups in the southern
states is very similar, there are major differences between the situations of the
high and intermediate caste groups in Bihar and Uttar Pradesh. The standard of
living tables indicate that the prosperity of the intermediate group is much greater
in Uttar Pradesh—and this difference holds when the regional variations are taken
into account. The variation between the standard of living of the Scheduled Castes
in the two states, though, is not as large, reflecting the greater degree of continuing
inequality in Uttar Pradesh society and the general low standard of living in Bihar.
A significant part of the explanation for the difference between the relative pros-
perity of the intermediate groups lies in the approaches to land reform taken after
Independence. Despite the present importance of non-farm work for most groups,
agriculture remains the main economic activity in both states, and access to land
158 SOUTH ASIA

Dow
nloa
ded
By: [
Flin
ders
Uni
vers
ity o
f Sou
th A
ustra
lia] A
t: 02
:26
8 M
ay 2
007
retains a significant role in maintaining and improving a family’s life chances. In
the last century the major instrumentality enhancing widening access to land was
the Zamindari Abolition legislation. Using state-level data, Besley and Burgess
have recently demonstrated the positive impact of land reform on the reduction
of poverty.92 In neither UP nor Bihar were significant amounts of land allowed
to flow to the backward and Scheduled Caste sub-tenants and agricultural
labourers. In UP the legislation was largely designed by the Jat leader Chaudhuri
Charan Singh so that occupancy tenants—many from the intermediate castes—
came into possession of land taken from absentee, high caste and Muslim land-
lords.93 At Zamindari Abolition in 1951, there was some differentiation
between Western UP and Central and Eastern UP. In the former the intermediate
castes replaced most of the old zamindars, while the backward and Scheduled
Castes lost control of land some had held as tenants-at-will and sub-tenants. In
Central and Eastern UP the mainly high caste taluqdars and village zamindars
managed to retain a substantial proportion of their estates, the occupancy
tenants gained some land, and the lower castes got little or nothing.94 Therefore
by the 1970s the intermediate caste groups in Western UP were in a position to
take full economic advantage of the high yielding varieties of grain and related
technologies.
That Charan Singh was able to help shape the Zamindari Abolition legislation in UP
reflects the fact that members of the intermediate castes were drawn into the
Congress leadership ranks there much earlier than in Bihar. Moreover the lack of
accurate government land records in ‘permanently’ settled Bihar made the
implementation of the Zamindari Abolition legislation more difficult,95 while a
quirk of the legislation in Bihar enabled landlords to evict tenants who could not
prove their ‘occupancy’ rights—one among many loopholes and legal delaying
tactics used to avoid the transfer of land. In Bihar the major beneficiaries of the
land reforms of 1952 were the high castes and some among the intermediate
castes—especially the Yadavs, Kurmis and Koeris.96 There were, therefore, different
92 They probably underestimate the extent, and therefore influence, of land redistribution because they do not recog-
nise that ‘intermediary’ in the contemporary discussion of the legislation meant zamindar or other rent-receiver,
rather than agent. T. Besley and R. Burgess, ‘Land Reform, Poverty Reduction, and Growth: Evidence from
India’, in The Quarterly Journal of Economics, Vol.CXV, no.2 (May 2000), pp.389–430.93 Charan Singh, Agrarian Revolution in Uttar Pradesh (Lucknow: Publications Bureau, Govt. of UP, 1957), p.42.
The most complete discussion of the politics accompanying the Zamindari Abolition legislation in UP may be found
in Peter Reeves, Landlords and Governments in Uttar Pradesh; A Study Of Their Relations Until Zamindari
Abolition (Bombay, OUP, 1991), esp. pp.285–95.94 Lerche, ‘Politics of the Poor’, p.185.95 The majority of districts in UP had land revenue settlements every 30 years, and revenue and tenancy records were
more extensive than in Bihar.96 Chakravarti, ‘Caste and Agrarian Class’, p.1452; and F. Thomasson Jannuzi, Agrarian Crisis in India: The Case
Of Bihar (Austin: University of Texas, 1974), pp.29–33.
CASTE, INEQUALITY AND THE NATION-STATE 159

Dow
nloa
ded
By: [
Flin
ders
Uni
vers
ity o
f Sou
th A
ustra
lia] A
t: 02
:26
8 M
ay 2
007
structures of caste land-holding in the neighbouring states. The greater land-holding
strength of the intermediate castes in UP, especially in the Western region, is
reflected in the data on standard of living in Tables 12 and 16. In Bihar about 50
percent of the families from these caste-clusters contend with a low standard of
living, compared with about 20 percent in UP.
In the south the impact of the land reforms following independence varied in differ-
ent places and with the different zamindari and ryotwari systems.97 Generally they
were not as far-reaching as in UP. In predominantly ryotwari Tamil Nadu, the main
vehicle of reform was an act specifying the maximum amount of land that a family
could own. This was largely ineffective: the government indicated in 1960 that about
282,105 acres would be available for redistribution, but eleven years later only
20,977 acres had been assigned.98 Likewise in Andhra it was the intermediate
castes who benefited most from the agrarian changes that followed the accession
of Hyderabad to India. As tenants they gained control of much of the land following
zamindari abolition in coastal Andhra; where they were ryots they largely retained
their rights in the land.99
Political parties established to represent the interests of castes in the intermediate
group also did well as a consequence of these changes. Universal adult suffrage,
their numbers and economic strength—especially after the Green Revolution—
and the better education of their young men, enabled them to enter government.
This, in turn, opened the way for intermediate caste members to improve their
position in government service.
At the same time, their parties tried to broaden their electoral support by attempt-
ing to extend the proportion of reservations for the general category of OBC. This
strategy could be seen as supporting the ambitions of the group we have identified
as the backward castes, but in the event many of the newly-reserved positions fell
to the intermediate castes. As Jaffrelot argues, in the north ‘[t]he general OBC
category was, in fact, often used by a Yadav elite to promote its interests’.100
97 The difference between zamindari and ryotwari systems is that in the latter the ryot was thought of as the cultivator
of the land in a direct relationship with the state to which he paid the land revenue. In a zamindari estate, the zamin-
dar was thought of as an intermediary between the cultivating tenant and the state. Over time numerous ryots came to
use tenants-at-will to cultivate the land, so there was little difference between the systems. But the reforms in Madras
removed the zamindar, with compensation, from control of the land he let to tenants, while the ryot retained control
of his land. See H.D. Malaviya, Land Reforms in India (New Delhi: All India Congress Committee, 1954),
pp.174–200.98 G.Venkataramani, Land Reform in Tamil Nadu (Madras: Madras Institute of Development Studies, 1973),
pp.43–5.99 Srinivasulu, ‘Caste, Class and Social Articulation’, pp.5–6.100 Jaffrelot, ‘The Rise Of the Other Backward Classes’, p.101.
160 SOUTH ASIA
Dow
nloa
ded
By: [
Flin
ders
Uni
vers
ity o
f Sou
th A
ustra
lia] A
t: 02
:26
8 M
ay 2
007
However Jaffrelot goes on to draw attention to the recent fracturing of lower caste
support for these parties. As backward group members came to realise that the
Yadavs had gained most of the advantages from the political activities of the
SP, they looked for other political strategies and connections.101 In the south
the search by the backward castes for political vehicles for their ambitions is
somewhat more advanced. For example, the Vanniars in Tamil Nadu tend to
support the Pattali Makkal Katchi (PMK) as their own political vehicle in the
complex alliance-politics in the state.102
ConclusionThis study of four Indian states during the last half of the twentieth century has estab-
lished that the traditional correspondence of the socio-religious hierarchy of caste
with the gradations of well-being remains broadly unbroken. Nevertheless, the cor-
relation is no longer absolute. By the close of our period there were families in the
high and intermediate groups who were objectively poor, and a small proportion in
the backward and Scheduled Caste categories who were doing quite well. Part of this
shift seems to have been due to governmental intervention. Since the early 1950s
reservation policies, developed in many cases as the result of political agitation by
the backward castes themselves, have made a difference to some families. Reser-
vation has made it possible for a few among the lower castes to prosper, to
become educated, and to begin to make the most of their caste numbers to take
part in an increasingly complex political arena. As alliance politics becomes the
dominant model of the Indian political system, these opportunities will enlarge.
But for the past fifty years reservation policies have been much less important in
shaping the patterns of rural poverty and inequity than the post-colonial decisions
on land reform. It was access to land, after all, that ensured the future prosperity
of the bulk of the intermediate castes in three of the four states studied.
Research Note: Indian Indentured Labour Collection atFlinders University
Lance Brennan, John McDonald and Ralph Shlomowitz have deposited in the
Flinders University Library the published material collected in the course of their
ARC-funded projects related to Indian indentured labour. This includes photocopies
101 For a recent analysis of the use of caste as a tool within the current political system of Uttar Pradesh, see Sebastian
Schwecke, ‘The Rationality Of Politics in Uttar Pradesh: Towards a Re-Evaluation Of the Concept Of Factionalism’,
in Heidelberg Papers in South Asian and Comparative Politics, Working Paper No.18 (July 2003) [http://
www.sai.uni-heidelberg.de/abt/SAPOL/bin/hpsach18.pdf, accessed 10 Dec. 2004].102 Seven caste-based political parties were established in 2000–2001. See Harriss, ‘Cultural Nationalism in
Tamil Nadu’, pp.98, 114.
CASTE, INEQUALITY AND THE NATION-STATE 161
Dow
nloa
ded
By: [
Flin
ders
Uni
vers
ity o
f Sou
th A
ustra
lia] A
t: 02
:26
8 M
ay 2
007
of administration reports from the receiving ‘sugar’ colonies in the West Indies,
Mauritius, Natal and Fiji, from the tea plantation regions of Assam and Ceylon
that also used indentured labour, and a limited amount of material on Indian
labourers in Malaya. There are also some more recently-published articles on the
indentured labour systems. The Mauritian material includes two lists of Indian
slaves, comprising their names, information on their owner, work, colour, and
height. The first list is for 1817 and the second for 1826.
This material is kept in the Special Collections section of the Flinders University
Library and has a card index. For further information about this collection, including
a list of files and conditions of access, please see http://www.lib.flinders.edu.au/resources/collection/special/indianilc.html.
The Flinders Library also has substantial microfilm holdings of government corre-
spondence on the internal and external indentured labour systems. These are con-
tained in excerpts from the Government of India, Home Department Public
Proceedings (1860–1870), and Proceedings of the Government of Bengal in the
Emigration Department (1865–76). See catalogue for details.
The authors are indebted to Eva Aker for research assistance, Nada Lucia for tech-
nical assistance, and the International Institute for Population Sciences, Mumbai for
advice. We are also grateful for the perceptive questions raised by anonymous
readers. The Australian Research Council provided funding for the research.
162 SOUTH ASIA