sources of trace metals in streams and headwater lakes in finland
TRANSCRIPT

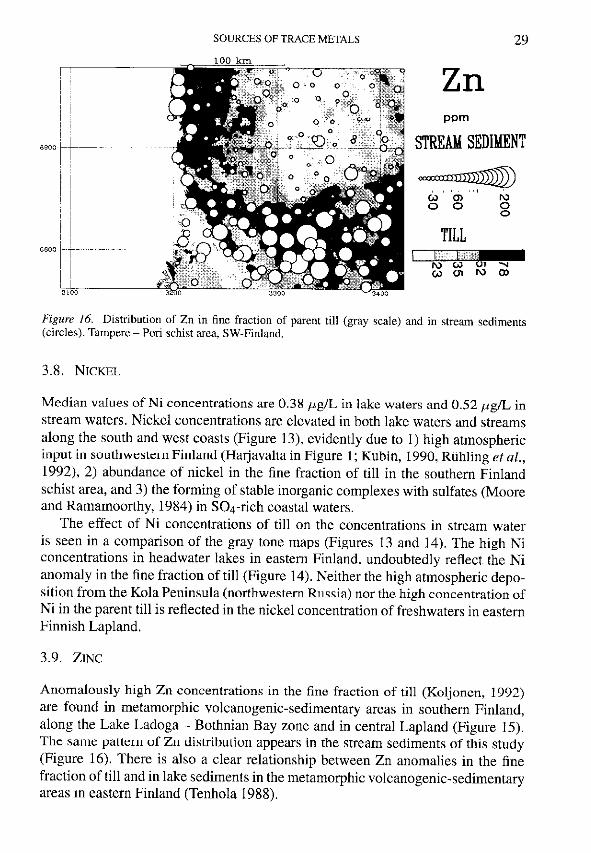
SOURCES OF TRACE METALS IN STREAMS AND HEADWATERLAKES IN FINLAND
TIMO TARVAINEN1, PERTTI LAHERMO1 and JAAKKO MANNIO21 Geological Survey of Finland, FIN-02150 Espoo, Finland; 2 Finnish Environment Agency, P.O.
Box 140, FIN-00251 Helsinki, Finland
(Received 24 February, 1995; accepted 11 December, 1995)
Abstract. Distributions of Mn, Zn, Cu, Ni, Cr, Pb, As, and Cd in Finnish surface waters werestudied by comparing two data sets: samples from 154 headwater lakes collected by the Water andEnvironment Administration in 1992 and samples from 1165 headwater streams collected during theenvironmental geochemical mapping program of the Geological Survey of Finland in 1990. It wasexpected that headwater lakes with catchments smaller than 1 km2 and high lake percentage (ratio oflake area to catchment size) would be more influenced by atmospheric trace metal deposition thanthe streams, with average catchment size of 30 km2.
The lakes with highest arsenic concentrations lie in an area with greenstones and arsenic-richblack schists. The same lakes have high copper concentrations, which evidently are derived from theCu-rich greenstones of the catchment. The high copper concentrations of streams and lakes in theindustrialized region of the southwest coast are due to several anthropogenic sources.
The highest concentrations of chromium occur in brown stream and lake waters rich in humicmatter, while manganese and zinc concentrations, which are controlled by acidity, tend to be elevatedin low-pH waters. The high nickel concentrations in lakes in southwestern Finland probably aredue to anthropogenic input, while Ni anomalies in stream and lake water in eastern Finland arecorrelated with high Ni contents of glacial till. The lead concentrations in lakes are mainly of airborneanthropogenic origin.
The pattern of atmospheric deposition is reflected in the concentrations of Cd, As, Cu, Zn, and Niin headwater lakes, but land-use, the natural distribution of metals in the overburden, water acidity,and the amount of humic substances influence the distribution of trace metals in both lakes andstreams. Thus the trace metal distribution in headwater lakes cannot be used alone to estimate thecontribution of anthropogenic atmospheric deposition to metal anomalies in Finnish surface waters.
Key words: geochemistry, trace metals, hydrochemistry, surface water, streams, lakes
1. Introduction
Finland is a relatively flat country, and the climate is humid. Marine and lacustrineclays are the most common deposits in southern and western Finland, whereaspeatlands and forested podzolic soils developed on till or glaciofluvical depositspredominante in the rest of the country. The soil cover is fairly thin, under 6 m,and the average chemical composition of the underlying bedrock resembles that ofgranodiorite.
Land-use in catchment areas, anthropogenic deposition, water acidity, the amountof dissolved solids and humus, as well as the natural geochemical distribution oftrace metals in bedrock and in the overburden control the trace metal concentra-tions in stream water. Physiographical, geological, and geochemical properties of
Water, Air, and Soil Pollution 94: 1–32, 1997.c 1997 Kluwer Academic Publishers. Printed in the Netherlands.

2 T. TARVAINEN ET AL.
the catchments, meteorological and hydrological conditions, and anthropogenicsources control the trace metal concentrations of headwater lakes.
In an attempt to evaluate whether headwater lakes could be used to recognizethe airborne anthropogenic contribution in the distribution of heavy metals insurface waters, a comparison was made between trace metal concentrations inheadwater streams and lakes, and correlation coefficients were calculated for metalconcentrations and various factors presumed to influence these concentrations.
Stream water and stream sediment samples were samples collected from head-water streams all over Finland as part of the environmental geochemical mappingprogram of the Geological Survey of Finland during August – September 1990(Lahermo et al., 1991). Lake water samples were collected from Finnish headwa-ter lakes by district offices of the Water and Environment Administration in 1992in connection with the national programme for the monitoring of surface wateracidification (Mannio et al., 1995). Because the average catchment size of thestreams was 30 km2, while the headwater lakes had a much smaller catchment area(median 0.1 km2) and a large surface area relative to the catchment size, the lakeswere thought likely to reflect the anthropogenic deposition of heavy metals.
2. Materials and Methods
2.1. LAKES
The 153 lakes for which trace metal analyses were available were a part of theregional acidification monitoring programme in Finland. The lakes were locatedthroughout Finland in sparsely populated, forested areas at the heads of drainagebasins. Some of the lakes in southern Finland (south of ca. 61�300), particularlyones in the vicinity of Helsinki, were situated only 20 km from population centers.The median area of the 153 lakes was ca. 0.1 km2.
The sampling procedure followed the Nordic standard method (SFS 5503, 1990;based on Norwegian NS 4784 and Swedish SS 028194 standards) designed toprevent contamination in sampling and sample handling. High density polyethylene(HDPE, Nalgene Labware, 125 mL) bottles were soaked in 7 M HNO3 solutionfor 3–4 days and rinsed seven times with deionized water and twice with doubledistilled water prepared in a quartz glass apparatus. The bottles were not soakedin 0.05 M nitric acid after the HCl treatment as suggested in the Nordic standardmethod. The bottles were kept in double plastic bags until sampling. Samples weretaken from below (0.1 m) the surface layer of the lakes directly into the bottles, byhand. Sample collectors wore plastic gloves to avoid contaminating the sample. Theouter plastic bag was discarded in the laboratory and the samples were preservedwith 0.5 mL conc. HNO3 (suprapur) and kept cool (+4 �C). The methods, includingblank and recovery analyses, are described in detail in Mannio et al. (1995). Thesample blanks were prepared similarly to samples in the laboratory, but without the
SOURCES OF TRACE METALS 3
field sampling step. The sample blank values were not subtracted from the samplevalues. All the freshwater samples were analyzed two or three times and the finalresult reported is the mean value of these replicate results.
The general water quality variables were measured by the standard methods thenused by National Board of Waters and the Environment (now the Finnish Environ-ment Agency). These variables included chemical oxygen demand (CODMn), totalorganic carbon (TOC), pH, Gran alkalinity, conductivity (EC), sulfate (SO4), chlo-ride (Cl), nitrate (NO3), phosphorus (P), silica (SiO2), calcium (Ca), magnesium(Mg), sodium (Na), potassium (K), iron (Fe), and manganese (Mn).
Samples were analyzed by ICP-MS (Perkin Elmer Sciex Elan 5000) for alu-minum (Al), arsenic (As), cadmium (Cd), chromium (Cr), copper (Cu), nickel (Ni),lead (Pb) and zinc (Zn).
2.2. STREAM WATER
Stream water and organic stream sediment samples were collected from 1165 sam-pling points throughout Finland in August – September 1990. The mean samplingdensity was one sample per 300 km2. Each sampling point represents a drainagearea of ca. 30 km2. Specific conductivity, pH, alkalinity, CODMn, color (mg Pt/L),SO4, Cl, fluoride (F), bromide (Br), and NO3 were determined in untreated, 500-mL water samples at the Geological Survey of Finland. Filtered (<0.45 �m) andacidified water samples (suprapur HNO3, pH<2) were prepared for the analysisof Ca, Mg, Sr, Ba, Na, K, Li, total acid-soluble aluminum (Al), heavy metals(e.g. Fe, Mn, Zn, Cu, Ni, Co, Cr, Pb, Cd, U) and other trace elements (molybde-num (Mo), arsenic (As), boron (B), thallium (Tl) and selenium (Se)) by ICP-AESand ICP-MS methods. The sterilized plastic syringes and membran filters (<0.45�m) were used without prior cleaning. The disposable syringes and filters wereemployed only once, for one sample. The 100-mL bottles used in the analysis ofwater samples by ICP-AES and ICP-MS were not prewashed. In control testing,all equipment was confirmed to be free of metals. In the present study, only theconcentrations of Mn, Zn, Cu, Ni, Cr, Pb, As, and Cd are discussed.
2.3. STREAM SEDIMENT
Stream sediment samples were collected by using a scoop net with mesh diameterof 0.06 mm. A composite sample was scooped within a distance of 10 meters bystirring the bottom deposits. The main part of the sediment was composed of plantand animal detritus and fresh and variedly decayed plant fragments, all mixed withvarious proportions of humus and mineral material.
The stream sediment samples were dried, milled, and sieved and the <2 mmfraction was leached with conc. HNO3 in a microwave oven. The leachate wasanalyzed by ICP-AES and ICP-MS methods in the same way as the stream watersamples.
4 T. TARVAINEN ET AL.
2.4. DATA PROCESSING
The data sets were compared by using statistical analyses and distribution maps.The distributions of heavy metals are presented as combination maps with streamwater quality shown as background with a gray scale and the metal concentrationsof headwater lakes as superimposed circles.
The stream water metal concentrations were first interpolated and smoothed intoa regular 2� 2 km2 grid. The grid values were calculated using a moving weightedmedian in a circular window (radius 96 km). Then, a five-grade gray scale wasselected to present the distribution. Finally, the concentrations of metal in the lakewater were represented as variable circle size. The map production and statisticaltreatment were done at the Geological Survey of Finland using the ALKEMIAsoftware (Ahlsved et al., 1991).
The land-use classification of the stream catchments was made by the NationalLand Survey of Finland and the Environmental Data Centre on the basis of LandsatTM satellite image interpretation, digitized peatland masks from maps 1:100 000or 1:200 000, and digitized arable land masks from 1:50 000 topographic maps(Vuorela, 1993). The data present the land-use situation in 1990. The division intodrainage areas used in the land-use classification was not exactly the same as theone used in stream water sampling. However, the average catchment area was30 km2 in both cases, and 1030 areas were selected for statistical analysis usinga GIS approach. Land-uses of headwater lake catchments were planimetered from1:20 000 topographic maps.
3. Results and Discussion
3.1. SOURCES AND GEOCHEMICAL CONTROLS
High concentrations of trace metals in natural materials may derive from natural oranthropogenic sources. Bedrock geochemistry and the distribution of trace metalsin the overburden are reflected in the natural trace metal concentrations of streams,with weathering rate, leaching, and retention reactions in the catchment area con-trolling the metal input. The thickness and type of humus and the type of driftcontrol the amount of water and so the trace metal infiltration and transport intostreams. The input of anthropogenic deposition is superimposed on the naturalconcentrations.
It was expected that, relative to streams, the headwater lakes, with their smallcatchments and high lake percentage (ratio of lake area to catchment area), wouldbe more susceptible to the influence of atmospheric metal input from direct pre-cipitation and dry particle fallout. Small lakes in small catchment are particularysusceptible to acidification due to the atmospheric deposition of strong acids, whichincreases trace metal solubility.

SOURCES OF TRACE METALS 5
Table IMetal concentrations in headwater lakes and stream waters in Finland. NT = number of analyses.NL= number of results below the analytical detection limit
Lakes Streams
Median Min–Max NT NL Median Min–Max NT NL
As �g/L 0.33 0.08–5.20 152 0 0.36 <0.20–6.50 1160 291Cd �g/L 0.04 0.03–0.13 152 0 <0.02 <0.02–1.36 1161 938Cr �g/L 0.21 0.01–1.40 152 0 0.50 <0.30–6.13 1161 266Cu �g/L 0.31 <0.11–4.30 151 6 0.64 <0.10–24.5 1161 9Mn �g/L 21.0 2.00–380.0 153 0 29.0 0.08–3100.0 1147 0Ni �g/L 0.38 0.06–2.10 152 0 0.52 <0.20–190.0 1161 133Pb �g/L 0.33 <0.03–2.00 152 1 0.23 <0.05–8.78 1161 10Zn �g/L 3.58 <0.70–14.3 152 4 3.57 0.52–301. 1161 0
Heavy metal concentrations were usually lower in the headwater lakes than instream waters (Table I). The pattern of atmospheric deposition as measured in moss(Ruhling and others, 1992) was reflected in the concentrations of Cd, As, Cr, Zn,and Ni, but not in the concentrations of Cu and Pb (Mannio et al., 1995).
Several possible point sources for the atmospheric metal load are indicatedin Figure 1. Direct industrial point sources to waters were avoided in the siteselection. According to Wahlstrom and co-workers (1992), industrial heavy metalemissions to the atmosphere in Finland are concentrated in the southern and westernparts of the country. The most massive pollutor of water and air in Finland is thewood-processing industry, and elevated levels of Al and Hg have been encounteredin lichens around a large sulfate-cellulose factory in southern Finland. Wood-processing did not, however, affect the concentrations of the metals of our study(Kytomaa et al., 1995). The nickel refinery at Nikel, Pechenga (NW Russia), nearthe Finnish border, is presented as a major foreign point source. Non-point sourcessuch as traffic and paints are more important for Pb and Hg.
Local land-use has an effect on the amount and distribution of humus and dis-solved solids, alkalinity, pH, and metals of surface waters and sediments. Extensiveditching and draining of peatlands for forestry has been a major land-use changein several catchments (Kortelainen et al., 1989). According to Lundin (1988),drainage will lower stream water pH and increase the concentration of organicmatter during the first months after ditching, while pH, alkalinity, and contents ofcations and nitrogen will increase later on.
Table II shows correlations between heavy metal concentrations and pH, colorvalue, COD (chemical oxygen demand) and SO4 concentrations in stream waters.Since metal concentrations are log normally distributed, the logarithms of themeasured concentrations were used in calculations. Correlation coefficients fortrace metal concentrations and pH were negative, indicating that larger amounts


SOURCES OF TRACE METALS 7
Table IIPearson’s correlation coefficients between pH, color, chemical oxy-gen demand (COD), SO4 concentrations and metal concentrationsin Finnish stream waters. Number of pairs 1160. ** p< 0.1, *** p< 0.01
pH Color COD(Mn) SO4
mg Pt/L mg/L
Log As –0.240*** 0.485*** 0.470*** 0.180***Log Cd –0.333*** 0.353*** 0.299*** 0.303***Log Cu –0.149*** 0.310*** 0.239*** 0.381***Log Cr –0.325*** 0.661*** 0.654*** 0.098**Log Mn –0.225*** 0.425*** 0.385*** 0.324***Log Ni –0.156*** 0.339*** 0.242*** 0.561***Log Pb –0.148*** 0.303*** 0.305*** –0.050**Log Zn –0.493*** 0.499*** 0.417*** 0.406***
Table IIIRanks of trace metal concentrations in stream waters vs.percentage of two land-use classes (arable lands and peat-lands) in catchments. ++ = percentage of land-use classis higher when metal concentration is elevated. – = per-centage of land-use class is smaller when concentration ofmetal is elevated. oo = no significant trend
Land-use class
Metal Stream water Stream sediment
Arable Peatland Arable Peatlandland land
As ++ – ++ –Cd oo oo ++ –Cr oo ++ ++ –Cu ++ – ++ –Mn ++ oo oo ooNi ++ – ++ –Pb oo ++ ++ –Zn ++ oo ++ –
these metals are relatively stable in non-acid arable soils, converting farmland intoforest should eventually decrease the soil pH and increase their mobility (Stiglianiand Salomons, 1993).
Streams with peatland predominating in their catchment tended to have rela-tively high Cr and Pb concentrations. Metal patterns of stream waters and streamsediments differed. When a high percentage of the catchment was arable land,chromium was trapped in organic stream sediments. In areas with a high percent-
8 T. TARVAINEN ET AL.
age of peatland, on the other hand, waters contained larger amounts of humicsubstances and Cr was maintained in the water phase.
Marine clay and silt deposits containing exceptionally high S contents aredistributed over a broad coastal belt, tens of kilometers wide in the west andsouthwest, and particulary between Vaasa and Oulu and to the south of Pori (Palko,1994). These acid sulfate soils were deposited on the bottom of postglacial LittorinaSea, which was more salty and nutrient-rich than the present Baltic Sea, and maycontain as much as 0.1 to 3.0% sulfur.
Reclamation and ditching of land in these areas cause sulfides to oxidize intosulfuric acid and mobilization of metals. Lack of detailed information on the arealdistribution of acid sulfate soils prevents an evaluation of their impact on the metalcontents of headwater streams. However, it is clear that acidification originatingfrom acid sulfate soils increases the chemical load in streams in the west andsouthwest.
Chromium correlated negatively with the lake percentage in headwater lakes(Table IV), while headwater lake Fe, Cr and Pb concentrations correlated neg-atively with the percentage of peatlands in the catchment. Small upland lakeslocated in exposed bedrock or boulder terrains tended to have high Cd, Ni and Znconcentrations.
Correlations between metal concentrations are presented in Tables V (headwaterlakes), VI (stream waters), and VII (combined). Correlation coefficients withingroups were high. In the lake samples, distributions of Cd, Mn, and Zn tended todiffer from the distributions of other metals. They were not correlated with Cu andCr, for example. Within stream water samples, the concentration of lead was leastcorrelated with the behavior of the other trace metals. Table VII shows that highconcentrations of all the metals studied except lead, and to some extent Cr, usuallyco-existed in the two sampling materials.
3.2. ARSENIC
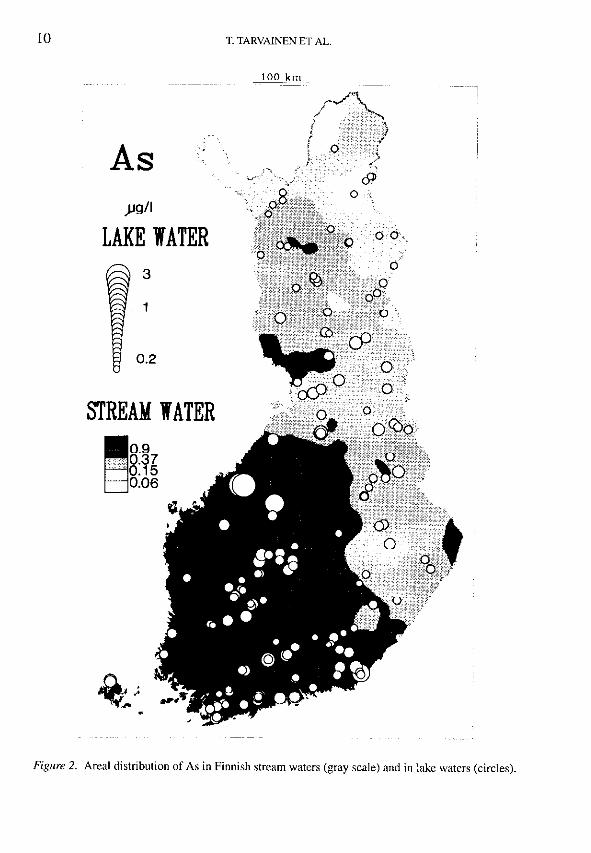
The median values of arsenic concentrations in lakes and streams are 0.33 �g/Land 0.36 �g/L, respectively (Table I). The values are of the same magnitude asin studies of other freshwaters. For example, in 59 lakes in central and northernSweden, the mean value was 0.25 �g/L (Borg, 1987) and in ten major rivers in thesouthwestern United States, concentrations ranged from 0.15 to 0.45�g/L (Mooreand Ramamoorthy, 1984).
Distribution of arsenic in stream waters (gray scale in Figure 2) is closely similarto the distribution in the fine fraction of glacial till (Figure 3). Lowest As values arefound in areas of Archean gneiss in eastern and northern Finland, and highest valuesin areas of volcanic-sedimentary rock in southern and western Finland (Koljonen,1992). Bedrock chemistry is reflected not only in the metal contents of the parenttill, but also in the upper soil layers. A similar situation is found in Norway, where

SOURCES OF TRACE METALS 9
Tabl
eIV
Pea
rson
’sco
rrel
atio
nco
effi
cien
tsbe
twee
nlo
gari
thm
ofm
etal
conc
entr
atio
nsin
head
wat
erla
kew
ater
san
dth
eva
riab
les
desc
ribi
ngca
tchm
ent.
Lak
e%=
arcs
in[s
qr(l
ake/
catc
hmen
tar
ea)]
;P
eat%
=ar
csin
[sqr
(pea
tland
area
/cat
chm
ent)
];R
ock%
=ar
csin
[sqr
(bed
rock
terr
ain
+bo
ulde
rfi
eld
area
/cat
chm
ent)
].L
ogar
ithm
san
dar
cuss
ins
ofsq
uare
root
sar
eca
lcul
ated
toob
tain
mul
tino
rmal
dist
ribu
tion
s.**
*P
<
0.00
1
As
Cd
Cr
Cu
FeM
nN
iPb
Zn
Lak
e%–0
.067
0.10
8–0
.507
***
–0.0
98–0
.337
***
–0.0
35–0
.136
–0.2
12–0
.052
Pea
t%0.
148
–0.1
310.
551*
**0.
069
0.55
8***
0.15
00.
100
0.33
2***
–0.0
08R
ock%
0.06
20.
414*
**–0
.061
0.23
5–0
.028
0.04
90.
359*
**0.
106
0.33
4***

SOURCES OF TRACE METALS 11
Table VPearson’s correlation coefficients between logarithms of metal concentrations in head-water lakes (152 samples). ** P< 0.001
As Cd Cr Cu Mn Ni Pb
Cd 0.213Cr 0.299** –0.127Cu 0.469** 0.096 0.557**Mn 0.351** 0.211 0.211 0.156Ni 0.239** 0.344 0.445** 0.496** 0.363**Pb 0.508** 0.421 0.513** 0.404** 0.293** 0.992**Zn 0.512** 0.591 0.025 0.128 0.393** 0.360** 0.448**
Table VIPearson’s correlation coefficients between logarithms of metal concentrations in stream waters(1160 samples). *** P< 0.001
As Cd Cr Cu Mn Ni Pb
Cd 0.383***Cr 0.429*** 0.339***Cu 0.577*** 0.509*** 0.343***Mn 0.620*** 0.368*** 0.472*** 0.555***Ni 0.502*** 0.507*** 0.427*** 0.442*** 0.589***Pb 0.180*** 0.278*** 0.374*** 0.132*** 0.193*** 0.050Zn 0.480*** 0.595*** 0.478*** 0.618*** 0.520*** 0.667*** 0.186***
Lag and Steinnes (1978) report that arsenic concentration of the Norwegian forestsoil humus layer seems to depend on local geology.
Table VIIPearson’s correlation coefficients between logarithms of metal concentrations in headwater lakes (rows) andinterpolated values from stream waters (columns). *** P< 0.001
As Cd Cr Cu Mn Ni Pb Zn
As 0.547*** 0.362*** 0.183 0.399*** 0.515*** 0.368*** 0.112 0.526***Cd 0.371*** 0.209 –0.221 0.366*** 0.109 0.293*** –0.018 0.233Cr –0.060 –0.031 0.413*** –0.096 0.040 0.052 0.062 0.019Cu 0.253 0.235 0.087 0.295 0.152 0.389*** 0.039 0.263Mn 0.423*** 0.321*** 0.125 0.313*** 0.265 0.161 0.038 0.400***Ni 0.325*** 0.363*** 0.030 0.478*** 0.169 0.508*** –0.122 0.326Pb 0.211 0.127 0.107 0.154 0.138 0.154 0.068 0.169Zn 0.520*** 0.298*** –0.003 0.388*** 0.403*** 0.318*** 0.116 0.415***


16 T. TARVAINEN ET AL.
1.0 �g/L (1.36 �g/L), which is toxic for several aquatic species (Louekari et al.,1991).
A general northwards decreasing trend of atmospheric Cd deposition has beenobserved for moss samples (Ruhling et al., 1992). Cadmium is released to theatmosphere from Zn and Cu refineries, from foundries and from the iron and steelindustry. The most important point sources are located at Harjavalta, Kokkola andImatra (Figure 1, Wahlstrom et al., 1992). In Finnish lake sediments, Cd contentsare strongly increased in the uppermost sediment layers, which have accumulatedduring the last few decades (Verta et al., 1989).
The high atmospheric Cd deposition in the south is reflected in Cd concentra-tions of headwater lakes (Figure 6). Alone among the studied metals, cadmiumexhibits a positive (though not significant) correlation with the lake percentage(Table IV), which also points to an atmospheric dominated supply. Cadmium andzinc concentrations are high along the west coast in acid stream waters with highamounts of dissolved solids. Besides the atmospheric input, catchment soils obtaina Cd supply from fertilizers, manure and lime (Mukherjee, 1994). Stream sedi-ments also reflect the soil geochemistry: anomaly patterns of cadmium and zinc instream sediments follow the areal distribution of zinc in the fine fraction of till insouthern Finland (Koljonen, 1992).
3.4. CHROMIUM
Chromium concentrations in Finnish stream waters (median 0.50 �g/L) and head-water lakes (median 0.21 �g/L) are generally low, and at the same level as inSwedish lakes (Borg, 1987) and groundwaters (Ledin et al., 1989). In other stud-ies, dissolved concentrations in unpolluted lakes and rivers have been typically 1–2�g/L (Moore and Ramamoorthy, 1984). In eastern Finnish Lapland, the distributionof Cr in stream waters and lakes (Figure 7) reflects the till geochemistry distributionpattern; elsewhere, high Cr concentrations in surface waters tend to be found inbrown colored, humic lakes. The Pearson’s correlation coefficient between Cr andTOC concentrations in lake water samples is 0.78. The high TOC concentrationsof stream waters in central western Finland are explained by the abundance ofpeatlands (Figure 8).
Chromium anomalies around the fine steel industry in Tornio (Figure 1) andalong the south coast may be due to atmospheric deposition (Ruhling et al., 1992).The most important point sources of Cr released to the atmosphere in 1990, inTornio 20 000 kg/year, Karhula 4400 kg/year and Imatra 1400 kg/year, are shownin Figure 1 (Wahlstrom et al., 1992).
High Cr concentrations in till in southwestern Finland are not reflected in eitherstream or lake waters. The surface waters in these areas have higher pH and lessdissolved humic materials, and the chromium anomalies are seen only in organicstream sediments (Lahermo et al., 1995b).


20 T. TARVAINEN ET AL.
3.5. COPPER
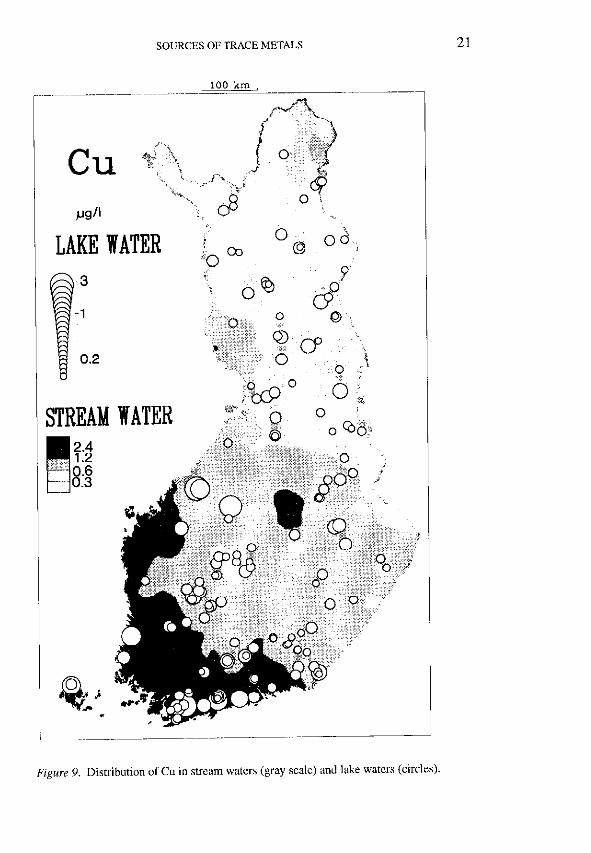
The median value of stream water Cu concentration is 0.64 �g/L, which is compa-rable to the usual range of 0.5 to 1.0 �g/L for uncontaminated freshwaters (Mooreand Ramamoorthy 1984). The median value of Finnish headwater lakes is only0.31 �g/L.
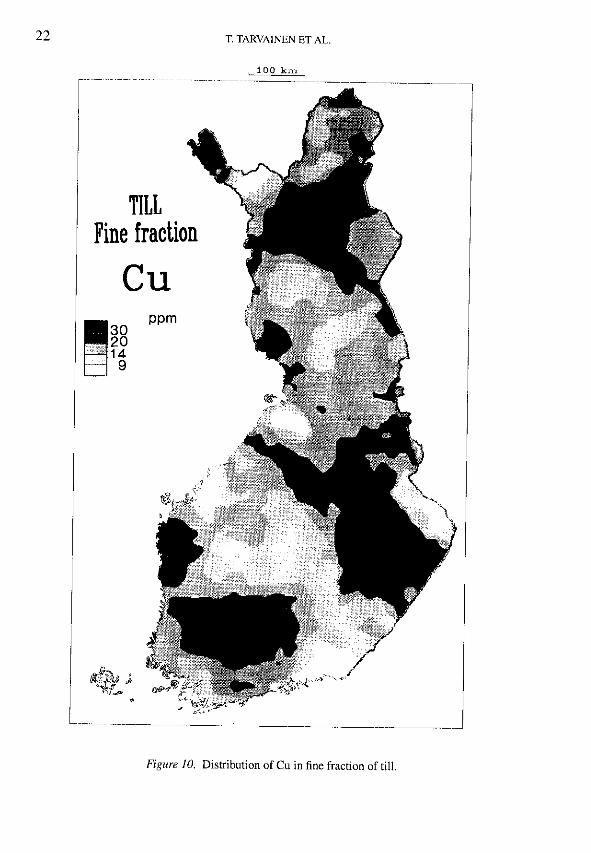
Till geochemistry is reflected in the copper distribution in water (Figures 9and 10) in southern Finland. Copper-rich volcanogenic rocks are not reflected instream waters in Lapland, however. Three small lakes on the west coast have highAs and Cu values, which probably derive from local metalliferous schists and maficmetavolcanites (Nykanen, 1962; Lonka, 1971).
The atmospheric heavy metal deposition documented in the mapping of moss(Ruhling et al., 1992) suggests that some copper anomalies in southwest Finland(metal industry in Harjavalta), central Finland (Pyhasalmi mine) and northeast-ern Lapland are related to anthropogenic deposition (Figure 1). The strataboundPyhasalmi Zn-Cu occurrence located in the main sulfide ore belt which crossesFinland from Lake Ladoga to Bothnian Bay can be assumed to contribute to theCu concentrations in surface waters in that area (Ekdahl, 1993).
Copper anomalies in streams can be partly explained by the area of arable landin the catchment. Clay deposits have higher Cu content than coarser soils, andcopper-enriched fertilizers are applied to fields (Kauranne and Sillanpaa, 1992).During 1989 – 1990, an average of 282 g Cu/ha was added to Finnish arable soils(Anon, 1990). Samples with lowest Cu concentration in stream water (first quartile)came from areas where only 2% of the drainage area was cultivated. In copper-richcatchments (fourth quartile), 22% of the area was cultivated, which points either topollution from fertilers or the effect of fine-grained bottom sediments.
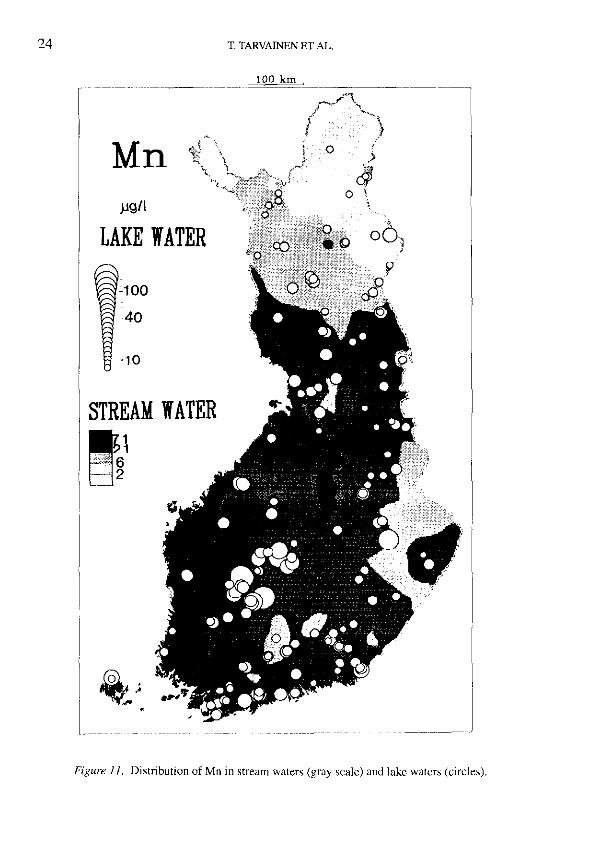
3.6. MANGANESE
Mobilization of Mn is strongly controlled by dissolved humus (Zajicek and Pojasek,1976). Stream water color and Mn concentration (Figure 11) show similar anom-alies in peatland areas of western central Finland. The patterns of Mn concentrationin stream water and the ratio Mn/Fe (aqua regia leachable) in the fine fraction oftill (Koljonen 1992) are similar in eastern central Finland. Likewise, the patternsof stream water Fe and Mn concentrations are nearly similar (Lahermo and others,1995a).
Headwaters in Scandinavia with high Mn concentration are often influenced bylow pH (e.g. Borg, 1986, Mannio et al., 1993). According to Urban et al. (1990), theconcentration of Mn in Nova Scotia lakes is controlled by the H+ ion concentration(low pH) and the size of catchment relative to the lake surface area and not by theconcentration of dissolved organic carbon. In western Finland, lake water acidity isoften controlled by humic substances, and thus Mn concentration is elevated in the
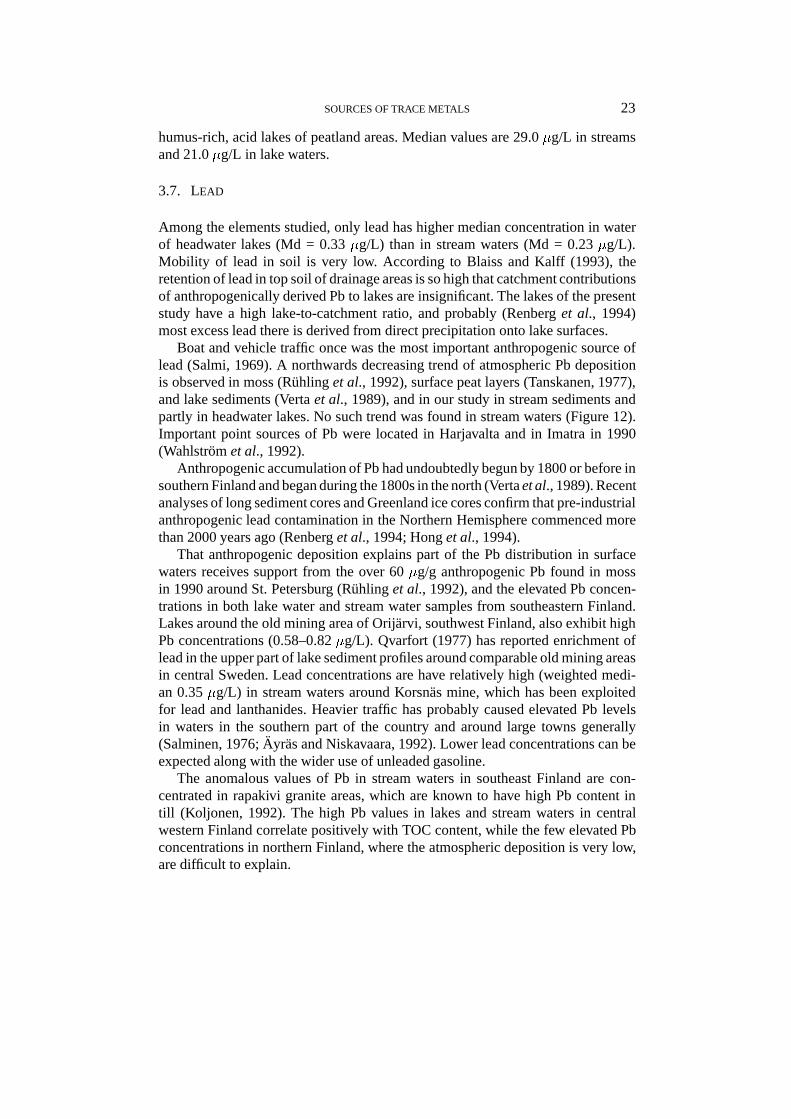
SOURCES OF TRACE METALS 23
humus-rich, acid lakes of peatland areas. Median values are 29.0 �g/L in streamsand 21.0 �g/L in lake waters.
3.7. LEAD
Among the elements studied, only lead has higher median concentration in waterof headwater lakes (Md = 0.33 �g/L) than in stream waters (Md = 0.23 �g/L).Mobility of lead in soil is very low. According to Blaiss and Kalff (1993), theretention of lead in top soil of drainage areas is so high that catchment contributionsof anthropogenically derived Pb to lakes are insignificant. The lakes of the presentstudy have a high lake-to-catchment ratio, and probably (Renberg et al., 1994)most excess lead there is derived from direct precipitation onto lake surfaces.
Boat and vehicle traffic once was the most important anthropogenic source oflead (Salmi, 1969). A northwards decreasing trend of atmospheric Pb depositionis observed in moss (Ruhling et al., 1992), surface peat layers (Tanskanen, 1977),and lake sediments (Verta et al., 1989), and in our study in stream sediments andpartly in headwater lakes. No such trend was found in stream waters (Figure 12).Important point sources of Pb were located in Harjavalta and in Imatra in 1990(Wahlstrom et al., 1992).
Anthropogenic accumulation of Pb had undoubtedly begun by 1800 or before insouthern Finland and began during the 1800s in the north (Verta et al., 1989). Recentanalyses of long sediment cores and Greenland ice cores confirm that pre-industrialanthropogenic lead contamination in the Northern Hemisphere commenced morethan 2000 years ago (Renberg et al., 1994; Hong et al., 1994).
That anthropogenic deposition explains part of the Pb distribution in surfacewaters receives support from the over 60 �g/g anthropogenic Pb found in mossin 1990 around St. Petersburg (Ruhling et al., 1992), and the elevated Pb concen-trations in both lake water and stream water samples from southeastern Finland.Lakes around the old mining area of Orijarvi, southwest Finland, also exhibit highPb concentrations (0.58–0.82 �g/L). Qvarfort (1977) has reported enrichment oflead in the upper part of lake sediment profiles around comparable old mining areasin central Sweden. Lead concentrations are have relatively high (weighted medi-an 0.35 �g/L) in stream waters around Korsnas mine, which has been exploitedfor lead and lanthanides. Heavier traffic has probably caused elevated Pb levelsin waters in the southern part of the country and around large towns generally(Salminen, 1976; Ayras and Niskavaara, 1992). Lower lead concentrations can beexpected along with the wider use of unleaded gasoline.
The anomalous values of Pb in stream waters in southeast Finland are con-centrated in rapakivi granite areas, which are known to have high Pb content intill (Koljonen, 1992). The high Pb values in lakes and stream waters in centralwestern Finland correlate positively with TOC content, while the few elevated Pbconcentrations in northern Finland, where the atmospheric deposition is very low,are difficult to explain.


SOURCES OF TRACE METALS 31
High Zn concentrations in the headwater lakes and stream waters (Figure 17)seldom are correlated with bedrock or till geochemistry. High Zn values are morelikely to occur in acid surface waters. In the south, high Zn values are observed forsmall acid lakes situated in highly exposed bedrock areas. The Pearson’s correlationcoefficient between the logarithm of lake water Zn concentration and pH is –0.56(p < 0.001).
Catchments with Zn-rich stream water have a high percentage of arable land.Besides atmospheric deposition, these areas obtain Zn load from fertilizers. HighestZn values in stream waters are found in the west coast, where also SO4 concen-trations in streams are high. Sulfur is derived from acid sulfate-bearing postglacialLittorina sediments on the west coast, and to a lesser extent from atmosphericdeposition.
4. Conclusions
According to our results, the anthropogenic atmospheric pollution of natural watersis more clearly seen in the increase of Cd, As, Cr, Zn, and Ni concentrations thanof Cu, Mn, and Pb, and more clearly in the water of small headwater lakes thanof streams. Heavy metal concentrations in headwater lakes and streams are alsoheavily influenced by a) bedrock lithology, b) soil granulation and chemistry of thecatchment, c) land-use such as cultivation, fertilization and ditching in the catch-ment area, and d) the main hydrogeochemical parameters such as pH, alkalinity,and TOC. These last are related to catchment type. Thus human influence is notreadily apparent, much less measureable, even in a study like this, concentratedon small headwater lakes with high ratio of lake area to catchment size. To assessthe anthopogenic contribution to metal concentrations in surface waters, lake watersampling should be supplemented with sediment studies.
References
Ahlsved, C., Lampio, E. and Tarvainen, T.: 1991, J. Geochem. Exploration 41, 23.Anon.: 1990, Lannotteiden myynnin jakautuminen maatalouskeskusalueittain lannoitusvuonna
1989/90. [In Finnish] Kemira. p. 20.Ayras, M. and Niskavaara, H. 1992.: Geological Survey of Finland, Report of Investigation 108, 1.Blaiss, J. M. and Kalff, J.: 1993, Biogeochemistry 23, 1.Borg, H.: 1983, Hydrobiology 101, 27.Borg, H.: 1986, Water, Air, and Soil Pollut. 30, 1007.Borg, H.: 1987, Water Research 21, 65.Ekdahl, E.: 1993, Geol. Survey of Finland, Bull. 373, 137.Hong, S., Candelone, J.-P., Patterson, C. C. and Boutron, C. F.: 1994, Science 265, 1841.Kauranne, K. and Sillanpaa, M.: 1992, ‘Chemical Elements in Living Organisms and Industry’, in
Koljonen, T. (ed.), The Geochemical Atlas of Finland, Part 2: Till. Geological Survey of Finland,Espoo, pp. 88–105.
Koljonen, T.: 1992, ‘Results of the Mapping’, in Koljonen, T. (ed), The Geochemical Atlas of Finland,Part 2: Till. Geological Survey of Finland, Espoo, pp. 106–218.

32 T. TARVAINEN ET AL.
Kortelainen, P., Mannio, J., Forsius, M., Kamari, J. and Verta, M.: 1989,Water, Air, and Soil Pollut.46, 235.
Kubin, E.: 1990, ‘A Survey of Element Concentrations in the Epiphytic Lichen Hypogymnia Physodesin Finland in 1985–86’, in P. Kauppi, P. Anttila and K. Kenttamies (eds.), Acidification in Finland.Finnish Acidification Research Programme HAPRO 1985–1990. Springer-Verlag, pp. 421–467.
Kytomaa, A., Nieminen, S., Thuneberg, P., Haapala, H. and Nuorteva, P.: 1995, Water, Air and SoilPollut. 81, 401.
Lag, J. and Steinnes, E.: 1978, Geoderma 20, 3.Lahermo, P., Mannio, J. and Tarvainen, T.: 1995a, Appl. Geochemistry 10, 45.Lahermo, P. Salminen, R., Tarvainen, T. and Vaananen, P.: 1995b, Geological Survey of Finland,
Special Paper 20, 155.Lahermo, P., Tenhola, M., Ilmasti, M. and Vaananen, P.: 1991, Vesitalous 32, 1, 42.Ledin, A., Petterson, C., Allard, D. and Aastrup, M.: 1989, Water, Air, and Soil Pollut. 47, 419.Long, S. E. and Martin, T. D.: 1991, ICP Information Newsletter 16, 460.Lonka, A.: 1971, Sheet 2323 – Kaustinen. Geological Map of Finland. Pre-Quaternary Rocks.
Geological Survey of Finland.Lundin, L.: 1988, ‘Impacts of Drainage for Forestry on Runoff and Water Chemistry’,in Proceedings
of the International Symposium on the Hydrology of Wetlands in Temperate and Cold regions,Joensuu, Finland 6–8 June 1988. Vol 1. Publications of the Academy of Finland. Helsinki,pp. 197–205.
Mannio, J., Jarvinen, O., Tuominen, R. and Verta, M.: 1995, The Science of the Total Environment.160/161, 433.
Mannio, J., Verta, M. and Jarvinen, O.: 1993, Appl. Geochemistry. Suppl. Issue 2: 57.Moore, J. W. and Ramamoorthy, S.: 1984, Heavy Metals in Natural Waters. Applied Monitoring and
Impact Assessment, Springer-Verlag, 268 p.Mukherjee, A. B.: 1994, ‘Fluxes of Lead, Cadmium and Mercury in the Finnish Environment and the
Use of Biomonitors in Checking Trace Metals’, Environmentalica Fennice 18, 59 p.Nykanen, O.: 1962, Sheet 2334 – Kinnula. Geological Map of Finland. Pre-Quaternary Rocks.
Geological Survey of Finland.Palko, J.: 1994, ‘Acid Sulphate Soils and Their Agricultural and Environmental Problems in Finland’,
Acta Univ. Ouluensis. Ser. C., Tech. 75, 58 p., 7 original papers.Qvarfort, U.: 1977, Striae 7, 1.Renberg, I., Wik Persson, M. and Emteryd, O.: 1994, Nature 368, 323.Ruhling, A., Brumelis, G., Goltsova, N., Kvietkus, K., Kubin, E., Liiv, S., Magnusson, S., Makinen,
A., Pilegaard, K., Rasmussen, L., Sander, E. and Steinnes, E.: 1992, Atmospheric Heavy MetalDeposition in Northern Europe 1990. Nord 1992:12. Nordic Council of Ministers, 42 p.
Ruskeeniemi, K.: 1988. Mustaliuskeiden metallipitoisuuksista Kaustisen ja Evijarven karttalehtienalueella. [In Finnish]. Geological Survey of Finland, Archived Report M19/2314/88/2/30, 10 p.
Salmi, M.: 1969, Terra 81, 229.Salminen, R.: 1976, J. Geochem. Exploration 5, 406.SFS: 1990, ‘Water Analysis’, Sampling of natural waters for determination of trace metals. SFS 5503
(in Finnish). Finnish Standards Association SFS, Helsinki, Finland, 3 p.Stigliani, W. and Salomons, W.: 1993, New Scientist, 11 Dec. 1993, 38–42.Tanskanen, H.: 1977. Suo 28, 51–52.Tenhola, M.: 1988, Geological Survey of Finland, Report of Investigation 78, 42 p. Espoo.Urban, N. R., Gorham, E., Underwood, J. K., Martin, F. B., Ogden, J. G., III: 1990, Limnology and
Oceanography 45, 1516.Verta, M., Tolonen, K. and Simola, H.: 1989, The Science of Total Environment 87/88, 1.Vuorela, A.: 1993, Fjarranalys och temakartor: GIS-material och tjanster. [In Swedish]. Tidskrift for
romrelatert utdanning, forskning og industri. 4/1993.Wahlstrom, E., Reinikainen, T. and Hallanaro, E.-L.: 1992, Ympariston tila Suomessa. [In Finnish].
Ymparistotietokeskus. Gaudeamus. Forssa.Zajicek, O. T. and Pojasek, R. B.: 1976, Water Resources Research 12(2), 305.